Radar Cross Section Characterization of Quantized Reconfigurable Intelligent Surfaces
We present a radar sensing framework based on a low-complexity, quantized reconfigurable intelligent surface (RIS) that enables programmable manipulation of electromagnetic wavefronts for enhanced detection in non-specular and shadowed regions. We de…
Authors: Kainat Yasmeen, Shobha Sundar Ram, Debidas Kundu
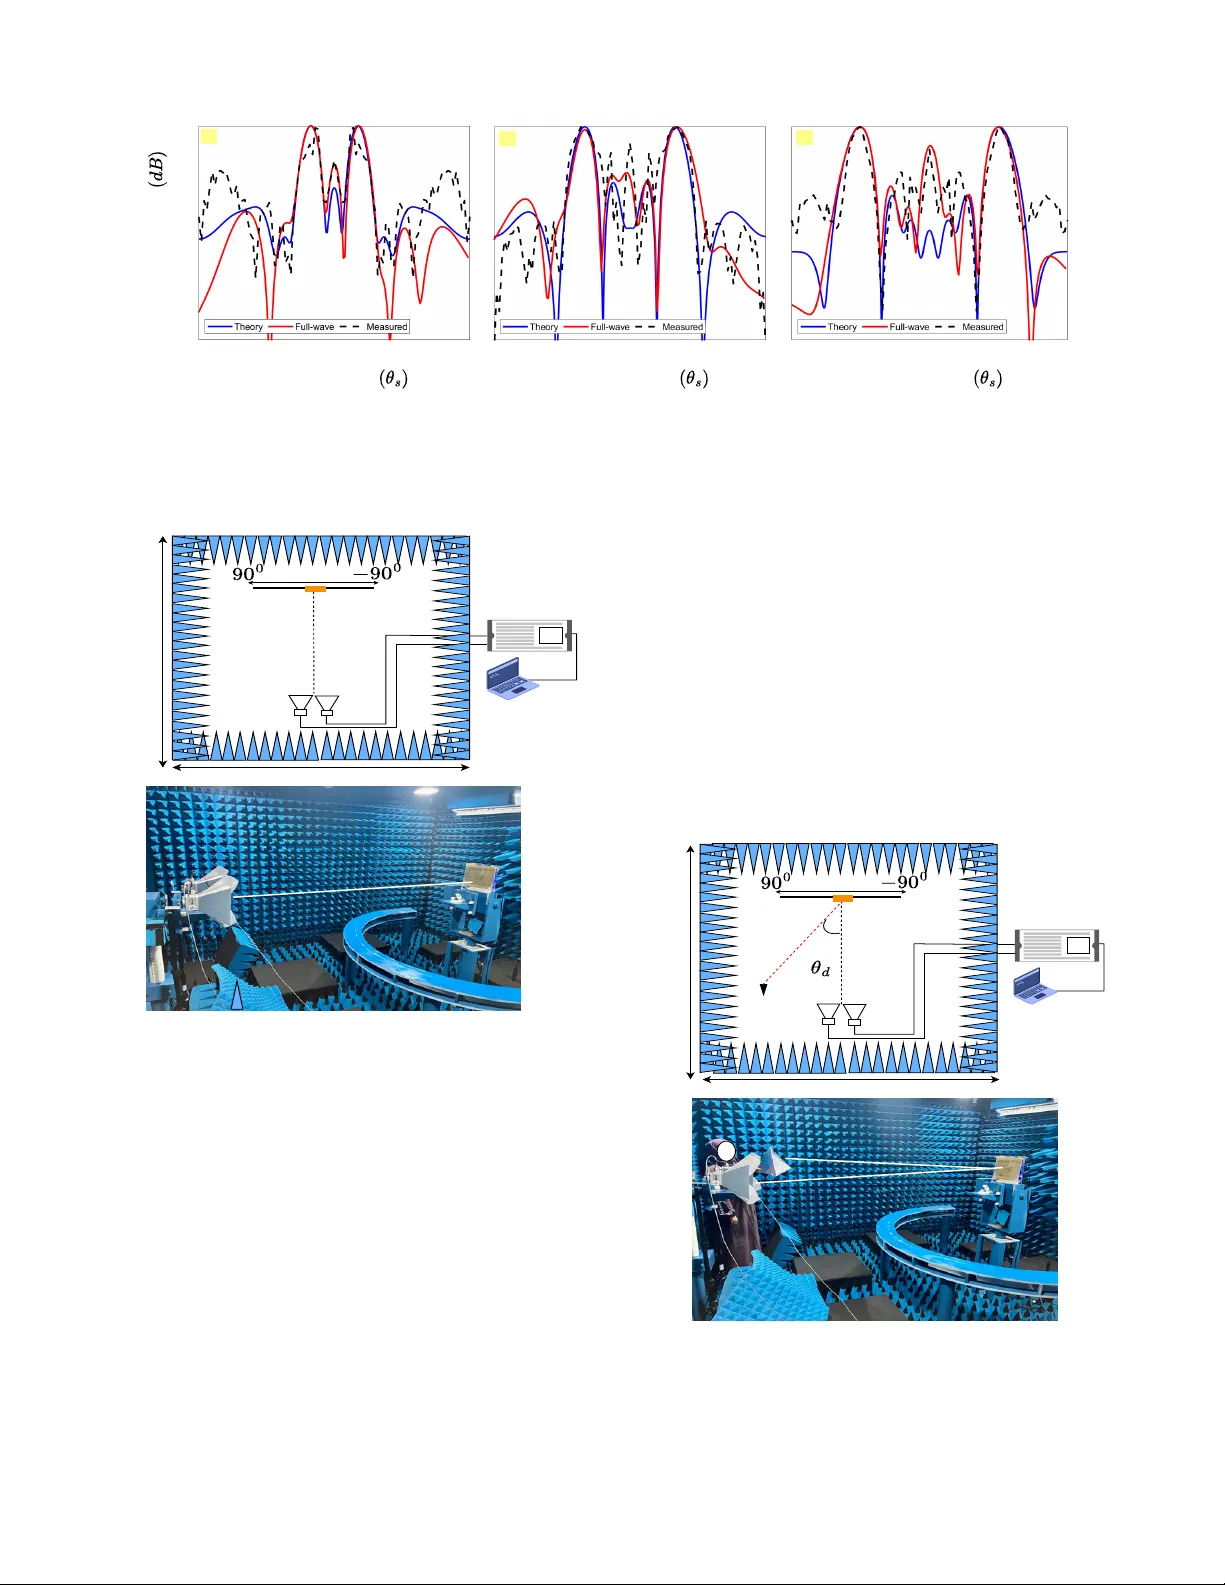
1 Radar Cross Section Characterization of Quantized Reconfigurable Intelligent Surfaces Kainat Y asmeen, Shobha Sundar Ram, Debidas Kundu Abstract —W e present a radar sensing framework based on a low-complexity , quantized reconfigurable intelligent surface (RIS) that enables programmable manipulation of electr omagnetic wav efronts for enhanced detection in non-specular and shadowed regions. W e develop closed-form expressions for the scattered field and radar cross section (RCS) of phase-quantized RIS apertures based on aperture field theory , accurately capturing the effects of quantized phase, periodicity , and grating lobes on radar detection performance. The theory enables us to analyze the RIS’ s RCS along both the forward and backward paths from the radar to the target. The theory is benchmarked against full- wav e electromagnetic simulations incorporating realistic unit-cell amplitude and phase r esponses. T o validate practical feasibility , a [16 × 10] 1-bit RIS operating at 5.5 GHz is fabricated and experimentally characterized inside an anechoic chamber . Measurements of steering angles, beam-squint errors, and peak- to-specular ratios of the RCS patterns exhibit strong agree- ment with analytical and simulated results. Further experiments demonstrate that the RIS can redirect the beam in a non- specular direction and reco ver micro-Doppler signatures that remain undetectable with a conv entional radar deployment. Index T erms —Reconfigurable intelligent surfaces, radar cross- section, non-specular region I . I N T RO D U C T I O N Reconfigurable intelligent surfaces (RIS) have emerged as a powerful approach for programmable control of electromag- netic wav e propagation. By using large arrays of tunable sub- wa velength elements, RIS can control the phase of incoming wa ves and steer the reflected field in desired directions [1]–[3]. While RISs ha ve been widely studied for enhancing wireless communication links [4]–[8], their use in radar and electro- magnetic scattering applications has receiv ed comparati vely limited attention. Radar sensing in cluttered en vironments with obstacles is often challenged by the lack of reliable line-of-sight paths. These challenges become more sev ere at higher operating frequencies, where signal penetration through common building materials is limited, and propagation is dom- inated by surface reflections and multipath effects [9]. Prior work has examined the use of RIS to enable programmable redirection of incident energy tow ard selected spatial regions beyond the radar antenna’ s field of vie w [10]–[15]. Early studies on RIS-enabled radar sensing demonstrated that programmable reflections can enhance tar get illumination and detection in scenarios in volving single [11] and multiple channels [12]. Authors have explored the use of RIS to mitigate multipath effects in indoor localization and moni- toring systems [14], [16], [17]. In [12], [16], [18], [19], the K. Y asmeen and S. S. Ram are with Indraprastha Institute of Information T echnology Delhi (email: kainaty@iiitd.ac.in; shobha@iiitd.ac.in). D. Kundu is with Indian Institute of T echnology Delhi (email: de- bidask@ee.iitd.ac.in). authors focused on idealized continuous-phase RIS models, emphasizing far-field scattering and simplified propagation assumptions without explicitly addressing the characterization of the RIS in the link budget analysis. This limitation was partially addressed in [20], where the authors used equi valence principles to model propagation in RIS-assisted environments. More accurate path-loss models for RIS-assisted wireless links were also in vestigated in [21]. The authors of [8] demonstrated the potential of RIS to create non-line-of-sight sensing paths, thereby enabling detection in shadowed regions. In [22], the authors showed RIS-aided radar detection under various geo- metric configurations, showing significant gains in the signal- to-noise ratios (SNR). While these studies provide valuable theoretical insights, they often overlook practical constraints and hardware lim- itations such as unit-cell non-idealities, quantization ef fects, power loss, and scattering behavior of real RIS. For example, the phase shifts introduced in RIS unit cells are typically coarsely quantized to reduce fabrication cost and complexity [23]. The 1-bit phase-quantized RIS, in particular, is the easiest and cheapest to build and hence is the most commonly studied in the literature [24], [25]. The discontinuous phase profiles from quantized RIS result in reduced aperture gain, and the formation of grating lobes [26], [27]. More recent studies by [28] and [26] proposed phase-error mitigation and grating-lobe suppression strategies for quantized RIS. Despite these advances, experimental validation of RIS in radar scenarios remains limited. Ke y scientific analysis of the enhancement of radar detection performance using a real RIS with phase-quantized unit cells is currently lacking in the literature. Specifically , when RIS is operated in radar scenarios, the signals must undergo two bistatic propagation paths: (1) the forward path from radar to RIS to target and (2) the backward path from target to RIS to radar . Hence, the scattering performance of the RIS, quantified by its bistatic radar cross-section (RCS) along the forward and backward paths, is a critical parameter governing the overall path loss. Prior work has simply assumed that RCS performance along both paths demonstrates angular symmetry . Howe ver , we show that the linear phase gradient on a finite-sized RIS designed to redirect an incident wav e from a specific direction does not completely satisfy the constructi ve interference condition when the illumination direction is reversed. Consequently , the bistatic RCS peak v alues may differ for the forward and backward directions, leading to an angular asymmetry . This effect is further exacerbated by the quantization of unit cells and diffraction from small aperture sizes. The objectiv e of this work is to analyze, quantitatively and qualitati vely , the radar detection performance with a real quantized RIS. The 2 nov el contributions of our work, mapped against prior art, are presented in T able I. W e summarize our contributions belo w: • Using aperture field theory , we deri ve closed-form expres- sions for the scattered field from a two-dimensional RIS, explicitly modeling phase discontinuities arising from quantization that result in grating lobes in the radiation patterns. • W e study the influence of 1-bit, 2-bit, and 3-bit phase quantization on RIS beam steering performance, partic- ularly with respect to the peak-to-specular ratio (PSLR), and the bistatic RCS across the forward (radar to RIS to target) and backward paths (target to RIS to radar). W e highlight an interesting phenomenon: the bistatic RCS peak values of the RIS along the forward and backward paths are, in fact, not identical , and must be individu- ally characterized and factored into the overall path-loss model to carry out accurate link-budget analysis. • W e present a fabricated [16 × 10] 1-bit RIS operating at 5.5 GHz and demonstrate electronically phase-controlled beam steering within an anechoic chamber . The mea- surements show strong agreement with theory and full- wa ve simulations on CST Microw av e Studio. The RIS hardware enables us to study the impact of f abrication parameters such as quantization, lossy elements, and edge diffraction on the bistatic RCS of the RIS, beam-squint performance, and PSLR. • W e demonstrate RIS-enabled detection in non-specular regions by steering the reflected beam tow ard targets located outside the radar’ s main lobe. Specifically , we show that micro-Doppler signatures from moving tar gets outside the radar’ s field of view , previously undetectable without the RIS, become observable in its presence. The remainder of the paper is organized as follows. W e present the scattering field theory and deri ve closed-form bistatic RCS expressions for a phase-quantized RIS in Sec- tion II and study the numerical results in Section III. Sec- tion IV presents the full wa ve simulation results for RIS- enhanced radar detection of targets. Section V describes the experimental setup and measurement results. Section VI con- cludes the paper and outlines directions for future work. Notation: Scalars and vectors are represented by ordinary and bold font, respectiv ely . ˆ x denotes a unit vector with unit magnitude and direction along x axis. θ is defined as the angle between a ray and the positi ve z axis, while ϕ is the angle between the projection of a ray on the xy plane and the positiv e x axis. I I . T H E O RY This work aims to characterize, both qualitatively and quantitativ ely , the enhancement in radar detection performance achiev ed with a quantized RIS. W e have considered a scenario where the radar transmits and recei ves through a beam directed at the RIS, as shown by the solid black arrow in Fig. 1a. The RIS is configured to reflect the incident wa vefront from the radar transmitter toward the target. The scattered echoes from the target are then redirected by the RIS back to the radar receiv er . This is shown by the dashed red arrow . Note that, in this scenario, the target is outside of the mainlobe of the radar and hence there is no direct signal from the radar to the target and back. x Controller z y T arget Radar RIS E E k k E E Fig. 1: RIS-enhanced radar system illustrating non-specular signal steering using RIS. W e consider a two-dimensional (2D) RIS consisting of M × N uniformly spaced unit cells arranged in the xy -plane. Each unit cell has dimensions p x and p y along the x - and y -ax es, respecti vely . W e assume a transverse electric (TE) polarised electromagnetic plane wa ve, E i , incident upon the RIS at elev ation and azimuth angles of ( θ i , ϕ i ) as illustrated in Fig. 1. Therefore, the electric field, E i , and magnetic field, H i , at any ( m, n ) th unit cell element are expressed as - E i = ˆ x E 0 e − j k i · r m,n (1) H i = − E 0 η 0 ( ˆ y cos θ i + ˆ z sin θ i sin ϕ i ) e − j k i · r m,n . (2) Here E 0 is the amplitude of the incident w av e, r m,n is the position vector of the center of the ( m, n ) th unit cell, η 0 is the wa ve impedance of free space, and the incident wa ve prop- agation vector is k i = k 0 ( − sin θ i cos ϕ i ˆ x − sin θ i sin ϕ i ˆ y − cos θ i ˆ z ) where k 0 is the free space wavenumber . The unit cells of an RIS are individually configured so as to direct the surface’ s main lobe tow ards the desired direction ( θ d , ϕ d ) . The reflected electric field, E r and magnetic fields, H r , at the surface are expressed as follows: E r = ˆ x Γ m,n E 0 e − j k r · r m,n (3) H r = Γ m,n E 0 η 0 ( ˆ y cos θ i − ˆ z sin θ i sin ϕ i ) e − j k r · r m,n . (4) Here, Γ m,n is the surface reflection coef ficient at each ( m, n ) th unit cell and k r is the reflected wave v ector . According to Snell’ s law , the reflected wav e vector is gi ven by k r = k 0 ( ˆ k i − 2( ˆ k i · ˆ z ) ˆ z ) , (5) 3 T ABLE I: Comparison of prior work on RIS-enabled sensing and scattering with the proposed work. Reference Continuous Phase Quantization of Phase Far -field Scattering W ave Optics RCS Calculation of RIS Hardwar e Measurements [18] ✓ ✓ ✓ × × × [12] ✓ × ✓ × × × [2] ✓ × ✓ ✓ × × [29] ✓ × × × × × [20] ✓ × ✓ × × ✓ [28] ✓ ✓ ✓ ✓ × × [16] ✓ × × × × × [19] ✓ × × × × × [26] ✓ ✓ ✓ × ✓ × [22] ✓ × × × ✓ ✓ Proposed W ork ✓ ✓ ✓ ✓ ✓ ✓ where ˆ z is the surface normal vector of the RIS unit cell. Based on the field equi valence principles, the surface current density on the RIS element (at z = 0 ) is J m,n = ˆ z × ( H i + H r ) = ˆ x E 0 η 0 cos θ i ( e − j k i · r m,n − Γ m,n e − j k r · r m,n ) . (6) T o calculate the scattered electric field, we integrate the con- tributions of all unit cells ov er the RIS surface. In the far -field region, the scattered electric field from the RIS is expressed in spherical coordinates as E s = ˆ r E s r + ˆ θ E s θ + ˆ ϕE s ϕ . Here, the radial component E s r ≃ 0 due to far-field assumptions while E s θ and E s ϕ at any scattered field direction ( θ s , ϕ s ) are approximated as E s θ ( θ s , ϕ s ) ≃ − j k 0 η 0 e − j k 0 r 4 π r M X m =1 N X n =1 J m,n cos θ s cos ϕ s p x p y e j k s · r m,n (7) E s ϕ ( θ s , ϕ s ) ≃ j k 0 η 0 e − j k 0 r 4 π r M X m =1 N X n =1 J m,n sin ϕ s p x p y e j k s · r m,n (8) where k s is the scattered wav e vector at direction ( θ s , ϕ s ) . A. Quantization of Phase If we assume an infinitely large, perfectly electric conduc- tiv e (PEC), planar surf ace, the reflection coefficient is given by Γ m,n = − 1 for all m, n . Instead of a flat PEC plate, we consider an RIS where each element allows a programmable reflection coefficient, denoted by: Γ m,n = A m,n e j Φ m,n , (9) where A m,n and Φ m,n are the electronically tunable amplitude and phase. These coefficients directly modulate the contribu- tion of each unit cell to the total scattered field. The unit cell phases required to direct the main lobe of the scattered field tow ards a desired direction ( θ d , ϕ d ) can be calculated from the generalized Snell’ s law using Φ m,n = k i · r m,n − k d · r m,n = k 0 h ( mp x sin θ i cos ϕ i + np y sin θ i sin ϕ i ) − ( mp x sin θ d cos ϕ d + np y sin θ d sin ϕ d ) i . (10) Substituting Γ m,n from (9) into the far -field approximation in (7) and (8), the scattered electric field becomes E s θ ( θ s , ϕ s ) ≃ − j k 0 E 0 η 0 e − j k 0 r 4 π r M X m =1 N X n =1 A m,n e j Φ m,n cos θ s cos ϕ s p x p y e j k s · r m,n , (11) E s ϕ ( θ s , ϕ s ) ≃ j k 0 E 0 η 0 e − j k 0 r 4 π r M X m =1 N X n =1 A m,n e j Φ m,n sin ϕ s p x p y e j k s · r m,n , (12) and the magnitude of the scattered field is | E s ( θ s , ϕ s ) | = q | E s θ ( θ s , ϕ s ) | 2 + | E s ϕ ( θ s , ϕ s ) | 2 . (13) In the discussion abov e, we hav e ignored the mutual coupling between the elements and the field dif fraction at the aperture edges. These effects are particularly significant for smaller inter-element spacing and small apertures (when the number of elements in the RIS is small), respectively . The radiation pattern of the scattered fields from the RIS is gov erned by the amplitude and phase of each unit cell’ s reflection coefficient. W e identify the follo wing cases: Case 1: Continuous Amplitude and Phase V ariation In this case, the main lobe of the scattered field can be directed along any direction within the RIS field of view , by tuning A m,n and ϕ m,n to any v alues between (0 , 1] and [0 , 2 π ) , respectively . Case 2: Constant Amplitude and Discrete Phase V aria- tion In hardw are implementations, the amplitude and phase coefficients are quantized, i.e, can only be tuned to a fixed set of values due to fabrication constraints. Most commonly , the amplitudes are identical (e.g., A m,n = 1 ) while the phase shifts are quantized to a finite set of lev els, 2 b , determined by b number of control bits. For a b -bit RIS, the phase error is bounded within ± π 2 b . Therefore, more precise control of the main lobe requires lo wer quantization error and a higher b . Howe ver , implementing higher-bit quantization (e.g., 2-bit or 3-bit) in practical RIS hardware introduces sev eral chal- lenges, including increased circuit complexity , higher power consumption, and the need for precise phase control, which may inv olve multiple PIN diodes or varactor -based tuning networks per unit cell. Additionally , ensuring phase linearity 4 and minimizing insertion loss across quantized states further increases design difficulty . Due to these limitations, 1-bit quantization remains a widely adopted choice in current RIS prototypes, of fering a good trade-off between performance and hardware simplicity . Here, each unit cell can switch between two discrete phase states, with unit amplitude: Φ m,n ∈ { 0 , π } ⇒ Γ m,n ∈ { +1 , − 1 } . (14) A critical challenge in 1-bit quantized RIS is the occurrence of grating lobes in the radiation pattern. T o analyze this phenomenon, we consider the scattered field expression in (13). W e determine the RIS unit cell phase coefficients to direct the main lobe along the desired direction ( θ d , ϕ d ) . Grating lobes occur at ( θ ∗ d , ϕ ∗ d ) when the aperture gain at ( θ ∗ d , ϕ ∗ d ) equals that at ( θ d , ϕ d ) i.e. max { Φ m,n } E s ( θ d , ϕ d ) 2 = | E s ( θ ∗ d , ϕ ∗ d ) 2 s.t. Γ m,n ∈ { +1 , − 1 } , ∀ m, n. (15) Equation (15) holds, provided that the scattered field construc- tiv ely interferes not only at ( θ d , ϕ d ) but also at ( θ ∗ d , ϕ ∗ d ). It can happen if the phase difference across an effecti ve period of the quantized RIS is an integer multiple of 2 π , i.e., ∆Φ xp = ( k 0 sin θ d cos ϕ d − k 0 sin θ i cos ϕ i ) P x = ± 2 π u, (16a) ∆Φ y p = ( k 0 sin θ d sin ϕ d − k 0 sin θ i sin ϕ i ) P y = ± 2 π v. (16b) Here, ∆Φ xp and ∆Φ y p denote the phase dif ferences across the effecti ve periodicities P x and P y , respectively , and u and v are integer numbers. No w , by substituting ( θ d , ϕ d ) with ( θ ∗ d , ϕ ∗ d ), the wavenumber expression ( k = 2 π /λ ) and then rearranging, the beamforming conditions become: sin θ ∗ d cos ϕ ∗ d − sin θ i cos ϕ i = ± uλ P x (17a) sin θ ∗ d sin ϕ ∗ d − sin θ i sin ϕ i = ± v λ P y (17b) W ithout quantization, the ef fectiv e periodicities of the RIS along the two axes are simply the element spacings p x and p y . If p x and p y are less than λ/ 2 , no grating lobes will appear . Howe ver , with 1-bit quantization, the quantized phase distribution results in P x > p x and P y > p y along some stretches of the aperture. As a result, e ven though the original (unquantized) design av oids grating lobes due to effecti ve periodicity less than λ/ 2 , the introduction of 1-bit quantization effecti vely increases the periodicity , which can exceed λ/ 2 . This change leads to the appearance of grating lobes in the radiation pattern. B. Radar Cross Section of RIS In RIS-assisted radar systems, signal propagation occurs in two stages: the forward path (radar transmitter to RIS to target along the solid black arrow in the figure) and the backwar d path (target to RIS to radar receiver along the dashed red arrow in the figure). Here, r 1 and r 2 denote the distances from the RIS to the radar and the target, respecti vely . The unit cells of the passive RIS can be tuned to only one specific combination of A m,n and ϕ m,n at a time. Hence, the same tuning configuration gov erns both the forward and backward paths. Consequently , the design of the RIS phase profile must account for its dual impact on both signal transmission and echo reception, as illustrated in Fig. 1. The RCS along a specified direction ( θ s , ϕ s ) is defined as the ratio of the scattered power along that direction to the incident power along the illumination direction ( θ i , ϕ i ) . For the forwar d path , the RCS of RIS is expressed as σ f ( θ s , ϕ s ; θ i , ϕ i ) = 4 π r 2 2 | E s ( θ s , ϕ s ) | 2 | E i ( θ i , ϕ i ) | 2 , (18) where E s ( θ s , ϕ s ) and E i ( θ i , ϕ i ) denote the magnitudes of the scattered and incident electric fields, respectiv ely . The RCS for the backwar d path is defined as the ratio of the scattered power along the incident direction due to the incident field along the previous scattered direction, gi ven by σ b ( θ i , ϕ i ; θ s , ϕ s ) = 4 π r 2 1 | E ′ s ( θ i , ϕ i ) | 2 | E ′ i ( θ s , ϕ s ) | 2 . (19) Here, the incident field, E ′ i ( θ s , ϕ s ) , emanates from the tar get located at ( θ s , ϕ s ) and falls upon the RIS while the scattered field, E ′ s ( θ i , ϕ i ) , is the resultant field from the RIS falling upon the radar located at ( θ i , ϕ i ) . It is worth noting that for ordinary scatterers operating in linear time inv ariant radar systems, the bistatic RCS satisfies electromagnetic reciprocity - meaning that the bistatic scatter- ing amplitude is symmetric with respect to the interchange of incident and observation directions, leading to σ f ( θ s , ϕ s ; θ i , ϕ i ) = σ b ( θ i , ϕ i ; θ s , ϕ s ) , (20) for identical polarization states. Ho wever , for RIS, the phase condition in (10) may not be satisfied when θ i , ϕ i are in- terchanged with θ d , ϕ d . Despite that, for radar scenarios, the phase condition calculated for the forward path is kept fixed for both the forward and backward paths. The condition is satisfied only in specific scenarios in which both sets of angles are exact ly equal. Further , this angular asymmetry is compounded under quantization and for smaller aperture sizes, which are affected by diffraction. Therefore, for RIS, σ f ( θ s , ϕ s ; θ i , ϕ i ) = σ b ( θ i , ϕ i ; θ s , ϕ s ) , ∀ ( θ i , ϕ i ; θ d , ϕ d ) . (21) C. Link Budget Analysis of RIS-enhanced Radar Consider a monostatic radar with transmit power , P tx , radar antenna gain, G a , and mean noise floor , N 0 , used to detect a target of RCS, σ t , that is not directly within the radar’ s field of view . A finite-aperture RIS is programmed to direct its main lobe towards the target to enhance the detection. Based on the abov e discussion, the SNR at the radar receiv er with RIS enhancement can be ev aluated using the expression giv en by SNR = P tx G 2 a ( θ i .ϕ i ) σ f ( θ s , ϕ s ; θ i , ϕ i ) σ t σ b ( θ i , ϕ i ; θ s , ϕ s ) λ 2 (4 π ) 5 r 4 1 r 4 2 N 0 , (22) 5 based on Frii’ s bistatic radar range equation [30]. Unlike the two-way propagation path encountered by con ventional radar , the incorporation of the RIS introduces a path loss that accounts for both σ f and σ b , and four-way propagation from radar to RIS, to the target, back to RIS, and then to radar . I I I . T H E O R E T I C A L R E S U LT S This section presents the RCS of RIS, focusing on the effects of phase quantization and RIS aperture size. A. Bistatic RCS of RIS Along F orwar d and Backwar d P aths W e consider an RIS consisting of [16 × 10] uniformly spaced unit cells, operating at 5.5 GHz. Each unit cell has dimensions p x = p y = 0 . 016 m. The RIS is assumed to be in the far field of both the radar and the target. The RIS is assumed to be along the xy plane, and the RCS patterns are computed for the y z plane for v arying θ s while ϕ i = ϕ s = 90 ◦ based on the aperture field theory discussed in the previous section. W e derive the RCS patterns for forward and backward paths under two scenarios. In the first scenario, the incident angle is θ i = 0 ◦ and the corresponding results are sho wn in the top ro w of Fig.2. In the second scenario, θ i = − 30 ◦ and the results are shown in the bottom row of Fig.2. For both scenarios, the RIS elements are tuned for the main lobe to be directed along θ d = 45 ◦ . Note that the tuning coefficients will vary with the angle of incidence and the quantization. The results are presented for RIS with unit cells capable of continuous phase shifts and for 1-bit, 2-bit, and 3-bit quantizations. For each case, the forward RCS ( σ f ) is depicted using a solid blue curve, and the backward RCS ( σ b ) is illustrated by a dashed red curve. The results in Fig.2a show that when θ i = 0 ◦ , the main lobe of the RCS pattern (solid blue curv e) peaks at 45 ◦ , which is the exact desired angle to which the unit cells were tuned. The corresponding RCS value at this angle is 8.5 dBsm with a PSLR of 21.2 dB. In the backward-scattering case (red dotted curve), the backscattered wa ve from a target is incident upon the RIS at 45 ◦ . Note that the unit cells are already tuned for the forward case. As a result, the main lobe of the dashed red curve peaks at the desired angle of 0 ◦ . Howe ver , σ b for θ i = 45 ◦ , θ d = 0 ◦ is -0.1 dBsm, which is much lo wer than σ f for θ i = 0 ◦ , θ d = 45 ◦ due to weak constructiv e interference and readjustment in the sidelobe pattern. Next, we consider the effect of discrete phase quantization on RIS beamforming in Fig.2b-d. The results show that the forward bistatic RCS pattern of the b = 3 -bit-quantized RIS in Fig.2b most closely resembles that of the continuous RIS in Fig.2a. Howe ver , as we lower b , the quantization error increases, leading to the emergence of grating lobes. This is most prominent for the 1-bit quantized RIS in Fig.2d where, e ven though the main lobe peaks at 45 ◦ , there is a grating lobe at − 45 ◦ (consistent with the dual beam pattern discussed in [15]). In each of these quantization cases, the main lobe of the backward RCS peaks at 0 ◦ . Ho wev er, the peak σ b nev er matches the peak σ f . Similarly , there is a decrease in the PSLR for the lower bit -quantization. Next, we consider the second scenario where the forward wa vefront from the radar is incident upon the RIS at an oblique incidence angle of θ i = − 30 ◦ in the bottom ro w of Fig.2. Again, the unit cells are tuned such that the main lobe of the reflected pattern peaks at θ d = 45 ◦ . For the continuous phase control of the unit cells, the σ f pattern again peaks at the desired angle of 45 ◦ in Fig.2e. Howe ver , the σ f for θ i = − 30 ◦ , θ d = 45 ◦ is 1.4 dBsm which is significantly lower than the σ f for θ i = 0 ◦ , θ d = 45 ◦ which was shown in Fig.2a. The backward RCS pattern for θ i = 45 ◦ shows a peak at − 30 ◦ with σ b equal to -0.1 dBsm. Next, we present the σ f and σ b patterns for 3-bit, 2-bit, and 1-bit quantized units tuned for the same θ i = − 30 ◦ and θ d = 45 ◦ in Fig.2f-h. The results again show that the 3-bit quantized RIS demonstrates the closest similarity with the unquantized RIS in Fig.2f, while the 1-bit RIS shows a significantly lower σ f peak than the remaining three cases. T able II presents the peaks of σ f and σ b patterns for unit cells tuned for different combinations of θ i and θ d and for different phase quantization levels. The results show that σ f = σ b only when the θ i = θ d = 0 ◦ (first row of the table). This is because of the angular symmetry in the phase-gradient equation in (10), which results in mirror- like RCS patterns. Interestingly , in this case, quantization T ABLE II: Bistatic RCS { σ f , σ b } for different quantizations for [16 × 10] RIS. θ i θ d Cont. 3-bit 2-bit 1-bit σ f σ b σ f σ b σ f σ b σ f σ b 0 ◦ 0 ◦ 8.5 8.5 8.5 8.5 8.5 8.5 8.5 8.5 0 ◦ 15 ◦ 8.5 2.9 8.2 2.7 7.5 2.3 4.9 4.7 0 ◦ 30 ◦ 8.5 1.4 8.2 1.4 7.6 0.9 4.0 3.3 0 ◦ 45 ◦ 8.5 -0.1 8.3 -0.5 7.5 -1.4 3.5 1.8 − 30 ◦ 0 ◦ 1.4 8.5 1.4 8.2 1.2 6.0 4.0 4.6 − 30 ◦ 15 ◦ 1.4 2.9 1.1 2.6 0.9 1.1 -1.0 -1.1 − 30 ◦ 30 ◦ 1.4 1.4 1.4 1.4 0.9 1.2 -0.8 -0.8 − 30 ◦ 45 ◦ 1.4 -0.1 0.9 -0.1 -0.2 0.1 -7.6 -6.9 does not degrade the RIS’ s performance. When we consider phase continuity scenarios (first column), the σ f remains fixed for specific θ i regardless of the choice of θ d . Howe ver , when we introduce quantization to the unit cells, we observe that the σ f varies with θ d ev en for a fixed θ i . Even more significant variation in the σ f is observed as we lower the quantization le vels, b , with the greatest de gradation in RCS for 1-bit RIS and the least degradation for 3-bit RIS because of the phase errors introduced in (10). The results also clearly demonstrate that σ f is not equal to σ b for most situations. This is because of the RIS’ s finite aperture size and the complex interference patterns that result from rev ersing the directions of illumination and reflection. The coarse quantization of the unit cells results in further mismatch in the RCS values. Therefore, both forward and backward RCS patterns must be independently estimated/measured to conduct the ov erall link budget analysis of an RIS-enhanced radar system. Also, the { σ f , σ b } for ( θ i = 0 ◦ ; θ d = 30 ◦ ) is equal to { σ b , σ f } for ( θ i = − 30 ◦ ; θ d = 0 ◦ ) for unquantized RIS and 3-bit quantized 6 -50 -40 10 -30 0 -20 -10 (i) Continuous 10 0 -20 -10 (e) (f) (g) (h) (iv) 1-bit (iii) 2-bit (c) (d) -30 -50 -40 -90 0 -45 45 90 Scattered angle 0 -45 45 -90 90 Scattered angle 90 -90 0 -45 45 Scattered angle -90 90 0 -45 45 Scattered angle (ii) 3-bit (a) (b) Fig. 2: RCS (dBsm) of the RIS in the ϕ s = 90 ◦ plane for forward and backward scattering. The columns represent phase quantization lev els: (i) continuous, (ii) 3-bit, (iii) 2-bit, and (iv) 1-bit. The first row (a-d) corresponds to ( θ i = 0 ◦ , θ d = 45 ◦ ) while the second row (e-h) corresponds to ( θ i = − 30 ◦ , θ d = 45 ◦ ). RIS. For lower-bit quantization, constructiv e interference is weaker in the backward direction, resulting in lower peak RCS values and modified sidelobe patterns. T ABLE III: Peak-to-Specular Lobe Ratio (PSLR (dB)) for different RIS quantizations along forward (F) and backward (B) paths for ( θ i = 0 ◦ ; θ d ) . θ d Continuous 3-bit 2-bit 1-bit F B F B F B F B 15 ◦ 15.6 11.2 15.1 10.9 20.2 7.1 8.6 13.5 30 ◦ 18.1 14.1 18.5 10.8 13.2 4.7 14.2 16.1 45 ◦ 21.2 16.1 20.2 15.8 20.1 12.3 14.5 18.9 T able III quantifies the PSLR for different RIS quantiza- tions. Here, the peak RCS is obtained at θ s = θ d , while the RCS at the specular angle is obtained from θ s = θ i . Hence, the PSLR is distinct from the peak-to-sidelobe ratio metric used in conv entional array processing. In the continuous case, each element provides an ideal phase response, enabling precise wa vefront shaping and constructive interference in the desired direction while ef fectiv ely suppressing sidelobes. This results in consistently high PSLR v alues in both forward and backward scattering. When phase quantization is introduced, discrete phase states result in phase errors relative to the ideal continuous distribution as discussed in Section IIA. The signal from the main lobe is redistributed into sidelobes, thereby degrading the PSLR. For the 1-bit RIS, the forward PSLR is significantly lower than in the continuous case. The results highlight a fundamental trade-off between hardware complexity and RIS performance. While lo w-bit RIS designs reduce implementation cost and po wer consumption, they in- troduce significant phase quantization errors that limit specular suppression capability . The 1-bit RIS produces grating lobes, resulting in a lo wer PSLR. In the backward direction, since the illumination angle is not normal to the RIS plane, grating lobes are not produced, resulting in a relati vely higher PSLR. B. Effect of Apertur e Size of RIS Next, we consider the effect of RIS aperture size on σ f and σ b . W e again consider an RIS aligned along the xy plane at 5.5 GHz and compute the RCS from the patterns generated for the ϕ s = 90 ◦ plane. T able IV presents the peak σ f and σ b for dif ferent combinations of ( θ i ; θ d ) for a 1-bit RIS. For θ i = 0 ◦ and θ d = 0 ◦ , σ f = σ b for all aperture sizes, indicating symmetric scattering. Further, σ f and σ b increase significantly with aperture size, consistent with array theory in (11) and (12). As noted previously , both σ f and σ b vary when θ d is changed for a fix ed aperture size. Howe ver , an RIS with a lar ge aperture (for e.g the [32 × 10] RIS) still has high σ f and σ b ev en for unfav orable combinations of θ i and θ d . Under oblique incidence ( θ i = − 30 ◦ ), the asymmetry between forward and backward scattering becomes more pronounced. Overall, a smaller RIS aperture yields lower RCS values for both σ f and σ b , especially at high θ d . C. SNR P erformance with F our-W ay RIS Pr opagation W e consider a monostatic radar operating at 5.5 GHz with transmit power P tx = 1 mW and antenna gain G a = 12 dBi. These parameters are chosen to be consistent with the exper- imental setup discussed in the follo wing section. The tar get radar cross section is fixed at σ t = 1 dBsm. Receiv er noise is modeled as N 0 = − 105 dBm (based on the experimental apparatus used in the following section). The RIS is located between the radar and target with distances r 1 = 3 m and r 2 = 3 m, respectively , as sho wn in the figure. The RIS unit cells are tuned to steer its mainlobe toward the tar get direction, 7 T ABLE IV: Bistatic 1-bit RCS { σ f , σ b } for dif ferent RIS sizes. θ i θ d [8 × 10] [16 × 10] [32 × 10] σ f σ b σ f σ b σ f σ b 0 ◦ 0 ◦ 2.4 2.4 8.5 8.5 14.5 14.5 0 ◦ 15 ◦ -0.5 -0.9 4.9 4.7 10.5 10.1 0 ◦ 30 ◦ -0.7 -2.0 4.0 3.3 10.7 9.5 0 ◦ 45 ◦ -0.8 -4.1 3.5 1.8 10.7 7.6 − 30 ◦ 0 ◦ -2.0 -0.7 4.0 4.6 9.5 10.7 − 30 ◦ 15 ◦ -5.0 -4.0 -1.0 -1.1 3.8 4.7 − 30 ◦ 30 ◦ -5.4 -5.4 -0.8 -0.8 4.2 4.2 − 30 ◦ 45 ◦ -8.6 -10.4 -7.6 -6.9 0.8 -0.8 θ d , for incidence angle θ i = 0 ◦ , and its scattering beha vior is characterized by forward and backward RCS σ f ( θ d ; θ i ) and σ b ( θ i ; θ d ) as discussed in T able IV. W e calculate the (b) (c) (d) (a) 45 15 0 30 Desired angle 45 Desired angle 15 0 30 30 20 10 0 40 SNR 30 20 10 0 40 SNR Fig. 3: SNR performance for RIS with (a) continuous, (b) 3-bit, (c) 2-bit, and (d) 1-bit phase quantization at θ i = 0 ◦ for v arying RIS sizes. SNR for the RIS-enhanced radar scenarios using (22), and the results are presented in Fig. 3 for dif ferent aperture sizes and phase quantization lev els of the unit cells. As anticipated, the SNR is highest for the 32-element RIS, followed by the 16- and 8-element RISs, across all quantization cases. This behavior is attrib uted to the larger effecti ve aperture, which enhances the reflected signal power . Additionally , the SNR declines as θ d increases, since steering the beam toward larger angles reduces the ef fectiv e σ in the target direction. W e also observe from Fig. 3a and Fig. 3b that the 3-bit is very close to continuous SNR v alues. Howe ver , coarse phase resolution introduces grating lobes and degrades the RCS pattern, leading to a significant decrease in SNR. I V . F U L L W A V E S I M U L A T I O N The theoretical analysis presented in the previous sections neglects important electromagnetic aspects of RIS perfor - mance, including mutual coupling between unit cells and diffraction at the edges of the RIS aperture. In this section, we consider full-wa ve electromagnetic simulations of the radar detection performance enhanced by an RIS using CST Mi- crow ave Studio’ s time-domain solver . W e consider a 2 m × 1.6 m two-dimensional simulation space, along the y z plane as shown in Fig.4, with a monostatic radar’ s horn antenna located at (0 . 3 , 1 . 6) m with a 3-dB beamwidth of 28 . 9 ◦ , directed tow ards the − z axis. Radar (b) RIS 0m 0m 2m A T arget Positions 1.6m Radar 0.3m 0m 2m 0.3m Steerable beam (a) C B Fig. 4: Simulation setup for radar system (a) without RIS and (b)with RIS. W e consider a two-dimensional RIS in the xy plane with identical 16 mm × 16 mm unit cells tuned for a center fre- quency of 5.5 GHz. The unit cell design is described in detail in the following section. The RIS is centered at (0 , 0 . 3 , 0) m. The unit cells of the RIS are tuned for specific combinations of incident and desired angles of reflection ( θ i ; θ d ). The full-wav e solver models the RIS’ s realistic performance, accounting for mutual coupling between unit cells, diffraction at the edges, and dielectric and ohmic losses within the unit cells. The complex vector electric-field distribution is extracted from the software ov er the beam-steering yz plane ( x -polarized), and sampled at a 10 mm × 10 mm spatial grid. T o compare the performance enhancement introduced by the RIS, the electric field is simulated in its absence. Figure 5 shows the electric-field magnitude distribution o ver the simulation domain. In the absence of the RIS, as seen in Fig. 5(a), the total electric field is primarily dominated by the direct radiation from the horn antenna, resulting in a relativ ely smooth field distribution with spatial focusing based on the beamwidth of the horn antenna and its sidelobe level of - 25.6 dB. Next, we consider three independent scenarios with RIS aperture sizes: [8 × 10] , [16 × 10] , and [32 × 10] along y and x axes, in Figs 5(b)-(d), respectiv ely . In each case, the RIS is tuned for ( θ i = 0 ◦ ; θ d = 45 ◦ ) . The introduction of the RIS alters the electric field distribution in regions previously outside the radar antenna’ s field of vie w , as shown in the figures. W e observe a strong electric field in regions specifically along the θ d . The interference between the incident field from the horn and the scattered field from the RIS results in fading patterns in the total field distribution. The beamwidth and strength of the scattered signals vary based on RIS aperture size, as is seen in the figures. W e consider a radar target modeled as a single isotropic point scatterer . The point tar get is located at y = 1 m, and along 50 different positions spanning sets: { A } , { B } , and { C } , spaced 30 mm apart along the z axis, as shown in Fig. 4. All 8 0 -20 -10 -30 -50 -40 -60 0 -20 -10 -30 -50 -40 -60 0 0.5 1 1.5 0 0.5 1 1.5 0.5 1 1.5 0.5 1 1.5 (a) (b) (c) (d) Fig. 5: Magnitude of electric-field over the 2 × 1 . 6 m 2 simulation domain for radar system (a) without RIS, and with (b) [8 × 10] , (c) [16 × 10] , and (d) [32 × 10] unit-cell RIS tuned for ( θ i = 0 ◦ ; θ d = 45 ◦ ). the target points between z = 1 . 0 m and z = 1 . 6 m belong to set { A } , all the points between z = 0 . 6 m and z = 1 m belong to set { B } , and all the remaining tar get positions belong to set { C } . In total, there are 15, 17, and 18 target positions that belong to sets { A } , { B } , and { C } , respecti vely . For each target position belonging to sets { A } , { B } , or { C } , the electric field distribution is simulated for RIS configured for θ d = 45 ◦ , 30 ◦ , 15 ◦ respectiv ely , while θ i = 0 ◦ for all three cases. In other words, we assume that the RIS is tuned to direct the mainlobe along one of the three θ d values nearest the target point. At each position, the electric-field magnitude at the nearest grid coordinate is sampled directly from the full- wa ve simulated field. The electric field v alues are subsequently used to compute the SNR at the radar as per (22), assuming the target RCS is 1 m 2 , and the noise is fix ed at 0 dBm. The target is assumed to be detected when the SNR is abov e 1 dB. In the absence of an RIS, the system detects the target at only one of 50 positions, indicating v ery limited sensing capability of the target outside the mainlobe of the radar antenna (assuming the radar’ s antenna is not capable of scanning). The detection performances of the different RIS aperture sizes: [8 × 10] (blue bar graph), [16 × 10] (brown bar graph), and [32 × 10] (green bar graph), are compared in Fig. 6. The figure shows the number of successful detections per set for each θ d corresponding to { 15 ◦ , 30 ◦ , 45 ◦ } . W e observe that as the RIS size increases, the number of detections per desired angle also increases. With a [32 × 10] RIS aperture size, the target is detected in a total of 41 of the 50 total positions by using programmable beam steering of the RIS across the three angles of θ d , while we detect the target 37 out of 50 positions with 16 × 10 , and 21 out of 50 positions with 8 × 10 RIS aperture sizes, respectively . These results highlight that despite the limitations of quantization, mutual coupling, diffraction, and bi-directional path loss metrics introduced by a finite-sized realistic lossy RIS, there is a substantial increase in the overall Fig. 6: Detection performance for different RIS sizes ( [8 × 10] , [16 × 10] , and [32 × 10] ) under varying θ d . detection metrics of a target using RIS-enhanced radar . V . M E A S U R E M E N T S This section presents experiments conducted with a hard- ware prototype of a [16 × 10] 1-bit-quantized RIS to assess its performance in enhancing radar detection. All experiments are carried out in a 4 m × 4 m anechoic chamber, which provides a reflection-free, electromagnetically isolated environment to ensure accurate and reproducible measurements. W e measure both σ f and σ b to quantify their reflective behavior as a function of ( θ i ; θ d ). These measurements also provide the beam-squint error and PSLR. Finally , we electronically adjust the RIS phase configuration to direct radar signals tow ard targets outside the radar’ s mainlobe and capture their reflected signals to quantify detection performance. A. Hardwar e Pr ototype of 1-bit RIS The fabricated RIS panel is sho wn in Fig. 7, with front and back vie ws depicted in Figs. 7a and 7b, respectively . The RIS array consists of [16 × 10] identical unit cells, arranged in a periodic pattern along the length and width, respectively . Each unit cell is designed as a single metasurface element capable of realizing both the 0 and 1 states of a 1-bit coding metasurface. Digital switching between these two states is achiev ed through the integration of a PIN diode within each unit cell, as illustrated in Fig. 7. Each unit cell comprises three metal layers that sandwich two dielectric layers. The top metal layer is a wide dipole loaded with a PIN diode. The middle metal layer serves as the ground, and the bottom metal layer is used for bias lines. The two dielectric layers hav e thicknesses of 1.6 mm and 0.8 mm, respectiv ely , and are fabricated from FR4 ( ϵ r = 4.3 and a loss tangent of 0.02). The ov erall dimensions of each unit cell are 16 mm × 16 mm. When a forward-bias voltage of 0.9 V is applied, the diode conducts and forms a low-impedance path ( ON state), thereby modifying the surface current distrib ution and resulting in a re- flection phase. When no bias (i.e., 0 V) is applied ( OFF state), the diode exhibits a high impedance and behaves as a small capacitance, yielding a different reflection phase. A zoomed-in view in the inset of Fig. 7 illustrates the PIN diode connection, 9 Unit Cell (a) Front Surface (b) Back Surface 256 mm 160 mm PIN Diode Bias Line Radial stub for RF choking Pins to control board 16 mm 16 mm (c) (d) Fig. 7: Fabricated 1-bit [16 × 10] RIS operating at 5.5 GHz: (a) Front view showing periodic array of unit cells, (b) Back view illustrating biasing and control lines. Zoomed view of the unit cell (c) Front view and (d) Back view . biasing lines, and radial stubs used for radio frequency and direct current (DC) isolation. The DC bias lines are connected to the PIN diodes through vias, allo wing a control unit to selectiv ely switch some cells ON and others OFF , thereby dynamically reconfiguring the metasurface’ s reflection pattern. The full-wav e simulated and measured magnitude and phase of the reflection coefficient of the unit cell are presented in Fig.8. W e observe that the fabricated metasurface exhibits a wide fractional bandwidth of 18.51% centered at 5.5 GHz, where the phase dif ference remains within 180 ◦ ± 20 ◦ . The simulated and measured reflection loss at 5.5 GHz are below 1.0 dB and 2.3 dB, respectiv ely . 200 (a) (b) Frequency(GHz) Frequency(GHz) Reflection Mag (dB) Reflection Phase (deg) 4.5 6.5 5 5.5 6 100 0 -100 -200 4.5 6.5 5 5.5 6 0 -3 -6 -9 -15 -12 Fig. 8: Reflection coefficient of unit cell: (a) Magnitude response and (b) Phase response. B. RCS P attern Measur ement 1) Experimental Setup: Our first set of experiments mea- sures the scattering pattern of RIS using the setup shown in Fig. 9. Here, a custom-made V iv aldi antenna is used as a transmitting (Tx) antenna and connected to the first port of a Keysight E5063A vector network analyzer (VN A). The details of the V iv aldi antenna are provided in Appendix A. A receiving horn antenna (Rx), LB-8180-SF , operates at a frequency of 5.5 GHz with a gain of 10.7 dB and 45 . 9 ◦ beamwidth, and is connected to the VN A ’ s second port. Each antenna is positioned so that it lies entirely outside the main lobe of the other antenna. The fabricated RIS, described previously , is placed before both antennas, as shown in the figure, at distances of 1.3 m and 1.8 m from the V iv aldi and horn antennas, respectiv ely . Transmission parameters, S 21 , are measured using the VN A. Since the anechoic chamber absorbs all multipath from the walls and floors, the primary signal at the receiver antenna is the direct signal reflected by the RIS. The VN A is configured to operate at a center frequency of 4m 4m Rx Tx RIS VNA Computer 1.8m (a) (b) 4m Rx RIS Tx 1.8m 1.3m Fig. 9: (a) T op view of the scattering pattern measurement setup inside an anechoic chamber for the 1-bit [16 × 10] RIS for ( θ i = 0 ◦ ; θ d ). (b) Photograph of the experimental setup. 5.5 GHz, intermediate-frequency bandwidth of 1 kHz, and a frequency sweep of 1601 points from 5495 MHz to 5505 MHz, i.e., a 10 MHz bandwidth. The transmitted power le vel is set to the maximum av ailable output of 0 dBm. The experiments are performed with the transmitting antenna directed perpen- dicular to the RIS surface ( θ i = 0 ◦ ), where the gain of the transmitting antenna is maximum. T ypically , the main lobe of the scattered signal from a regular metal plane will be along the specular angle with respect to the incident wav e. Howe ver , an RIS can be configured to direct the mainlobe at a non- specular , desired angle of reflection θ d . T o study the scattering pattern from the RIS, we fixed the RIS with the transmitting antenna on a motorized turntable, remotely controlled via a computer in a dedicated control room adjacent to the chamber , as sho wn in 9a. The measurement ensures that the incident angle, θ i = 0 ◦ , remains fixed as the turntable rotates, but the RCS pattern is captured for v arying scattered angle, θ s . The control computer synchronizes the transmit and receiv e antennas through cables routed externally from the chamber and controls the RIS’ s rotation via the turntable motor . The turntable rotates with a step size of 1 . 8 ◦ from − 90 ◦ to 90 ◦ 10 as shown in Fig. 9a. W e conduct experiments for three RIS configurations: θ d = { 15 ◦ , 30 ◦ , 45 ◦ } . 2) Results: The measured scattering patterns for θ i = 0 ◦ are presented in Fig. 10. The normalized measurement results (dotted black lines) are compared with the scattering patterns obtained using the theory presented in the section.II (solid blue lines) and from simulations using the full-wa ve solver in Section.IV (solid red lines). In Fig.10a, the RIS is configured for θ d = 15 ◦ . The theoretical, simulation, and measured results show the main lobe at 15 ◦ . Due to the one-bit quantization, we observe an additional grating lobe at -15 ◦ . W e observe similar results when the RIS is tuned for θ d = 30 ◦ and θ d = 45 ◦ for the same incident angle in Fig.10b and c. The theoretical results accurately reflect the RIS’ s aperture response. T o quantify the performance, we present the beam squint error , | θ ′ d − θ d | , between the desired beam direction ( θ d ) and the actual main lobe beam position estimated from the theoret- ical, simulated, and measured beam patterns in the figure ( θ ′ d ) in T able.V. The theoretical and simulated results agree well, T ABLE V: Beam squint errors for a 1-bit [16 × 10] RIS at ( θ i = 0 ◦ ; θ d ) , based on theory , simulations, and measurements. θ d ( ◦ ) Theory Simulation Measurement θ ′ d ( ◦ ) Error θ ′ d ( ◦ ) Error θ ′ d ( ◦ ) Error 15 15.3 0.3 15.1 0.1 17.5 2.5 30 29.6 0.4 30.1 0.1 31 1 45 44.7 0.3 44.8 0.2 46 1 with angular discrepancies of no more than 0 . 4 ◦ , indicating that the analytical model accurately predicts the RIS response under ideal conditions. In contrast, the measured results show larger deviations, particularly at smaller steering angles. For instance, at θ d = 15 ◦ , the measured beam is observed at 17 . 5 ◦ , resulting in a 2 . 5 ◦ offset, whereas the theoretical and simulated errors are only 0 . 3 ◦ and 0 . 1 ◦ , respectiv ely . The deviation decreases at lar ger steering angles, with measured errors of approximately 1 ◦ for 30 ◦ and 45 ◦ targets. The observed errors in the measured angles indicate that the practical RIS introduces additional errors not captured by the theoretical or simulated models. These differences are mainly due to the calibration errors in the measurement setup. Nevertheless, the overall beam-steering beha vior remains consistent among theory , simulation, and experiment, confirming the proper operation of the 1-bit RIS. The second metric is PSLR, which, in this case, is measured for specular reflection angle at 0 ◦ . The PSLR for all three cases is summarized in T able VI. The results indicate that the RIS can successfully direct the strongest reflection beam to the desired angle rather than the specular reflection angle. The theoretical PSLR is abo ve the simulated and measured T ABLE VI: PSLR (dB) for a 1-bit [16 × 10] RIS at ( θ i = 0 ◦ , θ d ), based on theory , simulations, and measurements. θ d ( ◦ ) Theory (dB) Simulations (dB) Measurements (dB) 15 8.6 5.4 4.8 30 14.2 6.4 2.3 45 14.5 2.6 2.3 values. The relati vely small degradation in the measured PSLR demonstrates good agreement with predictions and effecti ve suppression of the specular reflection at small steering angles. Larger discrepancies are observed at higher steering angles arising from phase-quantization errors inherent to the 1-bit RIS, as well as increased sensitivity of the ON and OFF state reflection magnitude and phase values to fabrication tolerances and finite-aperture effects. C. Radar Cross-Section of RIS 1) Experimental setup: In our second experiment, we configure the two antennas and the VN A as a monostatic narrowband radar as shown in Fig. 11a. Here, the transmitting and receiving antennas are in proximity while the RIS is at a distance of 1.8 m before them in the far -field, as shown in Fig. 11b . The VNA is operated at 5.5 GHz with a 1 kHz bandwidth and is set to transmit at 0 dBm. W e used HF907 horn antennas, operated at 5.5 GHz, with a gain of 10 dBi. Based on the measured S 21 , the RCS of RIS is calculated using Friis’ s radar equation [31]. 2) Results: T able VII presents a quantitative comparison of RCS v alues in dBsm obtained from theory , full-wav e simulations, and measurements. For all cases, the incident angle is fix ed at θ i = 0 ◦ , while θ d is v aried. When θ d = 0 ◦ , the theory predicts an RCS of 8.5 dBsm, whereas the full-wav e simulation yields a lo wer v alue of 4.8 dBsm, resulting in a difference of 3.7 dB. The measured RCS is significantly lower at –2.5 dBsm, corresponding to deviations of 11.0 dB and 7.3 dB from the theoretical and simulated results, respectiv ely . This large discrepancy can be attrib uted to idealized assump- tions in the theoretical model (e.g., no edge ef fects, lossless dielectrics and conductors, and perfect phase control). Losses, edge effect, and mutual coupling are captured in simulation but not in theory , while additional factors, such as fabrication tolerances, surface roughness, and calibration errors, affect the measurement results. For higher angles of θ d , the theoretical RCS is closer to the simulated and measurement values. These discrepancies indicate that the theoretical model tends to o verestimate the beam-steering degradation at larger reflection angles, whereas simulations and measurements capture additional scattering contributions and edge dif fraction ef fects that partially enhance the RCS. T ABLE VII: Monostatic RCS of 1-bit [16 × 10] RIS from theory , simulation, and measurement. θ i ( ◦ ) θ d ( ◦ ) Theory (dB) simulation (dB) Measured (dB) 0 0 8.5 4.8 -2.5 0 15 -3.5 -4.0 -6.6 0 30 -9.5 -5.7 -6.6 0 45 -9.6 -5.7 -7.1 For the lar gest reflection angle, θ d = 45 ◦ , the theoretical RCS is –9.6 dBsm and the simulated v alue remains at –5.7 dBsm, yielding a dif ference of 3.9 dB. The measured RCS further decreases to –7.1 dBsm, which is 2.5 dB lower than the simulated result and 2.5 dB higher than the theoretical prediction. This is due to increased phase errors, stronger edge 11 -90 90 0 -45 45 Scattered angle -90 90 0 -45 45 Scattered angle -90 90 0 -45 45 Scattered angle 0 -30 -10 -20 Scattered field (a) (b) (c) Fig. 10: Normalized radiation pattern obtained from theory , full-wave simulation, and measurement for θ d at (a) 15 ◦ , (b) 30 ◦ , and (c) 45 ◦ . 4m 4m RIS VNA Computer Rx Tx 1.8m Rx RIS 1.8m (a) (b) Tx Fig. 11: (a) T op view of the RCS measurement setup inside an anechoic chamber for the 1-bit [16 × 10] RIS for ( θ i = 0 ◦ ; θ d ); (b) Photograph of the experimental setup. diffraction, and reduced effecti ve aperture at large steering an- gles, which are not fully captured by the simplified theoretical model but are accounted for in full-wav e simulations and ex- perimental observ ations. Overall, the comparison demonstrates consistent trends across theory , simulation, and measurement: increasing θ d reduces RCS. The remaining quantitative differ - ences are primarily due to idealized theoretical assumptions, numerical approximations in simulations, and unav oidable nonidealities in fabrication and measurement setups. D. Micr o-Dopplers of Humans in Non-specular Re gions 1) Experimental Setup: In the third experiment, the setup comprises a monostatic radar system, an RIS, and a human subject holding a 36 cm × 30 cm (base × height) trihedral corner reflector serving as the radar target. The monostatic radar is configured with the two horn antennas and VNA as described in the previous experiment, and illustrated in Fig. 12a. The human is located 2.2 m from the RIS and positioned outside of the main lobe of the radar antennas as shown in Fig. 12b . Further, the human swings the corner reflector with one hand, generating micro-Doppler returns. The radar and the RIS are separated by 1.8 m. The objective of the experiment is to assess the effecti veness of the RIS in enhancing the radar micro-Doppler signatures of human mov ements. Rx RIS VNA Computer Tx T arget 4m 2.2m 1.8m T arget 2.2m 1.8m Tx RIS Rx 4m (a) (b) Fig. 12: (a) T op-view of the RIS-enhanced radar system using a corner reflector inside an anechoic chamber for ( θ i = 0 ◦ , θ d ). (b) Photograph of the experimental setup. The experiments are performed for two scenarios. In the first scenario, the experiments are conducted with the radar 12 and the target in the absence of the RIS. The experiments are then repeated in the presence of the RIS. Note that all other parameters, such as the radar parameters, position of the target with respect to the radar , and orientation of the radar antennas, are not changed across both experiments. The receiv ed radar signal is further processed to generate a joint time-frequency spectrogram by applying the short-time Fourier transform (STFT) to the receiv ed signal s ( t ) as shown in STFT ( t, f ) = Z s ( τ ) h ( t − τ ) e − j 2 πf τ dτ , (23) where h ( t ) is the window function with a duration of 0.1 seconds. 2) Results: Figure 13 illustrates the spectrograms of the receiv ed radar signal under different measurement scenarios. The first row corresponds to the configuration without RIS, while the second row sho ws the RIS-assisted measurements. Each column, labeled (i)–(iii), represents a dif ferent config- uration of RIS corresponding to θ d = 15 ◦ , 30 ◦ , and 45 ◦ , respectiv ely , with the θ i = 0 ◦ . In the top row , without RIS, all spectrograms show no distinct micro-Doppler components. The absence of micro-Doppler is because the human is entirely outside the mainlobe of the radar antenna and, for practical purposes, in visible to the radar due to the lo w SNR. In contrast, in the second row , micro-Doppler signatures are obtained in all cases and highlighted in the spectrograms. Here, we can clearly discern the Doppler returns from the motion of the trihedral reflector . The Doppler returns are positiv e when the hand moves to wards the radar and negati ve when it mov es away from the radar . Note that we do not observe the Doppler returns from the second hand, which does not hold the trihedral reflector , due to weak returns. Also, the returns from torso, head, and legs fall at zero Doppler and are removed through DC filtering. The Doppler values of the human motion vary in value for different θ d due to the changes in bistatic radial ve- locity . Overall, the results demonstrate that the RIS effecti vely manipulates electromagnetic-wav e propagation, enabling the detection of human motion using hand micro-Doppler signals. V I . C O N C L U S I O N A N D F U T U R E S C O P E This w ork has studied the feasibility and ef fectiv e- ness of employing a lo w-complexity , programmable, quan- tized RIS for radar target sensing via beam steering. W e present a comprehensive analysis that combines aperture-field theory ,full-wav e electromagnetic simulations, and measure- ments to characterize the RCS of quantized RIS architectures. Our analysis sho ws two important insights re garding using RIS for enhancing radar: 1) both the forward and backward RCS must be considered in the two-way path loss model of RIS- enhanced radar , and 2) these two v alues are not equal for all combinations of ( θ i ; θ d ) . Further , we demonstrate that coarse phase resolution deteriorates the RCS values and overall SNR, while a lar ger RCS aperture size enhances the bistatic RCS and SNR. A low complexity 1-bit [16 × 10] RIS is fabricated and tested in an anechoic chamber . Our results show that 1-bit RIS shows a considerable reduction in RCS along θ d due to grating lobes at − θ d . Despite these limitations, the simulation and experimental results demonstrate that the 1-bit RIS enhanced the ov erall radar detection metrics in non-specular regions. The findings underscore the potential of programmable metasurfaces as scalable, energy-efficient, and cost-ef fectiv e enhancements for next-generation intelligent radar systems. While the aperture-field theory dev eloped in this work accu- rately captures the dominant scattering behavior of quantized RIS, it does not yet incorporate mutual coupling between adja- cent unit cells or other non-ideal hardware effects. Extending the model to include coupling, near-field interactions, and dynamic sensing scenarios represents a promising direction for future research. R E F E R E N C E S [1] ¨ O. ¨ Ozdogan, E. Bj ¨ ornson, and E. G. Larsson, “Intelligent reflecting surfaces: Physics, propagation, and pathloss modeling, ” IEEE W ireless Communications Letters , vol. 9, no. 5, pp. 581–585, 2019. [2] Y . Liu and C. D. Sarris, “Efficient computation of scattered fields from reconfigurable intelligent surfaces for propagation modeling, ” IEEE T ransactions on Antennas and Pr opagation , vol. 72, no. 2, pp. 1817– 1826, 2024. [3] H. Y u, P . Li, J. Su, Z. Li, S. Xu, and F . Y ang, “Reconfigurable bidirectional beam-steering aperture with transmitarray , reflectarray , and transmit-reflect-array modes switching, ” IEEE T ransactions on Antennas and Pr opagation , vol. 71, no. 1, pp. 581–595, 2022. [4] C. Huang, A. Zappone, G. C. Alexandropoulos, M. Debbah, and C. Y uen, “Reconfigurable intelligent surfaces for energy efficienc y in wireless communication, ” IEEE T ransactions on W ireless Communica- tions , vol. 18, no. 8, pp. 4157–4170, 2019. [5] M. Deng, M. Ahmed, A. W ahid, A. A. Soofi, W . U. Khan, F . Xu, M. Asif, and Z. Han, “Reconfigurable intelligent surfaces enabled vehicular communications: A comprehensive survey of recent advances and future challenges, ” IEEE T ransactions on Intelligent V ehicles , pp. 1– 28, 2024. [6] Q. Wu, S. Zhang, B. Zheng, C. Y ou, and R. Zhang, “Intelligent reflecting surface-aided wireless communications: A tutorial, ” IEEE Tr ansactions on Communications , vol. 69, no. 5, pp. 3313–3351, 2021. [7] M. A. ElMossallamy , H. Zhang, L. Song, K. G. Seddik, Z. Han, and G. Y . Li, “Reconfigurable intelligent surfaces for wireless communica- tions: Principles, challenges, and opportunities, ” IEEE T ransactions on Cognitive Communications and Networking , vol. 6, no. 3, pp. 990–1002, 2020. [8] Y . Liu, X. Liu, X. Mu, T . Hou, J. Xu, M. Di Renzo, and N. Al-Dhahir , “Reconfigurable intelligent surfaces: Principles and opportunities, ” IEEE Communications Surveys & T utorials , vol. 23, no. 3, pp. 1546–1577, 2021. [9] S. V ishwakarma, A. Rafiq, and S. S. Ram, “Micro-doppler signatures of dynamic humans from around the corner radar , ” in 2020 IEEE International Radar Conference (RADAR) , pp. 169–174, IEEE, 2020. [10] D. Dardari, N. Decarli, A. Guerra, and F . Guidi, “Los/nlos near- field localization with a large reconfigurable intelligent surface, ” IEEE T ransactions on W ireless Communications , vol. 21, no. 6, pp. 4282– 4294, 2021. [11] S. Buzzi, E. Grossi, M. Lops, and L. V enturino, “Radar target detection aided by reconfigurable intelligent surfaces, ” IEEE Signal Pr ocessing Letters , vol. 28, pp. 1315–1319, 2021. [12] S. Buzzi, E. Grossi, M. Lops, and L. V enturino, “Foundations of mimo radar detection aided by reconfigurable intelligent surfaces, ” IEEE T ransactions on Signal Processing , vol. 70, pp. 1749–1763, 2022. [13] M. Rihan, E. Grossi, L. V enturino, and S. Buzzi, “Spatial diversity in radar detection via acti ve reconfigurable intelligent surfaces, ” IEEE Signal Pr ocessing Letters , vol. 29, pp. 1242–1246, 2022. [14] M. Mercuri, E. Arnieri, R. De Marco, P . V eltri, F . Crupi, and L. Boccia, “Reconfigurable intelligent surface-aided indoor radar monitoring: A feasibility study , ” IEEE Journal of Electr omagnetics, RF and Mi- cr owaves in Medicine and Biology , 2023. [15] K. Y asmeen, D. K undu, and S. S. Ram, “ Around-the-corner radar sensing using reconfigurable intelligent surface, ” in 2024 IEEE Micr owaves, Antennas, and Pr opagation Conference (MAPCON) , pp. 1–4, IEEE, 2024. 13 1 2 Time(sec) 0 3 Frequency(Hz) 0 1 2 Time(sec) 0 3 1 2 Time(sec) 0 3 Frequency(Hz) 200 -200 0 -80 -85 -90 -95 -100 -80 -85 -90 -95 -100 micro Doppler micro Doppler micro Doppler 200 -200 micro Doppler (a) (b) (i) (ii) (iii) Fig. 13: Doppler spectrograms generated from measurement data at 5.5 GHz for θ i = 0 ◦ . (a) The top ro w presents results without RIS, while (b) the bottom row presents results with RIS for θ d equal to (i) 15 ◦ , (ii) 30 ◦ , and (iii) 45 ◦ . [16] G. Zhang, D. Zhang, Y . He, J. Chen, F . Zhou, and Y . Chen, “Multi-person passiv e wifi indoor localization with intelligent reflecting surface, ” IEEE T ransactions on W ireless Communications , vol. 22, no. 10, pp. 6534– 6546, 2023. [17] H. W ymeersch, J. He, B. Denis, A. Clemente, and M. Juntti, “Ra- dio localization and mapping with reconfigurable intelligent surfaces: Challenges, opportunities, and research directions, ” IEEE V ehicular T echnology Magazine , vol. 15, no. 4, pp. 52–61, 2020. [18] A. Aubry , A. De Maio, and M. Rosamilia, “Reconfigurable intelligent surfaces for n-los radar surveillance, ” IEEE T ransactions on V ehicular T echnology , vol. 70, no. 10, pp. 10735–10749, 2021. [19] Z. Chen, J. T ang, L. Huang, Z.-Q. He, K.-K. W ong, and J. W ang, “Robust target positioning for reconfigurable intelligent surface assisted mimo radar systems, ” IEEE T ransactions on V ehicular T echnology , vol. 72, no. 11, pp. 15098–15102, 2023. [20] Y . Liu, Z. Liu, S. V . Hum, and C. D. Sarris, “ An equiv alence principle- based hybrid method for propagation modeling in radio environments with reconfigurable intelligent surfaces, ” IEEE T ransactions on Antennas and Pr opagation , vol. 72, no. 7, pp. 5961–5973, 2024. [21] W . T ang, M. Z. Chen, X. Chen, J. Y . Dai, Y . Han, M. Di Renzo, Y . Zeng, S. Jin, Q. Cheng, and T . J. Cui, “W ireless communications with reconfigurable intelligent surface: Path loss modeling and experimental measurement, ” IEEE T ransactions on W ir eless Communications , vol. 20, no. 1, pp. 421–439, 2020. [22] Z. W ang, L. T an, H. Y in, K. W ang, X. Pei, and D. Gesbert, “ A receiv ed power model for reconfigurable intelligent surface and measurement- based validations, ” in 2021 IEEE 22nd International W orkshop on Signal Pr ocessing Advances in W ireless Communications (SP A WC) , pp. 561– 565, IEEE, 2021. [23] D. K. Sahoo, C. Chakraborty , D. Kundu, A. Patnaik, A. Chakraborty , et al. , “ A 1-bit coding reconfigurable metasurface reflector for millimeter wav e communications in e-band, ” in 2023 IEEE Micr owaves, Antennas, and Pr opagation Conference (MAPCON) , pp. 1–4, IEEE, 2023. [24] M. Jian, G. C. Alexandropoulos, E. Basar , C. Huang, R. Liu, Y . Liu, and C. Y uen, “Reconfigurable intelligent surfaces for wireless communi- cations: Overvie w of hardware designs, channel models, and estimation techniques, ” Intelligent and Con ver ged Networks , vol. 3, no. 1, pp. 1–32, 2022. [25] E. Basar, G. C. Alexandropoulos, Y . Liu, Q. W u, S. Jin, C. Y uen, O. A. Dobre, and R. Schober, “Reconfigurable intelligent surfaces for 6g: Emerging hardware architectures, applications, and open challenges, ” IEEE V ehicular T echnology Magazine , 2024. [26] M. Khalil, K. W ang, J. Lin, and J. Choi, “Mitigating phase errors to improve signal quality in ris-assisted satellite communications, ” IEEE T ransactions on V ehicular T echnology , 2025. [27] K. Singh, M. U. Afzal, M. Ko vale va, and K. P . Esselle, “Controlling the most significant grating lobes in two-dimensional beam-steering systems with phase-gradient metasurfaces, ” IEEE T ransactions on Antennas and Pr opagation , vol. 68, no. 3, pp. 1389–1401, 2019. [28] S. S. Narayanan, U. K. Khankhoje, and R. K. Ganti, “Optimum beam- forming and grating lobe mitigation for intelligent reflecting surfaces, ” IEEE T ransactions on Antennas and Propa gation , 2024. [29] Z. Xie, L. Wu, J. Zhu, M. Lops, X. Huang, and M. B. Shankar, “Ris-aided radar for target detection: Clutter region analysis and joint activ e-passive design, ” IEEE T ransactions on Signal Processing , vol. 72, pp. 1706–1723, 2024. [30] N. J. Willis, Bistatic radar , vol. 2. SciT ech Publishing, 2005. [31] C. A. Balanis, Balanis’ Advanced Engineering Electr omagnetics . John W iley & Sons, 2024. A P P E N D I X In this appendix, we discuss the V iv aldi antenna in detail. A custom-made V iv aldi antenna is designed and fabricated for use as a transmitter, with the following two advantages in mind. First, the arm attached to the turntable for mounting the transmitting antenna cannot withstand the load of the heavy broadband horn antenna (used in other experiments) during multiple rotations. Therefore, we found it is safe and easier to use the V iv aldi antenna, which is planar and lightweight. Second, as the transmitter rotates in front of the receiving antenna, the V iv aldi antenna provides less feed blockage. The transmitter is placed 1.3 m away from the RIS, to ensure far- field/planar propagation conditions. The top and bottom views of the V iv aldi antenna are shown in Fig. 14. The figure illustrates the geometry of the V i valdi antenna, including its tapered slot structure and feeding network. The slot profile is defined using exponential tapering to ensure a smooth transition from the feed gap g 14 (a) (b) Fig. 14: Photograph of the custom-made V iv aldi antenna used as transmitter for the measurement of the scattering field pattern of the RIS inside the anechoic chamber . (a) top view , (b) backside vie w . to the slot width W s . The inner edges ( E s 1 , E s 2 ) and outer edges ( E t 1 , E t 2 ) are symmetrically described by e xponential functions using equations 24 and 25, providing a gradual impedance transformation along the length of the structure. This tapering minimizes reflections and supports broadband operation. The indicated dimensions represent the key design parameters gov erning the slot expansion and feeding mecha- nism. E s 1 /E s 2 = ± 1 2 W s − g ∗ exp ln W s g ∗ x L s , for 0 ≤ x ≤ L s (24) E t 1 /E t 2 = ± 1 2 W s + g ∗ exp ln W − W s g ∗ x L s , for 0 ≤ x ≤ L (25) It is designed on a Rogers RO4350B substrate with ε r = 3 . 66 , tan δ = 0 . 0037 , and thickness h = 1.524 mm. The design parameters, indicated in the figure, in millimeters are W = 95 , L = 110 , W s = 40 , L s = 60 , g = 0 . 9 , R m = 3 . 5 , R s = 4 , L b = 5 . 8 , L b 1 = 25 , L f 1 = 5 . 5 , L f 2 = 12 , L f 3 = 19 . 2 , W m 50 = 3 . 33 , W m 100 = 0 . 83 , and L c = 2 . From the full- wa ve simulation and measurement results, sho wn in Fig.15, the antenna’ s operating bandwidth is 4 – 8 . 5 GHz. The simulated Fig. 15: Simulated and measured reflection coefficient ( S 11 in dB) of the V iv aldi antenna. and measured radiation patterns of the V iv aldi antenna at 5.5 GHz for both the xz - and y z -planes are shown in Fig. 16. It can be observed that the radiation patterns in both the xz - and y z -planes are quite symmetric. Moreover , in the xz -plane, the cross-pol lev el and side lobe lev el (SLL) are 17 . 08 dB and (a) (b) Fig. 16: Simulated and measured normalized radiation patterns of the V iv aldi antenna at 5.5 GHz in (a) xz -plane and (b) y z plane. 10 . 35 dB below the main lobe maximum lev el, respectiv ely . In the y z -plane, the corresponding cross-pol lev el and SLL are 23 . 03 dB and 10 . 41 dB below the main lobe maxima, respectiv ely . Therefore, the designed V iv aldi antenna is used as a transmitter to measure the RIS scattering patterns.
Original Paper
Loading high-quality paper...
Comments & Academic Discussion
Loading comments...
Leave a Comment