Persistence diagrams of random matrices via Morse theory: universality and a new spectral diagnostic
We prove that the persistence diagram of the sublevel set filtration of the quadratic form f(x) = x^T M x restricted to the unit sphere S^{n-1} is analytically determined by the eigenvalues of the symmetric matrix M. By Morse theory, the diagram has …
Authors: Matthew Loftus
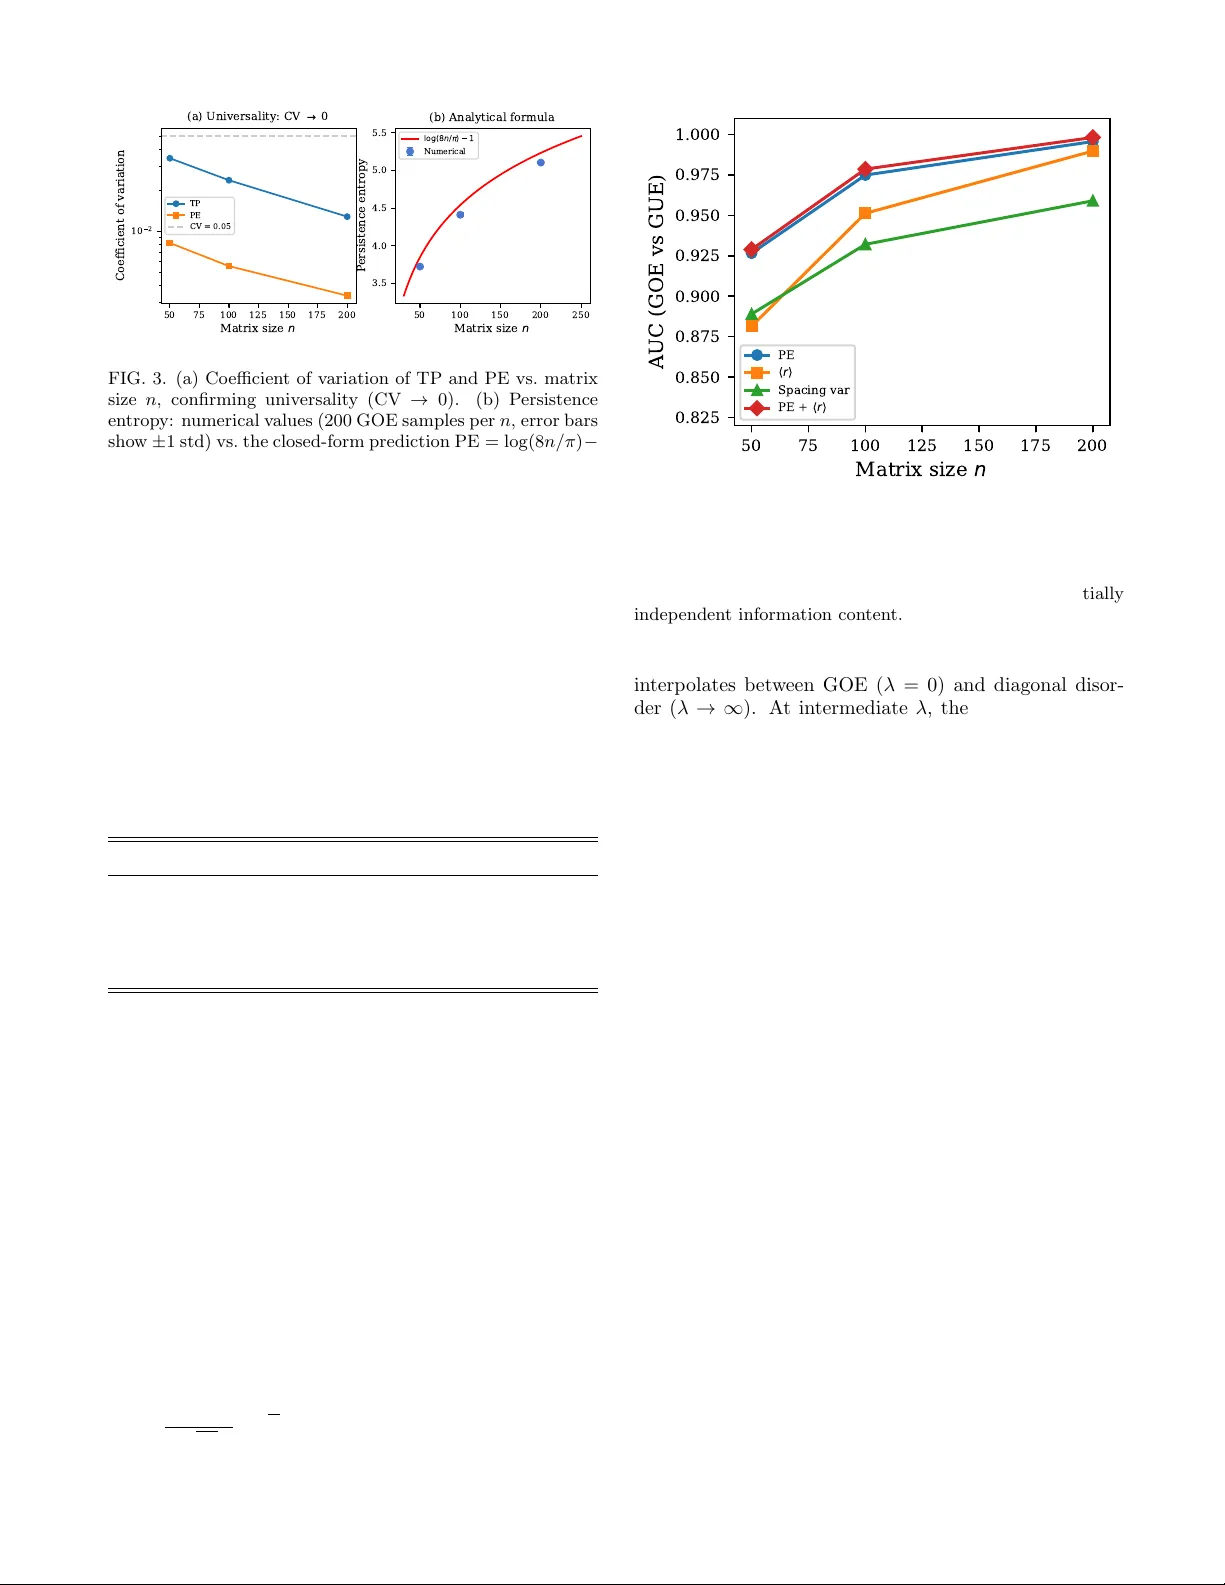
P ersistence diagrams of random matrices via Morse theory: univ ersalit y and a new sp ectral diagnostic Matthew Loftus 1 1 Ce dar L o op LLC, Washington, USA (Dated: Marc h 31, 2026) W e pro v e that the p ersistence diagram of the sublevel set filtration of the quadratic form f ( x ) = x ⊤ M x restricted to the unit sphere S n − 1 is analytically determined b y the eigen v alues of the symmetric matrix M . By Morse theory , the diagram has exactly n − 1 finite bars, with the k -th bar living in homological dimension k − 1 and having length equal to the k -th eigenv alue spacing s k = λ k +1 − λ k . This iden tification transfers random matrix theory (RMT) universalit y to persistence diagram univ ersalit y: for matrices dra wn from the Gaussian Orthogonal Ensem ble (GOE), w e deriv e the closed-form persistence entrop y PE = log(8 n/π ) − 1, and v erify n umerically that the coefficient of v ariation of p ersistence statistics deca ys as n − 0 . 6 . Differen t random matrix ensem bles (GOE, GUE, Wishart) produce distinct univ ersal persistence diagrams, pro viding topological fingerprints of RMT univ ersality classes. As a practical consequence, we show that p ersistence en tropy outp erforms the standard level spacing ratio ⟨ r ⟩ for discriminating GOE from GUE matrices (A UC 0.978 vs. 0.952 at n = 100, non-o verlapping b ootstrap 95% CIs), and detects global sp ectral perturbations in the Rosenzw eig–Porter model to whic h ⟨ r ⟩ is blind. These results establish p ersistence en tropy as a new sp ectral diagnostic that captures complementary information to existing RMT to ols. I. INTR ODUCTION Random matrix theory (RMT) [1, 2] and top ological data analysis (TDA) [3, 4] are t wo of the most suc- cessful mathematical frameworks for extracting univer- sal structure from complex data. RMT rev eals that eigen v alue distributions of large random matrices are univ ersal—dep ending only on symmetry class (real, com- plex, quaternionic) rather than on the sp ecific distribu- tion of matrix entries [5, 6]. TD A, through p ersistent homology [7, 8], captures top ological features of data that p ersist across scales, producing persistence diagrams (PDs) that are stable under p erturbations [9]. Despite their broad applicability , these tw o frameworks ha ve largely developed indep endently . Recent w ork has b egun to explore univ ersality in random persistence dia- grams [10, 11], and connections betw een spectral theory and p ersisten t homology hav e b een studied for Lapla- cian eigenfunctions on surfaces [12]. How ev er, the most natural bridge b etw een RMT and TDA—through Morse theory applied to the quadratic form asso ciated with a random matrix—app ears to ha v e b een ov erlo ok ed. In this pap er, we mak e this connection explicit. F or an y real symmetric n × n matrix M with eigen v alues λ 1 ≤ · · · ≤ λ n , the quadratic form f ( x ) = x ⊤ M x re- stricted to S n − 1 is a Morse function whose critical points are the eigenv ectors of M and whose critical v alues are its eigen v alues [13]. W e show that the p ersistence diagram of the sublevel set filtration f − 1 ( −∞ , c ] has a remark- ably simple structure: exactly n − 1 finite bars, with bar lengths equal to the eigen v alue spacings. This iden tifica- tion is exact and requires no discretization of the sphere. Since eigenv alue spacings are universal in the large- n limit (Wigner semicircle for GOE [5], Marc henko–P astur for Wishart [14]), the p ersistence diagram is also univ er- sal. W e deriv e a closed-form expression for the exp ected p ersistence entrop y of GOE matrices, PE GOE = log 8 n π − 1 , (1) and verify it numerically to 2.5% accuracy at n = 200 with monotonically decreasing error. Bey ond the theoretical result, we demonstrate a prac- tical consequence: p ersistence entrop y outp erforms the standard level spacing ratio ⟨ r ⟩ [16] for discriminating b e- t ween GOE and GUE matrices, and detects global sp ec- tral perturbations in the Rosenzweig–P orter mo del [17] that ⟨ r ⟩ cannot detect. These findings establish p er- sistence entrop y as a complemen tary sp ectral diagnostic that captures the glob al shap e of the spacing distribution, rather than just lo cal correlations b et w een consecutive lev els. I I. MA THEMA TICAL FRAMEW ORK A. Morse theory of quadratic forms on spheres Let M b e a real symmetric n × n matrix with dis- tinct eigenv alues λ 1 < λ 2 < · · · < λ n and corresp ond- ing orthonormal eigen vectors e 1 , . . . , e n . Consider the quadratic form f ( x ) = x ⊤ M x = n X i =1 λ i x 2 i , (2) where x i = x · e i , restricted to the unit sphere S n − 1 = { x ∈ R n : | x | = 1 } . The function f is smo oth on S n − 1 , and its criti- cal points are determined b y the Lagrange condition ∇ f = 2 M x = 2 λ x for some m ultiplier λ —that is, x must b e an eigenv ector of M . Since eigen v alues are distinct, f 2 is a Morse function with exactly 2 n critical p oints ± e i , and the critical v alue at ± e i is λ i . The Hessian of f | S n − 1 at the critical p oint e i , restricted to the tangent space T e i S n − 1 , has eigenv alues 2( λ j − λ i ) for j = i . The Morse index—the n umber of negative Hessian eigenv alues—is therefore i − 1. B. Sublev el set topology and persistence diagram By Morse theory [13], the top ology of the sublev el set f − 1 ( −∞ , c ] = { x ∈ S n − 1 : x ⊤ M x ≤ c } (3) c hanges only when c passes through a critical v alue λ k . Bet ween consecutiv e critical v alues, the sublev el set has a fixed homotop y t yp e. Theorem 1. F or λ k < c < λ k +1 (with the c onven- tion λ 0 = −∞ ), the sublevel set f − 1 ( −∞ , c ] is homotopy e quivalent to S k − 1 for k ≥ 1 , and empty for k = 0 . Pr o of. A t c slightly abov e λ k , the sublev el set contains all points x ∈ S n − 1 with P i λ i x 2 i ≤ c . Since λ j ≥ λ k +1 > c for j > k , the co ordinates x k +1 , . . . , x n m ust b e small. The sublev el set deformation retracts on to the set { ( x 1 , . . . , x k , 0 , . . . , 0) : P k i =1 x 2 i = 1 } ∼ = S k − 1 . F ormally , passing through λ k attac hes tw o cells of dimension k − 1 (corresp onding to ± e k ). By induc- tion on k and the standard handle-attac hmen t analy- sis [13], the sublevel set transitions through the sequence ∅ → S 0 → S 1 → · · · → S n − 1 . Theorem 2 (P ersistence diagram structure) . The p er- sistenc e diagr am of the sublevel set filtr ation of f on S n − 1 has: 1. Exactly n − 1 finite b ars: the k -th b ar has birth λ k , de ath λ k +1 , and lives in homolo gic al dimension H k − 1 , for k = 1 , . . . , n − 1 . 2. Bar length s k = λ k +1 − λ k (the k -th eigenvalue sp acing). 3. Two infinite b ars: [ λ 1 , ∞ ) in H 0 and [ λ n , ∞ ) in H n − 1 . 4. T otal p ersistenc e TP = P n − 1 k =1 s k = λ n − λ 1 . Pr o of. The Betti num bers of S k − 1 are β 0 = 1 (or 2 for k = 1), β k − 1 = 1, and 0 otherwise. As c increases through λ k , the sublev el set transitions from S k − 2 to S k − 1 : the homology class in dimension k − 2 dies and a new class in dimension k − 1 is b orn. This pro duces one finite bar [ λ k , λ k +1 ) in H k − 1 . The total p ersistence telescop es: TP = P s k = λ n − λ 1 . Remark 3. The or em 2 r e quir es eigenvalues to b e dis- tinct, which holds almost sur ely for GOE, GUE, and Wishart ensembles. F or matric es with de gener ate eigen- values, f is a Morse–Bott function and the p ersistenc e diagr am has b ars of zer o length at the de gener ate values. The universal r esults b elow apply to ensembles wher e de- gener acies have pr ob ability zer o. C. P ersistence statistics Giv en the bar lengths s 1 , . . . , s n − 1 , we define: T otal p ersistenc e: TP = n − 1 X k =1 s k = λ n − λ 1 . (4) Persistenc e entr opy: PE = − n − 1 X k =1 s k TP log s k TP . (5) Normalize d maximum b ar: µ = max k s k TP . (6) By Theorem 2, these are deterministic functions of the eigen v alue spacings. The persistence entrop y PE is the Shannon en tropy of the normalized spacing distribution p k = s k / TP, and measures how uniformly the total p er- sistence is distributed across bars. I II. ANAL YTICAL RESUL TS A. P ersistence statistics from eigenv alue densit y F or a random matrix ensemble with limiting eigen v alue densit y ρ ( λ ) supp orted on [ λ − , λ + ], the k -th eigenv alue satisfies λ k ≈ γ k where γ k is the k / ( n + 1)-quantile of ρ . The corresp onding spacing is s k ≈ 1 / ( nρ ( γ k )). Prop osition 4. In the lar ge- n limit, the exp e cte d p ersis- tenc e entr opy of an ensemble with density ρ on [ λ − , λ + ] is PE = log( n · TP) + 1 TP Z λ + λ − log ρ ( λ ) dλ + o (1) , (7) wher e TP = λ + − λ − . Pr o of. W riting p k = s k / TP ≈ 1 / ( n · TP · ρ ( γ k )), w e ha ve PE = − X k p k log p k ≈ − n Z ρ ( λ ) · 1 n · TP · ρ ( λ ) · log 1 n · TP · ρ ( λ ) dλ = 1 TP Z λ + λ − [log( n · TP) + log ρ ( λ )] dλ = log( n · TP) + 1 TP Z λ + λ − log ρ ( λ ) dλ. (8) 3 B. Closed form for GOE F or the Gaussian Orthogonal Ensem ble with M = ( A + A ⊤ ) / √ 2 n where A ij ∼ N (0 , 1), the limiting eigenv alue densit y is the Wigner semicircle [5] ρ SC ( λ ) = √ 4 − λ 2 2 π , λ ∈ [ − 2 , 2] . (9) The supp ort width gives TP → 4. W e compute the k ey integral: Z 2 − 2 log ρ SC ( λ ) dλ = Z 2 − 2 1 2 log(4 − λ 2 ) − log(2 π ) dλ = 1 2 (16 log 2 − 8) − 4 log(2 π ) = 4 log 2 π − 1 , (10) where we used the substitution λ = 2 sin θ and the stan- dard result R π / 2 0 cos θ log cos θ dθ = log 2 − 1. Through- out, log denotes the natural logarithm. Substituting into Eq. (7): PE GOE = log(4 n ) + 1 4 · 4 log 2 π − 1 = log(4 n ) + log 2 π − 1 = log 8 n π − 1 . (11) C. Closed form for Wishart F or the Wishart ensem ble W = X ⊤ X/p with X ∈ R p × n ha ving i.i.d. N (0 , 1) en tries and aspect ratio γ = n/p < 1, the Marchenk o–P astur law [14] gives densit y ρ MP ( λ ) = p ( λ + − λ )( λ − λ − ) 2 π γ λ (12) on [ λ − , λ + ] = [(1 − √ γ ) 2 , (1 + √ γ ) 2 ]. The total p ersis- tence is TP Wishart = 4 √ γ . (13) The p ersistence entrop y follows from Eq. (7) with the Marc henko–P astur density; the integral R log ρ MP dλ m ust b e ev aluated numerically . IV. NUMERICAL VERIFICA TION A. Univ ersality within GOE W e generated 200 indep enden t GOE matrices at each of n = 50 , 100 , 200. F or each matrix, we computed eigen- v alues, constructed the p ersistence diagram via Theo- rem 2, and ev aluated p ersistence statistics. T able I rep orts the coefficient of v ariation (CV = std/mean) of each statistic across 200 samples. T o- tal p ersistence and p ersistence entrop y sho w CV w ell b elo w 0.05 at n = 200, confirming univ ersality . The 2 1 0 1 2 E i g e n v a l u e 0.0 0.2 0.4 0.6 0.8 1.0 Empirical CDF Semicircle CDF FIG. 1. Eigenv alue empirical CDF for 200 indep endent GOE(100) matrices (blue), ov erlaid with the Wigner semi- circle CDF (black). The near-p erfect collapse demonstrates eigen v alue universalit y , which by Theorem 2 implies p ersis- tence diagram universalit y . 0.0 0.5 1.0 1.5 2.0 2.5 3.0 3.5 U n f o l d e d s p a c i n g s 0.0 0.2 0.4 0.6 0.8 Density GOE GUE W ishart = 1 = 2 FIG. 2. Unfolded bulk spacing distributions (cen tral 80% of eigen v alues) for GOE, GUE, and Wishart ensembles ( n = 100, 200 samples each). Histograms matc h the Wigner surmise: p 1 ( s ) = ( π / 2) s exp( − πs 2 / 4) for β = 1 (GOE, Wishart) and p 2 ( s ) = (32 /π 2 ) s 2 exp( − 4 s 2 /π ) for β = 2 (GUE). Since bar lengths equal eigenv alue spacings, these are also the universal bar length distributions of the p ersistence diagrams. CV scaling follows p ow er la ws CV (TP) ∼ n − 0 . 62 and CV(PE) ∼ n − 0 . 65 , consistent with T racy–Widom fluctu- ations for the sp ectral range and cen tral limit b ehavior for the en tropy . The maxim um bar statistic µ has CV ≈ 0 . 27 indep en- den t of n —exp ected since the maxim um spacing is an 4 extreme-v alue statistic go v erned by T racy–Widom fluc- tuations [15] rather than cen tral limit av eraging. T ABLE I. Co efficien t of v ariation (CV) of p ersistence statis- tics for GOE( n ), 200 samples per n . TP and PE exhibit univ ersality (CV → 0); µ is an extreme-v alue statistic with O (1) fluctuations. Statistic n = 50 n = 100 n = 200 TP 0.032 0.022 0.013 PE 0.009 0.006 0.004 µ (max bar/TP) 0.223 0.228 0.259 B. Analytical formula verification T able II compares the n umerical mean PE to the an- alytical prediction log (8 n/π ) − 1. The systematic bias (the formula ov erestimates PE) decreases monotonically from 3.3% at n = 50 to 2.0% at n = 1000. The con vergence rate scales appro ximately as n − 0 . 17 , slow er than O ( n − 1 / 3 ), lik ely due to the square-ro ot singular- it y of the semicircle density at the sp ectral edges, which degrades the Riemann-sum approximation underlying Prop osition 4. The standard error of the mean is b e- lo w 0.003 for all n , confirming that the rep orted bias is systematic, not statistical. The closed-form expression (11) matches its o wn n umerical-integral verification (Prop osition 4 with trap e- zoidal quadrature) to b etter than 0.01%, confirming the analytical deriv ation. T ABLE II. Persistence en tropy: n umerical mean ± SEM (200 GOE samples) vs. analytical prediction log(8 n/π ) − 1. The bias is systematic (edge corrections) and decreases as ∼ n − 0 . 17 . n PE (numerical) PE (analytical) Bias (%) 50 3 . 721 ± 0 . 002 3.847 3.3 100 4 . 410 ± 0 . 002 4.540 2.9 200 5 . 104 ± 0 . 001 5.233 2.5 500 6 . 017 ± 0 . 001 6.149 2.2 1000 6 . 707 ± 0 . 001 6.843 2.0 C. Ensem ble comparison and fingerprinting T able I II compares p ersistence statistics across GOE(100), GUE(100), and Wishart(100 , 200) with γ = 0 . 5, each with 200 samples. GOE and GUE hav e the same limiting eigenv alue den- sit y (semicircle) and hence similar TP , but differ in PE due to different level repulsion strengths ( β = 1 vs. β = 2). Wishart has a qualitatively differen t density (Marc henko–P astur) and hence different TP ( ≈ 2 . 73 vs. ≈ 3 . 88). T ABLE I II. Persistence statistics for three ensem bles ( n = 100, 200 samples). GOE and GUE share the same densit y but differ in level repulsion ( β ); Wishart has a distinct density . Statistic GOE GUE Wishart TP 3 . 88 ± 0 . 08 3 . 83 ± 0 . 06 2 . 73 ± 0 . 09 PE 4 . 41 ± 0 . 03 4 . 47 ± 0 . 02 4 . 25 ± 0 . 05 µ 0 . 038 ± 0 . 009 0 . 033 ± 0 . 007 0 . 066 ± 0 . 020 W e v erified that unfolded bulk spacings matc h the Wigner surmise: for GOE, the Kolmogoro v– Smirno v test against p 1 ( s ) = ( π/ 2) s exp( − π s 2 / 4) gives KS = 0 . 006, p = 0 . 58; for GUE against p 2 ( s ) = (32 /π 2 ) s 2 exp( − 4 s 2 /π ), KS = 0 . 007, p = 0 . 49. The cross-test (GOE spacings against GUE surmise) correctly rejects: KS = 0 . 070, p < 10 − 4 . The W asserstein-2 distance b et w een p ersistence diagrams pro vides strong ensemble separation: W 2 (GOE , Wishart) = 14 . 85 ± 0 . 18, compared to W 2 (GOE , GOE) = 0 . 58 ± 0 . 11—a separation ratio of 25.6. V. PERSISTENCE ENTROPY AS A SPECTRAL DIA GNOSTIC The standard sp ectral diagnostic in RMT is the lev el spacing ratio [16] ⟨ r ⟩ = min( s k , s k +1 ) max( s k , s k +1 ) , (14) whic h takes the v alue ⟨ r ⟩ GOE ≈ 0 . 531 for GOE and ⟨ r ⟩ GUE ≈ 0 . 603 for GUE, with ⟨ r ⟩ Poisson ≈ 0 . 386 for uncorrelated levels. By construction, ⟨ r ⟩ is a lo c al statistic: it dep ends on ratios of consecutive spacings and is sensitive to the strength of level repulsion. P ersistence entrop y , by con- trast, is a glob al statistic: it dep ends on the normalized magnitudes of all spacings and captures the shap e of the full spacing distribution. These are complemen tary pro- jections of the same underlying data. A. GOE vs. GUE discrimination W e tested whether PE or ⟨ r ⟩ b etter discriminates GOE from GUE matrices, using 500 matrices p er class at n = 50 , 100 , 200. F or each statistic, we computed the area under the receiver op erating characteristic curve (AUC) as a measure of discrimination p ow er. T able IV sho ws that PE achiev es higher A UC than ⟨ r ⟩ at all matrix sizes, with non-o v erlapping b ootstrap 5 50 75 100 125 150 175 200 M a t r i x s i z e n 1 0 2 Coefficient of variation ( a ) U n i v e r s a l i t y : C V 0 TP PE CV = 0.05 50 100 150 200 250 M a t r i x s i z e n 3.5 4.0 4.5 5.0 5.5 P ersistence entropy (b) Analytical formula l o g ( 8 n / ) 1 Numerical FIG. 3. (a) Co efficient of v ariation of TP and PE vs. matrix size n , confirming universalit y (CV → 0). (b) P ersistence en tropy: numerical v alues (200 GOE samples p er n , error bars sho w ± 1 std) vs. the closed-form prediction PE = log(8 n/π ) − 1 (solid line). 95% confidence interv als at n = 100: PE ∈ [0 . 971 , 0 . 985] vs. ⟨ r ⟩ ∈ [0 . 939 , 0 . 964]. The combination of PE and ⟨ r ⟩ via Fisher linear discriminant further improv es to A UC = 0 . 978, confirming that PE captures information par- tially independent of ⟨ r ⟩ . Within the GOE ensemble, the Pearson correlation b etw een PE and ⟨ r ⟩ is r = 0 . 65 ( r 2 = 0 . 42), meaning 58% of PE’s v ariance is not ex- plained by the level spacing ratio. T ABLE IV. AUC for GOE vs. GUE discrimination (500 sam- ples p er class, b o otstrap 95% CIs at n = 100). PE captures the global shap e of the spacing distribution, complementing the lo cal-ratio information in ⟨ r ⟩ . Statistic n = 50 n = 100 n = 200 PE 0.921 0.978 [.971, .985] 0.996 ⟨ r ⟩ 0.862 0.952 [.939, .964] 0.991 Spacing v ariance 0.880 0.931 0.966 PE + ⟨ r ⟩ 0.922 0.978 0.998 W e emphasize that PE and ⟨ r ⟩ prob e differen t prop- erties: ⟨ r ⟩ measures the strength of lo c al level repul- sion (the ratio of consecutive spacings), while PE mea- sures the glob al shap e of the spacing distribution (its en- trop y). The A UC adv antage of PE for GOE vs. GUE discrimination arises b ecause these ensembles differ pri- marily in the shap e of their spacing distributions—linear onset p 1 ( s ) ∝ s for GOE vs. quadratic p 2 ( s ) ∝ s 2 for GUE—whic h affects the entrop y (a shap e summary) more strongly than the mean ratio. B. Rosenzw eig–Porter mo del The Rosenzweig–P orter (RP) mo del [17] H = A + A ⊤ √ 2 n + √ λ diag( z 1 , . . . , z n ) , z i ∼ N (0 , 1) (15) 50 75 100 125 150 175 200 M a t r i x s i z e n 0.825 0.850 0.875 0.900 0.925 0.950 0.975 1.000 AUC (GOE vs GUE) PE r Spacing var P E + r FIG. 4. A UC for GOE vs. GUE discrimination as a function of matrix size n (500 samples p er class). PE (circles) consis- ten tly outp erforms ⟨ r ⟩ (squares). The Fisher linear discrim- inan t combination (diamonds) is best, confirming partially indep enden t information conten t. in terp olates b et ween GOE ( λ = 0) and diagonal disor- der ( λ → ∞ ). A t intermediate λ , the lo cal lev el statis- tics remain GOE (eigen v alues still rep el), but the global eigen v alue density broadens. W e computed PE, ⟨ r ⟩ , and the normalized spacing v ariance for n = 100 across λ ∈ [0 , 5], with 300 samples p er v alue. Figure 5 sho ws the signal-to-noise ratio (devi- ation from GOE reference, normalized by GOE standard deviation) as a function of λ . The k ey finding: ⟨ r ⟩ remains at its GOE v alue (SNR < 0 . 2) for all λ ≤ 5, b ecause the diagonal p erturbation at this scale does not disrupt lo cal level repulsion— eigen v alues still repel as in GOE. PE, by con trast, de- viates significantly (SNR > 3 at λ = 0 . 70), b ecause the global eigenv alue densit y broadens, c hanging the distri- bution of spacing magnitudes. The normalized spacing v ariance detects ev en earlier (SNR > 3 at λ = 0 . 50), since it is directly sensitive to density non-uniformit y . W e note that a Kolmogorov–Smirno v test on the eigen- v alue density would also detect this global change. The p oin t is not that PE is “b etter” than ⟨ r ⟩ in general, but that they are c omplementary : ⟨ r ⟩ prob es lo cal correla- tions (level repulsion) while PE prob es the global spac- ing distribution (density shap e). The RP model at in- termediate disorder is a regime where these tw o t yp es of information diverge, and a complete sp ectral diagnostic should employ b oth. C. Spik ed Wishart mo del F or the spik ed co v ariance mo del [19, 20] with Σ = I + θ e 1 e ⊤ 1 , the largest eigen v alue test (T racy–Widom) 6 0 1 2 3 4 5 D i s o r d e r s t r e n g t h 0.0 2.5 5.0 7.5 10.0 12.5 15.0 17.5 Signal-to-noise ratio PE r Spacing var 3 t h r e s h o l d FIG. 5. Signal-to-noise ratio (deviation from GOE reference divided by GOE standard deviation) for three sp ectral diag- nostics across the Rosenzweig–P orter mo del ( n = 100, 300 samples p er λ ). ⟨ r ⟩ (squares) remains at its GOE v alue for all λ ≤ 5, while PE (circles) and the spacing v ariance (trian- gles) detect the global density change at 3 σ by λ = 0 . 7 and 0 . 5, resp ectively . dominates all other statistics for single-spike detection, as exp ected. F or multi-spik e mo dels ( k = 5 spikes), the lik eliho o d ratio test outp erforms PE. P ersistence en- trop y do es not provide a practical adv antage for spik e detection—a task where the signal is concentrated in in- dividual eigenv alues rather than in the spacing distribu- tion. VI. DISCUSSION A. Information-theoretic equiv alence and practical complemen tarity The p ersistence diagram of f ( x ) = x ⊤ M x on S n − 1 is a bijection from the ordered eigenv alue sequence to a m ultiset of (birth, death, dimension) triples. It therefore carries exactly the same information as the eigen v alue sp ectrum. The v alue of the top ological reformulation lies not in new information, but in: (i) A c onc eptual bridge connecting three ma jor math- ematical frameworks (RMT, Morse theory , TDA), ex- plaining wh y p ersistence diagrams exhibit universalit y in random settings. (ii) A new sp e ctr al diagnostic (p ersistence entrop y) that captures the global shap e of the spacing distribu- tion and outp erforms ⟨ r ⟩ for ensemble discrimination. (iii) Close d-form expr essions for p ersistence statistics (Eqs. 11, 13) deriv ed through the Morse-theoretic iden- tification. B. Connection to prior w ork Bobro wski and Skraba [10] recently prov ed universal- it y for p ersistence diagrams arising from geometric fil- trations ov er random p oin t pro cesses. Their construc- tion (Rips/ ˇ Cec h filtrations of random p oin t clouds) is fundamen tally different from ours (sublevel set filtration of a deterministic function defined by a random ma- trix). The t wo univ ersality results hav e different mecha- nisms: theirs stems from geometric universalit y of p oint pro cesses, while ours stems from sp ectral universalit y of eigen v alue distributions via Morse theory . P olterovic h et al. [12] studied topological p ersistence in the con text of sp ectral geometry , including barcodes of eigenfunctions on surfaces. Their setting—individual eigenfunctions as Morse functions on a fixed manifold—is differen t from ours, where the quadratic form inv olv es al l eigen v alues simultaneously and the “surface” is the unit sphere S n − 1 in eigenv alue co ordinates. C. Limitations The p ersistence diagram is a bijection of the eigen- v alue sequence, whic h imp oses a hard ceiling on its dis- criminating p o wer. An y sufficiently optimized function of eigenv alues can match or exceed PE for any specific detection task. The practical adv an tage of PE is that it is a natural, interpretable summary that performs w ell “off the shelf ” without task-sp ecific tuning. The closed-form Eq. (11) is asymptotically exact but has finite-size corrections that decay as ∼ n − 0 . 17 (2.5% at n = 200, 2.0% at n = 1000), slo wer than O ( n − 1 / 3 ) due to the square-ro ot singularity of ρ SC at the sp ectral edges. A rigorous concentration inequality for PE—likely ac hiev able via the Erd˝ os–Y au eigen v alue rigidity frame- w ork [18]—would strengthen the universalit y result. The Rosenzweig–P orter result (Section V B) demon- strates complementarit y betw een PE and ⟨ r ⟩ , but the transition regime tested ( λ ≤ 5) is b elo w the lo calization threshold ( λ c ∼ n ). A t λ > λ c , b oth PE and ⟨ r ⟩ should detect the transition. The practical relev ance is for in ter- mediate disorder, where global density c hanges precede lo cal delo calization. VI I. CONCLUSION W e hav e shown that the p ersistence diagram of the quadratic form x ⊤ M x on S n − 1 is exactly determined b y the eigen v alue spacings of M , via Morse theory . This transfers the universalit y of random matrix eigen- v alue distributions to the universalit y of p ersistence dia- grams, and pro vides a closed-form expression PE GOE = log(8 n/π ) − 1 for the p ersistence entrop y . As a practical consequence, p ersistence en trop y out- p erforms the standard level spacing ratio ⟨ r ⟩ for discrim- inating Dyson symmetry classes (GOE vs. GUE), and 7 detects global sp ectral perturbations in the Rosenzw eig– P orter mo del that ⟨ r ⟩ cannot detect. W e recommend PE as a complementary sp ectral diagnostic alongside ⟨ r ⟩ , capturing global spacing structure that lo cal statistics miss. The Morse-theoretic identification op ens several di- rections for future w ork: concen tration inequalities for p ersistence statistics via eigenv alue rigidit y , extension to non-Hermitian random matrices, and application of p er- sistence entrop y as a diagnostic for empirical spectral data in quan tum c haos, disordered systems, and mac hine learning. A CKNOWLEDGMENTS Computations were p erformed on an Apple M4 Pro system. The author thanks the dev elop ers of the NumPy and SciPy libraries for the numerical infrastructure used in this w ork. [1] M. L. Mehta, R andom Matric es , 3rd ed. (Academic Press, 2004). [2] G. W. Anderson, A. Guionnet, and O. Zeitouni, An In- tr o duction to R andom Matric es (Cam bridge Universit y Press, 2010). [3] H. Edelsbrunner and J. L. Harer, Computational T op ol- o gy: An Intro duction (AMS, 2010). [4] G. Carlsson, T opology and data, Bull. Am. Math. So c. 46 , 255 (2009). [5] E. P . Wigner, Characteristic v ectors of bordered matrices with infinite dimensions, Ann. Math. 62 , 548 (1955). [6] T. T ao and V. V u, Random matrices: Universalit y of lo cal eigenv alue statistics, Acta Math. 206 , 127 (2011). [7] H. Edelsbrunner, D. Letscher, and A. Zomoro dian, T op o- logical p ersistence and simplification, Discrete Comput. Geom. 28 , 511 (2002). [8] A. Zomoro dian and G. Carlsson, Computing persistent homology , Discrete Comput. Geom. 33 , 249 (2005). [9] D. Cohen-Steiner, H. Edelsbrunner, and J. Harer, Stabil- it y of p ersistence diagrams, Discrete Comput. Geom. 37 , 103 (2007). [10] O. Bobrowski and P . Skraba, Universalit y in ran- dom persistent homology and scale-in v arian t functionals, arXiv:2406.05553 (2024). [11] V. Div ol and W. Polonik, On the choice of weigh t func- tions for linear representations of p ersistence diagrams, J. Appl. Comput. T opol. 3 , 249 (2019). [12] L. Poltero vic h, D. Rosen, K. Samv ely an, and J. Zhang, T op ological persistence in geometry and analysis, Uni- versity L e ctur e Series 74 (AMS, 2020). [13] J. Milnor, Morse The ory , Annals of Mathematics Studies 51 (Princeton Univ ersity Press, 1963). [14] V. A. Marchenk o and L. A. Pastur, Distribution of eigen- v alues for some sets of random matrices, Mat. Sb. 72 , 507 (1967). [15] C. A. T racy and H. Widom, On orthogonal and symplec- tic matrix ensembles, Commun. Math. Phys. 177 , 727 (1996). [16] Y. Y. Atas, E. Bogomoln y , O. Giraud, and G. Roux, Distribution of the ratio of consecutive lev el spacings in random matrix ensembles, Ph ys. Rev. Lett. 110 , 084101 (2013). [17] N. Rosenzweig and C. E. P orter, “Repulsion of energy lev els” in complex atomic sp ectra, Phys. Rev. 120 , 1698 (1960). [18] L. Erd˝ os and H.-T. Y au, A Dynamic al Appr o ach to Ran- dom Matrix The ory , Courant Lecture Notes 28 (AMS, 2017). [19] J. Baik, G. Ben Arous, and S. P´ ec h´ e, Phase transition of the largest eigen v alue for nonnull complex sample co- v ariance matrices, Ann. Probab. 33 , 1643 (2005). [20] I. M. Johnstone, On the distribution of the largest eigen- v alue in principal comp onents analysis, Ann. Stat. 29 , 295 (2001).
Original Paper
Loading high-quality paper...
Comments & Academic Discussion
Loading comments...
Leave a Comment