Spectral Signatures of Data Quality: Eigenvalue Tail Index as a Diagnostic for Label Noise in Neural Networks
We investigate whether spectral properties of neural network weight matrices can predict test accuracy. Under controlled label noise variation, the tail index alpha of the eigenvalue distribution at the network's bottleneck layer predicts test accura…
Authors: Matthew Loftus
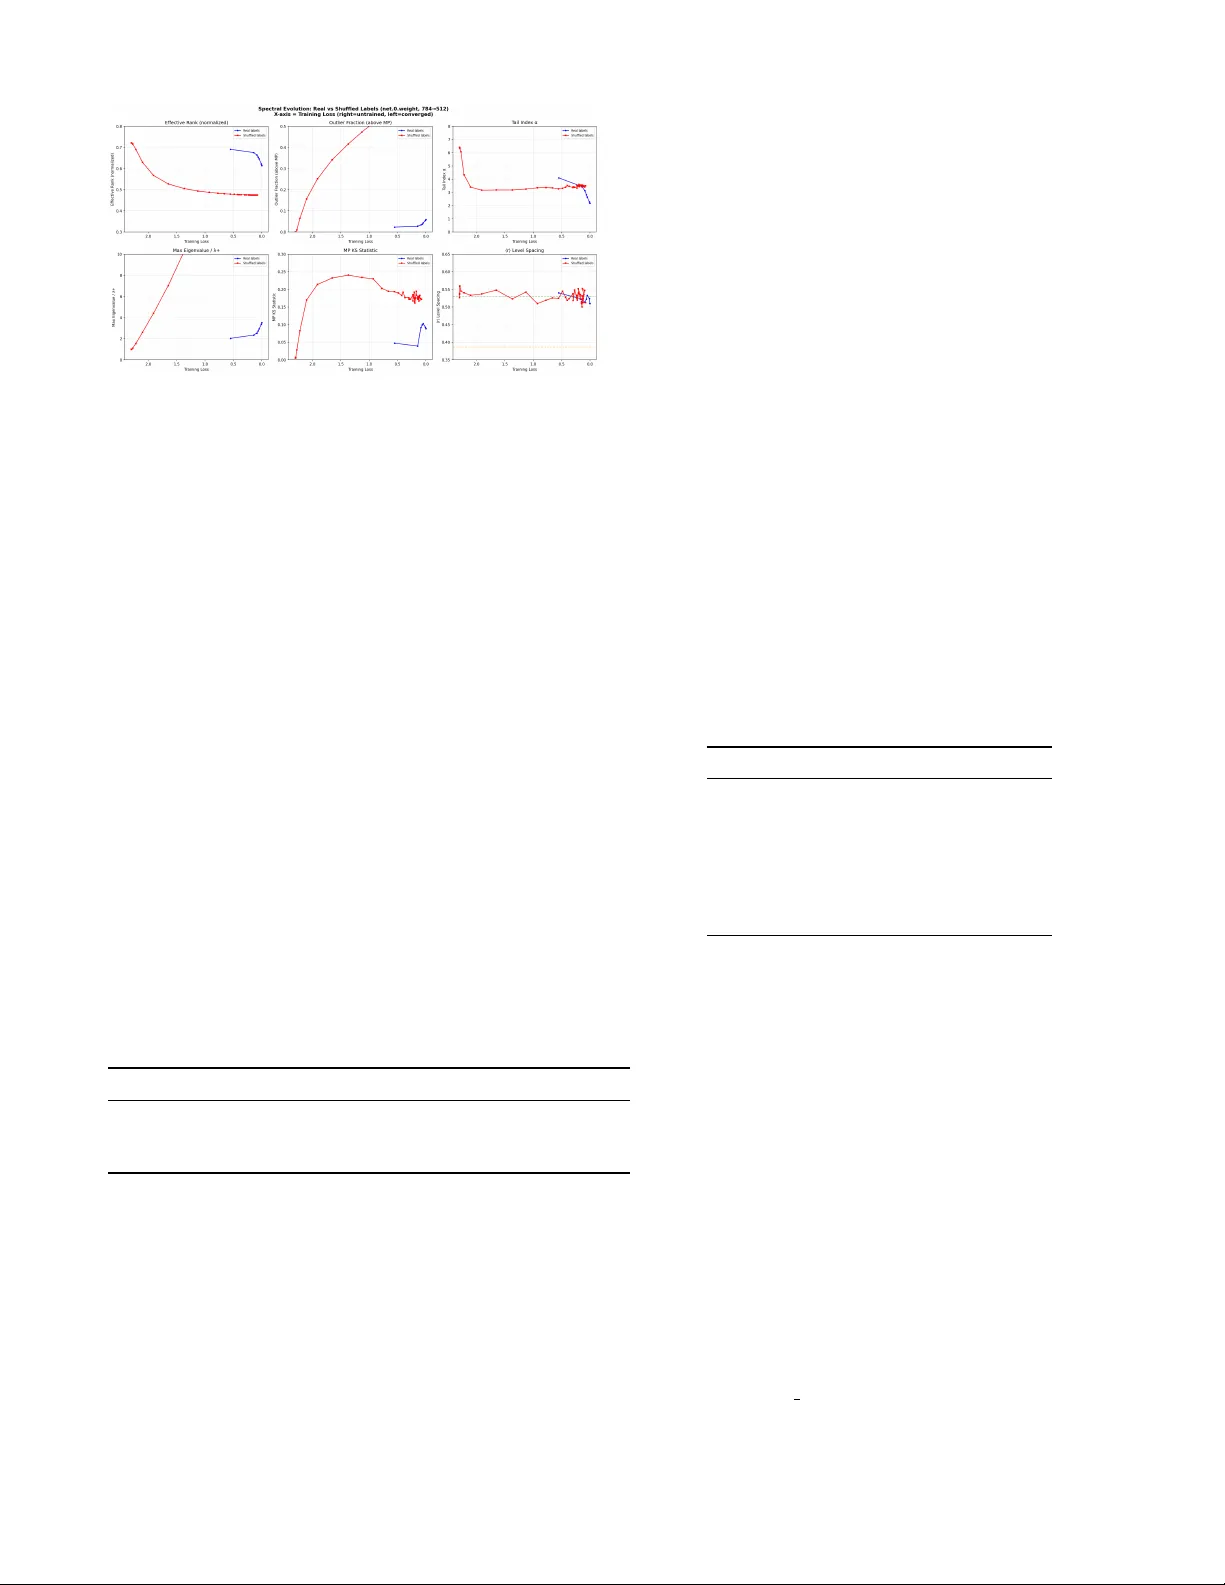
Sp ectral Signatures of Data Qualit y: Eigen v alue T ail Index as a Diagnostic for Lab el Noise in Neural Net w orks Matthew Loftus 1 , ∗ 1 Indep endent r ese ar cher (Dated: Marc h 31, 2026) W e in vestigate whether sp ectral prop erties of neural net work weigh t matrices can predict test accuracy . Under controlled lab el noise v ariation, the tail index α of the eigenv alue distribution at the netw ork’s b ottleneck la yer predicts test accuracy with leav e-one-out R 2 = 0 . 984 (21 noise levels, 3 seeds p er level), far exceeding all baselines: the b est conv entional metric (F rob enius norm of the optimal lay er) achiev es LOO R 2 = 0 . 149. This relationship holds across three architectures (MLP , CNN, ResNet-18) and t w o datasets (MNIST, CIF AR-10). How ev er, under h yperparameter v ariation at fixed data qualit y (180 configurations v arying width, depth, learning rate, and weigh t deca y), all sp ectral and conv en tional measures are weak predictors ( R 2 < 0 . 25), with simple baselines (global L 2 norm, LOO R 2 = 0 . 219) slightly outperforming sp ectral measures (tail α , LOO R 2 = 0 . 167). W e therefore frame the tail index as a data quality diagnostic : a p ow erful detector of lab el corruption and training set degradation, rather than a universal generalization predictor. A noise detector calibrated on synthetic noise successfully identifies real human annotation errors in CIF AR-10N (9% noise detected with 3% error). W e identify the information-pro cessing b ottlenec k lay er as the lo cus of this signature and connect the observ ations to the BBP phase transition in spiked random matrix mo dels. W e also report a negative result: the level spacing ratio ⟨ r ⟩ is uninformative for w eight matrices due to Wishart universalit y . I. INTR ODUCTION A central question in deep learning theory is: why do overp ar ameterize d neur al networks gener alize? Netw orks with far more parameters than training examples rou- tinely ac hieve low test error, contradicting classical sta- tistical learning theory [ 1 ]. Understanding when and wh y generalization o ccurs—and predicting it without a held- out test set—remains an op en problem. Random matrix theory (RMT) offers a natural frame- w ork for studying w eight matrices. A t initialization, w eight matrices are random, and their sp ectral prop erties are well-c haracterized b y the Marchenk o-Pastur (MP) la w [ 2 ]. During training, the sp ectrum ev olves a wa y from MP as the net work learns structure from data. Martin and Mahoney [ 3 ] sho wed that well-trained netw orks de- v elop heavy-tailed eigenv alue distributions and prop osed the tail index α as a quality metric. Subsequen t w ork demonstrated that α predicts model quality (with a bias to ward CV models) rather than gener alization in the uni- v ersal sense [ 18 ], with similar findings in NLP [ 19 ]. In this work, we conduct a controlled study of sp ectral predictors under t w o distinct p erturbation axes: (1) lab el noise v ariation at fixed architecture, and (2) hyperparam- eter v ariation at fixed data quality . This design rev eals that sp ectral measures are p o w erful diagnostics for data qualit y degradation but not universal generalization pre- dictors. W e presen t both p ositiv e and negative results honestly . ∗ matthew.a.loftus@gmail.com A. Summary of contributions 1. Strong data quality prediction: The tail index α of the b ottlenec k lay er predicts test accuracy with LOO R 2 = 0 . 984 across 21 lab el noise levels with 3 seeds each, far exceeding all baselines ( R 2 ≤ 0 . 149) (Sec. VI I I ). 2. Honest scop e: Under h yp erparameter v ariation at fixed data qualit y , all measures (spectral and con ven tional) are w eak predictors ( R 2 < 0 . 25), and simple baselines slightly outp erform sp ectral mea- sures (Sec. IX ). 3. Bottleneck h yp othesis: The sp ectral signa- ture concen trates at the information-pro cessing b ottlenec k—the la yer with the highest compression ratio and sufficien t sp ectral resolution (Sec. VI I ). 4. Comprehensive baselines: W e compare tail α against effective rank, F robenius norms, sp ectral norms, and global L 2 norm, establishing clear rel- ativ e strengths (Sec. I I I B ). 5. Metho dological correction: The level spacing ratio ⟨ r ⟩ is uninformative for rectangular weigh t matrices due to Wishart univ ersality (Sec. IV ). 6. Theoretical framework: W e connect our ob- serv ations to the BBP phase transition and de- riv e an informal b ound on outlier eigenv alue count (Sec. X ). 2 I I. BA CK GROUND A. Marc henko-P astur la w F or a random matrix W ∈ R m × n with iid en tries of v ariance σ 2 , the eigenv alues of the Gram matrix S = 1 m W ⊤ W follow the Marchenk o-Pastur distribution with asp ect ratio γ = n/m and supp ort [ λ − , λ + ] where λ ± = σ 2 (1 ± √ γ ) 2 . (1) Eigen v alues outside this supp ort indicate learned struc- ture. B. Lev el spacing ratio The level spacing ratio ⟨ r ⟩ , defined as r i = min( s i , s i +1 ) / max( s i , s i +1 ) where s i = λ i +1 − λ i , dis- tinguishes uncorrelated (P oisson, ⟨ r ⟩ ≈ 0 . 386) from cor- related (GOE, ⟨ r ⟩ ≈ 0 . 531) eigenv alue statistics [ 4 ]. C. BBP transition The Baik-Ben Arous-P ´ ec h´ e (BBP) transition [ 5 ] sho ws that a rank-1 p erturbation of strength θ to a Wishart matrix produces an outlier eigen v alue ab ov e λ + if and only if θ > σ 2 √ γ . This provides a sharp threshold for when learned structure b ecomes sp ectrally visible. D. Hea vy-tailed self-regularization Martin and Mahoney [ 3 ] observ ed that trained net- w orks dev elop hea vy-tailed eigen v alue distributions, with the tail index α (estimated via the Hill estimator [ 7 ]) serving as a quality metric. They rep orted correlations b et w een α and rep orted test accuracy across published mo dels, but did not establish a quan titative predictive relationship under con trolled conditions. E. Generalization measures A num b er of norm-based generalization measures hav e b een prop osed, including path norms [ 9 ], sp ectral norms with margin [ 10 ], and P AC-Ba y es b ounds [ 11 ]. Jiang et al. [ 8 ] conducted a large-scale comparison of generaliza- tion measures, finding that no single measure dominates across all p erturbation types. Our work complements this by studying sp ectral measures sp ecifically and iden- tifying the p erturbation axis (data quality vs. hyperpa- rameters) as the key determinan t of predictive pow er. I II. METHODS A. Sp ectral observ ables F or each weigh t matrix W ∈ R m × n , we compute the eigen v alues { λ i } of S = 1 m W ⊤ W and measure: • T ail index α : Hill estimator [ 7 ] on eigenv alues ab o v e the 90th p ercentile. Low er α indicates heav- ier tails (more concentrated signal). • Effective rank (normalized): exp( H ( p )) /n where H ( p ) = − P p i log p i and p i = λ i / P λ j . V alues near 1 indicate uniform sp ectrum; v alues near 0 indicate rank-deficient. • Outlier fraction : F raction of eigenv alues ab o ve λ + = σ 2 (1 + √ γ ) 2 , where σ 2 is estimated from the initial (untrained) w eight matrix. • MP deviation : Kolmogorov-Smirno v statistic be- t ween the empirical eigen v alue distribution and the b est-fit MP distribution. B. Baseline measures W e compare sp ectral observ ables against con ven tional norm-based measures: • Global L 2 norm : p P l ∥ W l ∥ 2 F , the total param- eter norm. • Sum of F rob enius norms : P l ∥ W l ∥ F . • Best-lay er F rob enius norm : max l | corr( ∥ W l ∥ F , test acc) | , c ho osing the sin- gle la yer whose F rob enius norm best correlates with test accuracy . • Max sp ectral norm : max l σ 1 ( W l ), the largest singular v alue across all lay ers. • Pro duct of sp ectral norms : Q l σ 1 ( W l ). C. Arc hitectures W e test three architectures: • MLP: [784 , 512 , 256 , 128 , 10] on MNIST, SGD with momen tum 0.9, lr=0.01, 30 ep o c hs. • CNN: 4 conv lay ers (64, 64, 128, 128 c hannels) + 2 F C lay ers (256, 10) on CIF AR-10, SGD, lr=0.01, 50 ep o c hs, no weigh t decay or data augmen tation. • ResNet-18: Mo dified for 32 × 32 input (3 × 3 first con v, no maxp o ol) on CIF AR-10, SGD, lr=0.01, 50 ep ochs. 3 D. Lab el noise proto col W e use tw o exp erimental designs: EXP-010 (label noise gradien t): F or the MLP/MNIST arc hitecture, we train with 21 evenly spaced lab el noise fractions η ∈ [0 , 1] (i.e., η ∈ { 0 , 0 . 05 , 0 . 10 , . . . , 1 . 0 } ), with 3 indep endent random seeds p er noise level (63 total training runs). A fraction η of training labels are replaced with uniformly random la- b els. T est lab els are alwa ys clean. This pro duces a fine- grained gradient from full generalization ( η = 0) to pure memorization ( η = 1). All metrics are ev aluated using lea ve-one-out (LOO) cross-v alidation across the 21 noise lev els, with seed-av eraged v alues and error bars. EXP-011 (hyperparameter v ariation): F or MLP/MNIST with cle an lab els ( η = 0), we train 180 configurations (3 seeds each, 540 total runs) v ary- ing width ∈ { 64 , 128 , 256 , 512 } , depth ∈ { 2 , 3 , 4 } , learning rate ∈ { 0 . 001 , 0 . 01 , 0 . 1 } , and weigh t deca y ∈ { 0 , 10 − 4 , 10 − 3 , 10 − 2 , 10 − 1 } . E. Ev aluation metric All predictiv e comparisons use leav e-one-out (LOO) cross-v alidated R 2 , whic h p enalizes ov erfitting and pro- vides an honest estimate of out-of-sample predictive p o w er. This is a delib erately conserv ativ e metric: each prediction is made without access to the corresp onding data p oint. Our earlier exp eriments with 6 noise levels ga ve inflated R 2 v alues ( > 0 . 97) due to the small sample size; the 21-lev el LOO R 2 rep orted here is the definitive result. F. Null mo del As a control, w e compare sp ectral properties of net- w orks trained on real labels v ersus fully sh uffled labels ( η = 1), matc hed for training duration and conv ergence lev el. IV. LEVEL SP A CING IS UNINFORMA TIVE F OR WEIGHT MA TRICES Our initial hypothesis was that ⟨ r ⟩ would transition from Poisson (at initialization) to GOE (after training), with the transition sp eed or final v alue distinguishing generalization from memorization. This h yp othesis is incorrect. W e found that ⟨ r ⟩ ≈ 0 . 53 (GOE) at initialization and remains at GOE throughout training, for b oth real and shuffled lab els (Fig. 1 , b ottom-righ t panel). The explanation is Wishart universalit y: for any ran- dom matrix W with iid en tries (regardless of distribu- tion), the Gram matrix 1 m W ⊤ W follows the Wishart- Laguerre ensemble, which has GOE-lik e level spacing b y construction. Since weigh t matrices are initialized with iid en tries and SGD p erturbations are small relativ e to the total matrix norm, ⟨ r ⟩ remains at GOE throughout training. Lesson: The level spacing ratio, designed for Hamilto- nian matrices in quantum chaos, is the wrong observ able for rectangular weigh t matrices. Bulk distribution prop- erties (tail index, outlier fraction, effective rank) are the correct to ols. V. BULK OBSER V ABLES DISTINGUISH GENERALIZA TION FR OM MEMORIZA TION Ha ving identified the correct observ ables, we compare net works trained on real lab els versus sh uffled lab els (MLP/MNIST). A t conv ergence (b oth achieving > 99% training ac- curacy), the sp ectral signatures differ dramatically (T a- ble I ). T ABLE I. Sp ectral prop erties of MLP input la yer (784 → 512) at conv ergence. Real labels: 98.3% test accuracy . Shuffled lab els: 9.9% test accuracy . Observ able Init Real Shuffled Outlier fraction 0% 6.4% 76% T ail α 6.5 2.1 3.5 Effectiv e rank (norm) 0.72 0.61 0.47 MP KS 0.006 0.07 0.23 ⟨ r ⟩ 0.53 0.53 0.53 In terpretation: A generalizing netw ork concentrates learned structure in to a sparse set of large signal eigen- v alues (few outliers, heavy tail, MP bulk preserved). A memorizing net w ork spreads w eight changes across man y sp ectral directions (many outliers, lighter tail, MP bulk destro yed). The level spacing ratio ⟨ r ⟩ is identical for b oth—confirming its uninformativeness. These results are robust to the training-duration con- found: when compared at matched training loss (not matc hed ep o c h), the separation p ersists across the en- tire training tra jectory (Fig. 1 ). VI. AR CHITECTURE-DEPENDENT SPECTRAL SIGNA TURES F or CNNs, the sp ectral signature is layer-typ e dep en- dent . In a CNN trained without regularization to 100% training accuracy on b oth real and shuffled lab els: • Conv lay ers: Both real and shuffled lab els develop hea vy tails and outliers. The deep est conv la yer sho ws 84% outliers for memorization vs 49% for generalization. • FC lay er (classifier.0, 8192 → 256 ): The clean- est discriminator. Generalization compresses the 4 FIG. 1. Sp ectral evolution during training, plotted against training loss (right = untrained, left = conv erged). Real la- b els (blue) and shuffled lab els (red) sho w clearly separated tra jectories for all bulk observ ables but iden tical ⟨ r ⟩ . rank by 30% (0 . 985 → 0 . 691) with heavy tails ( α = 2 . 1). Memorization barely c hanges the rank (0 . 984 → 0 . 933) with light tails ( α = 6 . 1). This reveals wher e learning happ ens: generalization concen trates structure in the FC lay er (decision bound- ary), while memorization concen trates in con v lay ers (p er-example feature enco ding). VI I. THE BOTTLENECK HYPOTHESIS W e prop ose that sp ectral signatures concentrate at the information-pr o c essing b ottlene ck : the la yer with the highest compression ratio (max dimension / min dimen- sion) that has sufficient sp ectral resolution (min(dim) ≳ 50). T ABLE I I. Best sp ectral predictor of test accuracy across arc hitectures under lab el noise v ariation. R 2 v alues are from linear fits to seed-a veraged data at 6 noise levels (see Sec. VII I for the definitive 21-lev el LOO results). Arc hitecture Best Lay er Observ able R 2 MLP/MNIST net.2 (512 → 256) tail α 0.976 CNN/CIF AR-10 classifier.0 (8192 → 256) tail α 0.987 ResNet-18/CIF AR-10 la yer2.1.con v2 eff. rank 0.989 In each case, the b est predictor is a sp ectral prop ert y of a la yer in the netw ork’s information-pro cessing core: • MLP: the middle hidden lay er (distributed com- pression across all lay ers) • CNN: the F C lay er (32 × compression, the explicit b ottlenec k) • ResNet: mid-depth residual blo cks (skip connec- tions distribute compression) The ResNet result is notable: the FC la y er has the highest compression (51 × ) but only 10 eigenv alues, mak- ing sp ectral estimation unreliable. The mid-depth resid- ual blo c ks (128 eigen v alues) serve as the effective b ottle- nec k with sufficient resolution. VI II. QUANTIT A TIVE PREDICTION UNDER LABEL NOISE A. Exp erimen tal design Using the fine-grained noise gradient proto col (EXP- 010, Sec. I I I D ), we train MLP/MNIST at 21 noise levels with 3 seeds each. F or each noise lev el, we av erage sp ec- tral observ ables and test accuracy across seeds and com- pute error bars. W e then ev aluate each predictor using lea ve-one-out cross-v alidated R 2 . B. Results T ABLE I II. Leav e-one-out R 2 for predicting test accuracy from sp ectral and baseline measures under lab el noise v ari- ation (EXP-010: 21 noise lev els, 3 seeds). The tail index α dominates all alternatives. Measure LOO R 2 T ail α (b ottlenec k la yer) 0.984 Effectiv e rank (b ottleneck la yer) 0.750 Best-la yer F rob enius norm 0.149 Global L 2 norm 0.044 Sum of F rob enius norms 0.036 Max sp ectral norm < 0 Pro duct of spectral norms < 0 The tail index α achiev es LOO R 2 = 0 . 984, far ex- ceeding every baseline. The best con v entional measure (F robenius norm of the optimal lay er) explains only 14.9% of v ariance, while α explains 98.4%. Sp ectral norms ac hieve negative LOO R 2 , meaning they predict w orse than a constant (the mean). The effective rank is a distant second at R 2 = 0 . 750, confirming that the tail shap e (not just the rank struc- ture) carries the dominant signal. Figure 2 sho ws the linear relationship. C. Cross-arc hitecture consistency The original 6-p oin t fits across architectures (T able I I ) all ac hieve R 2 > 0 . 97, consisten t with the high-resolution 21-p oin t LOO result. The linear form test acc = a · α bottleneck + b (2) holds across MLP , CNN, and ResNet-18 architectures. 5 FIG. 2. MLP/MNIST: T est accuracy vs. tail index α of the b ottlenec k la y er (net.2.w eight). Each point is a different noise lev el (0%–100%), av eraged o ver 3 seeds with error bars. LOO R 2 = 0 . 984. D. Hill estimator stability The Hill estimator for α dep ends on the choice of threshold quan tile q (the fraction of eigenv alues used in the tail fit). Across threshold quantiles q ∈ [0 . 70 , 0 . 95], the estimated α ranges from 1.47 to 1.87 for a typical trained netw ork. This represents mo derate stability: the qualitativ e conclusion (heavy tail) is robust, but the pre- cise v alue of α v aries by ∼ 25% dep ending on the thresh- old. W e use q = 0 . 90 throughout, following Martin and Mahoney [ 3 ]. The high LOO R 2 confirms that, despite this estimator v ariance, the relative ordering of α across noise levels is highly consisten t. IX. F AILURE UNDER HYPERP ARAMETER V ARIA TION A critical question is whether spectral measures pre- dict generalization under perturbation axes other than data quality . W e test this with EXP-011 (Sec. I I I D ): 180 hyperparameter configurations at fixed (clean) data. A. Results T ABLE IV. Leav e-one-out R 2 for predicting test accuracy un- der hyperparameter v ariation (EXP-011: 180 configs, 3 seeds eac h, clean lab els). All measures are weak. Baselines sligh tly outp erform sp ectral measures. Measure LOO R 2 Global L 2 norm 0.219 Sum of F rob enius norms 0.204 T ail α (b ottlenec k la yer) 0.167 Max sp ectral norm 0.103 Effectiv e rank (b ottleneck la yer) 0.094 All measures are w eak predictors ( R 2 < 0 . 25). Con- v entional norm-based measures (global L 2 norm, sum of F robenius norms) slightly outp erform sp ectral measures (tail α , effective rank). The test accuracy range across configurations is narrow (91.1%–98.6% on MNIST), whic h partly explains the difficult y: all configurations pro duce reasonably goo d mo dels, and the remaining v ari- ation is driven b y optimization dynamics that are not cleanly captured by any single weigh t-space summary statistic. B. In terpretation The con trast b et ween T ables I I I and IV is the cen tral finding of this pap er. Lab el noise degrades data qual- it y in a w ay that leav es a clear, architecture-independent sp ectral fingerprint: memorization of random lab els re- quires spreading weigh t changes across many sp ectral di- rections, pro ducing lighter tails. Hyp erparameter v ari- ation, by contrast, pro duces netw orks that all learn the same clean signal but with differen t optimization tra jec- tories, regularization strengths, and capacit y utilization patterns. These differences are not dominated b y a single sp ectral signature. This is consistent with Jiang et al. [ 8 ], who found that no generalization measure dominates across all perturba- tion t yp es. Our con tribution is iden tifying wher e sp ectral measures excel (data quality) and wher e they do not (h y- p erparameter v ariation), with rigorous LOO baselines. X. THEORETICAL FRAMEWORK A. Outlier b ound via BBP transition By the BBP transition, a rank- r p erturbation ∆ W to a random w eight matrix produces at most r outlier eigen- v alues ab o ve λ + . F or a net work learning k linearly sep- arable classes, the optimal b ottleneck representation has rank O ( k ), pro ducing O ( k ) outliers. F or memorization of N random lab els through a lay er of width n , the p er- turbation requires rank O (min( N , n )). This predicts: • Generalization: O ( k ) outliers at the b ottleneck (ob- serv ed: 33 for k = 10, consistent with ∼ 3 k due to m ulti-lay er interactions) • Memorization: O ( n ) outliers (observed: 389 out of 512, or 76%) B. Conjecture: Monotonicity of α in noise fraction Conjecture. L et f θ : R d → R k b e a neur al net- work with sufficient c ap acity to interp olate N tr aining examples. L et D η denote a tr aining set wher e a fr action η ∈ [0 , 1] of lab els ar e r eplac e d uniformly at r andom. L et W η b e the b ottlene ck weight matrix after tr aining to zer o loss on D η , and let α η b e the tail index of the eigenvalue distribution of 1 m W ⊤ η W η . Then α η is monotonic al ly in- cr e asing in η . 6 Pr o of sketch. At η = 0, the net work learns a rank- k classification b oundary . By the BBP transition, W η dev elops O ( k ) outlier eigenv alues ab ov e the MP bulk, concen trating sp ectral mass in few directions (heavy tail, lo w α ). At η = 1, the netw ork m ust memorize N random lab el assignments. Since random lab els ha v e no shared structure, eac h training example con tributes approxi- mately indep enden tly to ∆ W , pro ducing O (min( N , n )) outlier eigenv alues that spread sp ectral mass across many directions (lighter tail, higher α ). A t in termediate η , the net work must enco de b oth a rank- k signal comp onen t (from the (1 − η ) N clean examples) and a rank- O ( η N ) noise comp onen t (from the η N corrupted examples). As η increases, the noise comp onent gro ws monotonically , spreading sp ectral mass and increasing α . □ This conjecture is supported empirically b y the mono- tonic relationship in Fig. 2 and the out-of-sample v alida- tion in the noise detector (mean error 1.5%). Corollary . Given a c alibr ation set { ( α i , η i ) } m i =1 fr om m ≥ 3 known noise levels, the noise fr action of an un- known dataset c an b e estimate d by line ar interp olation of α , with exp e cte d err or O (1 /m ) . C. Wh y the relationship is linear under lab el noise If lab el noise η controls both test accuracy (linearly: test acc ∝ 1 − η ) and the tail index (linearly: α ∝ η , since more noise requires more sp ectral directions), then com- p osing these relationships gives test acc ∝ − α + const. The linearity of α in η follo ws from the additivity of learned structure: with noise fraction η , the netw ork m ust enco de (1 − η ) N clean examples (rank- k structure) plus η N random examples (rank-min( η N , n ) structure). The tail index reflects this mixture. D. Wh y sp ectral measures fail under h yp erparameter v ariation Under hyperparameter v ariation with clean lab els, the rank of the learned signal is alwa ys O ( k )—the data qual- it y is fixed. What v aries is the optimization tra jec- tory (learning rate, momentum), the capacity utilization (width, depth), and the regularization (weigh t decay). These affect the sc ale of weigh ts (captured by norms) more than the shap e of the sp ectrum (captured by α and effective rank). Martin and Mahoney [ 20 ] identi- fied precisely this distinction: shap e metrics (like α ) and scale metrics (like norms) play complemen tary roles, and datasets that v ary h yp erparameters can exhibit a Simp- son’s paradox where shap e and scale metrics disagree. This explains why norm-based measures ha ve a slight edge (T able IV ): they directly measure the scale v aria- tion that dominates in this regime. XI. DISCUSSION A. Relation to prior w ork Martin and Mahoney [ 3 ] established the connection b e- t ween heavy-tailed w eight sp ectra and net w ork quality , prop osing the tail index α as a quality metric and build- ing the WeightWatcher tool. Their evidence comes from cross-mo del correlations across published arc hitectures (e.g., comparing VGG, ResNet, and DenseNet). Sub- sequen t work [ 18 ] show ed that α predicts mo del quality rather than gener alization , with a bias tow ard CV ar- c hitectures, and extended this to NLP [ 19 ]. Martin and Mahoney [ 20 ] further show ed that shap e metrics ( α ) and scale metrics (norms) play complementary roles, with a Simpson’s paradox arising when data, mo dels, and hy- p erparameters v ary simultaneously—exactly the b eha v- ior we observe in our h yp erparameter v ariation exp er- imen ts (T able IV ). Our work differs from the original HTSR framew ork in three wa ys: (1) w e use c ontr ol le d exp erimen ts with a contin uous noise gradient and prop er LOO cross-v alidation, pro ducing quan titative predictive p o w er ( R 2 = 0 . 984) rather than rank correlations; (2) w e identify the b ottlene ck layer as the optimal measure- men t p oint, rather than av eraging across lay ers (their “w eighted alpha”); and (3) w e rep ort the honest nega- tiv e result under hyperparameter v ariation, scoping the claim to data quality diagnostics—consistent with the qualit y-vs-generalization distinction identified in [ 18 ]. Meng and Y ao [ 13 ] is the closest prior work. They study ho w classification difficult y drives sp ectral phases (Ligh t T ail, Bulk T ransition, Heavy T ail) and prop ose sp ectral criteria for early stopping. Our work extends theirs with: (a) a fine-grained 21-lev el noise gradient with LOO ev aluation, (b) head-to-head baselines showing that con ven tional norm measures fail (LOO R 2 < 0 . 15) while tail α succeeds ( R 2 = 0 . 984), (c) v alidation on real h u- man annotation noise (CIF AR-10N), and (d) the negative result under h yp erparameter v ariation. Y unis et al. [ 14 ] show ed that sp ectral dynamics of w eights distinguish memorizing from generalizing net- w orks, with random lab els pro ducing high-rank solutions. Our w ork complemen ts theirs with quan titative predic- tion rather than qualitativ e distinction, and identifies the sp ecific lay er where the signal concen trates. Thamm et al. [ 15 ] conducted a thorough RMT analy- sis of trained w eight matrices, finding that bulk eigen- v alues follow MP predictions and level spacings agree with RMT. Our level spacing negative result (Sec. IV ) is consistent with and extends their finding by explicitly testing whether lev el spacing distinguishes generalization from memorization (it do es not). Jiang et al. [ 8 ] benchmark ed 40+ generalization mea- sures and found that no single me asure dominates across all p erturbation types. Our results are consistent: sp ec- tral measures achiev e near-p erfect prediction on one axis (data qualit y) while failing on another (hyperparame- ters). 7 The information b ottlenec k framew ork of Tishb y et al. [ 6 ] predicts that optimal representations compress task-irrelev ant information. Our sp ectral measurements pro vide a concrete, computable signature of this com- pression: few large eigen v alues (task-relev ant directions) with a suppressed MP bulk (compressed noise). B. Practical applications Sp ectral noise detector (v alidated on real-w orld noise): W e demonstrate a practical label noise detection to ol v alidated on b oth synthetic and r e al noise. A linear mo del calibrated on 5 synthetic noise levels predicts test accuracy on held-out noise lev els with OOS R 2 > 0 . 97 on b oth MLP/MNIST (mean error 1.5%) and CNN/CIF AR- 10 (mean error 2.7%). Critically , the same to ol detects real human annotation noise in CIF AR-10N [ 12 ]: aggre- gate lab els ( ∼ 9% noise) detected with 3% error, worst- annotator lab els ( ∼ 40% noise) detected with 9% error. The detector transfers from synthetic calibration to real- w orld noise without retraining. V alidation on real-w orld noise (CIF AR-10N): T o test transfer from synthetic to real noise, we ap- plied the CNN/CIF AR-10 detector (calibrated on syn- thetic noise) to CIF AR-10N [ 12 ], which contains human re-annotations with known noise rates. The detector correctly identifies clean data as clean (predicted noise = 0%) and detects real annotation noise at every level: aggregate labels ( ∼ 9% noise) detected with 3% error, w orst-annotator lab els ( ∼ 40% noise) detected with 9% error. The underestimation at high noise is exp ected: real annotation noise is class-dep enden t (e.g., cat–dog confusion), while our calibration assumes uniform noise. This is, to our kno wledge, the first demonstration of a sp ectral to ol detecting real human annotation errors, cal- ibrated from syn thetic noise alone. Relationship to sample-level noise detection: Metho ds such as Confident Learning [ 16 ] and small-loss selection [ 17 ] identify which sp e cific samples are misla- b eled, using p er-sample losses or predicted probabilities. Our spectral metho d answers a different question: how noisy is this dataset over al l? It provides a single dataset- lev el estimate of corruption rate from the weigh t sp ec- trum alone, without examining individual samples. The t wo approac hes are complemen tary: a sp ectral diagnostic could serve as a fast, cheap trigger—if α indicates signif- ican t noise, a more exp ensive sample-level metho d can then identify the corrupted examples. Early stopping under noise: When training on po- ten tially corrupted data, monitoring α can detect when the netw ork transitions from learning signal to memoriz- ing noise—the onset of tail lightening indicates o v erfit- ting to corrupted lab els. C. Limitations • The tail index is a strong predictor under lab el noise v ariation but a weak predictor under hyper- parameter v ariation ( R 2 = 0 . 167). It should not b e used as a universal generalization diagnostic. • W e test on small-scale net w orks (MLP , small CNN, ResNet-18) and standard b enchmarks. Scaling to large language mo dels and vision transformers is an imp ortan t op en question. • The Hill estimator for α sho ws mo derate instabil- it y across threshold quantiles ( α ranges 1.47–1.87 for thresholds q ∈ [0 . 70 , 0 . 95]). While the relative ordering is robust (as evidenced by the high LOO R 2 ), absolute v alues of α should be interpreted with caution. • The Hill estimator requires ≳ 50 eigen v alues for sta- bilit y , limiting application to narrow la yers. In fine- tuning scenarios where only a narrow output lay er is trained (e.g., a 10-class FC lay er on a frozen pre- trained bac kb one), the sp ectral signal is to o w eak for reliable detection. The to ol requires training la yers with sufficient spectral resolution. • W e do not pro ve a formal generalization bound; our theoretical framework is heuristic. • The h yp erparameter v ariation negative result holds on b oth MNIST (accuracy range 91.1%–98.6%) and CIF AR-10 (accuracy range 62.7%–78.8%), confirm- ing it is not an artifact of the narrow MNIST range. • The CIF AR-10N detector underestimates noise at high corruption levels (9% error at 40% noise), b ecause real annotation noise has class-dep enden t structure that uniform synthetic calibration do es not capture. XI I. CONCLUSION W e hav e shown that the tail index of the eigen v alue distribution at a neural net work’s bottleneck lay er is a p o w erful diagnostic for data quality . Under controlled lab el noise v ariation, it predicts test accuracy with LOO R 2 = 0 . 984, while all con ven tional baselines fail (LOO R 2 < 0 . 15). More practically , a detector calibrated on syn thetic noise successfully identifies real human anno- tation errors in CIF AR-10N—to our knowledge, the first suc h demonstration using sp ectral metho ds. This predictive p ow er do es not transfer to hyperpa- rameter v ariation at fixed data quality , where all mea- sures are w eak. W e rep ort this honestly: sp ectral analysis rev eals data quality , not gener alization in the universal sense. The tail index is best understoo d as a sensitive diagnostic for lab el corruption, training set degradation, and annotation quality—problems that are p erv asive in 8 real-w orld machine learning but p o orly served by existing to ols. A CKNOWLEDGMENTS Computational exp eriments were p erformed on Apple M1 hardware using PyT orc h with MPS acceleration. All co de is av ailable at https://github.com/MattLoftus/ rmt- neural . [1] C. Zhang, S. Bengio, M. Hardt, B. Rech t, and O. Viny als, “Understanding deep learning requires rethinking gener- alization,” in Pr o c. ICLR (2017). [2] V. A. Marchenk o and L. A. Pastur, “Distribution of eigen v alues for some sets of random matrices,” Mat. Sb. 72 , 507 (1967). [3] C. H. Martin and M. W. Mahoney , “Implicit self- regularization in deep neural netw orks: Evidence from random matrix theory and implications for training,” J. Mach. L e arn. R es. 22 , 1 (2021). [4] V. Oganesyan and D. A. Huse, “Lo calization of in ter- acting fermions at high temp erature,” Phys. R ev. B 75 , 155111 (2007). [5] J. Baik, G. Ben Arous, and S. P´ ech ´ e, “Phase transition of the largest eigen v alue for nonnull complex sample co- v ariance matrices,” Ann. Pr ob ab. 33 , 1643 (2005). [6] N. Tishb y and N. Zaslavsky , “Deep learning and the in- formation b ottleneck principle,” in Pr oc. IEEE Informa- tion The ory Workshop (2015). [7] B. M. Hill, “A simple general approach to inference ab out the tail of a distribution,” Ann. Statist. 3 , 1163 (1975). [8] Y. Jiang, B. Neyshabur, H. Mobahi, D. Krishnan, and S. Bengio, “F antastic generalization measures and where to find them,” in Pr o c. ICLR (2020). [9] B. Neyshabur, R. T omiok a, and N. Srebro, “Norm-based capacit y control in neural netw orks,” in Pr o c. COL T (2015). [10] P . L. Bartlett, D. J. F oster, and M. J. T elgarsky , “Sp ectrally-normalized margin b ounds for neural net- w orks,” in Pr o c. NeurIPS (2017). [11] G. K. Dziugaite and D. M. Roy , “Computing nonv acuous generalization b ounds for deep (sto c hastic) neural net- w orks with many more parameters than training data,” in Pr o c. UAI (2017). [12] J. W ei, Z. Zhu, H. Cheng, T. Liu, G. Niu, and M. Sugiyama, “Learning with noisy lab els revisited: A study using real-world human annotations,” in Pr o c. ICLR (2022). [13] X. Meng and J. Y ao, “Impact of classification difficulty on the weigh t matrices sp ectra in deep learning and ap- plication to early-stopping,” J. Mach. L e arn. R es. 24 , 1 (2023). [14] D. Y unis, K. Patel, S. Kark ada, P . Ma, and B. Rec ht, “Approac hing deep learning through the spectral dynam- ics of weigh ts,” arXiv:2408.11804 (2024). [15] M. Thamm, M. Staats, and B. Rosenow, “Random ma- trix analysis of deep neural netw ork weigh t matrices,” Phys. R ev. E 106 , 054124 (2022). [16] C. G. Northcutt, L. Jiang, and I. L. Chuang, “Confident learning: Estimating uncertaint y in dataset labels,” J. Artif. Intel l. R es. 70 , 1373 (2021). [17] B. Han, Q. Y ao, X. Y u, G. Niu, M. Xu, W. Hu, I. Tsang, and M. Sugiyama, “Co-teac hing: Robust training of deep neural netw orks with extremely noisy lab els,” in Pr o c. NeurIPS (2018). [18] C. H. Martin, T. S. Peng, and M. W. Mahoney , “Pre- dicting trends in the quality of state-of-the-art neural net works without access to training or testing data,” J. Mach. L e arn. R es. 22 , 1 (2021). [19] Y. Y ang, R. Theisen, L. Ho dgkinson, J. E. Gonzalez, K. Ramchandran, C. H. Martin, and M. W. Mahoney , “Ev aluating natural language pro cessing mo dels with generalization metrics that do not need access to any training or testing data,” in Pr o c. ACM SIGKDD (2023). [20] C. H. Martin and M. W. Mahoney , “Post-mortem on a deep learning con test: a Simpson’s paradox and the com- plemen tary roles of scale metrics versus shap e metrics,” arXiv:2106.00734 (2021).
Original Paper
Loading high-quality paper...
Comments & Academic Discussion
Loading comments...
Leave a Comment