Fronthaul Network Planning for Hierarchical and Radio-Stripes-Enabled CF-mMIMO in O-RAN
The deployment of ultra-dense networks (UDNs), particularly cell-free massive MIMO (CF-mMIMO), is mainly hindered by costly and capacity-limited fronthaul links. This work proposes a two-tiered optimization framework for cost-effective hybrid frontha…
Authors: Anas S. Mohammed, Krishnendu S. Tharakan, Hussein A. Ammar
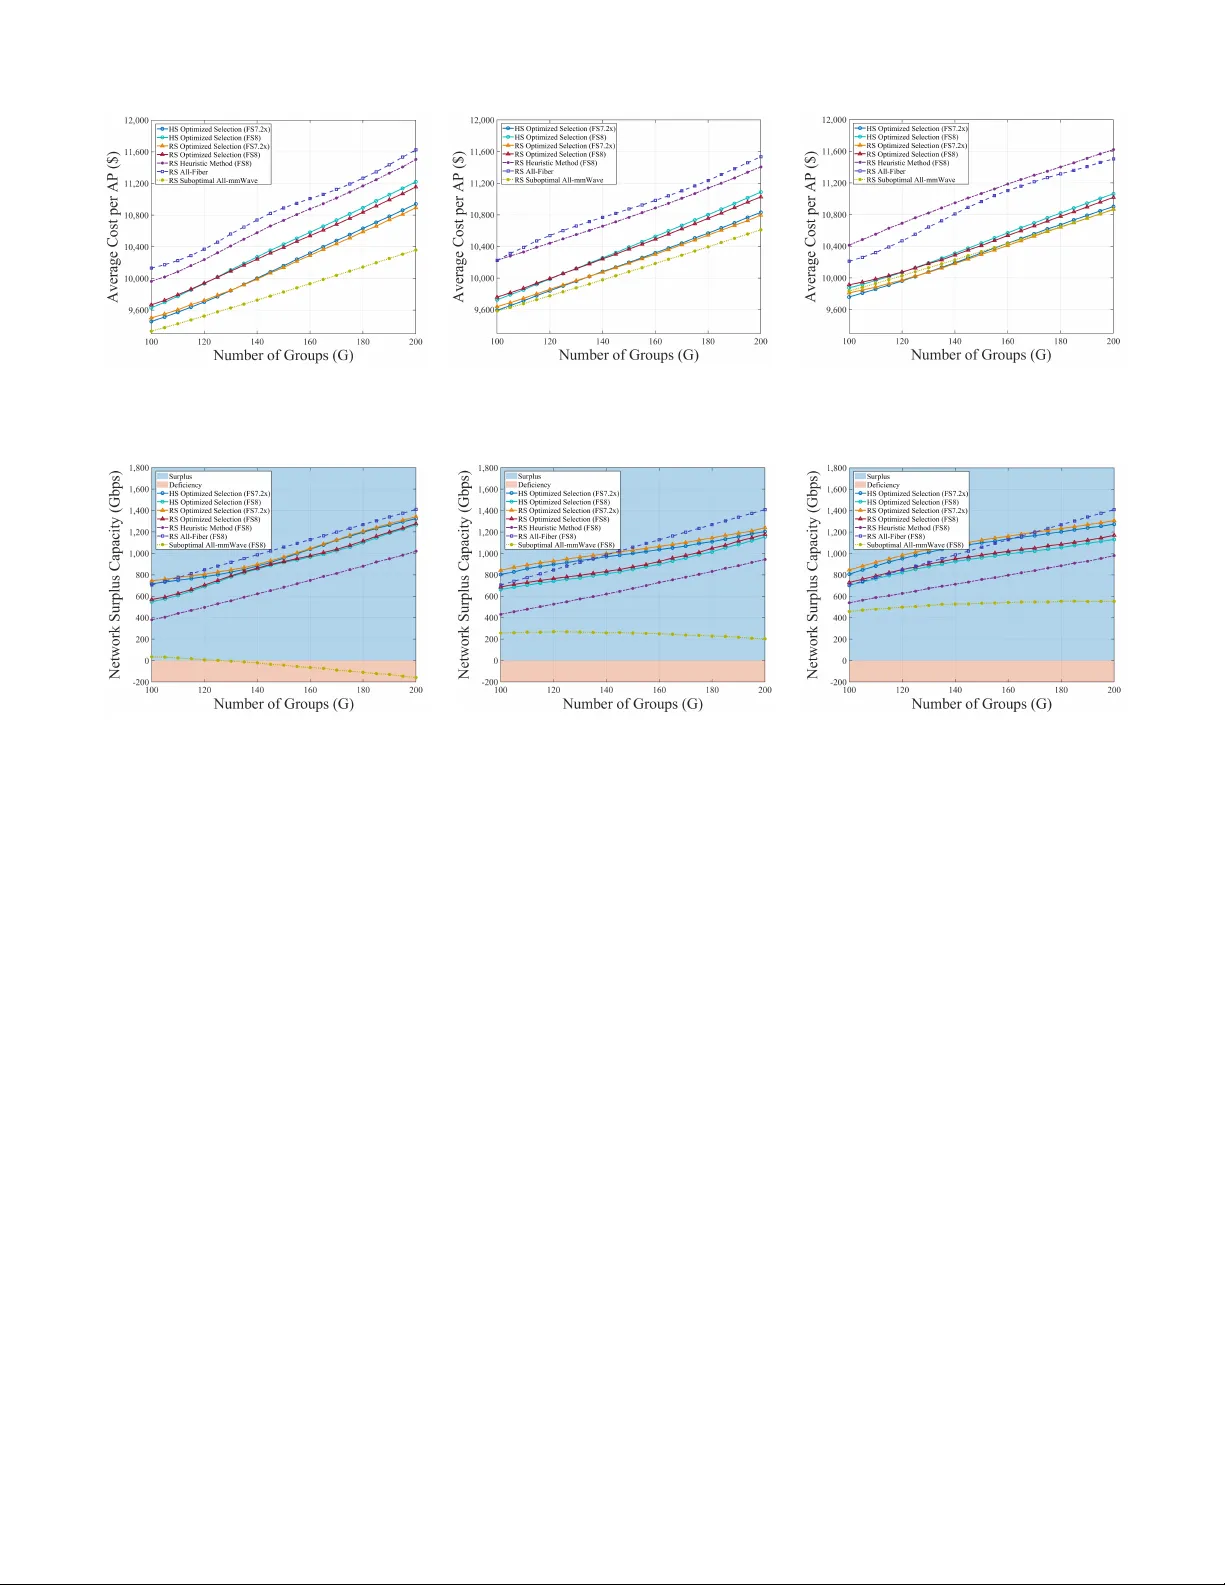
1 Fronthaul Network Planning for Hierarchical and Radio-Stripes-Enabled CF-mMIMO in O-RAN Anas S. Mohammed, Krishnendu S. Tharakan, Member , IEEE , Hussein A. Ammar , Member , IEEE , Hesham ElSawy , Senior Member , IEEE , and Hossam S. Hassanein, F ellow , IEEE Abstract —The deployment of ultra-dense networks (UDNs), particularly cell-free massiv e MIMO (CF-mMIMO), is mainly hindered by costly and capacity-limited fronthaul links. This work proposes a two-tier ed optimization framework f or cost- effective hybrid fronthaul planning, comprising a Near -Optimal Fronthaul Association and Configuration (NOF A C) algorithm in the first tier and an Integer Linear Program (ILP) in the second, integrating fiber optics, millimeter -wave (mmW ave), and free-space optics (FSO) technologies. The proposed framework accommodates various functional split (FS) options (7.2x and 8), decentralized processing levels, and network configurations. W e intr oduce the hierarchical scheme (HS) as a resilient, cost- effective fronthaul solution for CF-mMIMO and compare its performance with radio-stripes (RS)-enabled CF-mMIMO, vali- dating both across diverse dense topologies within the open radio access network (O-RAN) architectur e. Results show that the proposed framework achieves better cost-efficiency and higher capacity compared to traditional benchmark schemes such as all- fiber fronthaul network. Our key findings reveal fiber dominance in highly decentralized deployments, mmW a ve suitability in moderately centralized scenarios, and FSO complements both by bridging deployment gaps. Additionally , FS7.2x consistently outperforms FS8, offering greater capacity at lower cost, af- firming its role as the preferr ed O-RAN functional split. Most importantly , our study underscores the importance of hybrid fronthaul effective planning for UDNs in minimizing infrastruc- tural redundancy , and ensuring scalability to meet current and future traffic demands. Index T erms —Fr onthaul, Planning, Optimization, Ultra-Dense Network (UDN), Cell-Fr ee massive MIMO (CF-mMIMO), Radio- Stripes, mmW av e, Fiber Optics, Free Space Optics (FSO). I . I N T R O D U C T I O N A S mobile networks ev olve to ward beyond-5G (B5G) and 6G, demand for connectivity , high throughput, and ubiquitous cov erage continues to rise [1]. This trend has driv en the adoption of ultra-dense networks (UDNs), such as cell- free massi ve MIMO (CF-mMIMO) and small cells, which rely on dense deployment of Access Points (APs) and Central Processing Units (CPUs) to extend coverage and improve capacity [2], [3]. Unlike small cells, CF-mMIMO employs many simple cooperative APs that simultaneously serve users, A. S. Mohammed is with the Department of Electrical and Computer Engi- neering, Queen’ s Uni versity , Kingston, Canada. E-mail: anas.m@queensu.ca. K. S. Tharakan is with the School of Electrical Engineering and Computer Science, KTH Royal Institute of T echnology , Stockholm, Sweden. E-mail: tharakan@kth.se. H. A. Ammar is with the Department of Electrical and Computer En- gineering, Royal Military College of Canada, Kingston, Canada. E-mail: hussein.ammar@rmc.ca. H. ElSawy and H. S. Hassanein are with the School of Computing, Queen’ s Univ ersity , Kingston, Canada. E-mail: hesham.elsawy@queensu.ca, hossam.hassanein@queensu.ca. removing cell boundaries and ensuring seamless service [4]. Howe ver , the fr onthaul links connecting APs to CPUs remain a major deployment bottleneck, making the design of cost- effecti ve and scalable fronthaul a critical priority for 6G networks [5]. The transition from Distributed RAN (D-RAN) to Cloud/Open RAN (C-/O-RAN) highlights virtualization and functional split options (e.g., FS7.2x), which aim to balance fronthaul capacity and latency requirements [6], [7]. Still, UDNs, particularly CF-mMIMO, face challenges in scalable and cost-efficient fronthaul design [2], [3]. Conv entional wired solutions, such as fiber, provide reliability and capacity b ut entail high costs and poor scalability [8]. Alternativ es like Ericsson’ s radio stripes (RS) offer cost-effecti ve wired serial connections, while wireless options such as mmW a ve and Free-Space Optics (FSO) promise flexibility and fast deploy- ment but remain limited by en vironmental factors and capacity constraints [9]–[11]. In this work, we propose the hierarchical scheme (HS) as an alternativ e fronthaul solution for CF-mMIMO, leveraging a hi- erarchical topology . Similar to the RS scheme, HS significantly reduces the number of required fronthaul links. Howe ver , unlike RS, HS enhances network resilience by eliminating single points of failure inherent in the RS serial connections, while effecti vely addressing architectural limitations in UDNs. Recent studies hav e explored optimizing se veral operational aspects of fronthaul networks for UDNs, specifically for RS- enabled CF-mMIMO systems. For instance, [12] proposed an optimized sequential processing algorithm for RS-enabled CF-mMIMO, enhancing signal-to-interference-plus-noise ratio (SINR) and reducing latency under limited fronthaul capacity . In [13], a geometric programming approach was proposed for the strategic placement and grouping of APs in RS de- ployments, emphasizing the importance of effecti ve network planning. In contrast, [10] explored mmW ave fronthaul for RS-enabled CF-mMIMO, demonstrating its potential capacity for UDN deployments. Nevertheless, these studies predom- inantly focus on isolated performance dimensions, ne glect- ing fronthaul deployment cost, scalability , and infrastructural constraints, which are critical considerations to wards realizing cost-effecti ve and resilient UDNs [2], [14]. Motiv ated by these limitations, we aim to answer the following question: Ho w can we architect a scalable, cost- efficient, resilient, and high-capacity fronthaul infrastructure that supports practical CF-mMIMO deployments in future UDNs? T o address this question, we in vestigate the feasibility and economic viability of an optimized HS and RS-enabled 2 hybrid fronthaul network that integrates both wired and wire- less technologies, namely , fiber optics, mmW av e and FSO. W e show that exclusi ve reliance on single-technology deployment does not meet the cost-effectiveness and performance needed for UDNs. Our primary objecti ve is to minimize the T otal Cost of Ownership (TCO) of the fronthaul network while ensuring compliance with critical metrics. Our frame work supports div erse UDN scenarios, including small cells [14], and CF- mMIMO systems with RS or HS topologies, adhering to contemporary RAN architectures. It accommodates various decentralized processing lev els, FS options, and AP groupings, offering actionable insights for Service Providers (SPs) on cost-efficient, high-capacity and resilient UDNs deployment. The main contributions of this paper are outlined as follows: • W e propose a two-tiered hybrid fronthaul design for UDNs through a) developing a Near-Optimal Fronthaul Association and Configuration (NOF A C) algorithm for the first tier, and b) formulating an Integer Linear Pro- gram (ILP) for the second tier . The proposed frame- work accommodates various fronthaul network connec- tion schemes such as P2P small cells, along with HS and RS-enabled CF-mMIMO within the O-RAN architecture. • W e formulate and solve an ILP optimization framework that minimizes fronthaul TCO, while satisfying Quality of Service (QoS) metrics, including reliability , individual link and overall network capacities, along with fronthaul technology-specific component requirements. • W e analyze key network parameters, including varying the number of deplo yed CPUs, APs groups, homogeneous and non-homogeneous FS fronthaul rates for FS option 7.2x (FS7.2x) and FS option 8 (FS8), capturing practical factors affecting cost and performance. These include association distances, FS capacity thresholds, and trade- offs between group sizes and TCO. • W e evaluate the proposed frame work against multiple planning benchmarks, including traditional all-fiber fron- thaul. W e also assess the deployment resilience of both HS and RS-enabled CF-mMIMO connection topologies. This paper thus addresses a critical research gap by pre- senting a r obust fr onthaul planning framew ork for UDN and CF-mMIMO deployments. The remainder of the paper is organized as follows: Section II describes the system model, FS options fronthaul rates, and channel models for the can- didate fronthaul technologies. Section III details the fronthaul network design to construct a NOF A C HS and RS-enabled CF- mMIMO. Section IV presents the proposed two-tier fronthaul TCO optimization. Section V discusses the numerical results, highlighting the cost and performance effecti veness of the proposed framework. Finally , Section VI concludes the paper . I I . S Y S T E M M O D E L F O R H Y B R I D F RO N T H AU L N E T W O R K S This section presents the system model and key network components inv olved in building a hybrid fronthaul network for RS- and HS-enabled CF-mMIMO systems. W e determine fronthaul capacity requirements and the channel models used to evaluat e the achiev able capacities of the candidate fronthaul technologies. T o align with modern RAN architectures, we adopt the O-RAN and C-RAN terminologies, where the CPU is referred to as the Distributed Unit (DU) henceforth [6], [7]. A. Hybrid F r onthaul Network Arc hitectur e W e consider a hybrid fronthaul network comprising APs, DUs, and fronthaul links that le verage either fiber , mmW ave or FSO. Without loss of generality , we model the deployment area as a tw o-dimensional square region of size R × R m 2 , con- taining L APs that are randomly distributed following a uni- form spatial distribution, given by the coordinates ( x ℓ , y ℓ ) ∼ U (0 , R ) for ℓ ∈ L = { 1 , 2 , . . . , L } . T o emulate actual deploy- ment perturbations, we consider multiple spatial realizations of APs. Initially , we employ the K-Means Clustering (KMC) algorithm to group nearby APs, constructing G preliminary groups. Grouping of APs is a critical step for both HS and RS- enabled CF-mMIMO topologies, where each group is denoted by G i ⊆ L , for i = 1 , 2 , . . . , G , and the number of all APs in a group i is denoted by L G i . Furthermore, each group G i is associated with one of W distributed DUs based on proximity . These DUs, index ed by w ∈ W = { 1 , 2 , . . . , W } , are responsible for serving several APs groups. In RS, and as described in the early RS antenna arrangement patent [9], APs within a group are connected serially via a shared wired fronthaul infrastructure. Specifically in this work, all APs within the same group G i utilize a common intra- group fiber link to receiv e data streams from their serving DU, rather than each AP requiring a dedicated P2P link. This interpretation is strictly at the group lev el and does not imply that all APs in the network are connected through a single global fiber link. T o reduce signaling overhead, a single AP is designated as the leading AP in each group. This AP , selected as one of the terminal points of the stripe, establishes a direct communication link with its serving DU via either a wired or wireless fronthaul connection [10], [15], as illus- trated in Figure 1b. The leading AP processes and forwards fronthaul signals to other APs in the stripe, referred to as non- leading APs , through the shared fronthaul infrastructure [10], [12], [15]. This setup diver ges from con ventional small-cell architectures, which rely on dedicated P2P fronthaul links as depicted in Figure 1a. W e extend the concept of RS to the HS configuration shown in Figure 1c, where the serial connection is replaced by a hierarchical topology . In this configuration, the leading AP is the one having the highest number of connection degrees, i.e., it has the lar gest number of dependent non- leading APs. Efficient deplo yment of fronthaul technologies requires careful consideration of their unique components. For fiber- based fronthaul, the hardware needed for a typical W av elength- Division Multiplexing Passi ve Optical Netw ork (WDM- PON) includes fiber cables, Optical Add-Drop Multiplex ers (O ADMs) and Optical Network Units (ONUs) integrated with each AP ℓ , along with the Optical Transport Network (O TN) colocated at each DU w . O TNs manage optical signals from multiple ONUs and employ components such as splitters, multiplex ers (MUXs), and Optical Line T erminals (OL Ts) to aggregate signals [16]. On the other hand, the antenna configuration in mmW av e-based fronthaul influences the net- work model. For simplicity , we assume that all APs utilizing 3 (a) Small cells network. (b) RS-enabled CF-mMIMO network. (c) HS-enabled CF-mMIMO network. Fig. 1: Illustration of the different fronthaul topologies employed for UDNs schemes; (a) Con ventional small-cell architecture with dedicated P2P fronthaul links, (b) RS topology and (c) HS topology . mmW av e fronthaul ha ve a single antenna (i.e., N AP = 1 ), while DUs are equipped with N DU antennas. In contrast, FSO-based fronthaul uses P2P links, with each AP having a dedicated transceiv er paired with its associated DU, ensuring single transmission and reception points. W e also assume that all APs within a group cooperate to pro vide spatial di versity for jointly-served users. That is for e very group of APs G i , all APs need to recei ve a copy of the same message from their serving DU, hence, eliminating the need for transmitting user-specific data to each AP indi vidually . Instead, the same message receiv ed by leading APs is shared among all APs in the group, thereby simplifying fronthaul processing. Given the ultra-dense nature of the network components deployment, line-of-sight (LoS) connectivity between APs and DUs in wireless fronthauling is assumed. Consequently , wireless relays and repeaters are excluded from consideration, as unobstructed connections are deemed achie vable. W e assume uncompressed fronthaul to isolate cost- performance tradeoffs between transmission technologies and av oid introducing codec-specific variability , FS options trade- offs, technology-specific or transport medium limitations, as these could be additional metrics for comparison affecting the fronthaul rates (e.g., µ -law and Block Floating Point (BFP) compression techniques, free space and fiber transport mediums, etc). Fronthaul compression is typically considered in specific scenarios rather than general infrastructure-lev el planning, and our analysis ensures a conservati ve estimate of fronthaul demands and preserves generality without biasing tow ard a specific compression method. B. FS-Options Capacity Requir ements FS7.2x and FS8 are regarded as key candidates in B5G networks, due to their alignment with O-RAN architecture, [7], [17]. W e introduce a fronthaul data rate threshold, denoted as ψ , to specify the minimum fronthaul capacity required for each AP , which will guide the optimization process and selection of appropriate fronthaul technologies. T ABLE I lists the capacity requirements for FS8 and FS7.2x under standard 5G NR numerology 0 system configuration. This configuration is one of several possible numerologies defined by 5G NR, where numerology 0 and 1 correspond to a subcarrier spacing of 15 kHz and 30 kHz, respectiv ely , with both commonly Fig. 2: Distribution of processing tasks in FS7.2x and FS8. implemented in 5G systems. While these v alues may resemble L TE parameters, they are fully compliant with 5G NR as per 3GPP TS 38.211 (Release 18) [18]. W e emphasize that our choice of numerology does not af fect the solution design for fronthaul deployment, as subcarrier spacing ∆ f only changes the frame structure and symbol timing, b ut not the ov erall data rate or required fronthaul capacity , which remains dependent on bandwidth and antenna configuration. Specifically , the system employs Orthogonal Frequency-Di vision Multiplexing (OFDM), a widely used modulation scheme in L TE and 5G systems, expected to be present in B5G networks [17]. Key parameters include OFDM symbol duration T symbol , sampling frequency f s , and the quantization bit-width N bits , which denotes the number of bits per in-phase (I) and quadrature (Q) components. W e assume that the access channel between users and APs is modeled as a block-fading channel, with each coherence block comprising τ c time-frequency OFDM samples [17]. The a vailable bandwidth B is divided into N DFT subcarriers using the Discrete Fourier Transform (DFT), with N used effecti ve subcarriers for data transmission and N null reserved for guard bands. The number of AP antennas on access channel, N ac AP , is distinct from those used for mmW av e fronthaul, N AP . 4 1) Functional Split 8 (FS8) The lowest layer split is defined as FS8, which is the PHY - RF split option aimed at fully benefiting from the efficient processing capabilities at the DUs, Centralized Units (CUs) and Cloud, while reducing APs complexity . As sho wn in Fig- ure 2, APs in FS8 only perform RF processing and recei ve ra w , time-domain, quantized baseband signals from DUs through the fronthaul, leading to high fronthaul capacity requirements. For FS8, we assign each AP ℓ with the minimum required fronthaul capacity as follows [17]: ψ FS8 = 2 × N bits f s N ac AP . (1) It is important to note that N bits in equation (1) refers to the bit-width per component (I or Q), and the multiplication factor of 2 accounts for both. Thus, the total bits per complex I/Q sample in our formulation equals 2 × N bits . 2) Functional Split 7.2x (FS7.2x) Similarly , FS7.2x assigns part of the intra-PHY functions to be processed at the APs, while the remaining high-PHY functions are shifted to the DUs, as shown in Figure 2. FS7.2x strikes a balance between AP complexity and fronthaul bandwidth, making it ideal for scalable O-RAN deployments in dif ferent UDNs schemes. Specifically , APs only recei ve the effecti ve subcarriers ( N used ) from DUs, leading to APs performing additional low-PHY functions, hence, lowering the fronthaul capacity requirements compared to FS8. The required fronthaul capacity in FS7.2x is [17]: ψ FS7.2x = 2 × N bits N used N ac AP T symbol . (2) Note that (1) and (2) provide a baseline estimation of fronthaul data rate requirements under FS8 and FS7.2x op- tions, following the widely used formulations in [17]. These expressions primarily capture the user -plane data transfer . In practical systems, additional ov erhead from control signaling, CSI exchange, synchronization, and protocol encapsulation may further increase the fronthaul load, which we will account for ne xt. The v alues listed in T able I assume each AP operates at full load, serving the maximum expected user throughput. This worst-case planning approach, widely adopted in network design, ensures rob ustness under peak demand conditions. Consequently , our fronthaul deployment decisions are shaped by user traffic indirectly , through strict capacity constraints applied in the optimization frame work. This approach is consistent with UDN/CF-mMIMO literature, where dense and uniform user demand is a standard modeling assumption [2], [17]. 3) Non-Homogeneous T raf fic and the Contr ol Plan Equations (1) and (2) define a minimum required fronthaul capacity for any AP assuming a homogeneous spatial traf fic scenario, in which mobile operators assign this value for ev ery AP in the network. In contrast, mobile operators can use a non-homogeneous spatial traffic scenario, where the expected traffic is determined based on a data traffic survey . In this scenario, each leading-AP ℓ ∈ M w has a different minimum required fronthaul capacity that is defined as [14]: ψ FS[8,7.2x] ℓ = f traf . ( x ℓ , y ℓ ) , (3) where f traf . ( · ) is the traffic-a ware fronthaul capacity needed in the area centered on ( x ℓ , y ℓ ) which is the location of the T ABLE I: OFDM-based standard parameters v alues for 5G NR numerology 0, and the required fronthaul capacity for FS8 and FS7.2x. Configuration Parameters for 5G NR Numerology 0 Bandwidth ( B ) 20 MHz Sampling Frequency ( f s ) 30 . 72 MHz Subcarrier Spacing ( ∆ f ) 15 kHz Symbol Duration ( T symbol ) 66 . 67 µs T otal Number of Subcarriers ( N DFT ) 2048 Effecti ve/Used Number of Subcarriers ( N used ) 1200 Quantization Bits ( N bits ) 12 Number of Access Antennas per AP ( N ac AP ) 4 FS8 Required Capacity ( ψ FS8 ) 2 . 95 Gbps FS7.2x Required Capacity ( ψ FS7.2x ) 1 . 73 Gbps leading-AP ℓ ∈ M w . Adding control plane traffic for the equations in (1) and (2) can be a very in v olved task. Interestingly , we can add an ov erhead term that accounts for the control plane. According to ORAN technical report [19], there is a defined typical control plane that is sent on the fronthaul which includes PRA CH channel I-Q data, scheduling and beamforming commands, configuration parameters and request, A CK/N ACK message, and other signals. W e account for these messages that represent the control plane as a factor proportional to the data plane by defining the following: ψ FS8, CP = 1 + α FS8, ovh ψ FS8 , (4) ψ FS7.2x, CP = 1 + α FS7.2x, ovh ψ FS7.2x , (5) where α FS8, ovh , α FS7.2x, ovh ∈ [0 , 1] , and represent the amount of ov erhead introduced by the control plane. In our results, we will account for this control plane traffic using a safety margin that is calculated through surplus. W e will illustrate this point in the results section. C. F iber-Based F r onthaul Link Capacity Due to the short distances between network elements in CF- mMIMO and the high efficienc y of fiber optics, we assume lossless fronthaul links with a constant capacity denoted by R Fiber wℓ . W e consider employing a 10 Gbps-capable symmetrical (XGS) WDM-PON, providing equal UL and DL data rates while accommodating ev olving capacity demands. WDM- PON supports multiple wav elengths and is expected to remain a key solution for fronthaul/backhaul networks [16]. Con- sequently , each AP with a fiber-based fronthaul link has a constant capacity R Fiber wℓ of 10 Gbps. D. mmW ave-based F r onthaul Link Capacity For mmW a ve, we adopt 3GPP 38.901 Urban Microcell street canyon (UMi-SC) model to characterize both LoS and Non-Line-of-Sight (NLoS) propagation, modeling the down- link (DL) performance from DUs to APs [20]. SPs typically optimize terrestrial network fronthaul by lev eraging the static positioning of APs and DUs to maintain LoS conditions during wireless fronthaul planning. Thus, LoS parameters are 5 distance-based, while NLoS parameters, including the number of paths P ∼ U [1 , 6] and angle-of-departure θ p ∼ U [ − π 2 , π 2 ] , are randomly selected based on discrete uniform distrib ution to account for possible reflections [10]. Accordingly , the path loss for both LoS and NLoS scenarios is e xpressed respecti vely as follo ws: PL LoS wℓ, dB = 32 . 4 + 21 log 10 ( d wℓ ) + 20 log 10 ( f c ) + S LoS , (6) PL NLoS wℓ, dB = 32 . 4 + 31 . 9 log 10 ( d wℓ ) + 20 log 10 ( f c ) + S NLoS , (7) where f c is the carrier frequency in GHz and d wℓ denotes the distance between AP ℓ and its serving DU w in meters. While S LOS ∈ N (0 , σ 2 LoS ) and S NLoS ∈ N (0 , σ 2 NLoS ) are the shadowing terms modeled as Gaussian random variables with zero mean and standard deviation of 4 and 8.2 dB, respectively [20]. Moreover , let h w ℓ ∈ C N DU be the frequency-domain channel between the ℓ -th AP and its serving w -th DU, and is expressed as the sum of LoS and NLoS components: h wℓ = h LoS wℓ + h NLoS wℓ . (8) Before transmission to APs, DUs adopt analog beamform- ing with a network of quantized phase shifters to compute the beamforming vectors, approximating ZF beamforming to mitigate interference and focus the transmitted signal toward the intended APs [10]. The assumption of quantized phase shifters is for satisfying the practical constraints of mmW a ve, which means that the beamforming vector f wℓ could only be selected from a certain set of vectors F , thus, f wℓ ∈ F . That is if ev ery phase shifter has q quantization bits, then we will have 2 q phase shift values defined by the discrete set Q = { 0 , π 2 q , . . . , (2 q − 1) π 2 q } . Hence, the set of all possible beamforming vectors for any DU is expressed as [10]: F = ( e j ϕ 1 ...e j ϕ N DU T N DU ; ϕ i ∈ Q , ∀ i ∈ { 1 , .., N DU } ) , (9) and the fronthaul signal received at AP ℓ is given as: r mmW ℓ = q p mmW t h T wℓ f wℓ ς wℓ + W X w ′ =1 , w ′ = w L X i =1 , i = ℓ q p mmW t h T w ′ i f w ′ i ς wi | {z } interference + n ℓ , (10) where p mmW t is the normalized fronthaul transmission po wer , n ℓ ∽ N C (0 , σ 2 ) is the receiver (RX) noise at the ℓ -th AP , and ς wℓ ∈ C is the signal transmitted from the w -th DU to AP ℓ with E {| ς wℓ | 2 } = 1 . Gi ven the relati vely lar ge distances between APs and non-serving DUs, combined with our use of beamforming, inter-DU interference is assumed negligible. Consequently , we focus on the Signal-to-Noise Ratio (SNR) to determine the actual rates of the mmW a ve link. Therefore, the SNR at AP ℓ and the corresponding mmW av e fronthaul link capacity can expressed as follo ws: SNR ℓ = p mmW t h T wℓ f wℓ 2 σ 2 , (11) R mmW wℓ = BW mmW log 2 (1 + SNR ℓ ) . (12) Remark 1: Although analog beamforming with quantized phase shifters may not exactly replicate ZF performance leading to an imperfection in canceling interference, it remains effecti ve in focusing energy toward serving APs and attenuat- ing unintended directions, particularly under LoS or dominant- path channel conditions, as assumed in our fronthaul model. In practice, DUs and APs are statically positioned as part of a planned deployment, enabling precomputed beam directions and stable LoS-dominant channels. Additionally , the usage of mmW ave frequencies limits the range of communication and hence interference. These factors make the assumption of negligible inter-DU interference stronger . Motiv ated by this, we use SNR for our performance ev aluation for the mathematical tractability advantage. In an actual deployment with static fronthaul scenario, mobile operators can relax our assumption by setting a tar get network surplus capacity (Figure 8). E. FSO-Based F r onthaul Link Capacity FSO has been proposed as a viable communication so- lution for fronthaul and backhaul, demonstrating suf ficient av ailability and data rates ov er long distances [11], [21], [22]. Nev ertheless, FSO technology remains severely affected by en vironmental conditions, where losses such as scattering, turbulence, scintillation, geometrical spreading, and optical inefficiencies can jeopardize its reliability . Scattering occurs when the FSO beam interacts with atmospheric particles, and expressed as [21]: L sca = 4 . 34 3 . 91 V λ 550 − δ ! d wℓ 1000 , (13) where L sca is the scattering loss in dB, V is the visibility range in km, λ is the signal wav elength in nm, and δ is a visibility-dependent constant gi ven as δ = 0 . 585 V 1 / 3 , for V < 6 km [21]. Additionally , atmospheric turbulence losses are caused by variations in the refractive inde x structure parameter C 2 n ( h ) of the atmosphere at altitude h , measured in m − 2 / 3 , and transiently af fected by wind speeds [22]. During the planning stage, an average value for the refractive index structure parameter for moderate turbulence is 10 − 15 m − 2 / 3 , as considered in [22]. Scintillation loss, denoted as L sci , is caused by the rapid fluctuations in light intensity when it propagates through a turbulent atmosphere, and the resultant attenuation in dB is given by: L sci = 2 s 23 . 17 2 π λ 10 9 7 6 C 2 n ( h ) d 11 6 wℓ . (14) Finally , geometrical losses L geo result from light spreading ov er a larger area. Assuming circular mirrors at both TX and RX, the geometrical loss in linear scale is [21]: L geo ≈ r r ( θ t d wℓ 2 ) ! 2 , (15) where r r is the RX aperture radii in meters, and θ t is the div ergence angle of the transmitter (TX) in radians. Several assumptions are made before deriving the achie vable data rate for FSO links ( R FSO wℓ ). Due to the short APs-DUs distances, an av erage visibility range of V = 0 . 4 km is assumed. A study in Berlin, Germany [23] shows that visibility drops below 0.4 km only 0.25% of the year , resulting in an average FSO link av ailability of 99.75% ( ζ FSO = 0 . 9975 ). Consistent with the assumptions made in [21], we consider LoS FSO transmission. 6 (a) Initial RS network deployment. (b) Final optimized associations. Fig. 3: Sample realization of the optimized RS network. (a) Initial HS network deplo yment. (b) Final optimized associations. Fig. 4: Sample realization of the optimized HS network. Under moderate fog conditions, fog loss is calculated as L fog = 20 . 99 d wℓ dB, where d wℓ is the distance in km between the AP and its associated DU [21]. Lastly , a 10 dB loss ( L rain ) is included to account for rain and other worst-case scenarios. Therefore, total atmospheric losses are expressed as: L atm dB = ( L sca + L rain + L fog + L sci ) dB . (16) The rate for the FSO link between DU w and AP ℓ is [21]: R FSO wℓ = p FSO t η t η r r 2 r L atm E p N b ( θ t d wℓ 2 ) 2 , (17) where p FSO t is the transmit power , L atm is the atmospheric losses in linear scale, η t and η r are the optical losses caused by imperfections in optical TX and RX, respectively . E p is the photon ener gy expressed as E p = h p c λ , where h p = 6 . 625 × 10 − 34 J-s is Max Planck’ s constant, and N b is the RX sensiti vity in photons/bit. I I I . H I E R A R C H I C A L A N D R A D I O - S T R I P E S - E NA B L E D C F - M M I M O N E T W O R K C O N FI G U R A T I O N T o simplify the problem formulation for selecting optimal fronthaul technologies, and without any loss of practicality , a br ownfield deployment scenario is assumed. In this scenario, the locations of APs are assumed to be predetermined by SPs according to the specific coverage and economic requirements. In this section, we introduce NOF A C, an iterati ve algorithm that minimizes inter-APs distances, balances cluster formation, efficiently deploys DUs, and achiev es a Near -Optimal Fron- thaul Association and Configuration (NOF A C) . A. Pr eliminary Network Construction Methodology The spatial density and geographic positioning of APs in- fluence the grouping process, ensuring that APs in close prox- imity are grouped together to minimize inter-AP distances, fronthaul costs, and latency [8], [10]. T o mitigate limitations of basic KMC, which generates G preliminary AP groups of irregular sizes, initial clusters are refined by applying Split- Merge Rules (SMR) based on predefined system parameters, namely: split ( g s ) and merge ( g m ) thresholds, defining the maximum and minimum permissible number of APs per group, respecti vely . Follo wing the initial clustering, groups exceeding the max- imum permissible size ( L G i > g s ) are split into smaller clusters. Con versely , groups smaller than the minimum al- low able size ( L G i < g m ) are merged with adjacent groups, provided the resulting group size does not exceed g s (i.e., g s < L G i < g m ). These refinement steps ensure that all groups maintain a balanced number of APs, balanced groups sizes, eliminating oversized and undersized clusters of both HS and RS-enabled CF-mMIMO networks construction. The sets of all APs and groups associated with DU w are represented by L w ⊆ L , and G w ⊆ L w , respecti vely . B. Constructing Radio-Stripes-Based CF-mMIMO Network After refining the AP groups, APs within each group G i for in RS are connected in a serial topology to minimize the total inter-AP distances. This inv olves identifying a sequence of APs that forms the lo west total traversal path, which is analogous to the T raveling Salesmen Problem (TSP). For smaller groups with L G i ≤ L max , where L max is a system pa- rameter ensuring that the factorial complexity ( L G i ! ) remains computationally tractable, the TSP is solved optimally using brute-force search across all APs permutations. Nev ertheless, when L G i > L max , we use the alternativ e Nearest Neighbor (NN) algorithm as a computationally efficient approximation. Thus, a practical approach to minimize the overall serial connection distance between the same-group APs is done through the mix use of TSP and NN algorithms. The process for groups with L G i ≤ L max begins by computing the pairwise distances between all APs in a group G i . The path with the minimal total distance is then selected as follows d RS G i = arg min π ∈P L π , ∀ i = 1 , 2 , . . . , G, (18) where L π represents the total path length of a permutation π , and P is the set of all possible paths. If the number of APs in a cluster exceeds L max , NN algorithm is applied with multiple starting points to improv e the chances of approximat- ing the optimal solution. Follo wing the construction of RS, we deploy W DUs with their placement initially optimized using KMC, ensuring proper association planning between DUs w = 1 , 2 , . . . , W and APs groups G i = 1 , 2 , . . . , G based on proximity to groups centroids. This approach ensures that each group is fully assigned to a single DU, as sho wn in Figure 3a. From each group G i , a leading AP ℓ i is selected from the stripe endpoints, prioritizing the AP closest to the DU to minimize the total association distance. Since DU positions and leading AP selections are interdependent, Algorithm 1 implements NOF A C, which attempts to minimize the total association distance while maintaining effecti ve AP-DU asso- ciations through updating DU positions, re-assigning leading APs, and re-iterating over the previous steps. Con ver gence is 7 achiev ed when the maximum movement of an y DU w between iterations falls below a predefined threshold ϵ : max w ∥ µ new w − µ old w ∥ < ϵ, ∀ w ∈ W , (19) where µ new w and µ old w represent the updated and pre vious positions of DU w , and ϵ is a very small positive number . If the con vergence condition is not met, the process restarts. The final positions of the DUs and the selection of leading APs forming the final RS-based CF-mMIMO network are depicted in Figure 3b. After con vergence, each DU w is assigned a set of leading APs M w and non-leading APs A w , with corresponding sizes M w and A w , such that M w , A w ⊆ L w . Although Algorithm 1 is a heuristic procedure, it includes a well-defined con ver gence condition, i.e. (19) based on the stabilization of DU placements. Giv en the finite number of APs and the deterministic refinement rules applied to the groupings, the algorithm consistently con ver ges within a small number of iterations. C. Constructing Hierar chical-Based CF-mMIMO Network The HS-enabled CF-mMIMO network construction builds on the principles employed in the RS network described in Section III-B. Howe ver , instead of using serial connections, the APs within each group G i are connected in a hierarchical topology to minimize inter-AP distances using Minimum Spanning T ree (MST) algorithm. This graph-theoretic ap- proach ensures cost-effecti ve connectivity between APs [24]. Each group G i is represented as a complete weighted graph G i = ( V i , E i ) , where V i is the set of APs (vertices) in group G i , and E i represents the set of links (edges) connecting every pair of APs in a group. Thus, the weight of each link e j k ∈ E i is calculated as the Euclidean distance between APs j and k . The MST for each group G i is constructed by minimizing the total edge weight of the tree as follows: d MST G i = min T i ⊆G i X e j k ∈T i w j k , ∀ i = 1 , 2 , . . . , G, (20) where d MST G i is the total weight (i.e., total distance) of the MST for group G i , and T i is the MST of group G i , which is a subgraph of G i that connects all APs with the minimum possible total link distances. The MST problem in (20) can be optimally computed using Prim’ s or Kruskal’ s algorithm [24], with the resulting HS illustrated in Figure 4a. Then, a similar process to the RS construction steps in Section III-B is followed to deploy W DUs. The leading AP from each group G i is chosen as the node with the highest number of edges connected to it, which reflects the number of neighboring APs in the tree. In cases of tie, the AP nearest to the DU is selected to minimize association distance, with remaining APs classified as non-leading. The positions of DUs and selection of leading APs are iteratively optimized following the NOF A C approach in Algorithm 1, and the process repeats until con ver gence is achiev ed as per equation (19). I V . F RO N T H AU L T C O O P T I M I Z A T I O N F O R M U L AT I O N This section presents the planning and cost optimization of the fronthaul network for HS and RS-based CF-mMIMO schemes. The objectiv e is to minimize the TCO while ensuring Algorithm 1 NOF A C: For a near-optimal HS and RS-based CF-mMIMO fronthaul network association and configuration. 1: Input: W , L , G , ϵ , L max , g s and g m . 2: Initialization: 3: Uniformly distribute L APs. 4: Construct G initial AP groups ( G initial = {G 1 , G 2 , . . . , G G } ) using KMC. 5: Deploy W DUs using KMC ( µ initial ). 6: µ old w ← µ initial w ∀ w ∈ W ; 7: while true do 8: for ∀ w ∈ W do 9: for ∀ i ∈ G w do 10: if L G i > g s then 11: Split group G i . 12: else if L G i < g m then 13: Merge group G i with the nearest group. 14: else 15: Skip G i . 16: end if 17: if RS-enabled CF-mMIMO network, then 18: if L G i ≤ L max then 19: Apply TSP . 20: else 21: Apply NN. 22: end if 23: Compute d RS G i = arg min π ∈P L π . 24: else ▷ HS-enabled CF-mMIMO network 25: Construct MST for G i . 26: Compute d MST G i = min T i ⊆G i P e j k ∈T i w j k . 27: end if 28: end for 29: end f or 30: Assign Leading APs ( M w ). 31: Refine DUs positions using KMC ( µ new w ). 32: if max w ∥ µ new w − µ old w ∥ < ϵ, ∀ w ∈ W then 33: Break 34: else 35: µ old w ← µ new w ∀ w ∈ W ; 36: end if 37: end while 38: Output: µ new w , L w , G w , M w , A w ∀ w ∈ W , and G i , L G i , d RS G i or d MST G i ∀ i = 1 , 2 , . . . , G . optimal fronthaul technology selection. Our formulation starts by incorporating critical information, including the locations of APs and DUs, APs-DUs clusters ( L w ) and distances ( d wℓ ), the effecti ve capacities of leading APs for all fronthaul tech- nologies ( R Fiber wℓ , R mmW wℓ , and R FSO wℓ ), alongside the outputs of NOF A C in Algorithm 1. W e consider L TE-based functional split options 8 and 7.2x for capacity requirements as defined in Section II-B, collectiv ely represented as ψ FSX , where X denotes either 7.2x or 8. This optimization model employs a two-tiered approach to minimize TCO, encompassing both operational (OPEX) and capital expenditures (CAPEX), with OPEX av eraged ov er a fixed deployment period N period . 8 A. T ier 1 Optimization The first tier of optimization focuses on minimizing the deployment cost the shared fiber fronthaul infrastructure that consists of ONUs/OADMs and fiber cables per meter for the set of non-leading APs ( A w ), while masking leading APs ( M w ) in e very group. This has been addressed by NOF A C in Algorithm 1, by optimizing the grouping of APs and minimizing the pairwise connection distances d RS G i and d MST G i between all APs in a group G i . F ollowing the traditional construction of RS [9], [10], we assume that all APs in a group are connected via fiber cables, with each AP equipped with an ONU and an O ADM to facilitate signal transmission and con version from electrical to optical ov er a stripe. At each AP in a group, one signal is dropped using O ADMs and inserted to a receiving ONU. For all the set of non-leading APs ( A w ) associated with DU w , the incurred costs comprise the ONU cost ( C ONU ), which incorporates the O ADM cost, installation cost, O&M costs ov er N period years, collectiv ely represented as C Fiber ℓ . Considering that both the HS and RS systems were optimized in Sections III-A, III-B and III-C, the TCO for Tier 1 remains constant at this stage, where X refers to either RS or MST , and it can be expressed as: C A T 1 = W X w =1 A w C ONU + G X i =1 η Fiber d X G i . (21) B. T ier 2 optimization The second tier of optimization focuses exclusiv ely on optimizing the fronthaul links between leading APs ( M w ) and their associated DUs. W e formulate a unique objecti ve function for each candidate fronthaul technology to minimize the TCO of the fronthaul network by accounting for both OPEX and CAPEX of each technology , where CAPEX is further divided into deployment costs per AP ( C ℓ ) and DU ( C w ). Fiber -based Fronthaul: For e very leading AP ℓ utilizing fiber , the incurred costs comprise the ONU cost ( C ONU ), which incorporates the OADM cost, installation cost, O&M costs over N period years, collectively represented as C Fiber ℓ . Additionally , the cost of trenching and burial of fiber cables per meter is giv en by η Fiber . At the DU side, the OTN cost associated with DU w serving fiber-connected leading APs is denoted by C Fiber w . This includes the necessary colocated infrastructure at the DU to facilitate fiber-based fronthaul, such as MUXs, OL Ts, etc. Therefore, the TCO for fiber-based fronthaul is expressed as: C Fiber = W X w =1 M w X ℓ =1 C ONU + N period C Fiber O&M | {z } C Fiber ℓ + η Fiber d wℓ + W X w =1 C OL T + C O TN + C Other | {z } C Fiber w . (22) mmW ave-based Fronthaul: For mmW a ve-based fronthaul, the TCO per leading AP connection, including annual power consumption, installation, and O&M costs, is denoted by C mmW ℓ . On the other hand, each DU that serves mmW ave- based leading APs will hav e a massiv e MIMO antenna device with N DU elements, with its cost denoted by C mmW w . Hence, the TCO for the mmW ave-based fronthaul is giv en by: C mmW = W X w =1 M w X ℓ =1 C mmW -RX ℓ + N period C mmW O&M | {z } C mmW ℓ + W X w =1 C mmW w . Remark 2: The DU cost C po ol DU used in this study reflects a pooled compute infrastructure model rather than standalone edge units. This cost is fixed at $91,035 based on FCC estimates [25], and includes shared resources such as cooling, power , and rack space. While our model does not e xplicitly scale cost with the number of connected APs or implement load-aware pooling, it captures the trade-of f between central- ized and distributed computing by simulating scenarios with different numbers of DU pools (ranging from 2 to 12). This setup enables analysis of centralization impact on cost and fronthaul deployment. Future work may incorporate dynamic, load-dependent pooling models to more precisely capture cloudification ef ficiency . FSO-based Fronthaul Network TCO: In FSO-based fron- thaul, we focus on P2P FSO transmission with dedicated TXs and RXs. Simply , for every leading AP that uses FSO, we hav e a reserved exclusi ve link and equipment, and we could aggregate these costs into a single term C FSO , representing the average cost of deployment for ev ery group G i with its leading AP utilizing FSO for fronthauling. Hence, the TCO for FSO-based fronthaul links can be expressed as follows: C FSO = W X w =1 M w X ℓ =1 C FSO ℓ + C FSO install + N period C FSO O& M + C FSO w | {z } C FSO . (23) Final Objective Function: By combining the TCO of all fronthaul technologies (Fiber , mmW av e, and FSO), the final joint cost objective function can be expressed as follows: g o ( x , z , u , v , κ ) = W X w =1 M w X ℓ =1 x wℓ C Fiber ℓ + η Fiber d wℓ + W X w =1 M w X ℓ =1 z wℓ C mmW ℓ + u wℓ C FSO + W X w =1 v w C mmW w + κ w C Fiber w , (24) where x wℓ , z wℓ , u wℓ ∈ { 0 , 1 } are the binary controlling variables for leading APs selecting fiber, FSO or mmW a ve, respectiv ely . These vectors will have their ℓ -th entry being 1 to indicate if the ℓ -th AP is using the corresponding technology for fronthauling, and 0 otherwise. The integer κ w ∈ Z is a variable indicating the number of fiber OTNs required at the DU side, based on the number of leading APs using fiber associated with the w -th DU, and the capacity of O TNs ( Θ ) in terms of how many fiber-based leading APs they can support. Lastly , v w ∈ { 0 , 1 } is a binary variable indicating if a DU w has any connected mmW ave leading APs if 1, and 0 otherwise. Effecti ve fronthaul planning and joint optimization of mul- tiple technologies necessitate the incorporation of practical and realistic constraints guiding the selection process of the most cost-effecti ve technologies. These constraints can be 9 divided into three main categories, namely: General architec- tural constraints, technology-specific constraints, QoS metrics constraints, and are as follows: General Architectural Constraints: This category ensures robust formulation and network components association, and the constraints in this category include the following: W X w =1 ( x wℓ + z wℓ + u wℓ ) = 1 , ∀ ℓ ∈ M w , ∀ w ∈ W , (25) x wℓ , z wℓ , u wℓ ∈ { 0 , 1 } , ∀ ℓ ∈ M w , (26) v w ∈ { 0 , 1 } , ∀ w ∈ W , (27) κ w ∈ Z , ∀ w ∈ W , (28) where (25) ensures that each group G i is only associated with a single DU w and selecting one fronthaul technology for ev ery leading AP ℓ ∈ M w , while both (26) and (27) define the binary controlling v ariables, and (28) defines the fiber- associated controlling variable κ w as an integer . QoS Metrics Constraints: This category ensures that indi- vidual leading APs and the entire network meet performance standards, and it includes: x wℓ R Fiber wℓ + z wℓ R mmW wℓ + u wℓ R FSO wℓ ≥ ψ FSX , ∀ ℓ ∈ M w , ∀ w ∈ W , (29) M w X ℓ =1 x wℓ ζ Fiber + z wℓ ζ mmW + u wℓ ζ FSO ≥ M w ζ SLA , ∀ w ∈ W , (30) where constraint (29) guarantees that the selected fronthaul technology minimizing the TCO for each leading AP ℓ ∈ M w is also meeting a fixed fronthaul capacity threshold imposed by the FS option requirements ψ FSX , where FSX refers to options FS7.2x or FS8. While the availability constraint (30) ensures that for the entire N period , the Service Lev el Agreement (SLA) of SPs is not breached, by capturing the average uptime for a network. A v ailability means that all leading APs in the network are ready for immediate use, by ensuring that the number of fully operational leading APs associated with each DU w are always larger than or equal to M w ζ SLA . T echnology-Specific Constraints: This cate gory ensures that the unique characteristics of each technology are accu- rately represented, and it includes: F iber Constraint: In fiber-based fronthaul, the maximum number of groups with their leading APs choosing fiber for fronthauling connected to a single DU depends on the capacity ( Θ ) of the O TN deployed at the DU side. For simplicity , we are taking the ratio option of splitters to determine the bottleneck capacity of O TNs. Assuming a single splitter supports Θ number of links (i.e., 1: Θ PON), then if more than Θ APs associated with w -th DU are using fiber, and additional OTN must be deployed, effecti vely doubling the cost of C Fiber w . M w X ℓ =1 x wℓ Θ ≤ κ w ≤ M w X ℓ =1 x wℓ Θ + 1 − ϵ, ∀ w ∈ W . (31) mmW ave Constraint: Similar to fiber , this constraint guar- antees that the w -th DU will not be equipped with a mmW ave antenna device unless there is at least one leading AP employs mmW av e technology for fronthauling. As a result, since v w is a binary variable, v w will be equal to 1 if and only if P L w ℓ =1 z wℓ = 0 . M w X ℓ =1 z wℓ M w ≤ v w ≤ M w X ℓ =1 z wℓ , ∀ w ∈ W . (32) Constraints (31) and (32), combined with the definition of their decision variables in constraints (27) and (28) resemble a linearized form of a ceiling function applied to the decision variables κ w and v w . C. F inal F ormulation and Pr oposed Algorithm By combining the TCO of both tiers, the final optimization problem for both the studied HS and RS-enabled CF-mMIMO networks that aims to minimize the fronthaul network TCO and ensures ef fective performance through the selection of fronthaul technologies is presented as follows: min x wℓ , z wℓ , u wℓ v w ,κ w g o ( x , z , u , v , κ ) + C A T 1 , (33a) subject to (25) − (32) . (33b) The above formulation is classified as an Integer Linear Program (ILP), which is a combinatorial optimization problem characterized by the combination of binary ( x wℓ , z wℓ , u wℓ , v w ) and integer ( κ w ) variables, alongside the linear nature of the objectiv e function and constraints. T o achiev e the optimal solution of equation (33), specifically for the second tier , we employ the branch-and-bound method [26], and the steps are outlined in Algorithm 2. The algorithm returns the fronthaul technologies selection ( x , z , u , v , and κ ), cost values of each technology ( C Fiber , C mmW , and C FSO ), in addition to the TCO of both tiers of the optimized network. Furthermore, while Algorithm 1 provides the topology-level input, the core optimization problem presented in Section IV is an ILP , which is solved using a branch-and-bound method. This guarantees con ver gence to a globally optimal solution due to the dis- crete and bounded nature of the solution space. Since this framew ork is intended for offline planning rather than real- time deployment, con ver gence speed is not a limiting factor . Nonetheless, we observe stable and efficient con ver gence behavior in all tested configurations. V . N U M E R I C A L R E S U LT S W e ev aluate the effecti veness of the proposed framew ork to understand the critical role of fronthaul network planning in CF-mMIMO and, more broadly , in UDNs. In particular , we focus on the use of either HS or RS connection schemes within the O-RAN paradigm. The selection of fronthaul technologies, optimization of TCO and network capacity are examined with respect to sev eral ke y factors, mainly: (1) V arying the number of DUs ( W ), impacting distances between DUs and APs. (2) V arying the number of AP groups ( G ) for the same total number of deployed APs L , which affects the number of leading APs and non-leading APs, eventually impacting the fronthaul infrastructural units needed. (3) Fronthaul capacity thresholds , namely ψ FS7.2x and ψ FS8 , where ψ FS8 makes constraint (29) more stringent. Unless otherwise specified, the cost estimates for all equipment in T ABLE II are primarily deriv ed from av erage values reported by the US FCC [25]. 10 T ABLE II: Input system parameters values used in simulation for the HS and RS-based CF-mMIMO system. Fiber mmW a ve FSO General η Fiber $26 C mmW w $34,500 C FSO $15,000 [21] Coverage area (A) 2 km × 2 km C ONU $6,502 C mmW -RX ℓ $6,000 C FSO O&M $13,000 [21] C pool DU $91,035 C OTN $61,727 C mmW O&M $13,000 r r , V 0.05 m, 400 m ψ FS7.2x 1.73 Gbps C OL T $20,100 N AP , N DU 1, 256 η t , η r 0.5, 0.5 ψ FS8 2.95 Gbps C Fiber w $81,827 p mmW t 120 W p FSO t , θ t 0.5 W, 10 mrad L 1000 C Fiber O&M $2,285 q 6 C 2 n ( h ) 10 − 15 m − 2 / 3 [22] L max 9 R Fiber 10 Gbps BW mmW 2.5 GHz E p 1 . 2823 × 10 − 19 N period 1 year ζ Fiber 1.00 ζ mmW 0.99999 ζ FSO 0.9975 ζ S LA 0.9999 Θ 16 f c 80 GHz λ , N b 1550 nm, 100 g s , g m 15, 3 V ariables: No. of groups ( G ) No. of DUs ( W ) No. of APs per group ( L G i ) Algorithm 2 Proposed algorithm for solving the hierarchical and radio-stripes-based CF-mMIMO fronthaul planning and cost minimization ILP in eq. (33). 1: Input: Set up the giv en technology-specific and general parameters values from T ABLE II as input to the system. 2: for realization r = 0 do 3: r ← r + 1 ; 4: Initialization: 5: Obtain NOF A C Algorithm 1 outputs as input. 6: for ∀ w ∈ W do 7: Initialize v ( r ) and κ ( r ) ← 0 ; 8: for ∀ ℓ ∈ M w do 9: Compute d wℓ , R Fiber wℓ , R mmW wℓ , and R FSO wℓ . 10: Initialize x ( r ) , z ( r ) and u ( r ) ← 0 ; 11: end for 12: end f or 13: Compute C A T 1 from eq. (21). 14: Solve eq. (33) using branch and bound to obtain: 15: x ( r ) ∗ , z ( r ) ∗ , u ( r ) ∗ , v ( r ) ∗ , and κ ( r ) ∗ . 16: end for 17: Output: x , z , u , v , κ , C Fiber , C mmW , C FSO , C A T 1 , and g o ( x , z , u , v , κ ) . It is important to note that the simulation results presented in this section are averaged ov er hundreds of spatially random- ized network realizations, reflecting di verse AP distributions, group topologies, and DU placements. This extensi ve sampling implicitly captures the performance variability induced by different deployment topologies, including effects stemming from radio-stripe interconnections. Although our frame work does not explicitly model physical layer processing strategies such as sequential decoding or cooperativ e fusion, the av er- aged performance over varied topologies ensures robustness and generalizability of the results. Moreover , the proposed planning strategy is modular and can be adapted to operator- specified topology constraints or processing architectures as needed. The performance of the optimization framew ork is e valuated by comparing it against three benchmarks, each focusing on different fronthaul technology strategies for leading APs in the second tier of the network, and these are: (a) Standard all- (a) Sample of 4 DUs and 150 stripes. (b) Sample of 8 DUs and 150 stripes. Fig. 5: Optimized fronthaul mixed-technology selection in RS with FS7.2x under different lev els of decentralized processing. (a) Sample of 4 DUs and 150 groups. (b) Sample of 8 DUs and 150 groups. Fig. 6: Optimized fronthaul mixed-technology selection in HS with FS7.2x under different lev els of decentralized processing. Fiber fronthaul network , serving as a benchmark for the most reliable performance, satisfying all constraints (25) - (32). (b) Suboptimal all-mmW ave fr onthaul network , repre- senting an economically appealing benchmark, but falls short of meeting the capacity ψ FSX constraint (29) for all leading APs. Lastly , (c) Heuristic method for hybrid deployment , balancing cost and capacity without necessarily achieving optimal TCO. In this method, mmW av e is initially assigned to all APs, and if the capacity threshold ( ψ FSX ) for a leading AP ℓ exceeds its mmW ave capacity R mmW wℓ , it is switched to fiber, while ensuring compliance with all the remaining constraints. In our solution, we do not focus on enhancing the bandwidth 11 (a) TCO per AP for W = 4. (b) TCO per AP for W = 6. (c) TCO per AP for W = 8. Fig. 7: A verage TCO per AP vs. number of groups ( G ) across different lev els of decentralized processing and benchmarks. (a) Network surplus capacity for W = 4. (b) Network surplus capacity for W = 6. (c) Network surplus capacity for W = 8. Fig. 8: Surplus capacity vs. number of groups ( G ) across dif ferent levels of decentralized processing and benchmarks. capabilities of fiber optics or any other fronthaul technology . Instead, we adopt a planning perspecti ve that works within the constraints of existing technologies. While our study considers standard fronthaul capacity requirements based on uncompressed data for FS7.2x and FS8, it is agnostic to specific fronthaul enhancements (e.g., compression, protocol efficienc y improvements). Our optimization framew ork re- mains applicable and flexible to adapt to future technology upgrades, as it fundamentally operates on cost, capacity , and reliability parameters, regardless of underlying physical layer innov ations. A. F r onthaul T echnologies Selection Figures 5 and 6 illustrate fronthaul technology choices for RS and HS topologies under FS7.2x, considering dif ferent numbers of deployed DUs ( W ). Although the results reflect specific realizations, the insights extend to other configurations and traffic scenarios [14]. For both HS- and RS-enabled CF- mMIMO, APs near DUs typically use fiber due to lower cost, while distant APs rely on mmW a ve when capacity and reli- ability allow . FSO adoption remains limited, gi ven its higher cost and lower reliability . Interestingly , and contrary to widely held assumptions, as processing becomes more decentralized and AP–DU distances shrink, fiber deployment increases. Additionally , the optimization framew ork prioritizes efficient utilization of DU-associated infrastructure, by maximizing connections using the same technology , hence minimizing infrastructural redundancy across technologies. B. Network Optimized TCO and Number of Groups Figure 7 shows the average TCO per AP for dif ferent numbers of DUs ( W ) and groups ( G ). Although an all- mmW av e deployment often appears to hav e the lo west cost, it consistently violates the capacity constraint (29) and is therefore infeasible. Our optimized design achieves the most cost-efficient deployment across both connection schemes and FS options. Increasing group sizes ( L G i ) lo wers fronthaul costs but adds processing b urden on each DU, while deploying more DUs distributes the load more evenly and reduces ov erhead. Moreov er , at lower decentralization lev els (e.g., Figures 7a and 7b), fiber-only deployments incur the highest TCO due to the long distances between APs and DUs, whereas the suboptimal all-mmW ave case typically shows the lo west cost despite constraint violations. On the other hand, at higher decentralization lev els (e.g., Figure 7c), the cost-effecti veness of the suboptimal all-mmW ave scheme diminishes. Unlike common belief, this shift occurs due to the reduced AP- DU distances, which sometimes render fiber to be a more economically appealing option. The average TCO per AP is nearly identical for RS and HS-enabled CF-mMIMO under the same FS option. Ho wever , FS8 incurs slightly higher costs than FS7.2x due to stricter fronthaul capacity requirements. This cost difference becomes negligible at DU densities (e.g., W = 8 ), where fiber dominates for both FS options. Nev er- theless, the selection of fronthaul technologies is contingent on the network configuration, FS option, connection scheme 12 (a) FS7.2x average network TCO and Tier 2 cost breakdown. (b) FS8 average network TCO and Tier 2 cost breakdown. Fig. 9: A verage network TCO and technology cost distribution for dif ferent DU counts in RS-based CF-mMIMO. employed, and the number of deployed groups. T o generalize these findings, Figure 9 highlights the a verage network TCO, summing both tiers, in Millions of US dollars ($ MM), along with a breakdown of Tier 2 cost contributions of each technology and their respective percentages for RS- enabled CF-mMIMO. The results are av eraged ov er numerous Monte Carlo simulations with group counts G ranging from 100 to 200, for both FS7.2x and FS8 options. Figure 9 results are also applicable to the HS topology , providing valuable insights into the economic considerations associated with different deployment strategies and O-RAN FS options. W ith sparse DU deployment ( W = 2 ), long AP-DU distances result in higher attenuation for wireless links, making fiber the preferred choice despite its high TCO. As W increases (e.g., W = 4 - 8 ), AP-DU distances become more manageable, and wireless fronthaul technologies become more viable options. At higher lev els of decentralized processing ( W > 8 ), fiber deployment costs drop significantly , further solidifying its role as an ef fective fronthaul solution in these scenarios. Finally , Figure 9b rev eals that the stringent fronthaul capacity requirement of FS8 ( ψ FS8 ) leads to a higher percentage of fiber deployment compared to FS7.2x (Figure 9a), across all DU densities and connection schemes. C. Network Surplus Capacity and Number of Groups The efficienc y of deployment strategies can be assessed through fronthaul surplus capacity , which measures the dif- ference between the total capacity provided by the deployed fronthaul network and the actual demand imposed by various FS options. A positiv e surplus indicates that the network has excess capacity be yond the current demand, offering room for future traffic growth or accommodating unexpected surges. Con versely , a deficiency signifies that the network is operating below the traffic demand, compromising its ability to maintain QoS. Figure 8 shows that while the all-fiber benchmark offers the highest capacity , our hybrid optimized schemes consis- tently achieve substantial surplus at comparativ ely lower cost, demonstrating the effecti veness of the proposed framew ork. Additionally , the suboptimal all-mmW a ve frequently fails to meet the minimum required rates ( ψ FSX ), resulting in the lowest surplus capacity , or ev en capacity deficiencies. While the current optimization does not enforce any surplus con- straint, network operators may extend the model by imposing minimum surplus thresholds to ensure future-proofing in static deployments. These results emphasize that low-cost strategies must not compromise QoS requirements to ensure reliable network performance. Moreo ver , the findings presented in Figure 8 consistently demonstrate the superiority of FS7.2x, offering greater surplus capacity compared to FS8 in both schemes. When combined with the cost-effecti veness insights from Figure 7, this reinforces FS7.2x as the preferred O-RAN func- tional split for future mobile networks [7], [17]. Furthermore, FS7.2x aligns well with UDNs requirements, where the O- RAN architecture plays a role in complementing the vision of future UDNs deployment. Across all presented results, the heuristic method consistently yields lower surplus capacity and higher TCO compared to the optimized network. Therefore, we conclude that the best strategy in UDNs in volv es a well- planned and di versified mix of fronthaul technologies, as ex emplified by the superior performance of our optimized network, in both FS options. The results highlights that cost considerations should not ov ershadow QoS requirements to reliably meet performance targets for SPs. Remark 3: Surplus fronthaul capacity is not used as a measure of algorithm performance but rather as an indicator of network resilience and headroom. It quantifies how much additional traf fic the fronthaul infrastructure could support beyond the minimum required by the selected functional split. Most importantly , the surplus plots can be used to account for the additional control plane traf fic as discussed in (4) and (5). This metric helps assess the network’ s future readiness under rising throughput demands, sudden traffic surges, and ev olving service requirements. It is further important to note that any observed surplus fronthaul capacity is not the result of intentional ov er-dimensioning, b ut rather an artef act of discrete fronthaul technology selection under strict cost minimization and feasibility constraints, and is therefore interpreted solely as a resilience and headroom indicator . D. Radio-Stripes, Hierar chical and Small Cells TCO T o underscore the cost-effecti veness of the optimized fronthaul connection schemes in supporting ultra-dense CF- mMIMO deployments, Figure 10 compares the average TCO per AP in RS, HS, and the traditional P2P fronthaul connection 13 Fig. 10: Comparison of average TCO per AP among small cells (P2P fronthaul), RS, and HS topologies under varying FS options and different levels of decentralized processing. (a) Traf fic distribution mesh plot. (b) Optimized fronthaul selection. Fig. 11: Sample realization of combined RS-enabled CF- mMIMO network and traffic distribution with optimized fron- thaul technology selection for G = 150 and W = 6 . scheme for small cells networks [14]. T o ensure comparison fairness, each of the aforementioned systems deploys an iden- tical configuration of L APs within the same coverage area and satisfies the same capacity requirements ( ψ FSX ) in constraint (29), for both FS7.2x and FS8. Moreover , both RS and HS se- tups are configured with a fixed number of groups ( G = 200 ). Figure 10 rev eals that both RS and HS setups significantly reduce the average TCO per AP by sharing fronthaul resources among AP within the same group, particularly pronounced at lower levels of decentralized processing (e.g., W < 4 ). These schemes provide a practical and ef ficient alternative to con ventional P2P connections for UDNs. When combined with the proposed optimization frame work, RS and HS topologies further enhance the economic viability and scalability of UDN architectures for next-generation mobile networks. E. Non-Homogeneous T raf fic Analysis T o further assess the robustness and scalability of the proposed framework beyond standardized functional split op- erating conditions, we conduct a systematic stress test by increasing the minimum fronthaul bandwidth requirement using a traffic-a ware methodology , similar to what is de- scribed in Section II-B3. Importantly , this analysis does not in volv e redesigning fronthaul technologies or modifying their underlying models. Moti v ated by our pre vious work [14], we replace the fixed functional split requirement ψ FSX in (29) with a spatially varying threshold ψ het. ℓ assigned to each (a) TCO per AP for W = 2. (b) TCO per AP for W = 6. Fig. 12: A verage TCO per AP vs. fronthaul sum traffic thresholds for different DU counts and G = 150 . (a) Surplus capacity for W = 2. (b) Surplus capacity for W = 6. Fig. 13: Network surplus capacity vs. fronthaul sum traffic thresholds for different DU counts and G = 150 . leading AP ℓ ∈ M w . This modification preserves the original optimization structure and cost formulation, replacing only the static traf fic requirement with a traf fic-aware threshold that captures operator-style spatial demand field. Specifically , the minimum fronthaul requirement for each leading AP is defined as a function of its spatial coordinates: ψ het. ℓ = f traffic ( x ℓ , y ℓ ) , ∀ ℓ ∈ M w . (34) The spatial traffic field is generated using a hotspot-based Gaussian mixture model that emulates operator-style demand distributions [14]. A total of N s traffic hotspots are randomly placed ov er the cov erage area, as shown in Figure 11. More- ov er , the peak demand is limited by X max , which has to be less than the highest physical capacity of the used technologies (Fiber , 10 Gbps in this study). Accordingly , the fronthaul capacity constraint in (29) becomes as follows: x wℓ R Fiber wℓ + z wℓ R mmW wℓ + u wℓ R FSO wℓ ≥ ψ het. ℓ , ∀ ℓ ∈ M w , ∀ w ∈ W . (35) Finally , each leading AP ℓ ∈ M w is assigned a minimum capacity threshold according to its location through (34), which directly go verns the feasibility of (35) and, conse- quently , the fronthaul technology selection. As ψ het. ℓ increases, the optimization progressiv ely prioritizes higher-capacity and more reliable fronthaul technologies for these APs. This trend clearly leads to an increase in the optimized TCO and network capacity , along with a gradual conv ergence to ward more fiber- dominated deployments, especially under highly centralized deployments (i.e., W = 2 ), as backed by pre vious results in [14], and demonstrated in Figures 12 and 13. This behavior 14 reflects that by increasing fronthaul traffic demand, under which lo w- and medium-capacity links become infeasible, high-capacity fronthaul solutions dominate the feasible design space. The resulting technology selection patterns shown in Figure 11 is consistent with the core objectiv e of the frame- work. It trades cost for capacity and reliability only when needed, fav oring fiber in high-traffic regions while preserving feasibility within the physical capabilities of the a vailable fronthaul technologies. Remark 4: Infeasible links under extreme demand is a direct consequence of physical fronthaul capacity limits rather than a limitation of the proposed optimization framework. If ψ het. ℓ at a giv en leading AP exceeds the maximum achiev able rate supported by all av ailable technologies ( R Fiber , R mmW , or R FSO ), no feasible fronthaul assignment exists by con- struction. In such cases, the frame work correctly identifies these locations instead of forcing in valid assignments. From a planning perspectiv e, this outcome signals that the deployment has reached a technology-imposed boundary and moti vates actionable remedies such as network densification, topology reconfiguration, or upgrading the fronthaul technology set. Therefore, this analysis serves as a diagnostic scalability tool that clearly distinguishes algorithmic beha vior from fundamen- tal physical capacity ceilings. F . Network Resilience Analysis Despite the economic advantages of RS, the serial archi- tecture makes its resilience against link failures questionable. Specifically , the sequential connecti vity in RS implies that a single fronthaul link failure could trigger cascading failures affecting the rest of subsequent APs. Con versely , HS uses a branched topology that reduces interdependence among APs within the same group and mitigates the cascading failure effects. Let p represent the fraction of APs that experience an outage due to a failure in the fronthaul link of any deployed AP ℓ ∈ L , forming the main failed APs set K m ⊆ L . This failure applies equally to both RS and HS-enabled CF- mMIMO systems. In RS, a single AP failure cascades to subsequent APs in the stripe, o wing to the serial fronthaul connection. On the other hand, HS reduces this cascading effect through its branched connections. In both schemes, we denote APs failing due to cascading effects as the set K c ⊆ L . The worst-case scenario occurs when the fronthaul link of the leading AP (Tier 2) fails, resulting in the complete loss of all dependent APs within the group, as depicted in Figures 14 and 15. Hence, the set of all failed APs, K , is the total sum of main and cascaded failures, i.e., K = K m ∪ K c ⊆ L . The sev erity of cascading failures depends on the fraction of main AP failures p , the number of AP groups G , the group size L G i , and the specific locations of main failing APs. T o provide a broader perspectiv e, Figure 16 shows the average percentage of total AP failures for various G and p values. W e observe that the RS scheme exhibit high vulnerability to cascading failures, with p = 6% leading to about 30% total AP outages for G = 100 . The HS topology , howe ver , sho ws improv ed resilience, reducing total outages to around 19% under similar conditions. Given its comparable cost-efficiency (a) Sample of main failures in RS. (b) Sample of cascaded failures in RS. Fig. 14: RS-enabled CF-mMIMO network resilience sample realization for G = 150 and p = 5% . (a) Sample of main failures in HS. (b) Sample of cascaded failures in HS. Fig. 15: HS-enabled CF-mMIMO network resilience sample realization for G = 150 and p = 0 . 05 . and superior resilience, HS emerges as a compelling fron- thaul connectivity solution for future UDNs and CF-mMIMO deployment. Additionally , Figure 16 rev eals that the se verity of cascading failures in versely correlates with the number of deployed groups G . Increasing the number of groups G , while keeping L fixed, naturally decreases the total number of APs per group L G i , thereby lowering interdependence and limiting the impact of cascading failures. This trend approaches the behavior of P2P small cells, which isolate failures through dedicated links and offer higher overall robustness. G. V ariance Analysis Acr oss Randomized Deployments T o complement the average-case performance results pre- sented earlier in this section, we now in vestig ate the per - realization v ariability of the proposed optimization framew ork and compare it against the heuristic method. This analysis is motiv ated by the need to understand how consistently the solution performs across randomized network topologies. Figure 17 presents a boxplot sho wing the distribution of total cost per AP across 500 randomized realizations for both the optimized and heuristic approaches under FS 7.2x, different DU pooling configurations ( W = 2 , 4 , ..., 12 ), and G = 150 . Each W value includes three configurations: the optimized RS method, the optimized HS method, and the heuristic method and shows the spread, median, and interquartile range of deployment cost. As observed, the optimized method consistently yields lower median cost and narrower variance across all W v alues. 15 Fig. 16: Comparison of average total AP failures for varying numbers of groups G and main failure fractions p . Fig. 17: Distribution of TCO per AP ov er 500 network realizations for different DU counts and G = 150 , comparing optimized and heuristic solutions. In contrast, the heuristic method exhibits greater variability and a wider spread, especially at higher W . This trend highly supports our results in Figure 9, highlighting that as the number of DU pools increases, the complexity of the planning problem grows, and the benefits of joint optimization over simple heuristics become more pronounced. The v ariance gap between these methods increases with W , reinforcing the v alue of global cost-aware planning in more decentralized deploy- ment scenarios. This confirms that the optimized strategy not only lowers av erage cost but also reduces the risk of extreme deployment scenarios, providing stronger guarantees for real- world planning under uncertainty . The figure also shows that RS and HS architectures hav e comparable costs across different network realizations; howe ver , the HS advantage lies in the greater resilience to AP failures, as demonstrated in Figure 16. V I . C O N C L U S I O N This paper presented a two-tiered optimization framework for hybrid fronthaul network planning that minimizes TCO while ensuring scalability and high performance in HS- and RS-enabled CF-mMIMO, as well as broader UDN deploy- ments within O-RAN. The framew ork jointly optimizes fiber , mmW av e, and FSO fronthaul options under capacity and reliability constraints, achieving efficient infrastructure utiliza- tion and robust performance. Results demonstrate that hybrid deployments outperform single-technology (all-fiber or all- mmW av e) and heuristic schemes by balancing cost, capacity , and resilience. HS-enabled CF-mMIMO further enhances reli- ability compared to RS-based systems, offering a cost-efficient yet failure-resilient architecture. An important extension of this framework is the explicit incorporation of future traffic growth or reserve capacity requirements into the optimization itself, for example through location-dependent demand scaling or minimum headroom constraints. Such extensions would enable a direct trade-off between cost efficiency and future- proofing and are left for future in vestigation. These findings underscore the need to balance economic and performance ob- jectiv es when designing future fronthaul networks, providing actionable insights for service providers in deploying scalable and cost-effecti ve UDNs that meet ev olving 6G and O-RAN requirements. R E F E R E N C E S [1] S. Parkvall et al. , “5G NR release 16: Start of the 5G ev olution, ” IEEE Communications Standards Magazine , vol. 4, no. 4, pp. 56–63, 2020. [2] H. Q. Ngo, G. Interdonato, E. G. Larsson, G. Caire, and J. G. Andrews, “Ultradense cell-free massive MIMO for 6G: T echnical overvie w and open questions, ” Pr oceedings of the IEEE , vol. 112, no. 7, pp. 805–831, 2024. [3] C.-X. W ang et al. , “On the road to 6G: V isions, requirements, key technologies, and testbeds, ” IEEE Communications Surveys & T utorials , vol. 25, no. 2, pp. 905–974, 2023. [4] H. Q. Ngo, A. Ashikhmin, H. Y ang, E. G. Larsson, and T . L. Marzetta, “Cell-free massive MIMO versus small cells, ” IEEE T ransactions on W ir eless Communications , vol. 16, no. 3, pp. 1834–1850, 2017. [5] J. G. Andrews, T . E. Humphreys, and T . Ji, “6G takes shape, ” IEEE BITS the Information Theory Magazine , vol. 4, no. 1, pp. 2–24, 2024. [6] M. A. Habibi, M. Nasimi, B. Han, and H. D. Schotten, “ A comprehensiv e survey of RAN architectures toward 5G mobile communication system, ” IEEE Access , vol. 7, pp. 70371–70421, 2019. [7] M. Polese, L. Bonati, S. D’Oro, S. Basagni, and T . Melodia, “Under- standing O-RAN: Architecture, interfaces, algorithms, security , and re- search challenges, ” IEEE Communications Surveys & T utorials , vol. 25, no. 2, pp. 1376–1411, 2023. [8] F . Conceição, M. Gomes, V . Silva, R. Dinis, and C. H. Antunes, “Joint spectral and power efficienc y optimization in uplink radio stripes, ” IEEE T ransactions on Communications , vol. 72, no. 8, pp. 5209–5225, 2024. [9] P . Franger , J. Hederen, M. Hessler, and G. Interdonato, “Improved antenna arrangement for distributed massi ve mimo, ” jun 2018. [10] U. Demirhan and A. Alkhateeb, “Enabling cell-free massive MIMO systems with wireless millimeter wa ve fronthaul, ” IEEE T ransactions on Wir eless Communications , vol. 21, no. 11, pp. 9482–9496, 2022. [11] P . Agheli, M. J. Emadi, and H. Beyran vand, “Designing cost- and energy-ef ficient cell-free massive MIMO network with fiber and FSO fronthaul links, ” A UT Journal of Electrical Engineering , vol. 53, no. 2, pp. 159–170, 2021. [12] I. Chiotis and A. L. Moustakas, “Uplink performance optimization of limited-capacity radio stripes, ” IEEE T ransactions on W ir eless Commu- nications , vol. 23, no. 9, pp. 12382–12395, 2024. [13] A. Azarbahram, O. L. A. López, P . Popovski, and M. Latv a-Aho, “On the radio stripe deployment for indoor RF wireless power transfer , ” in 2024 IEEE WCNC , pp. 1–6, 2024. [14] A. S. Mohammed, H. A. Ammar, K. S. Tharakan, H. ElSawy , and H. S. Hassanein, “Traffic -aware cost-optimized fronthaul planning for ultra- dense networks, ” IEEE Wir eless Communications Letters , vol. 14, no. 2, pp. 529–533, 2025. [15] Z. H. Shaik, E. Björnson, and E. G. Larsson, “MMSE-optimal sequential processing for cell-free massiv e MIMO with radio stripes, ” IEEE T rans- actions on Communications , vol. 69, no. 11, pp. 7775–7789, 2021. 16 [16] A. F ayad, T . Cinkler , and J. Rak, “T oward 6G optical fronthaul: A survey on enabling technologies and research perspecti ves, ” IEEE Communications Surveys & T utorials , pp. 1–1, 2024. [17] Ö. T . Demir, M. Masoudi, E. Björnson, and C. Cavdar , “Cell-free massiv e MIMO in O-RAN: Energy-aware joint orchestration of cloud, fronthaul, and radio resources, ” IEEE Journal on Selected Ar eas in Communications , vol. 42, no. 2, pp. 356–372, 2024. [18] 3GPP, “NR; Physical channels and modulation (Release 18). ” 3rd Gen- eration Partnership Project (3GPP), T echnical Specification TS 38.211 V18.7.0, July 2025. [19] O-RAN Alliance, O-RAN W orking Group 4 (Open F ronthaul Interfaces WG) Contr ol, User and Synchr onization Plane Specification , Accessed: October 2025. https://specifications.o- ran.or g/specifications. [20] 3rd Generation Partnership Project (3GPP), “Study on Channel Model for Frequencies From 0.5 to 100 GHz (Release 18), ” 3GPP technical report 38.901, version 18.0.0 Release 18, 2024. [21] M. Alzenad, M. Z. Shakir , H. Y anikomeroglu, and M.-S. Alouini, “FSO-based vertical backhaul/fronthaul framew ork for 5G+ wireless networks, ” IEEE Communications Magazine , vol. 56, no. 1, pp. 218– 224, 2018. [22] X. Zhu and J. Kahn, “Free-space optical communication through atmo- spheric turbulence channels, ” IEEE T ransactions on Communications , vol. 50, no. 8, pp. 1293–1300, 2002. [23] D. Schulz, V . Jungnickel, C. Ale xakis, M. Schlosser , J. Hilt, A. Paraske vopoulos, L. Grobe, P . Farkas, and R. Freund, “Robust optical wireless link for the backhaul and fronthaul of small radio cells, ” J ournal of Lightwave T echnology , vol. 34, no. 6, pp. 1523–1532, 2016. [24] J. T ang, Y . Y u, C. Pan, H. Ren, D. W ang, J. W ang, and X. Y ou, “Coop- erativ e isac-empowered low-altitude economy , ” IEEE T ransactions on W ir eless Communications , pp. 1–1, 2025. [25] FCC, “Final catalog of eligible expenses and estimated costs, ” F ederal Communications Commission (FCC) , Sep 2021. [26] Gurobi Opt. LLC, “Gurobi Optimizer Reference Manual, ” 2024. Anas S. Mohammed (Student Member, IEEE) re- ceiv ed his B.Sc. (Hons.) in electrical engineering, with a concentration in ener gy efficiency , from King Fahd Univ ersity of Petroleum and Minerals (KFUPM), Saudi Arabia, in 2023, and his MASc. in electrical and computer engineering from Queen’ s Univ ersity , Canada, in 2025. During his graduate studies, he was a graduate research fellow with the T elecommunications Research Lab (TRL) and the Smart Wireless Massive Systems Lab (SWIMS), Queen’ s University , Canada. His background spans both advanced research and industry practice. His research interests lie in the broad areas of electrical engineering, including wireless communication systems, mobile networks, electrical and electronic systems design, power systems, smart grids, networks strategic planning and AI-driven optimization. Over the years, he conducted several hands-on research projects in the broad fields of electrical engineering, resulting in high-quality publications, and participation in global conferences, events and demonstration sessions. Krishnendu S. Tharakan (Member , IEEE) recei ved her B.T ech. degree in electronics & communications Engineering from the National Institute of T echnol- ogy Calicut, India, in 2016 , and the PhD degree from the Electrical Engineering Department, Indian Institute of T echnology Indore, India in 2023 . From 2016 − 17 , she worked as an Engineer with T ata Elxsi, Tri vandrum, India. She was a recipient of V isvesv araya PhD Fello wship from MeitY , Gov- ernment of India. She is currently a Post-Doctoral Fellow with the School of Electrical Engineering and Computer Science, KTH Royal Institute of T echnology , Stockholm, Sweden. Prior to that, she was a Post-Doctoral fello w in the School of Computing at Queen’ s University , Kingston, Canada. Her current research interests include wireless communications, distributed optimization, federated learning, and statistical learning theory . She was recognized as an Excellent Revie wer by IEEE TRANSA CTIONS ON NETWORK SCIENCE AND ENGINEERING in 2024. Hussein A. Ammar (Member, IEEE) received his Ph.D. degree in Electrical and Computer Engineer- ing from the Univ ersity of T oronto in 2023 and his M.A.Sc degree in Electrical and Computer Engineer- ing from the American Uni versity of Beirut (A UB) in 2017. In 2023, he completed a four -month in- ternship with Ericsson on developing artificial intel- ligence (AI) solutions for wireless communications. In 2018, he worked as a research assistant at the Mobile and Distributed Computing Laboratory at A UB and as an R&D engineer in the information and communications technology industry . Since 2024 he has been an Assistant Professor in the Department of Electrical and Computer Engineering at the Royal Military College of Canada. Dr . Ammar received the University of T oronto Fellowship and the Edward S. Rogers Sr . Graduate Scholarship. He was recognized as an Exemplary Revie wer by I E EE C O M M UN I C ATI O N S L E TT ER S in 2023. His research interests include wireless communications, AI for wireless networks, scalable and resilient deep reinforcement learning, coordinated distributed MIMO, user-centric cell-free massiv e MIMO, statis- tical signal processing, and mathematical optimization. Hesham ElSawy (Senior Member , IEEE) an As- sociate Professor with the School of Computing, Queen’ s Univ ersity , Kingston, ON, Canada. Prior to that, he was an assistant professor at King Fahd Univ ersity of Petroleum and Minerals (KFUPM), Saudi Arabia, a Post-Doctoral Fellow at the King Abdullah University of Science and T echnology (KA UST), Saudi Arabia, a Research Assistant at TR T ech, Winnipe g, MB, Canada. He received the Ph.D. degree in electrical engineering from the Uni- versity of Manitoba, Canada, in 2014. He conducts research in the broad area of wireless communications and networking with a special focus on 5G/6G networks, joint communications and sensing, Internet of Things, edge computing, non-terrestrial networks, and wireless security . Dr . Elsawy is a recipient of the IEEE ComSoc Outstanding Y oung Researcher A ward for Europe, Middle East, and Africa Region in 2018. He also received sev eral best paper awards including the IEEE COMSOC Best T utorial Paper A ward in 2020 and IEEE COMSOC Best Survey Paper A w ard 2017. He is an Editor of the IEEE Transactions on Wireless Communications, the IEEE Transactions on Network Science and Engineering, and the IEEE Communications Letters. Hossam S. Hassanein (Fellow , IEEE) is currently a leading Researcher in the areas of broadband, wireless and mobile networks architecture, proto- cols, control, and performance ev aluation. His record spans more than 700 publications in journals, con- ferences, and book chapters, in addition to numerous keynotes and plenary talks in flagship v enues. He has receiv ed sev eral recognition and best paper aw ards at top international conferences. He is the Founder and the Director of the T elecommunications Research Laboratory (TRL), School of Computing, Queen’s Univ ersity , with e xtensive international academic and industrial collaborations. He is a recipient of the 2016 IEEE Communications Society Communications Software T echnical Achievement A ward for outstanding contributions to routing and deployment planning algorithms in wireless sensor networks and the 2020 IEEE IoT , Ad Hoc and Sensor Networks T echnical Achievement and Recognition A ward for significant contributions to technological advancement of the Internet of Things, ad hoc networks, and sensing systems. He is the former Chair of the IEEE Communication Society T echnical Committee on Ad hoc and Sensor Networks (TC AHSN). He is an IEEE Communications Society Distinguished Speaker [a Distinguished Lecturer (2008–2010)].
Original Paper
Loading high-quality paper...
Comments & Academic Discussion
Loading comments...
Leave a Comment