Let the Agent Steer: Closed-Loop Ranking Optimization via Influence Exchange
Recommendation ranking is fundamentally an influence allocation problem: a sorting formula distributes ranking influence among competing factors, and the business outcome depends on finding the optimal "exchange rates" among them. However, offline pr…
Authors: Yin Cheng, Liao Zhou, Xiyu Liang
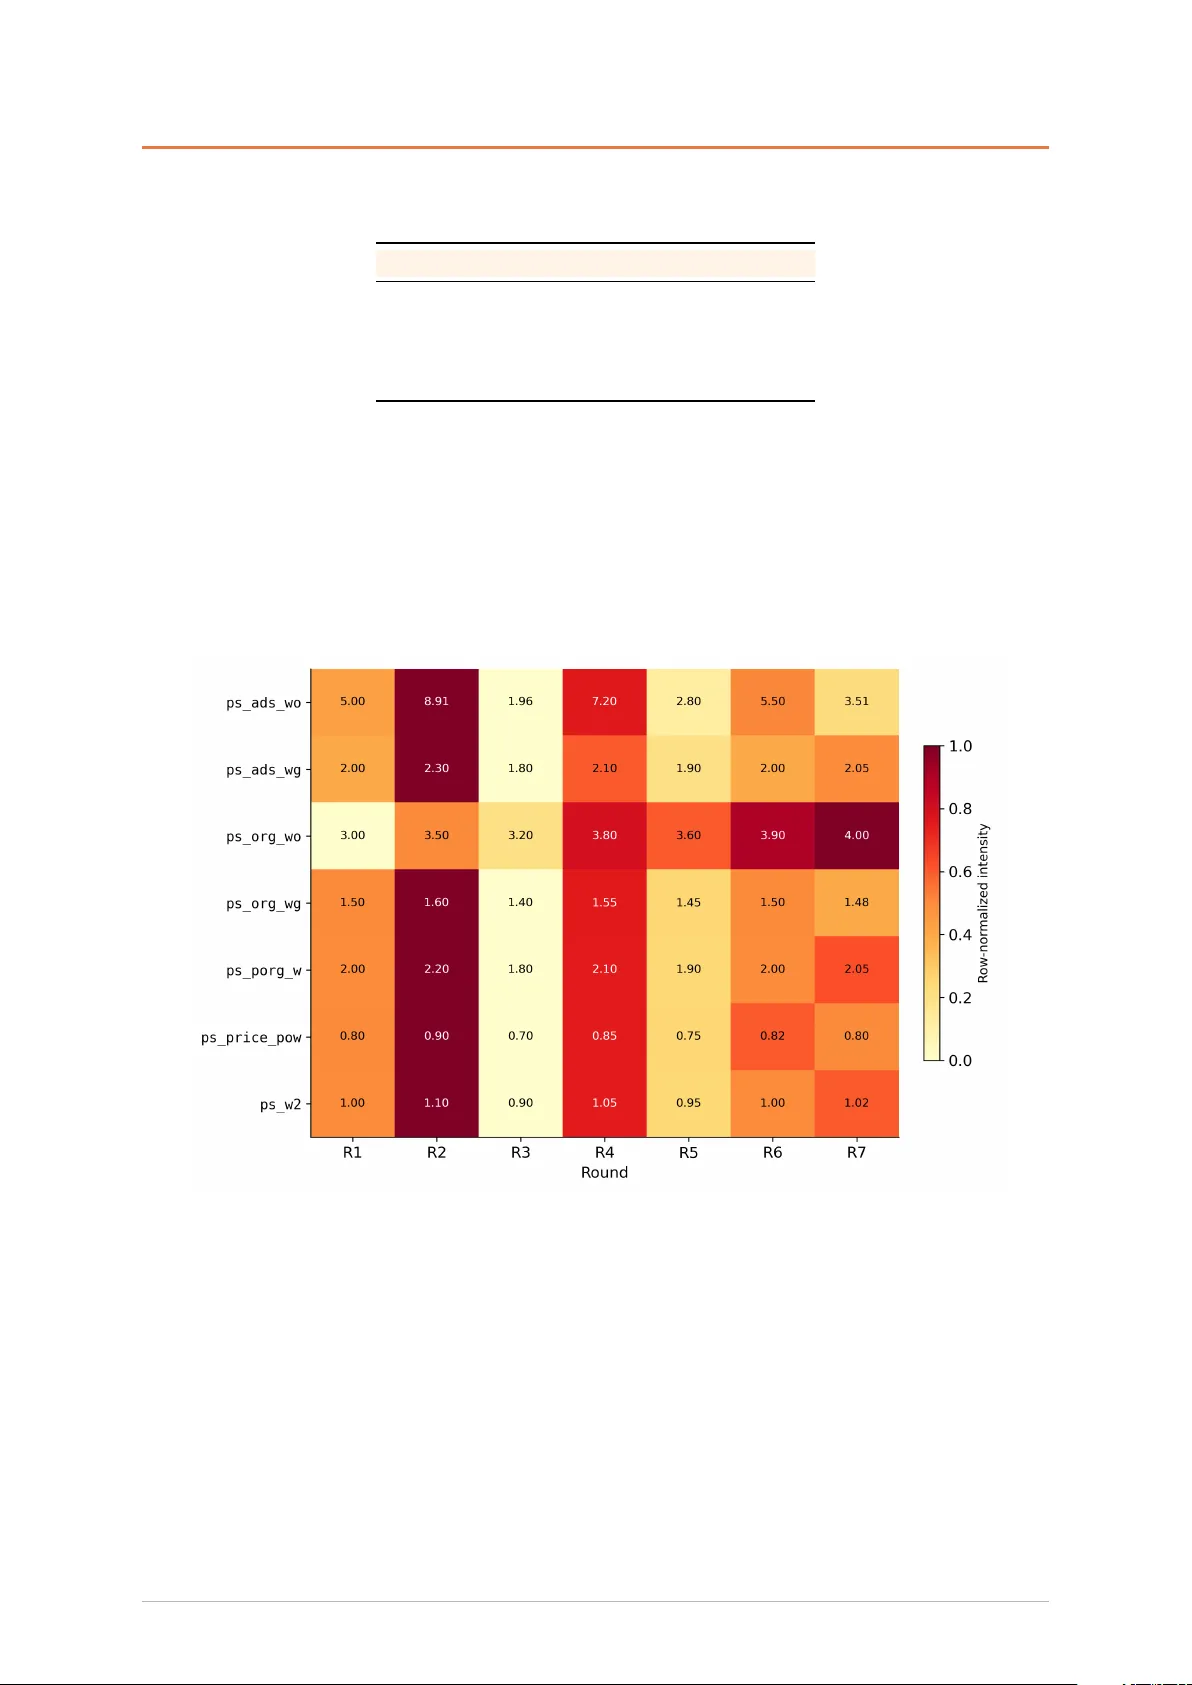
Sor tify T echnical R epor t March 2026 Let the Agent Steer : Closed-Loop Ranking Optimization via Influence Ex chang e Sortify T eam 1 R ecommendation ranking is fundamentally an influence allocation problem: a sor ting f ormula distributes ranking influence among competing factors—or ganic rele vance, adv er tising bids, price competitiv eness—and the business outcome depends on finding the optimal “e x chang e rates” among them. Ho we v er , offline pro xy metrics sy stematically misjudg e how influence reallocation translates to on- line impact: larg e offline uplifts often con v er t into only a small fraction of the e xpected online gains, with transf er rates far below expectation. More subtly , the bias patter n is asymmetr ic across metr ics—some metrics exhibit optimistic bias (offline ov erestimates online), while others e xhibit pessimistic bias (offline underestimates online)—so a single calibration factor cannot correct both. T raditional approaches w orsen this predicament in three wa ys: manual calibration cannot keep pace with dis tr ibution shift; entangled diagnostic signals obscure whether the problem lies in mapping bias or constraint miscalibration; and each round star ts from scratch, prev enting historical e xper ience from accumulating. Figure 1 | Three-panel o verview : (a) dual-channel architecture diagram, (b) online GMV/Orders uplift trend across rounds, (c) LLM cor rection conv erg ence curve W e present Sortify , a fully autonomous ranking optimization agent dr iv en b y a larg e language model (LLM). The agent reframes ranking optimization as continuous influence ex change, autonomously reg- ulating the allocation of ranking influence among f actors and closing the full loop from diagnosis and decision to parameter deployment without human inter v ention. It addresses the structural problems through three core mechanisms. Firs t, grounded in L.J. Sa vag e’ s axiomatization of Subjective Expected Utility (SEU)—which establishes that any rational decision requires e xactly two independent inputs: a belief about the state of the w orld (probability) and a pref erence o v er outcomes (utility)—a dual-channel adaptation frame w ork decouples offline-online transfer cor rection (the Belief channel) from constraint penalty adjustment (the Preference channel), architecturall y se v er ing the entanglement between epistemic er ror and axiological er ror to enable or thogonal diagnosis and independent correction. Second, an LLM 1 Yin Cheng, Liao Zhou, Xiyu Liang, Dihao Luo, T e wei Lee, Kailun Zheng, W eiwei Zhang, Mingchen Cai, Jian Dong, Andy Zhang. All authors are from Shopee. Let the Ag ent Steer : Closed-Loop Ranking Optimization via Influence Exchang e meta-controller , ser ving as a second-order rational obser v er , operates on framew ork -lev el parameters— adjusting transfer function intercepts and penalty multipliers rather than lo w-le v el search parameters— and, based on evidence from 20-round episode histories, selectivel y cor rects residuals left b y routine LMS calibration. Third, a persistent Memor y DB with 7 relational tables accumulates cross-round lear ning, pro viding the state basis f or warm star t and cross-round calibration continuity . The ag ent’ s core e valuation metr ic, Influence Share, is a decomposable ranking influence measure in which all f actor contr ibutions sum to e xactly 100%. It addresses the fundamental limitation of traditional rank -cor relation metrics such as Kendall’ s 𝜏 , which cannot attr ibute influence to individual f actors or suppor t quantitativ e e xc hange betw een them. Sor tify has been deplo y ed on a larg e-scale recommendation platf or m spanning two Southeast Asian markets (hereafter Countr y A and Country B), running fully automated with no manual intervention required. The inner optimization loop operates autonomously in 4-hour cycles, e xecuting 5,000 Optuna tr ials per round. In Countr y A ’ s warm-star t experiment, the agent pushed GMV from − 3.6% to +9.2% within 7 rounds, with peak order v olume reaching +12.5%, while LLM calibration effor t con ver ged from 5 cor rection items per round to 2. In Countr y B, a cold-start deplo yment validated its cross-market generalization and end-to-end viability : after two search phases (23 rounds total), the agent identified a parameter structure that achie v ed +4.15% GMV/UU and +3.58% A ds R ev enue in a 7-da y A/B test, leading to a full production rollout. Ov erall, the e vidence retained in the main text demonstrates that the sys tem can both continuousl y impro v e on e xisting calibration s tate and produce deplo y able policies in new markets. 2 Contents 1 Introduction . . . . . . . . . . . . . . . . . . . . . . . . . . . . . . . . . . . . . . . . . . . 5 2 Sy stem Architecture . . . . . . . . . . . . . . . . . . . . . . . . . . . . . . . . . . . . . . . 8 2.1 Ov er vie w . . . . . . . . . . . . . . . . . . . . . . . . . . . . . . . . . . . . . . . . . . 8 2.2 Influence Share and Parameter Search Engine . . . . . . . . . . . . . . . . . . . . . . . 9 2.2.1 Motiv ation: Be y ond Kendall T au . . . . . . . . . . . . . . . . . . . . . . . . . . 10 2.2.2 Influence Share Definition: From Symmetric Groups to the Influence P er mutation Algorithm . . . . . . . . . . . . . . . . . . . . . . . . . . . . . . . . . . . . . . 10 2.2.3 Multi-Objectiv e Search F or mulation . . . . . . . . . . . . . . . . . . . . . . . . 12 2.2.4 Search Engine . . . . . . . . . . . . . . . . . . . . . . . . . . . . . . . . . . . . 13 2.3 Belief Channel: Offline-Online T ransf er Calibration . . . . . . . . . . . . . . . . . . . . 13 2.3.1 Motiv ation . . . . . . . . . . . . . . . . . . . . . . . . . . . . . . . . . . . . . 13 2.3.2 Linear T ransfer Model . . . . . . . . . . . . . . . . . . . . . . . . . . . . . . . 13 2.3.3 LMS Continuous Calibration . . . . . . . . . . . . . . . . . . . . . . . . . . . . 13 2.3.4 LLM Selectiv e Jumps . . . . . . . . . . . . . . . . . . . . . . . . . . . . . . . 14 2.4 Pref erence Channel: Cons traint Penalty A daptation . . . . . . . . . . . . . . . . . . . . 15 2.4.1 Motiv ation . . . . . . . . . . . . . . . . . . . . . . . . . . . . . . . . . . . . . 15 2.4.2 Violation Pressure . . . . . . . . . . . . . . . . . . . . . . . . . . . . . . . . . 15 2.4.3 Asymmetric Multiplicative Update . . . . . . . . . . . . . . . . . . . . . . . . . 15 2.5 LLM Meta-Controller . . . . . . . . . . . . . . . . . . . . . . . . . . . . . . . . . . . . 16 2.5.1 Motiv ation . . . . . . . . . . . . . . . . . . . . . . . . . . . . . . . . . . . . . 16 2.5.2 T w o Or thogonal Knobs . . . . . . . . . . . . . . . . . . . . . . . . . . . . . . . 16 2.5.3 Conte xt and Evidence Req uirements . . . . . . . . . . . . . . . . . . . . . . . . 16 2.5.4 Implementation: Model, Prompt, and Output Safety . . . . . . . . . . . . . . . . 16 2.5.5 Coordination with LMS . . . . . . . . . . . . . . . . . . . . . . . . . . . . . . 18 2.6 Memory DB and State P ersistence . . . . . . . . . . . . . . . . . . . . . . . . . . . . . 18 2.6.1 Motiv ation . . . . . . . . . . . . . . . . . . . . . . . . . . . . . . . . . . . . . 18 2.6.2 Schema Design . . . . . . . . . . . . . . . . . . . . . . . . . . . . . . . . . . . 18 2.6.3 Cross-R ound Intelligence . . . . . . . . . . . . . . . . . . . . . . . . . . . . . . 18 3 Operational Frame wor k . . . . . . . . . . . . . . . . . . . . . . . . . . . . . . . . . . . . . 21 3.1 Sy stem Infrastructure . . . . . . . . . . . . . . . . . . . . . . . . . . . . . . . . . . . . 21 3.2 One-Shot Pipeline . . . . . . . . . . . . . . . . . . . . . . . . . . . . . . . . . . . . . . 21 3.3 Y OLO Continuous Loop . . . . . . . . . . . . . . . . . . . . . . . . . . . . . . . . . . 22 4 Ev aluation . . . . . . . . . . . . . . . . . . . . . . . . . . . . . . . . . . . . . . . . . . . . 24 4.1 Metrics . . . . . . . . . . . . . . . . . . . . . . . . . . . . . . . . . . . . . . . . . . . 24 4.2 Experiment Setup . . . . . . . . . . . . . . . . . . . . . . . . . . . . . . . . . . . . . . 24 4.3 Online A/B R esults . . . . . . . . . . . . . . . . . . . . . . . . . . . . . . . . . . . . . 25 4.3.1 Exp-401838: Countr y A PDP W arm-Star t (7 R ounds) . . . . . . . . . . . . . . 25 4.4 Offline-Online T ransfer Analy sis . . . . . . . . . . . . . . . . . . . . . . . . . . . . . . 25 4.5 Parameter Evolution and Stability . . . . . . . . . . . . . . . . . . . . . . . . . . . . . 27 4.5.1 R esidual Pendulum Effect in W ar m-Start Exper iment . . . . . . . . . . . . . . . 27 4.6 LLM Calibration Effectiv eness . . . . . . . . . . . . . . . . . . . . . . . . . . . . . . . 28 4.6.1 Cor rection Con v ergence . . . . . . . . . . . . . . . . . . . . . . . . . . . . . . 28 4.7 Sensitivity Anal ysis . . . . . . . . . . . . . . . . . . . . . . . . . . . . . . . . . . . . . 30 4.8 Country B Deployment: From Cold Start to R ollout . . . . . . . . . . . . . . . . . . . . 31 3 Let the Ag ent Steer : Closed-Loop Ranking Optimization via Influence Exchang e 4.8.1 Cold Start Signal . . . . . . . . . . . . . . . . . . . . . . . . . . . . . . . . . . 31 4.8.2 Search Jour ney : From Direction to Deploy able Parameters . . . . . . . . . . . . 31 4.8.3 Winning Parameter Structure . . . . . . . . . . . . . . . . . . . . . . . . . . . . 31 4.8.4 Long-Horizon A/B V alidation . . . . . . . . . . . . . . . . . . . . . . . . . . . 32 4.9 Efficiency and Operational Cost . . . . . . . . . . . . . . . . . . . . . . . . . . . . . . 32 5 Discussion: One-Person F easibility . . . . . . . . . . . . . . . . . . . . . . . . . . . . . . . 34 5.1 Scope of What W as Delivered . . . . . . . . . . . . . . . . . . . . . . . . . . . . . . . 34 5.2 T echnical Depth and De v elopment Complexity of Sor tify . . . . . . . . . . . . . . . . . 34 5.3 From ParaDance to Sor tify: Lineage and Domain Exper tise . . . . . . . . . . . . . . . . 35 5.4 The Orches tration Model . . . . . . . . . . . . . . . . . . . . . . . . . . . . . . . . . . 37 5.5 Meta-Nes ting: AI Building AI . . . . . . . . . . . . . . . . . . . . . . . . . . . . . . . 37 5.6 Implications . . . . . . . . . . . . . . . . . . . . . . . . . . . . . . . . . . . . . . . . . 38 6 Conclusion, Limitations, and Future Directions . . . . . . . . . . . . . . . . . . . . . . . . 40 A Contribu tors . . . . . . . . . . . . . . . . . . . . . . . . . . . . . . . . . . . . . . . . . . . 43 B Im plement ation Details . . . . . . . . . . . . . . . . . . . . . . . . . . . . . . . . . . . . . 43 B.1 A/B Exper iment Integration . . . . . . . . . . . . . . . . . . . . . . . . . . . . . . . . 43 B.2 R edis Parameter Publishing . . . . . . . . . . . . . . . . . . . . . . . . . . . . . . . . . 43 B.3 S tate File Manag ement . . . . . . . . . . . . . . . . . . . . . . . . . . . . . . . . . . . 43 B.4 Directory Structure . . . . . . . . . . . . . . . . . . . . . . . . . . . . . . . . . . . . . 44 C Notation T able . . . . . . . . . . . . . . . . . . . . . . . . . . . . . . . . . . . . . . . . . . 44 4 Let the Ag ent Steer : Closed-Loop Ranking Optimization via Influence Exchang e 1. Introduction Ranking in recommendation sys tems determines what users see first, directly impacting ke y business metrics such as gross merchandise v alue (GMV), order v olume, advertising re v enue, and user engag ement. Industrial ranking stac ks commonly combine multiple signals through tunable scor ing functions and f eature weights, especiall y in product searc h and marketplace recommendation settings Santu et al. [ 2017 ], Liu [ 2009 ]. Optimizing these parameters is theref ore a continuous, high-le v erage engineer ing task. As platf or ms scale across mark ets, verticals, and recommendation sur f aces, the need f or automated, self-cor recting parameter optimization becomes increasingl y urg ent Hutter et al. [ 2019 ]. Figure 2 | Old vs. N ew Paradigm: Left—manual optimization loop (offline search, deplo y , human judgment, discard state, repeat). Right—Sor tify closed loop (offline search, deplo y , auto-calibrate via dual channels, accu- mulate in Memor y DB, repeat with improv ed priors). Highlights the structural differences: stateless vs. persistent, single-axis vs. dual-channel, manual vs. LLM-orchestrated. The standard optimization workflo w operates as follo ws: an offline searc h algorithm e xplores the parameter space using pro xy metr ics computed on logged data, identifies a candidate configuration, and pushes it to production for online A/B v alidation. A human operator then e xamines the A/B results, judg es whether the outcome is acceptable, and either adopts the new parameters or rev er ts to the previous configuration Gilotte et al. [ 2018 ]. This manual loop, while conceptuall y simple, suffers from three structural limitations that incremental tuning impro vements cannot resolv e. Offline-Online T ransf er Gap. The most critical structural problem is the sys tematic div erg ence betw een offline proxy metr ics and online business outcomes. In the Country A warm-star t e xper iment retained in the main text, offline 𝐼 gmv rose from +18.2% to +41.6%, y et the cor responding online GMV fluctuated from − 3.6% to +9.2%, rev ealing a significant optimistic bias in the offline pro xy to ward online gains. More critically , the same round’ s parameter update affects GMV , Orders, and A ds Re venue non-synchronousl y , indicating that the transf er relationships across different business metr ics do not share a single calibration constant. Standard logged-data ev aluation methods estimate policy value from historical interactions Gilotte et al. [ 2018 ], Dudik et al. [ 2014 ], but they do not by themselv es pro vide continuousl y updated, per -metric transf er calibration f or a non-stationary production environment. Our production obser vations sho w that the mapping dr ifts continuousl y with traffic patterns, time-of-day effects, and competitiv e dynamics. W ithout continuous recalibration, eac h carefully designed offline 5 Let the Ag ent Steer : Closed-Loop Ranking Optimization via Influence Exchang e search is built on potentiall y stale mapping assumptions, and the precision gains from search are par tially offset b y transfer er ror . Entangled Diagnostic Signals. When an optimization round produces disappointing online results, the operator f aces a fundamental attribution problem: did the offline-online mapping predict incorrectly (a Belief error), or w ere the constraint penalties calibrated at the wrong sensitivity lev el (a Pr efer ence error)? These tw o failure modes require opposite cor rections—a Belief er ror demands adjusting the transf er function intercept, while a Preference er ror demands rescaling penalty weights Berg er [ 1985 ]. Without f or mal separation, the two signal sources are conflated: a round where GMV is positive but A ds Re venue is negativ e could equally mean the mapping is optimistic or the constraint is too loose. This diagnostic entanglement is not merel y a parameter tuning issue; it e xposes a limitation of monolithic optimization w orkflo ws that compress multiple objectiv es and constraints into a single correction c hannel Lin et al. [ 2019 ]. No Persistent Learning. Each optimization round in con v entional sys tems starts from a blank slate. The transf er relationships lear ned in round 𝑁 are not car r ied f orward to round 𝑁 + 1 . The cons traint sensitivities disco vered after a violation are f orgotten after the ne xt parameter push. This “Groundhog Da y” effect means that a sy stem having completed 50 rounds of A/B tests possesses no more calibration intellig ence than one r unning its first round Parisi et al. [ 2019 ]. In our production setting, each offline- online observation pair represents 3.5 hours of liv e traffic data—a non-trivial inv estment. Discarding this accumulated evidence is both economicall y w asteful and technicall y a voidable. R ecent w ork on continual lear ning Parisi et al. [ 2019 ], meta-lear ning f or warm-started optimization Feurer et al. [ 2015 ], and LLM-based agents with persistent state W ang et al. [ 2024 ] sugges ts that cumulativ e lear ning across episodes is both f easible and valuable for sequential decision problems. W e present Sor tify , an agent-s teered closed-loop sys tem that reframes sor ting parameter optimization as continuous influence e x chang e. Rather than treating optimization as a stateless manual process, Sor tify enables an LLM agent to steer the rebalancing of ranking influence among competing factors through a persistent, autonomous f eedback loop. Sor tify’ s core architectural inno vation is the decomposition of the influence e xc hange problem into two or thogonal channels—Belief (how influence predictions translate to reality) and Pref erence (how hard influence constraints are enf orced)—orchestrated by an LLM meta- controller that operates on frame work -lev el parameters rather than bottom-lev el search parameters. The design of Sor tify rests on three principles. Firs t, separ ation of concer ns : transf er mapping cor rec- tion (Belief ) and constraint sensitivity adjustment (Pref erence) operate on independent ax es der iv ed from a Bay esian decision-theoretic decomposition 𝑃 ( 𝜃 | 𝐷 ) × 𝐿 ( 𝑎 , 𝜃 ) Berg er [ 1985 ], ensur ing that cor rections along one axis do not inter fere with the other . Second, fr amewor k-lev el LLM contr ol : the LLM adjusts the search frame work —specifically , transf er function intercepts and penalty multipliers—rather than the 7-dimensional sorting parameter vector directly . This distinction matters because frame w ork parameters encode reusable cross-round e xperience (e.g., “offline GMV predictions ha v e been 5–8% optimistic o ver the pas t 3 rounds ”), while bottom-le v el parameters are ephemeral facts tied to a single data snapshot Feurer et al. [ 2015 ]. Third, cumulative memor y : a 7-table persistent Memor y DB stores ev er y offline-online observation, calibration update, and LLM proposal, enabling the sys tem to build calibration intelligence across rounds rather than resetting after each iteration Parisi et al. [ 2019 ], Feurer et al. [ 2015 ]. The contributions of this repor t are as follo ws: • Dual-channel self-adaptation frame wor k. W e propose a Belief/Pref erence decomposition that enables or thogonal calibration of offline-online transf er mapping and constraint sensitivity . In warm- start production A/B tests on a Countr y A recommendation platform, this frame work pushes GMV from − 3.6% to +9.2% within 7 rounds, with peak order v olume reaching +12.5% (Section 4.3 ). • LLM meta-controller with evidence-based reasoning. W e introduce an LLM agent that adjus ts tw o frame work -lev el knobs—transfer function intercept ( 𝛿 intercept ∈ [ − 0 . 1 , + 0 . 1 ] ) and penalty multiplier ( ∈ [ 0 . 5 , 2 . 0 ] )—g rounded in 20-round episode histor ies and 30-update calibration traces. In the Country A warm-star t experiment, the LLM’ s calibration effor t con v erg es from 5 correction items 6 Let the Ag ent Steer : Closed-Loop Ranking Optimization via Influence Exchang e per round to 2 within 7 rounds, indicating that frame w ork -le vel cor rections diminish as evidence accumulates (Section 4.6 ). • Persistent memory architecture f or cumulativ e learning. W e demonstrate that a 7-table relational Memory DB enables the sys tem to w ar m-start on exis ting calibration state and extend cross-round learning into subsequent experiments. The Countr y A case star ts directly from an e xisting Memor y DB state, while the Countr y B case completes a cross-market deplo yment without architectural modification (Sections 4.5 and 4.8 ). The remainder of this repor t is organized as f ollo ws. Section 2 presents the sys tem architecture, detailing the Influence Share metr ic, dual-channel mechanism, LLM meta-controller , and Memor y DB design. Section 3 descr ibes the operational frame work, including the 10-step one-shot pipeline and Y OLO continuous loop with f ailure reco very . Section 4 pro vides ev aluation evidence from 30 optimization rounds across Countr y A and Countr y B, compr ising 7 Country A warm-start rounds and 23 Countr y B deplo yment rounds. Section 6 discusses limitations—including residual parameter oscillation, statistical uncer tainty in low -traffic windo ws, and insufficient evidence f or e xtreme structural breaks—and outlines future directions. 7 Let the Ag ent Steer : Closed-Loop Ranking Optimization via Influence Exchang e 2. Sy stem Ar chitecture In this section, we present the complete architecture of Sor tify , a three-la y er closed-loop sys tem f or continuous sor ting parameter optimization. The sys tem takes online A/B e xper iment data as input, calibrates its inter nal model of offline-online transf er relationships, and outputs optimized sor ting pa- rameters f or the ne xt deplo yment cycle. W e detail the fiv e core components: the Influence Share metr ic and parameter search engine (Section 2.2 ), the Belief channel f or transfer calibration (Section 2.3 ), the Pref erence channel f or constraint adaptation (Section 2.4 ), the LLM meta-controller (Section 2.5 ), and the persistent Memor y DB (Section 2.6 ). 2.1 Ov ervie w Sor tify operates through a three-la y er architecture that separates concerns across human configuration, intellig ent calibration, and parameter search. • La y er 1 (Outer — Human/Configuration): Defines optimization objectiv es (e.g., maximize 𝐼 gmv ), constraint boundaries (e.g., 𝐼 order degradation ≤ 5%), initial parameter ranges, and penalty weight seeds. This lay er is set once per market and updated infrequentl y . • La y er 2 (Middle — LLM + Algorithm): P er f or ms dual-c hannel calibration. The Belief channel cor rects the offline-to-online transf er mapping via LMS regression and LLM-dr iv en intercept adjust- ments. The Pref erence channel adapts constraint penalty w eights via multiplicative updates. The LLM meta-controller orches trates both channels using e vidence from accumulated episode history . • La y er 3 (Inner — Optuna TPE Sear ch): Executes 5,000 tr ials with 25 parallel w orkers in the 7-dimensional parameter space, operating under the calibrated target rang es and penalty w eights produced b y Lay er 2. The dual-channel design in La yer 2 is not an arbitrar y engineer ing partition but a necessar y conse- quence of rational decision axioms. L.J. Sav age ’ s (1954) theory of Subjectiv e Expected Utility (SEU) establishes that an y rational decision requires exactl y tw o independent inputs: what y ou belie ve the w orld to be (probability/belief) and what y ou care about (utility/pref erence). If a sys tem’ s be- ha vior satisfies consistency axioms, its pref erences can be represented b y subjectiv e probabilities and a utility function; the utility representation is uniq ue onl y up to a positive affine transf or mation. Sor tify operationalizes this axiom into a sy stem-lev el decomposition: • Belief channel (truth-seeking): Cor responds to the stat e belief in Sa vag e’ s theory—“Ho w do offline metrics map to online reality?” It concer ns only objectiv e phy sics and system regular ities, car r ying no v alue judgment. • Pref erence channel (v alue-seeking): Corresponds to the utility function in Sav age ’ s theory—“Ho w much does it hur t when a constraint is violated?” It defines onl y loss boundar ies, without interfering with ph ysical regular ities. If these two are not f orcibly decoupled, the sys tem f alls into unav oidable cognitive biases: Wishful Thinking —distorting the objectiv e assessment of offline-online transfer rates because of an intense desire f or goal achiev ement; or Sour Grapes —reducing the impor tance of red-line constraints to make the o v erall loss function conv erge when transfer rates are poor . The dual-channel design sev ers this “diagnostic entanglement” at the architectural lev el, ensur ing independent self-calibration along two or thogonal directions. Further more, an intellig ent agent can er r in two or thogonal directions, each requir ing a mutually e x clusive cor rection path: 1. Epistemic Error : “I predicted it w ould happen, but it didn ’ t”—the sy stem’ s wor ld model has f ailed. The cor rection must not modify penalty weights; it mus t cor rect the belief mapping. 2. Axiological Error: “It happened, but I didn’ t e xpect it to hur t this much ”—the prediction was cor rect but the utility assessment was insufficient. The cor rection must not modify the transfer mapping; it must cor rect the utility function. 8 Let the Ag ent Steer : Closed-Loop Ranking Optimization via Influence Exchang e The complete data flo w f orms a closed loop: online A/B data enters the Memor y DB as a ne w episode → LMS updates transfer model slopes and intercepts → LLM proposes frame work -lev el cor rections → calibrated constraints feed into Optuna search → best parameters are published to Redis → new A/B data is g enerated → the cycle repeats. Each cycle completes in approximatel y 4 hours. Figure 3 | Three-lay er architecture diag ram. La yer 1 (Human/Config) feeds objectiv es and constraints to Lay er 2 (LLM + Algor ithm), which contains the Belief channel, Pref erence channel, and LLM meta-controller . La yer 2 outputs calibrated target_rang e and penalty_weight to Lay er 3 (Optuna TPE Search, 5000 tr ials × 25 work ers). La yer 3 produces best parameters → Redis → online A/B → Memor y DB → back to Lay er 2. 2.2 Influence Share and Parameter Searc h Engine Ph ysical Intuition: R ooms and W alls in High-Dimensional Space Bef ore diving into the detailed mathematical der ivation and the engineering motivation behind the sy stem, let us establish an intuitive geometric and phy sical analogy to understand what “ranking” and “influence ” tr uly represent. Imagine a search request that recalls 𝑛 candidate items. From a traditional engineer ing perspective, ranking simply means calculating a total score f or each of these 𝑛 items and order ing them from highest to lo wes t. Ho w ev er, if w e shift our perspectiv e to a high-dimensional g eometr ic space, a completel y different and more prof ound picture emerg es. W e can view the scores of these 𝑛 items as a single “point ” (a score vector) in an 𝑛 -dimensional space. Within this vas t space, there exis t invisible “walls ”. When do w e hit a w all? The critical state where an y tw o items hav e ex actly identical scores f or ms a “hyperplane wall” (a compar ison boundar y) in this space. Because there are 𝑛 items, the space is intersected by numerous such walls. These intersecting walls par tition the entire 𝑛 -dimensional space into multiple closed “rooms ” (ge- ometrically kno wn as chambers). Ev er y single “room” represents a specific, deterministic, and unique final ranking order . As long as our score vector —the “point”—s tay s saf ely inside a par ticular room, no items ha ve tied scores, and the final ranking list remains absolutel y fixed. No w , consider the task of optimizing the ranking algorithm. In Sor tify , we do this by adjusting the parameters 𝜽 (such as c hanging the w eight of GMV), which alters the final scores. In our geometric analogy , adjusting the parameters is essentiall y pushing this “point ” to mo v e continuously through the 9 Let the Ag ent Steer : Closed-Loop Ranking Optimization via Influence Exchang e space . As the parameters chang e, the point mo ves. If it merely wanders within the boundar ies of a single room, the ranking order does not chang e at all, ev en though the underl ying scores are shifting. It is only when the point crosses a “wall” —s tepping from one room into an adjacent one—that tw o items sw ap their ranks, and the o v erall ranking list actually chang es. This brings us to the core insight of our sys tem: the atomic ev ent of ranking c hange is not the reshuffling of a global list, but the point cr ossing a specific wall. Follo wing this logic, ho w should w e define the “influence ” of individual business factors (such as orders, GMV , or ads) on the final ranking? Since a rank chang e is equiv alent to “the point crashing through a wall, ” w e can simpl y perf or m a ph ysical “f orce analy sis.” The distance to the w all is deter mined b y the score difference betw een tw o items, and this total score difference is the sum of differences contr ibuted by individual f actors. Theref ore, each factor acts as a “pusher” e x er ting f orce in a specific direction. The “influence ” of each f actor is determined b y ho w much “f orce” it ex erts in the normal direction of that wall to push the point across. The Influence Share metr ic measures e xactly this: the percentage of pushing f orce each factor contributes relative to the total push. By adopting this phy sical intuition, w e translate abstract parameter tuning and per mutation-group dynamics into a crys tal-clear force and kinetic attribution analy sis in high- dimensional space. This perspectiv e liberates us from opaque rank cor relation metr ics (like Kendall T au) and allo ws us to del v e into the microscopic phy sical process of e v er y rank sw ap to precisely quantify the contribution of each business factor . 2.2.1 Motiv ation: Be y ond Kendall T au T raditional parameter search in sor ting sys tems relies on rank correlation metr ics such as Kendall T au to measure ho w w ell a candidate parameter set preser v es a targ et ranking order . While Kendall T au captures ordinal ag reement, it has tw o cr itical limitations f or multi-f actor sorting optimization. Firs t, it is not decomposable : Kendall T au produces a single scalar that cannot be attr ibuted to individual factors, making it impossible to answer questions like “ho w much of the sor ting decision is dr iv en b y GMV v ersus order count?” Second, it does not suppor t fact or trade-off analysis : because Kendall T au has no sum-to-one constraint, there is no natural wa y to express “shift 5% of sorting influence from orders to GMV while keeping ad exposure stable.” 2.2.2 Influence Share Definition: From Symme tric Groups to the Influence Permutation Algorithm W e do not treat Influence Share as an isolated heur istic definition. Instead, w e der iv e it as a continuous attribution scheme built on the per mutation str ucture of ranking itself. Consider a request 𝑞 with 𝑛 𝑞 items, inde x ed b y 𝑋 𝑞 = { 1 , . . . , 𝑛 𝑞 } . U nder parameter vector 𝜽 , the ranking outcome f or that reques t is a per mutation in the symmetr ic group: 𝜋 𝑞 ( 𝜽 ) ∈ 𝑆 𝑛 𝑞 . (1) Here 𝜋 𝑞 ( 𝜽 ) ( 𝑘 ) denotes the item placed at rank 𝑘 . Since the symmetric group 𝑆 𝑛 𝑞 is generated by adjacent transpositions 𝑠 𝑘 = ( 𝑘 , 𝑘 + 1 ) , any difference between tw o rankings can be decomposed into a sequence of local sw aps. For ranking control, the atomic ev ent is therefore not “replacing one permutation b y another” but flipping the relativ e order of a specific item pair . T o connect this discrete g roup structure to continuous parameters, let candidate parameters 𝜽 induce a total score v ector S 𝑞 ( 𝜽 ) ∈ R 𝑛 𝑞 f or request 𝑞 . For an y 𝑖 ≠ 𝑗 , define the compar ison hyperplane and the cor responding chamber: 𝐻 𝑞 𝑖 𝑗 : = { 𝑥 ∈ R 𝑛 𝑞 : 𝑥 𝑖 = 𝑥 𝑗 } , 𝐶 𝜋 : = { 𝑥 : 𝑥 𝜋 ( 1 ) > 𝑥 𝜋 ( 2 ) > · · · > 𝑥 𝜋 ( 𝑛 𝑞 ) } . (2) When S 𝑞 ( 𝜽 ) ∈ 𝐶 𝜋 , the ranking is ex actly permutation 𝜋 ; when it crosses some 𝐻 𝑞 𝑖 𝑗 , the relative 10 Let the Ag ent Steer : Closed-Loop Ranking Optimization via Influence Exchang e order of items 𝑖 and 𝑗 flips. This is the classical reflection-g eometric representation of the symmetric group. The local coordinate go v er ning ranking chang e is theref ore the pair wise margin: T o av oid notational ambiguity , w e assume scores are in generic position; if ties occur , a fix ed deterministic tie-breaker resolv es them, so the final ranking can still be treated as an element of 𝑆 𝑛 𝑞 . Δ 𝑞 ( 𝑖 , 𝑗 ; 𝜽 ) : = 𝑆 𝑞 ( 𝑖 ; 𝜽 ) − 𝑆 𝑞 ( 𝑗 ; 𝜽 ) . (3) In Sor tify , the total score is additiv ely decomposed ov er factors: 𝑆 𝑞 ( 𝑖 ; 𝜽 ) = 𝑓 ∈ F score 𝑞 , 𝑓 ( 𝑖 ; 𝜽 ) , Δ 𝑞 ( 𝑖 , 𝑗 ; 𝜽 ) = 𝑓 ∈ F Δ 𝑞 , 𝑓 ( 𝑖 , 𝑗 ; 𝜽 ) , (4) where Δ 𝑞 , 𝑓 ( 𝑖 , 𝑗 ; 𝜽 ) : = score 𝑞 , 𝑓 ( 𝑖 ; 𝜽 ) − score 𝑞 , 𝑓 ( 𝑗 ; 𝜽 ) . (5) This gives the ke y br idg e from group theor y to algor ithm design: parameter updates do not act on a discrete permutation directl y . They first reshape the margin of each pair along the normal direction of the comparison w all; the sign of that margin determines whether a sw ap occurs; and the accumulation of such sw aps yields a new per mutation. U nder this lens, parameter search becomes an influence permutation algorithm: it continuousl y reallocates each factor ’ s share of responsibility for potential swaps across impor tant item pairs. T o turn that responsibility into a stable metric, we impose fiv e attribution requirements at the pair le vel: locality , sign inv ariance, non-negativity , par tition of unity , and inv ar iance under common positiv e rescaling. Under these requirements, the simplest choice is an 𝐿 1 normalization of absolute factor margins. Define the total pair wise influence budg et as: 𝑍 𝑞 𝑖 𝑗 ( 𝜽 ) : = 𝑓 ∈ F Δ 𝑞 , 𝑓 ( 𝑖 , 𝑗 ; 𝜽 ) . (6) If 𝑍 𝑞 𝑖 𝑗 ( 𝜽 ) = 0 , then no f actor pro vides an y discr iminativ e signal f or that pair , so the pair car r ies no ranking inf or mation and can be e x cluded from agg regation. For all informativ e pairs, the pair wise influence share of f actor 𝑓 is defined as: 𝑠 𝑞 , 𝑓 ( 𝑖 , 𝑗 ; 𝜽 ) = Δ 𝑞 , 𝑓 ( 𝑖 , 𝑗 ; 𝜽 ) 𝑍 𝑞 𝑖 𝑗 ( 𝜽 ) . (7) It f ollow s immediatel y that Í 𝑓 ∈ F 𝑠 𝑞 , 𝑓 ( 𝑖 , 𝑗 ; 𝜽 ) = 1 . The role of the absolute value is to separate direction from magnitude: the sign of Δ 𝑞 , 𝑓 indicates which item the factor pushes f or ward, while Δ 𝑞 , 𝑓 measures ho w strongl y it pushes. Holding other components fix ed, 𝑠 𝑞 , 𝑓 ( 𝑖 , 𝑗 ; 𝜽 ) increases monotonically with Δ 𝑞 , 𝑓 ( 𝑖 , 𝑗 ; 𝜽 ) , giving an interpretable local influence signal without requiring the global permutation to v ar y monotonically with ev er y parameter . T o mo v e from pair -lev el shares to a request-le v el or dataset-le v el metr ic, w e aggregate only inf or mativ e and business-relev ant pairs. Let 𝑃 𝑞 denote the pair set f or request 𝑞 ; it may contain all inf or mativ e pairs or be restricted to a T op- ( 𝐾 + 𝐿 ) region. F or ( 𝑖 , 𝑗 ) ∈ 𝑃 𝑞 , let 𝑟 𝑞 𝑖 denote the rank of item 𝑖 in request 𝑞 , and define the position-sensitiv e weight: 𝑤 𝑞 𝑖 𝑗 = e xp − min ( 𝑟 𝑞 𝑖 , 𝑟 𝑞 𝑗 ) 𝜏 . (8) Here 𝜏 controls the decay rate. P airs inv ol ving higher -ranked items receiv e larger weights, reflecting the business reality that top-of-pag e positions matter dispropor tionately . The aggregate Influence Share f or factor 𝑓 is then: 11 Let the Ag ent Steer : Closed-Loop Ranking Optimization via Influence Exchang e 𝐼 𝑓 ( 𝜽 ) = Í 𝑞 Í ( 𝑖 , 𝑗 ) ∈ 𝑃 𝑞 𝑤 𝑞 𝑖 𝑗 · 𝑠 𝑞 , 𝑓 ( 𝑖 , 𝑗 ; 𝜽 ) Í 𝑞 Í ( 𝑖 , 𝑗 ) ∈ 𝑃 𝑞 𝑤 𝑞 𝑖 𝑗 . (9) By construction, Í 𝑓 ∈ F 𝐼 𝑓 ( 𝜽 ) = 1 . This sum-to-one proper ty is what enables “ex chang e” reasoning: increasing 𝐼 gmv b y 5 percentage points necessar ily decreases other factors b y a combined 5 percentag e points, making trade-offs explicit and quantifiable. At this point the der ivation closes: a ranking in 𝑆 𝑛 𝑞 is g enerated b y pair wise swaps, swaps are tr iggered b y pair wise mar gins crossing comparison walls, and Influence Share measures how much of those potential swaps is attr ibutable to each factor . Operationall y , the influence permutation algorithm consists of fiv e steps: compute f actor -wise scores and sum them into total scores; sor t to obtain 𝜋 𝑞 ( 𝜽 ) ; compute Δ 𝑞 , 𝑓 and 𝑠 𝑞 , 𝑓 on 𝑃 𝑞 ; aggregate with 𝑤 𝑞 𝑖 𝑗 ; and pass 𝐼 𝑓 ( 𝜽 ) to the do wnstream objectiv e and constraints. 2.2.3 Multi-Objectiv e Search F ormulation The parameter search optimizes a composite objective that maximizes the pr imar y business metr ic ( 𝐼 gmv uplift) while penalizing constraint violations via quadratic penalties: J ( 𝜽 ) = 10 · 𝐼 gmv ( 𝜽 ) − 𝐼 base gmv | 𝐼 base gmv | | {z } relativ e uplift − 𝐽 𝑗 = 1 𝜆 𝑗 · max ( 0 , 𝑣 𝑗 ( 𝜽 ) ) 2 (10) where 𝜽 = ( ps_ads_wo , ps_ads_w g , ps_org_w o , ps_org_w g , ps_porg_w , ps_price_pow , ps_w2 ) is the 7-dimensional parameter v ector , 𝑣 𝑗 ( 𝜽 ) is the violation of the 𝑗 -th constraint (positiv e when vio- lated), and 𝜆 𝑗 is the penalty w eight f or constraint 𝑗 . The quadratic penalty f or m is a deliberate design choice: penalty 𝑗 = 𝜆 𝑗 · 𝑣 2 𝑗 (11) A 1% violation incurs a penalty of 𝜆 𝑗 × 0 . 01 2 , while a 10% violation incurs 𝜆 𝑗 × 0 . 10 2 — a 100x difference. This conv exity tolerates minor boundary brushes while aggressivel y penalizing larg e violations, biasing the search to ward solutions where all constraints are mildl y satisfied rather than one being sev erely violated. Linear penalties, by contrast, w ould treat a 10% violation as merel y 10x w orse than a 1% violation, insufficient f or industrial constraint enf orcement. Constraints include bounds on 𝐼 order degradation, 𝐼 ecpm_term degradation, ads top-10 e xposure rate, and 𝐼 gmv_ads . The penalty w eights 𝜆 𝑗 are initialized at values between 15,000 and 30,000 and are subsequentl y adapted b y the Preference channel (Section 2.4 ). Figure 4 | Flow diagram showing: item pairs → pair wise score differences → per-f actor share (sum=1) → rank - w eighted aggregation → 𝐼 gmv , 𝐼 order , 𝐼 ecpm_term . Below : 7 parameters map into the sor ting f ormula, changing factor contributions. 12 Let the Ag ent Steer : Closed-Loop Ranking Optimization via Influence Exchang e 2.2.4 Searc h Engine The search is e xecuted by Optuna ’ s TPE (T ree-structured Parzen Es timator) sampler Akiba et al. [ 2019 ], which models the conditional distribution of parameters giv en good v ersus bad objective values. Each round runs 5,000 trials with 25 parallel w ork ers using the Constant Liar strategy — when a w orker starts a trial bef ore others finish, it assumes pending tr ials will return a pessimistic v alue, prev enting redundant e xploration. A typical searc h completes in 15–30 minutes . As demonstrated in Section 4.3 , this searc h engine consistently finds parameter configurations that achie v e 𝐼 gmv uplifts of +4.9% to +41.6% relativ e to baseline, subject to calibrated constraints. 2.3 Belief Channel: Offline-Online T ransfer Calibration 2.3.1 Motiv ation The offline-online transf er g ap documented in Section 1 is not a fix ed constant — it varies across metrics, drifts ov er time, and shifts abr uptly with traffic patter n chang es. A static calibration (e.g., “offline GMV predictions are alw a ys 3x too optimis tic”) w ould become s tale within da y s. The Belief channel addresses this b y maintaining a continuously updated linear transfer model f or each metric pair , combining a slo w algor ithmic estimator (LMS) with a fast patter n-recognizing agent (LLM). From a Ba y esian epistemological perspectiv e, the Belief channel embodies tw o fundamentally differ - ent philosophies f or confronting an uncer tain wor ld—a dual tempo of belief updating: normal science with smooth priors (LMS) represents the classical Ba y esian framew ork, assuming the wor ld is continu- ous (Marko vian), with each round of ne w evidence incrementall y refining the pr ior; paradigm shift and black sw ans (LLM intercept jumps) represent the decisiv e recognition of structural breakpoints when the underl ying distribution undergoes cliff-like chang es—discarding the old prior and f orcibly injecting a new one. The former handles routine dis tr ibutional dr ift; the latter responds to sudden paradigmatic disruptions. T ogether , they constitute a complete response to an uncer tain w orld. 2.3.2 Linear T ransfer Model For each metric pair (e.g., 𝐼 gmv → GMV , 𝐼 order → Orders), w e model the offline-to-online relationship as: ˆ 𝑢 online = 𝛼 · 𝑢 offline + 𝛽 (12) where 𝑢 offline and 𝑢 online are the obser v ed offline and online uplifts respectiv ely , 𝛼 (slope) captures the transf er rate, and 𝛽 (intercept) captures the systematic bias. Six such relationships are maintained: GMV~ 𝐼 gmv , Orders~ 𝐼 order , A ds Re v enue~ 𝐼 ecpm_term , and three derived metr ics. 2.3.3 LMS Continuous Calibration After each round, the slope and intercept are updated via Least Mean Squares (LMS) reg ression with learning rate 𝜂 = 0 . 2 : 𝛼 𝑡 + 1 = 𝛼 𝑡 + 𝜂 · 𝑒 𝑡 · 𝑢 offline , 𝑡 (13) 𝛽 𝑡 + 1 = 𝛽 𝑡 + 𝜂 · 𝑒 𝑡 (14) where the prediction er ror 𝑒 𝑡 = 𝑢 online , 𝑡 − ˆ 𝑢 online , 𝑡 . LMS provides s table, monotonic conv ergence for gradual dis tr ibution drift. Ho we v er, under sudden s tr uctural shifts (e.g., a promotional ev ent or traffic source c hange), LMS with 𝜂 = 0 . 2 requires approximatel y 15 rounds to reach 95% conv erg ence — equiv alent to o v er 2 da ys of production data, dur ing which the sys tem operates with a miscalibrated transf er model. 13 Let the Ag ent Steer : Closed-Loop Ranking Optimization via Influence Exchang e 2.3.4 LLM Selectiv e Jumps T o compress reco very time from structural breaks, the LLM meta-controller (Section 2.5 ) can directl y adjust the intercept 𝛽 in discrete jumps of up to ± 0 . 1 : 𝛽 new = 𝛽 old + Δ 𝛽 LLM , Δ 𝛽 LLM ∈ { 0 , ± 0 . 05 , ± 0 . 1 } (15) The LLM e xamines 20-round episode history and can detect patter ns invisible to single-obser vation LMS — f or ex ample, “5 consecutive rounds where GMV transf er was pessimistic despite positive 𝐼 gmv trends.” When the LLM detects such a patter n, a single intercept jump can accomplish what LMS w ould need 10+ rounds to achiev e. Cr iticall y , the LLM adjusts only the int ercept , not the slope, because intercept shifts represent sys tematic bias chang es while slope changes indicate fundamental relationship restructur ing, which should be left to the more conser vativ e LMS estimator . The output of the Belief channel is a calibrated target_rang e for eac h constrained metric — the offline uplift rang e that, after applying the calibrated transf er function, maps to an acceptable online outcome. Figure 5 | T w o-axis diagram. Hor izontal axis: Belief (targ et_range = position of constraint boundar y). V er tical axis: Preference (penalty_w eight = hardness of constraint boundar y). Arrow s show LMS moving along Belief axis continuously , LLM making discrete jumps along Belief axis, and violation pressure moving along Preference axis. The two ax es are orthogonal — cor rections on one do not affect the other . As shown in Section 4.4 , ev en under w ar m-start conditions the Belief channel must continue updating with new obser vations: in Exp-401838, R2 still e xhibited a clearl y optimistic offline bias, while by R7 the same kind of positiv e offline signal had become able to translate into significantly positive online GMV . 14 Let the Ag ent Steer : Closed-Loop Ranking Optimization via Influence Exchang e 2.4 Pref erence Channel: Constraint Penalty Adap t ation 2.4.1 Motiv ation Ev en with a per f ectly calibrated transfer model, the search framew ork still needs to kno w how hard to enf orce each constraint. A constraint that w as har mlessly br ushed in round 𝑁 ma y become cr iticall y binding in round 𝑁 + 1 due to changing mark et conditions. The Preference channel continuously adjusts constraint penalty weights based on obser ved violation patter ns. Within Sa vag e ’ s SEU frame work, the Preference channel addresses a fundamentally different er ror type from the epistemic er ror corrected b y the Belief channel— axiological error : “It happened, but I didn ’ t expect it to hur t this much.” The sys tem’ s prediction was entirel y correct, but its assessment of the outcome ’ s “pain ” (utility loss) was sev erely insufficient. For instance, the sys tem accurately predicted a minor decline in a metr ic, the online result confirmed a minor decline, yet this small decline tr iggered a catastrophic aler t in the business dashboard. In this case, the correction path must not touch the transfer mapping —the wor ld model is not wrong—but must instead cor rect the utility function: the sys tem is learning that “this red line is f ar harder than e xpected; ne xt time, e ven at the cost of the pr imar y objectiv e, it must nev er be crossed again.” 2.4.2 Violation Pressur e For each constraint 𝑗 , we compute a nor malized violation pressure: 𝑝 𝑗 = 𝑣 𝑗 ( 𝜽 ) 𝑣 threshold 𝑗 (16) where 𝑣 𝑗 ( 𝜽 ) is the obser v ed violation magnitude and 𝑣 threshold 𝑗 is the acceptable violation threshold. A pressure of 𝑝 𝑗 > 0 indicates the constraint is being violated; 𝑝 𝑗 ≤ 0 indicates it is satisfied. 2.4.3 Asymmetric Multiplicativ e U pdate The penalty w eight update f ollow s a multiplicativ e r ule with asymmetr ic step sizes: 𝛿 𝑗 = ( 𝛿 up = 0 . 25 if 𝑝 𝑗 > 0 − 𝛿 do wn = − 0 . 08 if 𝑝 𝑗 ≤ 0 (17) 𝜆 ( 𝑡 + 1 ) 𝑗 = 𝜆 ( 𝑡 ) 𝑗 · exp ( 𝛿 𝑗 ) (18) This design encodes three deliberate proper ties: 1. Scale inv ariance. Multiplicativ e updates apply equal percentag e chang es regardless of the absolute magnitude of 𝜆 𝑗 . When one constraint has 𝜆 = 1 , 000 and another has 𝜆 = 80 , 000 , eq ual violation pressure produces propor tionally equal adjustments. A dditive updates would o ver -cor rect small w eights and under -cor rect larg e ones. 2. Loss a version. The asymmetry 𝛿 up = 0 . 25 > 𝛿 do wn = 0 . 08 means that tightening a constraint (in response to violation) is 3x faster than relaxing it (when satisfied). This reflects the industrial reality that the cos t of a constraint violation (e.g., ad rev enue collapse) outw eighs the opportunity cost of an o v erl y tight constraint (e.g., slightl y suboptimal GMV). 3. Log-space interpre t ability . Because the update is multiplicativ e in the original space and additive in log-space, 𝛿 up and 𝛿 do wn are directly inter pretable as one-round tightening and relaxation steps. The y are intentionall y asymmetric, making the sys tem more responsive to violations than to relaxation oppor tunities. The Preference channel’ s output is a set of calibrated penalty_w eight v alues that feed directl y into the objectiv e function (Eq. 10 ). As demonstrated in Section 4.5 , the Preference channel’ s adaptiv e w eights contribute to nar rowing parameter oscillation amplitude across successive experiments. 15 Let the Ag ent Steer : Closed-Loop Ranking Optimization via Influence Exchang e 2.5 LLM Meta-Controller 2.5.1 Motiv ation The LMS es timator in the Belief channel handles routine distribution drift effectiv ely but is fun- damentall y a single-obser vation, fixed-s tep-size algorithm. It cannot detect multi-round patterns (e.g., “5 consecutiv e rounds of pessimis tic GMV transf er”), dis tinguish between noise and structural breaks, or reason about the r elationship between Belief cor rections and Pref erence cor rections. The LLM meta-controller fills this gap by providing episodic patter n recognition and cross-channel reasoning. From a cyber netics perspective, the LLM meta-controller ac hiev es a leap from first-order control to second-order control (reflection) . F irst-order control—the Optuna search engine finding optimal solutions in the high-dimensional parameter space under giv en Belief and Pref erence conditions—is direct control o ver the “environment.” The LLM meta-controller , by contras t, does not directly manipulate the lo w-le v el sor ting parameters 𝜽 . Its inputs are “how the sys tem has been perceiving data ” (LMS update histories and obser v ation er rors in the Memor y DB)—it is learning ho w the system learns . This intervention on frame w ork -le vel meta-parameters (intercepts and penalty multipliers) endow s the sys tem with the capacity f or self-reflection. What the LLM accomplishes is not parameter optimization, but “belief epiphan y” and “value recalibration.” 2.5.2 T w o Orthogonal Knobs The LLM operates on e xactl y two output variables: Δ 𝛽 LLM ∈ [ − 0 . 1 , + 0 . 1 ] (Belief channel: intercept adjustment) (19) 𝑚 LLM ∈ [ 0 . 5 , 2 . 0 ] (Preference channel: penalty multiplier) (20) These bounds are safety constraints, not suggestions. A single-round intercept shift of ± 0 . 1 is already a large cor rection; the cap prev ents catastrophic miscalibration from a single LLM er ror . The penalty multiplier range of [ 0 . 5 , 2 . 0 ] allo ws hal ving or doubling a constraint ’ s enf orcement s trength, sufficient f or responding to structural breaks without enabling r una wa y penalty inflation. A cr itical design decision is that the LLM adjusts fr amewor k-lev el parameters (intercepts and penalty multipliers), not the 7-dimensional bottom-le v el sor ting parameter vector ( 𝜽 ). The rationale is grounded in the distinction between e xperience and facts : “offline GMV predictions ha ve been 5–8% optimistic ov er the past 3 rounds ” is a reusable structural insight that transf ers across data snapshots, while “ps_ads_w g = 2.15” is a one-time fact about today’ s data distribution that ma y be 1.73 tomor ro w . The LLM operates in the space of reusable e xper ience; Optuna operates in the space of ephemeral f acts. 2.5.3 Context and Evidence Requir ements The LLM receives a structured conte xt JSON containing: (1) the cur rent slope and intercept f or all 6 prior relations, (2) the 20 most recent episodes with paired offline-online metr ics, (3) the 30 most recent prior update histor y records (both LMS and LLM), and (4) the current penalty weight state. Ev er y LLM proposal must cite specific episode ke ys as evidence. Proposals without e vidence are rejected. When the LLM’ s confidence is lo w — f or instance, if the recent episodes sho w contradictory signals — it is instructed to retur n an empty proposal (no adjustment), which is preferable to a w eakly grounded cor rection. 2.5.4 Implementation: Model, Promp t, and Output Safe ty Model and inv ocation. The meta-controller inv okes an LLM through the Codex CLI’ s 2 exec sub- command in a sandbox ed subprocess. Sortify implements its o wn memory sys tem (Section 2.6 ) and 2 OpenAI Codex CLI, https://github.com/openai/codex 16 Let the Ag ent Steer : Closed-Loop Ranking Optimization via Influence Exchang e Figure 6 | Input assembl y: 20-round episode history (offline/online metr ic pairs) + 30 prior update records (LMS and LLM cor rection history) + cur rent penalty w eights → Context JSON → LLM reasoning → Output: {delta_intercept, penalty_multiplier , reason, e vidence_ke ys}. T w o ar row s from output: delta_intercept f eeds into Belief channel (intercept update), penalty_multiplier feeds into Pref erence channel (w eight scaling). Saf ety bounds sho wn as guard rails on both outputs. tool-calling mechanisms, making it a full y capable autonomous agent in its o wn r ight—Code x ser v es solel y as the underl ying LLM inf erence engine, not as an agent framew ork. The in v ocation command is: codex exec - --skip-git-repo-check \ --sandbox read-only --color never \ -c model_reasoning_effort="high" The prompt is passed through standard input, and the response is read from s tandard output. The reasoning effor t is set to high, which activ ates extended reasoning before the model produces its s tr uctured JSON output. A 300-second timeout pre vents pipeline stalls. No temperature parameter is set e xplicitly ; the e xtended-reasoning mode subsumes sampling control b y directing the model to reason thoroughly bef ore committing to an answ er . Prom pt structure. The LLM receiv es a single-shot prompt consisting of tw o concatenated par ts: 1. Sy stem instructions ( ∼ 600 words, hardcoded): Define the output JSON schema ( proposal_id , an ar ra y of proposals each containing relation_key , delta_intercept , penalty_multiplier , reason , and evidence_episode_keys ), specify saf ety bounds ( | Δ 𝛽 | ≤ 0 . 1 , 𝑚 ∈ [ 0 . 5 , 2 . 0 ] ), and frame the task as Ba y esian decision alignment—separating belief updates (intercept corrections on the transf er -function) from pref erence updates (loss-weight scaling for constraint violations). 2. Context JSON (dynamicall y generated): The structured context described in Section 2.5.3 , e xpor ted b y the export-llm-context command from the Memor y DB. No f e w-shot e xamples are pro vided. The prompt is deliberatel y kept zero-shot to av oid anchoring the model on past cor rection patter ns, which could suppress no v el structural insights. Output parsing and safe ty la yers. The LLM’ s raw te xt output passes through a se v en-lay er saf ety pipeline bef ore an y system state is modified: 1. Prom pt-le vel instruction: The sys tem instructions explicitl y constrain output format and v alue rang es. 17 Let the Ag ent Steer : Closed-Loop Ranking Optimization via Influence Exchang e 2. R obust JSON extraction: A three-strategy parser attempts direct json.loads , then Markdo wn code-block e xtraction via rege x, then a brace-depth state machine to isolate the first complete JSON object from potentiall y noisy output. 3. Schema v alidation and type coercion: Each proposal field is v alidated: missing delta_intercept def aults to 0.0, missing penalty_multiplier def aults to 1.0, and all numer ic fields are cast to float . Malf or med entries are silently dropped. 4. Relation k ey whitelist: Ev er y relation_key in the proposal is check ed agains t the set of ke ys present in the conte xt’ s prior relations. U nknown ke ys tr igger an immediate rejection. 5. Hard clamp: R egardless of the LLM’ s output, Δ 𝛽 LLM is clamped to [ − 0 . 1 , + 0 . 1 ] and 𝑚 LLM to [ 0 . 5 , 2 . 0 ] in code. 6. Global w eight bounds: Even after multiplicativ e scaling, penalty w eights s tay within configured floors and ceilings (e.g., [ 1 , 000 , 80 , 000 ] ), prev enting cumulative dr ift across rounds. 7. F ailure fallbac k: If the LLM call times out, retur ns unparseable output, or produces an empty proposal ar ray , the system f alls back to a no-op proposal ( Δ 𝛽 = 0 , 𝑚 = 1 . 0 ). The pipeline continues without inter ruption. This def ense-in-depth design ensures that the LLM is a bounded advisor : it can accelerate con v erg ence through structural insight, but cannot destabilize the sys tem ev en under adv ersar ial or deg enerate outputs. 2.5.5 Coordination with LMS LMS and LLM operate in ser ial within each round: LMS updates first (Step 5 of the pipeline), then the LLM reads the post-LMS s tate and proposes adjustments (S teps 7–8). This ordering ensures the LLM operates on the most cur rent algorithmic calibration. T o pre vent oscillation between channels, a freeze rule applies: if the Belief channel update e x ceeds a threshold magnitude, the Pref erence channel freezes f or one round, preser ving diagnostic clar ity . As demonstrated in Section 4.6 , in Exp-401838, LLM calibration effor t con ver ges from 5 cor rection items per round to 2 within 7 rounds, indicating that frame work -lev el cor rections diminish as evidence accumulates. 2.6 Memory DB and State Persistence 2.6.1 Motiv ation Without persistent state, the sy stem suffers from a “Groundhog Da y” effect: each round starts with no know ledge of past transfer relationships, penalty sensitivities, or LLM cor rection patter ns. After 30 rounds, the system w ould possess no more calibration intelligence than it had at round 1. The Memory DB solv es this b y providing a relational store that accumulates ev er y obser v ation, calibration update, and decision across the sy stem’ s lif etime. 2.6.2 Schema Design The Memory DB consists of 7 SQLite tables designed f or idempotent wr ites and immutable audit: The schema enforces two cr itical proper ties: 1. Idempo tency . Composite ke ys (relation_ke y + episode_ke y) in prior_observations prev ent duplicate wr ites if a pipeline step is retried after failure. The same obser v ation wr itten twice produces identical state. 2. Immutability . The memory_events table serv es as a write-ahead log. No ro w is ev er deleted or modified, pro viding a complete f orensic trace f or debugging calibration anomalies. 2.6.3 Cross-R ound Intelligence The Memory DB enables three forms of cross-round intellig ence: • LLM context assembl y . The 20 mos t recent episodes and 30 most recent update his tor y records 18 Let the Ag ent Steer : Closed-Loop Ranking Optimization via Influence Exchang e T able 1 | Memory DB schema o vervie w . T able Role Ke y Fields W rite P attern episodes F act table: one row per round with paired offline-online snapshots episode_ke y , offline_metr ics, online_uplifts, status Append-only ; status: offline → deploy ed → online offline_candidates T op-5 parameter candidates per round episode_ke y , rank, params, metr ics Append per round prior_relations Current Belief channel state: slope & intercept per metr ic pair relation_ke y , slope, intercept, eta U pser t per round prior_observations Ra w (offline, online, beta) tr iples per metr ic pair and episode relation_ke y , episode_ke y , offline_uplift, online_uplift Append with idempotency prior_update_history Belief channel audit trail method (lms/llm), old/new slope, old/ne w intercept Append-only penalty_wt_upd_hist Pref erence channel audit trail constraint_metric, pressure, step, old/ne w weight Append-only memory_events Immutable global audit log ev ent_type, idempotency_ke y , metadata_json Append-only are e xtracted and f ormatted as the LLM’ s input conte xt. As the database gro ws, the LLM gains increasingl y r ich e vidence f or patter n detection. • W arm-start across experiments. Exp-401838 started from an e xisting Memor y DB state with pre-calibrated transf er models and penalty w eights, rather than def ault slopes and intercepts. This capability allo ws the sy stem to e xtend calibration intelligence from prior episodes into new production rounds (Sections 4.3 and 4.5 ). • Cross-mark et transfer . When deplo ying to Countr y B, the Memor y DB schema was reused without modification. The sys tem initialized with default priors but accumulated Countr y B-specific calibra- tion within a single round, correctly identifying that org anic click weights (ps_org_w c) w ere sev erel y underweighted in the baseline f or mula (Section 4.8 ). As demons trated in Section 4.8 , the persistent Memor y DB enables Sor tify to generalize across markets without architectural chang es, validating the design pr inciple that calibration intellig ence should be cumulativ e rather than ephemeral. 19 Let the Ag ent Steer : Closed-Loop Ranking Optimization via Influence Exchang e Figure 7 | Complete data flow across one Y OLO cy cle: (1) A/B data pulled → (2) Episode recorded in Memory DB → (3) LMS reads pr ior_obser v ations, updates pr ior_relations → (4) LLM conte xt assembled from episodes + update histories → (5) LLM proposal applied to intercepts and penalty weights → (6) T arg et ranges and penalty w eights f eed into Optuna objectiv e → (7) 5000-tr ial search → (8) Best parameters published to Redis → (9) New A/B data g enerated → back to (1). Memory DB is the central state store connecting all steps. 20 Let the Ag ent Steer : Closed-Loop Ranking Optimization via Influence Exchang e 3. Operational Frame w ork In this section, w e descr ibe ho w Sor tify operates as a production system — the infrastructure it r uns on, the step-b y-step pipeline f or a single optimization round, and the continuous loop that chains rounds into an autonomous, self-reco v er ing process. The goal is to demonstrate that the architecture descr ibed in Section 2 is not merel y a theoretical framew ork but an operationall y viable sy stem that r uns unattended with built-in f ailure handling. 3.1 Sy stem Infrastructure T able 2 | Sy stem configuration. Component Specification Search engine Optuna TPE sampler Akiba et al. [ 2019 ] T r ials per round 5,000 Parallel work ers 25 (Constant Liar strategy) State database SQLite ( agent_memory.db ) Parameter publishing R edis ke y-v alue store Search time per round 15–30 minutes Data accumulation windo w 3.5 hours (minimum) Processing time per round 25–50 minutes T otal cy cle time ∼ 4 hours Dail y throughput ∼ 6 rounds/da y Time alignment 15-minute boundary snapping T ak ea wa y: The total cycle time of appro ximately 4 hours — 3.5 hours for online data accumulation plus 25–50 minutes for processing — enables roughly 6 optimization rounds per day . This cadence is f ast enough to respond to intra-day traffic pattern shifts while accumulating sufficient data volume f or statis tically meaningful A/B compar isons. The sy stem’ s r untime footprint is deliberately lightw eight. The Memor y DB is a single SQLite file; the search engine r uns on a single machine; parameter publishing uses a standard Redis instance shared with other production ser vices. No GPU resources are required. The only e xter nal dependency bey ond the platf or m’ s exis ting A/B infrastructure is the LLM API call for meta-controller proposals. 3.2 One-Shot Pipeline Each optimization round ex ecutes a 10-step pipeline. The design target is restart saf ety , not strict run-to-r un deter minism: persisted state transitions (such as episode wr ites, prior updates, and state-file updates) are idempotent, so re-r unning a completed write step after interr uption does not cor r upt state; ho we ver , steps that depend on e xternal services, especially LLM proposal generation, are not assumed to return byte-identical outputs on e v er y retr y . Steps 1–4: Dat a Collection. • Step 1 — Pull A/B report. Fetch the online A/B e xper iment repor t f or the current obser vation windo w . The repor t contains uplift percentag es f or GMV , Orders, A ds Re v enue, A dvertiser V alue, Org anic Clicks, and Ads CTR relativ e to the control group. • Step 2 — Initialize Memory DB. If this is the first round, create the 7-table schema. On subsequent rounds, v er ify schema integ rity and open the exis ting database. • Step 3 — Record offline metrics. W r ite the cur rent round’ s offline search results (objective value, 21 Let the Ag ent Steer : Closed-Loop Ranking Optimization via Influence Exchang e Influence Share metr ics, parameter vector , top-5 candidates) as a ne w episode in the Memor y DB with status offline_recorded . • Step 4 — Recor d online metrics. Parse the A/B repor t from S tep 1, write online uplift values to the episode record, and transition the episode status to online_recorded . Step 5: LMS Calibration (Belief Channel). For each of the 6 pr ior relations, compute the prediction er ror betw een the calibrated transf er model’ s f orecast and the actual online uplift, then apply LMS updates to slope and intercept (Eqs. 13 and 14 ). All updates are persisted to prior_relations and logged in prior_update_history with method lms_regression . Step 6: LLM Context Export. Assemble the LLM conte xt JSON by extracting: (1) cur rent slope/intercept for all 6 relations, (2) the 20 most recent episodes, (3) the 30 mos t recent pr ior update history records, and (4) cur rent penalty w eight state. W r ite the conte xt to a timestamped file f or audit. Step 7: LLM Proposal Generation. Call the LLM API with the structured context and system prompt. The LLM returns a JSON proposal containing delta_intercept entr ies (one per relation) and penalty_multiplier entr ies (one per constraint), each with a reason field and evidence_keys citing specific episodes. If confidence is low , the LLM retur ns an empty proposal. Step 8: Appl y LLM Proposal. For each non-empty proposal item: apply delta_intercept to the corresponding relation’ s intercept in prior_relations , and apply penalty_multiplier to the cor responding cons traint’ s penalty w eight. Log all chang es in prior_update_history (method llm_proposal ) and penalty_weight_update_history . If the Belief update magnitude e x ceeds the freeze threshold, skip Pref erence updates f or this round. Step 9: Deriv e T arget Rang e. Using the updated transf er model (slope, intercept), compute the offline uplift rang e that maps to an acceptable online outcome f or each constrained metric. This calibrated target_range replaces the static constraint boundar ies in the search objective. Step 10: Deriv e Penalty W eight. Compute violation pressure f or each constraint based on the most recent episode’ s results (Eq. 16 ), apply the asymmetric multiplicativ e update (Eqs. 17 and 18 ), and persist the ne w penalty weights. Final: Searc h and Publish. Execute the Optuna TPE search (5,000 tr ials, 25 work ers) with the calibrated targ et rang es and penalty w eights. Extract the bes t parameter v ector , publish to R edis, and write a handoff state file ( one-shot-latest.env ) recording the run tag, config path, and best parameters f or the ne xt round. 3.3 Y OLO Continuous Loop The Y OLO (Y ou Only Liv e Once) mode chains one-shot pipeline e x ecutions into an infinite au- tonomous loop with three phases. Phase 1 — Coldstart. On first launch, boots trap initial parameters to Redis using def ault or user - specified values. Anchor the obser vation time window to the cur rent timestamp, aligned to a 15-minute boundary . No A/B data e xists y et; skip LLM diagnostics and proceed directly to offline search with def ault pr iors. Phase 2 — Initial. Execute the first full one-shot pipeline with optional manual confir mation. This round establishes the baseline episode in the Memor y DB and the first A/B observation pair . Phase 3 — Y OLO. Enter the infinite loop: 22 Let the Ag ent Steer : Closed-Loop Ranking Optimization via Influence Exchang e 1. W ait until the minimum data accumulation window (3.5 hours) has elapsed since the last parameter push. 2. Pull the A/B repor t f or the elapsed windo w . 3. Ex ecute the full one-shot pipeline (Steps 1–10 + Search + Publish). 4. U pdate yolo-state.env with the ne w round number, push timestamp, observation window , previous parameters, and A/B repor t path. 5. Append a complete round record to yolo-event-log.md (round number , timestamp, parameters, A/B results, LLM proposal, er rors). 6. R etur n to step 1. F ailure Handling. The Y OLO loop distinguishes tw o failure categor ies: • A/B data fetc h failures (transient): Retry up to 5 times at 5-minute inter v als. Detection cr iterion: A/B repor t file is missing or contains f e wer than 3 lines. • Non- A/B failures (search crash, Redis er ror , DB cor ruption): Exit immediately without retry . The operator in ves tigates and restar ts manually . State R eco very . On res tar t after a crash or manual s top, the Y OLO loop reads yolo-state.env to reco ver: the last completed round number, the timestamp of the last parameter push, the obser vation windo w boundar ies, and the previous parameter v ector . The loop resumes from the next round, reusing the obser vation windo w endpoint as the ne w window start. A f orced reset ( --reset flag) clears the state file and restarts from Phase 1. Figure 8 | Y OLO Continuous Loop: S tate machine diag ram with three states — Colds tar t (boots trap params, anchor time window), Initial (first full pipeline with manual confir mation), Y OLO (infinite loop: w ait 3.5h, pull A/B, pipeline, publish, update state, loop). R etr y logic shown as a self-loop on the A/B pull step (up to 5 retr ies). Exit ar ro w from non-A/B f ailures. Reco very ar row from restart reading y olo-state.en v bac k into Y OLO state. As demonstrated in Sections 4.3 and 4.8 , the Y OLO loop ran 7 consecutiv e rounds (25 hours) in Exp- 401838 and accumulated 23 rounds across tw o search phases in Countr y B, validating the operational robustness of this design. 23 Let the Ag ent Steer : Closed-Loop Ranking Optimization via Influence Exchang e 4. Ev aluation In this section, we present e xper imental and deplo yment e vidence from 30 optimization rounds across tw o markets (Country A and Country B). W e ev aluate Sor tify along six ax es: online business effectiv eness (Section 4.3 ), offline-online transf er calibration quality (Section 4.4 ), parameter stability (Section 4.5 ), LLM meta-controller effectiv eness (Section 4.6 ), sensitivity anal ysis (Section 4.7 ), and Country B deplo yment from cold start to production rollout (Section 4.8 ). W e conclude with an efficiency anal ysis (Section 4.9 ). 4.1 Metrics W e e valuate Sortify using three categor ies of metr ics: Offline metrics (Influence Share based): • 𝐼 gmv : Influence share of the GMV factor in sorting decisions. The primar y optimization targ et. • 𝐼 order : Influence share of the order factor . Constrained to prev ent ex cessive order deg radation. • 𝐼 ecpm_term : Influence share of the advertising eCPM factor . Constrained to protect ad rev enue. • 𝐼 gmv_ads : Influence share of GMV within the advertising channel. • ads_top10_rate : Fraction of ads appear ing in the top-10 positions. Constrained to maintain ad e xposure. Online metrics (A/B test): • GMV : Gross merchandise v alue uplift vs. control group. Pr imar y business KPI. • Orders : Order volume uplift. Secondary business KPI. • Ads Re v enue : T otal adv er tising rev enue uplift. • Adv ertiser V alue : Composite adv er tiser R OI metr ic. • Organic Clic ks : Click -through v olume on organic (non-ad) listings. • Ads CTR : Click -through rate on ad placements. Deriv ed ev aluation metrics: • T ransfer rate : Ratio of online uplift to offline uplift (e.g., online GMV% / offline 𝐼 gmv %), measur ing calibration quality . • Oscillation ratio : Ratio of maximum to minimum v alue of ps_ads_w o (the mos t v olatile parameter) across rounds, measuring parameter stability . • LLM correction count : Number of non-zero adjustment items per LLM proposal, measur ing calibration effor t con v ergence. 4.2 Experiment Setup T able 3 | Experiment ov erview . Exp-401838 Exp-437160 Mark et Country A PDP Country B PDP Rounds 7 (warm-start) 23 (V1: 11 + V3: 12) Duration 25 hours V1: 03-05–07; V3: 03-10–13; freeze 03- 14; 7d AB 03-15–22; rollout 03-24 Start cond. W ar m-start from exis ting Memory DB state Cold-start, default pr iors Obs. windo w 3.5 h/round 6 h/round (V3); 7d static AB post-freeze Proc. time 25–50 min/round 25–50 min/round Parame ters 7 (ads_w o/w g, org_w o/w g, porg_w , price_pow , w2) 7 (org_w c/w g/w o, ads_w c/w g/wo, biz_price_pow) Exp-401838 is a Countr y A warm-start experiment that retained historical calibration state. Its core purpose is not to re-demonstrate what happens during cold start, but to test whether a sys tem 24 Let the Ag ent Steer : Closed-Loop Ranking Optimization via Influence Exchang e that has already accumulated transf er models and penalty w eights can continue adv ancing in a better direction within production, and con v erge LLM calibration effor t within a limited number of rounds. Exp-437160 validates the system’ s end-to-end deplo yment capability in a pre viously unseen mark et. The e xper iment progressed through two search phases — V1 (11 rounds, GMV win rate 30%) e xposed cold-start limitations in a ne w market, while V3 (12 rounds) identified a Pareto-optimal parameter configuration at R7. This configuration w as frozen on 03-14 and v alidated through a 7-day A/B test bef ore being promoted to production rollout on 03-24. The two e xper iments ser v e different lif ecycle roles. Exp-401838 demonstrates the inner -loop op- timization mechanism — search, deplo y , obser v e, calibrate — in continuous warm-star t production operation. Exp-437160 extends this to the full deployment lif ecycle: it progressed through exploration, e xploitation, parameter freeze, long-hor izon validation, and production rollout, pro viding e vidence that the sy stem can produce deplo yable policies, not merely promising round-lev el signals. 4.3 Online A/B Results 4.3.1 Exp-401838: Country A PDP W arm-St art (7 R ounds) T able 4 | Exp-401838 online A/B results — round-by -round GMV and Orders progression. R ound GMV Orders A ds Re venue Adv ertiser V alue R2 − 3.6% 0.0% +0.7% +7.9% R3 − 1.5% +1.7% − 0.8% − 1.0% R4 +0.2% +1.7% − 8.7% − 8.1% R5 +1.9% +3.8% − 5.8% − 5.6% R6 +0.9% +2.7% − 9.4% − 10.8% R7 +9.2% +12.5% +5.7% − 8.9% T ak ea wa y: Exp-401838’ s GMV trajectory progresses g enerally upw ard across 7 rounds, from − 3.6% at R2 to +9.2% at R7, with R4 through R7 being 4 consecutiv e positive rounds. Orders tur ned positiv e from R3 onw ard, peaking at +12.5% . This indicates that under warm-start conditions the sys tem can e xtend e xisting calibration state into subsequent rounds rather than starting from scratch each round. Ca v eat. R7 metrics w ere collected dur ing a lo w-traffic earl y morning windo w ( ∼ 12K impressions), which introduces higher statistical uncer tainty than the typical obser vation window . The +9.2% GMV and +12.5% Orders results require v alidation in a high-traffic per iod. P ersistent adv ertiser v alue pressure. A dvertiser V alue was positiv e only in R2 (+7.9%) and tur ned negativ e in all subsequent rounds, indicating that ev en under warm-start conditions, optimizing f or GMV and Orders can sy stematically compress advertiser R OI — a limitation discussed in Section 6 . 4.4 Offline-Online T ransf er Analy sis A central claim of Sor tify is that ev en under warm-star t conditions, the offline-online mapping still requires continuous calibration. Exp-401838 itself pro vides two representative paired obser vations. T ak ea wa y: Within the same warm-star t experiment, the offline-online mapping changes noticeably across rounds. R2 sho ws that “positive offline ” does not guarantee positiv e online; R7 show s that after multiple rounds of calibration, offline gains finally begin to translate more reliabl y into online GMV . This phenomenon supports the necessity of the Belief channel: the transf er relationship is not a one-time setting but requires continuous updating with ne w obser v ations. 25 Let the Ag ent Steer : Closed-Loop Ranking Optimization via Influence Exchang e Figure 9 | Online KPI T rends: Single-panel line c har t sho wing Exp-401838 GMV and Orders uplift across 7 rounds. Dashed horizontal line at 0% for ref erence. Highlights the R4–R7 consecutive positiv e region and the R7 peak results. T able 5 | R epresentative offline-online gap in Exp-401838. R ound 𝐼 gmv U plift Online GMV Observation R2 +18.2% − 3.6% Significantl y optimistic offline; positiv e offline uplift did not translate to positiv e GMV R7 +41.6% +9.2% Optimistic bias remains, but after calibration the offline gains begin to translate reliabl y into positive online GMV 26 Let the Ag ent Steer : Closed-Loop Ranking Optimization via Influence Exchang e Looking fur ther at the metrics in Section 4.3 , GMV , Orders, A ds Re v enue, and Adv er tiser V alue do not mov e in sync. F or e xample, R7 simultaneously show s GMV +9.2%, Orders +12.5%, Ads Re venue +5.7%, but A dv er tiser V alue remains at − 8.9%. This indicates that different business metrics should not share a single global calibration f actor but should each maintain their o wn transfer relationship. Figure 10 | Offline-Online T ransf er Gap Visualization: Scatter plot with Exp-401838’ s per -round offline 𝐼 gmv uplift on the x-axis and cor responding online GMV on the y-axis. Identity line ( 𝑦 = 𝑥 ) shown f or reference. Points fall w ell below the identity line, showing sys tematic optimis tic bias; later rounds are closer to the positive quadrant. 4.5 Parame ter Ev olution and Stability 4.5.1 Residual Pendulum Effect in W arm-St art Experiment The most v olatile parameter across all e xper iments is ps_ads_w o (adv er tising order w eight), which controls the trade-off between ad visibility and or ganic e xper ience. This parameter e xhibits a characteristic oscillation pattern we term the “pendulum effect.” T ak ea wa y: Even under warm-start conditions, ps_ads_w o remains the most volatile parameter, but its oscillation is contained within a 4.5x rang e, and the second cy cle is nar ro wer than the first. This indicates that the sys tem has not y et conv erg ed to a single stable operating point, but has transitioned from unbounded e xploration to constrained residual oscillation rather than unbounded drift. 27 Let the Ag ent Steer : Closed-Loop Ranking Optimization via Influence Exchang e T able 6 | Exp-401838 parameter oscillation statis tics. Statistic Exp-401838 ps_ads_w o range 1.96–8.91 Oscillation ratio (max/min) 4.5x Complete swing cy cles 2 Second cy cle nar ro wer than first Y es R oot cause analy sis. The pendulum effect arises from a fundamental trade-off in the sor ting f or mula: increasing ad visibility (high ps_ads_w o) improv es ad impressions and potential ad re venue but reduces org anic clic k e xposure and can depress organic GMV . When the search engine finds a high-ad-w eight solution that maximizes 𝐼 gmv in one round, the online results rev eal org anic deg radation, causing the ne xt round’ s calibrated constraints to penalize ad w eight — swinging the parameter to the opposite e xtreme. This oscillation reflects a g enuine multi-objectiv e tension that the single-objective-with-penalties f or mulation can onl y approximate, not resolv e. Figure 11 | Parameter Evolution Heatmap: Heatmap with 7 parameters (ro ws) × 7 rounds (columns) from Exp- 401838. Color scale from lo w to high v alues. The ps_ads_wo row show s the most pronounced back -and-f or th oscillation, but the later half has a nar row er swing range. 4.6 LLM Calibration Effectiv eness 4.6.1 Correction Con v ergence T ak ea wa y: In Exp-401838, LLM calibration effor t conv erg es from 5 cor rection items in Round 2 to 2 items b y Round 7, with late-stage magnitudes approaching zero. This indicates that under warm-star t conditions, the LLM’ s role is closer to “filling in remaining calibration residuals ” rather than continuously re wr iting the entire transf er framew ork. 28 Let the Ag ent Steer : Closed-Loop Ranking Optimization via Influence Exchang e T able 7 | Exp-401838 LLM cor rection conv erg ence. Phase Exp-401838 Earl y (R2) 5 items, full recalibration Middle (R3–R6) 2–3 items, decreasing magnitudes Late (R7) 2 items, smallest magnitudes ( − 0 . 005 ) Con verg ence trend Clear con v ergence : 5 → 2 items, magnitude → ∼ 0 Figure 12 | LLM Cor rection Conv erg ence: T wo-panel visualization. T op panel: bar chart showing the number of non-zero LLM cor rection items per round f or Exp-401838, descending from 5 at R2 to 2 at R7. Bottom panel: line chart sho wing maximum cor rection magnitude per round, with an o verall declining trend. 29 Let the Ag ent Steer : Closed-Loop Ranking Optimization via Influence Exchang e 4.7 Sensitivity Analy sis This section discusses the rationale behind ke y system h yper parameter choices and their impact on performance. LMS learning rate ( 𝜂 = 0 . 2 ). The learning rate controls the Belief channel’ s responsiveness to single observations. 𝜂 = 0 . 2 means each round cor rects only 20% of the prediction residual, req uir ing appro ximately ⌈ log ( 0 . 05 ) / log ( 0 . 8 ) ⌉ = 14 rounds to conv erg e to 95% accuracy from an arbitrar y initial bias. A higher 𝜂 w ould accelerate conv erg ence but increase sensitivity to noisy obser vations — in lo w- traffic windo ws (such as Exp-401838 R7 with ∼ 12K impressions), single-round obser vation variance is larg e, and an ov erl y aggressive lear ning rate would cause slope/intercept to oscillate unnecessar il y under noise. 𝜂 = 0 . 2 is a classic adaptiv e filter setting that achiev es a reasonable balance between con v erg ence speed and noise robustness, and the LLM’ s selective jump mechanism compensates f or LMS’ s slo w response to structural breaks. P enalty asymmetry ( 𝛿 up = 0 . 25 vs. 𝛿 do wn = 0 . 08 ). The tightening step is appro ximately 3x the relaxation step, encoding the industrial reality that “the cost of a constraint violation far ex ceeds the oppor tunity cost of an ov erl y tight constraint.” If both w ere set symmetr ically (e.g., both 0.15), penalty w eights w ould deca y too quic kly after constraint satisf action, increasing the probability of re-violation in subsequent rounds — in A/B testing, each constraint violation (e.g., ad rev enue collapse) can tr igger manual inter v ention or ev en e xper iment ter mination, far e x ceeding the cost of occasionally conser vativ e GMV optimization. LLM safe ty bounds ( | Δ 𝛽 | ≤ 0 . 1 , 𝑚 ∈ [ 0 . 5 , 2 . 0 ] ). Saf ety bounds ensure that ev en if the LLM’ s judgment is completely wrong, the single-round deviation remains controllable. T aking the intercept as an ex ample, the maximum single-round shift of ± 0 . 1 across 6 relations implies a maximum single-round displacement of the target_range of appro ximatel y 10 percentage points — large enough to co v er the typical f ew -percentage-point sys tematic bias in practice, but not so lar ge as to cause catastrophic search frame w ork dis tor tion on a misjudgment. The penalty multiplier rang e [ 0 . 5 , 2 . 0 ] allow s halving or doubling constraint enf orcement strength in a single round, sufficient to respond to sudden constraint violation patterns. Necessity of the freeze mechanism. When the Belief channel undergoes a lar ge update, if the Pref erence channel is simultaneously allow ed to make large penalty weight adjustments, the next round’ s online results become difficult to attr ibute — it is hard to deter mine whether the GMV chang e came from the mapping cor rection or the cons traint strength chang e. The pur pose of freezing for one round is to isolate the impact of a significant calibration e vent, providing clearer signals f or subsequent diagnosis. P enalty w eight clamp rang e [ 1 , 000 , 80 , 000 ] rationale. The lo w er bound of 1,000 accounts for the magnitude of the positiv e rew ard in the objective function: typical positiv e scores ( 10 × 𝐼 gmv relativ e uplift) rang e from 0.5 to 2.0 (corresponding to 𝐼 gmv uplift of 5%–20%); if penalty w eights f all belo w 1,000, ev en a 1% constraint violation (penalty = 1 , 000 × 0 . 01 2 = 0 . 1 ) w ould fail to effectiv ely constrain the positiv e score. The upper bound of 80,000 preserves the search engine ’ s e xploration capability : when penalty w eights are too high (e.g., 80 , 000 × 0 . 01 2 = 8 . 0 ), ev en minor violations produce penalties f ar e x ceeding the positive score, f orcing the search engine into an e xtremely conser vativ e region and potentiall y missing parameter configurations that are ov erall super ior despite minor constraint brushes. 30 Let the Ag ent Steer : Closed-Loop Ranking Optimization via Influence Exchang e 4.8 Country B Deplo yment: From Cold Start to Rollout Exp-437160 is the only experiment in this study that progressed through the complete deplo yment lif ecy cle — from cold-star t parameter search to production rollout. This section presents the full evidence chain. 4.8.1 Cold Start Signal T o validate that Sor tify generalizes bey ond a single market, w e deplo yed the sys tem on Countr y B’ s product detail page with a cold-start (no inher ited Memory DB). The first round of search produced the f ollo wing results: T able 8 | Exp-437160 cold-start results (Country B, V1 Round 1). Metric V alue Constraint / T arge t Status Offline objectiv e 0.493 Maximize A chie ved 𝐼 gmv uplift +4.9% ≥ +4% Met 𝐼 ecpm_term chang e − 4 . 5 % ≥ − 5 % Near boundar y ads_top10_rate — Constrained Met ps_org_w c change +271.2% (1.0 → 3.71) — Larg est adjustment ratio_ads chang e − 32 . 0 % — A d share compressed The sys tem correctly identified that Country B’ s baseline sor ting formula sev erel y underw eighted organic click signals (ps_org_w c jumped from 1.0 to 3.71, a +271% adjustment — the lar ges t single- parameter chang e across all e xper iments). This market-specific insight emerg ed from the first round of search without any pr ior calibration, demons trating that the Influence Share frame w ork generalizes to ne w markets. Ho we v er , this first-round directional signal w as far from a deplo y able policy — subsequent search phases were needed to find a parameter configuration that could sur vive long-hor izon validation. 4.8.2 Searc h Journey : From Direction to Deplo yable Parameters The Countr y B experiment progressed through two search phases bef ore ar r iving at a deplo yable configuration: V1 (11 rounds, 03-05 to 03-07). The initial cold-start search phase achie v ed a GMV win rate of onl y 30% (mean GMV uplift − 2 . 4 %). While the sys tem successfully identified the direction — organic click signals were underweighted — the parameters did not con ver ge. All 7 parameters oscillated widel y across the search space throughout the 11 rounds. V1’ s core lesson w as that directional corr ectness does not imply paramet er deployability . V3 (12 rounds, 03-10 to 03-13). After nar ro wing the search space and adjusting constraint config- urations based on V1 observations, the sys tem w as restarted f or a second search phase. Most of the 12 rounds s till e xhibited the ads-organic seesaw effect — Ads Impressions and Or ganic Clic ks alternated in s tr ict opposition — a structural pattern consistent with the pendulum effect obser v ed in Countr y A (Section 4.5.1 ). R7 parameter freeze (03-14). Within V3’ s 12 rounds, the R8 observation window (measuring R7 parameters) produced the onl y round where GMV and Ads Re v enue were simultaneously positive: GMV +2.6%, A ds Re v enue +6.1%. Based on this Pareto-optimal outcome, the R7 parameters were frozen f or e xtended validation. 4.8.3 Winning P arameter Structure The frozen R7 parameters re veal a structurall y distinct solution compared to the Countr y A e xper i- ments: 31 Let the Ag ent Steer : Closed-Loop Ranking Optimization via Influence Exchang e T able 9 | Exp-437160 frozen parameters (R7, Countr y B). Parame ter V alue Interpretation ps_org_wc 7.667 Org anic Click weight (dominant) ps_ads_wc 4.381 A ds Click w eight (high) ps_org_wg 0.568 Org anic GMV weight (suppressed) ps_org_wo 0.805 Org anic Order weight (suppressed) ps_ads_wg 0.641 A ds GMV weight (suppressed) ps_ads_wo 0.957 A ds Order weight (moderate) ps_biz_price_pow 1.047 Pr ice pow er (near -neutral) This configuration e xhibits a “high Click, low GMV/Order” structure — the sor ting f or mula is primar ily dr iv en by click signals, with transaction-based signals deliberately suppressed. This structure reduces the seesaw effect between organic ranking and ads ranking: when the sor ting f or mula does not e x cessivel y amplify GMV/Order signals, org anic items do not cro wd out ad placements simply because the y “sell more, ” enabling both GMV and A ds Re v enue to improv e simultaneously . This contrasts with the residual pendulum effect obser v ed in the Country A warm-start experiment (Section 4.5.1 ), where the ke y trade-off still centered on the ads order w eight. The Countr y B R7 parameters circum vented this conflict by shifting the pr imary ranking signal to Clicks — clic k signals are f ar less zero-sum between organic and advertising channels than transaction signals. 4.8.4 Long-Horizon A/B V alidation The frozen R7 parameters w ere validated through a 7-da y A/B tes t (03-15 to 03-22; rollout Snapshot #38047, 10% treatment vs. 20% control). T able 10 | 7-da y A/B core metr ics (YMAL scene, yin_e xc hange vs Control). Metric Diff No te GMV/UU +4.15% Primar y KPI GMV +4.10% Consistent with GMV/UU GMV/Order +3.97% A v erage order v alue dr iv es GMV Order/UU +0.17% Near -neutral A ds Re v enue +3.58% Ad re v enue co-positive CPC +4.19% Higher per -click value T ak e Rate +3.01% Monetization improv ed Click/UU +1.21% User eng agement up A ds Load − 2 . 64 % Fe wer ad slots, higher value The GMV improv ement is dr iv en pr imar il y b y av erage order value (GMV/Order +3.97%) rather than order volume (Order/UU +0.17%), indicating that the click -dr iv en ranking sur faces higher -v alue items. A ds Re v enue increased +3.58% despite A ds Load decreasing by 2.64%, indicating that the per -ad value impro v ed significantl y (CPC +4.19%) — fe w er but more v aluable ad placements. The 7-day observation windo w is sufficient to filter out intra-da y volatility , providing strong er deployment confidence than single-round observations. 4.9 Efficiency and Operational Cost T ak ea wa y: Sortify operates with minimal resource o v erhead — a single LLM API call per round, no GPU requirements, and negligible storag e gro wth. The pr imary cost is the 3.5-hour data accumulation 32 Let the Ag ent Steer : Closed-Loop Ranking Optimization via Influence Exchang e T able 11 | Operational efficiency metr ics. Metric V alue Notes T otal cy cle time ∼ 4 hours 3.5h accumulation + 25–50min processing Daily optimization rounds ∼ 6/day 4h/round cadence T rials per round 5,000 25 work ers; 15–30min search Human inter v ention (post-colds tar t) Zero W ithin the inner optimization loop Consecutiv e unattended rounds 7; 23 Exp-401838 and Exp-437160; go v er nance-limited, not failure-limited A/B fetc h retr y success 5 × 5 min No data loss obser v ed Memory DB growth ∼ 1 KB/round 7 tables; negligible storag e LLM API calls 1/round Single meta-controller inf erence windo w , which is dictated b y s tatistical requirements rather than sy stem limitations. The sy stem ran 7 consecutiv e rounds (25 hours) in Exp-401838, and accumulated 23 rounds across tw o search phases in Country B; all stops and transitions in these e xper iments or iginated from go v er nance-lev el decisions, not sy stem failures. It is impor tant to distinguish the scope of automation. The inner loop — parameter search, online deplo yment, A/B obser vation, LLM calibration, and next-round launc h — r uns without human inter - v ention. Ho w ev er , the outer go v ernance loop — which round’ s parameters to freeze f or extended v alidation, whether to promote to full rollout based on long-horizon A/B results, and post-rollout mon- itoring — remains human-dr iv en. The Countr y B deplo yment illustrates this boundar y : the inner loop autonomousl y e xecuted 23 rounds across two search phases, but the decisions to freeze R7 parameters, conduct 7-da y static A/B testing, and appro ve production rollout w ere all made by human operators based on snapshot-lev el A/B analy sis. This division reflects a deliberate design choice: the sys tem automates the high-frequency , data-intensiv e optimization decisions where human latency is the bottleneck, while preserving human gov er nance o ver low -frequency , high-stakes deployment decisions. Compared to the manual optimization baseline — which typically required 1–2 human-hours per optimization round f or data analy sis, parameter selection, and deplo yment v er ification — Sor tify reduces the marginal cost of each inner -loop round to appro ximatel y zero human-hours after initial setup, while increasing the optimization cadence from ∼ 1 round/da y (limited b y human a vailability) to ∼ 6 rounds/da y . This speedup not only means more parameter e xploration rounds, but more cr iticall y enables the sys tem to respond to intra-day traffic patter n changes — for ex ample, morning peak, midda y trough, and e v ening peak traffic structures may affect optimal parameter configurations, and the 6-round/day cadence ensures at least one calibration update per major traffic period. Cost structure analy sis. Sortify’ s r untime cos t has three components: (1) Compute — the Optuna search uses 25 parallel w orkers on a single multi-core machine, consuming roughly 6.25–12.5 CPU- hours per round (25 cores × 15–30 min); (2) LLM calls — each round makes one API call with 4K –8K input tokens and a structured JSON response. At OpenAI’ s public pr ices as of March 26, 2026 (GPT -5.4: $2.50/1M input, $15.00/1M output; GPT -5.3-Codex: $1.75/1M input, $14.00/1M output), the per -round cost with high reasoning effor t is approximatel y $0.03–$0.10, since billed output includes reasoning tokens bey ond the visible JSON. At 6 rounds/da y this amounts to roughly $0.18–$0.60/da y in LLM spend. If Codex CLI is used via ChatGPT sign-in rather than an API ke y , cost is absorbed b y plan credits rather than per -call billing; (3) Data accumulation — the 3.5-hour online observation windo w is a fix ed statis tical requirement, not a sys tems bottleneck. Storag e ov erhead is negligible: the Memory DB gro ws b y ∼ 1 KB per round and remains belo w 100 KB after 30 rounds. 33 Let the Ag ent Steer : Closed-Loop Ranking Optimization via Influence Exchang e 5. Discussion: One-Person F easibility A dimension of Sor tify that merits e xplicit discussion is the de v elopment process itself: the entire sy stem—algor ithm design, code implementation, experimental operation, data analy sis, repor t wr iting, and visual asset creation—w as produced by a single individual orches trating a fleet of AI coding agents. Not a single line of production code w as wr itten by a human hand; not a single sentence of this repor t was drafted by a human author . The human’ s role was e xclusiv ely that of arc hitect and orc hestrat or : defining objectiv es, decomposing problems, revie wing outputs, and steering the agents tow ard coherent e xecution. This section ex amines the f easibility , mechanisms, and broader implications of this one-person paradigm. 5.1 Scope of What W as Deliver ed T o appreciate the claim, it is w or th enumerating the concrete artifacts that constitute the Sor tify project: • Algorithm design. The dual-channel Belief/Preference decomposition, the LMS-based transf er calibration, the LLM meta-controller ’ s s tr uctured prompting protocol, and the asymmetr ic penalty update rules (Section 2 ). • Production codebase. The 10-step one-shot pipeline, the Y OLO continuous loop with failure reco v er y , the 7-table Memory DB schema, the Optuna-based search engine integration, and the R edis parameter publishing interface (Section 3 ). • Experimental operation. 30 optimization rounds across tw o countr y markets (7 in Countr y A, 23 in Country B), including 25+ hours of unattended Y OLO r uns and a complete cross-market deplo yment lif ecy cle (Section 4 ). • Analy sis and reporting. Quantitativ e ev aluation of online A/B results, parameter stability analy sis, LLM calibration con v erg ence tracking, cross-market g eneralization assessment, and the complete bilingual technical repor t. • Presentation materials. Programmatic video compositions, figure generation, and visual assets f or communicating results. In a con v entional team setting, this scope w ould typicall y be distributed across 3–5 roles: an algorithm researcher , a software engineer, an operations specialist, a data anal yst, and a technical writer . The com- pression of these roles into a single individual was enabled not by extraordinary individual productivity , but b y a fundamental shift in the unit of work from writing to directing . 5.2 T echnical Depth and Dev elopment Complexity of Sortify The deliv erable inv entor y abov e pro vides a macro-le vel vie w of project scope but does not re veal the tec hnical depth that Sor tify embodies as a standalone software librar y . Sortify is f ar from a loose collection of scr ipts: it is a production-grade framew ork compr ising approximatel y 98,000 lines of code across 78 Python modules or ganized into 7 ma jor subsy stems—spanning the full technical stack from lo w-le v el data loading to high-lev el autonomous decision-making. Parame ter searc h engine. One of Sor tify’ s core capabilities is a highly configurable parameter search (h yper parameter tuning) engine. The engine constructs a dependency -aw are f or mula computation graph: giv en a set of ranking f or mulas and their nested w eight variables, the sy stem automatically parses dependencies, builds a lay ered computation graph, and incrementally updates only the affected v ar iables when weights chang e—av oiding appro ximately 99% of redundant computation. On top of this, the sy stem integ rates the Optuna multi-objectiv e optimization frame w ork, suppor ting NSGA -II P areto frontier search, Ba yesian optimization, e volutionary strategies, and genetic algorithms. The search process also incor porates multiple cor relation analyzers (Pearson, Spear man, Kendall), six metric fusion methods (w eighted mean, L2 norm, RMS, among others), and T op-K -based ranking quality ev aluation—f or ming 34 Let the Ag ent Steer : Closed-Loop Ranking Optimization via Influence Exchang e an end-to-end closed loop from data loading through f or mula computation and parameter optimization to result anal ysis. The pairwise influence algorithm. One of Sor tify’ s most original technical contributions is the Pair - wise Influence metr ic sys tem. The algor ithm addresses a cr itical question: in a multi-factor ranking f or mula, how can the actual influence of each w eight factor on the final ranking outcome be quantified? T raditional sensitivity anal ysis measures onl y the marginal effect of parameter per turbation on a sin- gle metr ic, whereas the Pairwise Influence algorithm pushes the analy sis g ranularity do wn to item-pair comparisons —sampling item pairs from the T op-K list using configurable strategies (adjacent, random, e xhaustiv e), computing the difference v ector Δ 𝑥 𝑖 𝑗 across f actor dimensions f or each pair, then der iving each factor ’ s relative contribution share via Share 𝑓 = | 𝑤 𝑓 · Δ 𝑥 𝑖 𝑗 , 𝑓 | Í 𝑘 | 𝑤 𝑘 · Δ 𝑥 𝑖 𝑗 , 𝑘 | , and finally aggre- gating with configurable w eighting sc hemes (e xponential deca y , in v erse-rank deca y) to yield a global influence score 𝐼 𝑓 ∈ [ 0 , 1 ] . The algor ithm fur ther computes inter -factor conflict rates CR 𝑎 , 𝑏 —the fre- quency with which tw o f actors induce opposite ranking pref erences on the same item pair —pro viding ir replaceable diagnostic information f or w eight tuning. This algorithm was de v eloped from initial concept through mathematical f or malization, v ector ized implementation, and production integration, entirely b y AI ag ents under human direction. Fully autonomous operation pipeline. Be y ond the search engine, Sor tify implements a complete autonomous operation pipeline. Its core compr ises tw o la yers: OneShotPipeline —orches trating of- fline optimization, LLM proposal generation, and online monitor ing into a single automated flo w; and Y oloRunner —a continuously autonomous agent loop with episode-based state tracking, offline-to-online w orkflo w bridging, automatic rollback decisions, and live Belief/Pref erence state management. T o support this autonomous operation, the sys tem implements a 7-table SQLite-back ed persis tent memory sys tem (with a DualMemory dual-bac kend architecture) that records each optimization round’ s offline results, deplo yment configurations, online metr ics, and decision rationale, pro viding the LLM meta-controller with complete histor ical conte xt f or proposal generation. This means Sortify is not merely a callable tool library but an intelligent sys tem capable of autonomously initiating, ex ecuting, e valuating, and iterating optimization cy cles. De velopment complexity . The implementation difficulty of the abov e capabilities should not be under - estimated. In ter ms of technical stack div ersity alone, Sor tify spans fiv e ma jor domains: data engineer ing (incremental Parq uet loading and streaming), numer ical computation (N umPy-v ector ized f ormula ev alua- tion with incremental updates), optimization theory (multi-objective P areto optimization with constrained search), sy stems engineer ing (SQLite persistence, R edis parameter publishing, Grafana real-time monitor - ing integration), and AI applications (LLM prompt engineering, autonomous decision-making, memor y retriev al). These subsy stems do not operate in isolation but are tightl y coupled through dependency graphs, ev ent streams, and state machines—a design flaw in any single module could trigger cascading f ailures at runtime. The entire codebase comprises approximatel y 98,000 lines, o ver 50 core classes, and more than 10 anal yzer types. That a sy stem of this scale w as built from scratch and deplo yed to production b y a single person directing AI agents is itself the strong est e vidence f or the feasibility of the one-person paradigm. 5.3 From ParaDance to Sortify : Lineage and Domain Expertise The preceding section es tablished Sortify’ s engineering scale: appro ximately 98,000 lines of code across 78 modules. Ho w could a single person na vigate sys tem design at this lev el of comple xity? A cr ucial part of the answ er is that it was not a from-scratch endeav or . Sor tify’ s design philosoph y , 35 Let the Ag ent Steer : Closed-Loop Ranking Optimization via Influence Exchang e e valuation architecture, and optimization methodology trace directly to ParaDance 3 , an open-source multi-objectiv e parameter optimization library created b y the same author . U nderstanding this lineage is essential f or appreciating both the depth of domain expertise underl ying Sor tify and the ev olutionar y arc from a g eneral-pur pose tuning tool to an autonomous, agent-s teered optimization system. A 20-month iteration journey . ParaDance was initiated in May 2023 and under went continuous de velopment through Januar y 2025—a 20-month arc spanning 357 commits, 40+ released v ersions (v0.1.1 through v0.6.7), and 6 major version epochs. The project ev ol ved from a simple Lorenz-curv e sampling utility into a full-fledged production framew ork comprising 3,688 lines of source code across 48 Python modules org anized into 6 core subsy stems: ev aluation (16 independent ev aluators), optimization (Optuna-based Bay esian search with multi-objective agg regation), data loading, pipeline orchestration, sampling, and visualization. Each major version marked a qualitativ e leap: v0.2.x introduced por tf olio visualization; v0.3.x established the Bay esian optimization engine; v0.4.x built the ev aluation ecosys tem including merg e-sor t-based weighted inv ersion pair computation and the JSON f ormula system; v0.5.x added stag ed optimization, multi-threaded real-time monitoring, and side-inf or mation reranking; and v0.6.x deliv ered chec kpoint recov er y and production-hardening f eatures. Design decisions ahead of their time. Sev eral arc hitectural choices in ParaDance were uncon ventional f or a 2023-era Python data science tool and ha ve since been validated b y broader industry trends: • Pluggable ev aluator arc hitecture. BaseCalculator used partialmethod to mount 16 ev aluators as instance methods via a single-inher itance chain, a v oiding the MR O complexity of mixin-based approaches. Adding a ne w ev aluator required only three steps: wr ite a standalone function, register it as a partialmethod , and add a flag string—zero modification to e xisting code. • Declarativ e JSON formula engine. A f or mula chaining sys tem with inter mediate-result cascading ( step1#intermediate → step2 ), conditional branching ( if(cond, true_val, false_val) ), and sandbo xed ev aluation enabled algor ithm engineers to iterate scor ing f or mulas via configuration chang es alone, without code deplo yment. • Scale-a ware adaptiv e w eight searc h. Automatic log10 -scale alignment of search boundar ies across f eatures with vas tly different magnitudes (e.g., CTR ∼ 0.01 vs. GMV ∼ 10,000), eliminating the need f or manual nor malization. • Staged optimization with w armup. A tw o-phase searc h protocol where the first 𝑁 rounds use a w ar mup f or mula to guide e xploration, then transition to the main objective with continuous value anchoring—addressing cold-start inefficiency . • Production-grade resilience. SQLite-backed optimization persistence, c heckpoint-based reco v- ery for inter r upted long-r unning jobs, Joblib-based parallel optimization, and Dirichlet-constrained w eight sampling on the probability simplex. These design c hoices—configuration-dr iven pipelines, pluggable e valuation, scale-aw are search, and persistent optimization state—directl y inf or med Sor tify’ s architecture. The 7-table Memor y DB in Sor tify is a conceptual descendant of ParaDance ’ s SQLite persistence; the dual-channel Belief/Pref erence decomposition extends P araDance’ s multi-objectiv e agg regation into the online calibration domain; and the LLM meta-controller occupies the role that P araDance’ s stag ed optimization and warmup f or mulas pla yed at a more pr imitiv e lev el. Industry adoption. As of the time of wr iting, P araDance has accumulated ov er 101,000 do wnloads on PyPI and is used b y algor ithm engineers at major inter net companies across the industry . It has become one of the most widely adopted hyperparameter tuning tools in production recommendation sy stems, v alidating both the problem f or mulation and the architectural decisions made dur ing its 20-month de vel- opment. This adoption base also pro vided the author with continuous feedbac k from div erse production 3 https://github.com/yinsn/ParaDance 36 Let the Ag ent Steer : Closed-Loop Ranking Optimization via Influence Exchang e en vironments—feedbac k that directl y shaped Sor tify’ s design prior ities, par ticular ly the emphasis on transf er calibration, constraint sensitivity management, and autonomous operation with minimal human intervention. In other w ords, what ParaDance bequeathed to Sor tify w as not merely reusable code assets but domain judgment f org ed through 20 months of production refinement—precisely the judgment that enabled the human orches trator to make sound architectural decisions dur ing agent-driv en dev elopment, rather than e xpending limited iteration budget on tr ial and er ror . 5.4 The Orc hestration Model The operational patter n that emerg ed was consistent across all project phases. The human operator w ould: 1. Define the intent — specify what needed to be built, fix ed, or analyzed, ar ticulated as a natural- languag e objective with acceptance cr iter ia. 2. Decompose into agent tasks — break the objectiv e into discrete, independently e xecutable units suitable f or parallel agent dispatch. 3. Re view and integrate — inspect agent outputs f or cor rectness, coherence, and alignment with the o v erall design, then merge appro ved ar tifacts into the project. 4. Iterate on failures — when agent outputs missed the mark, diagnose whether the failure was in task specification (human er ror) or e x ecution (agent error), and adjust accordingly . This loop mir rors the LLM meta-controller patter n within Sor tify itself: a higher -lev el intelligence (the human) does not perform the lo w-le v el optimization (code wr iting, te xt drafting) but instead adjusts fr amewor k-lev el par ameter s (task specifications, design cons traints) that guide the ag ents ’ e xecution. The parallel is not coincidental—the same pr inciple of steering o ver doing that makes Sor tify’ s autonomous optimization viable also makes the one-person dev elopment model viable. 5.5 Meta-Nesting: AI Building AI The Sor tify project exhibits a meta-structural nesting that mer its e xplicit discussion. What makes the project distinctiv e is not onl y what it is but how it was creat ed —the tw o la yers f or m a self-ref erential recursiv e loop. La y er 1: The domain agent. At the business logic lev el, Sortify itself is an autonomous agent designed to replace the sys tematic decision-making work traditionall y per f or med b y algor ithm engineers in rank - ing optimization. Historicall y , such engineers had to continuously monitor discrepancies between offline metrics and online dashboards, manuall y adjust penalty ter ms and fusion f or mulas, and attempt to br idg e epistemic bias and axiological misalignment. Sor tify , grounded in SEU theory with its Belief/Preference dual channels, autonomously observes 20 rounds of historical evidence, autonomously diagnoses str uc- tural breaks, and autonomously e x ecutes influence rebalancing—achie ving a structural subs titution of human cognitiv e labor in a specific domain (recommendation sys tem tuning). La y er 2: The builder agent fleet. At the de velopment lev el, the entire sy stem was built from scratch b y a single individual directing a fleet of AI coding agents. This agent fleet collectivel y assumed the roles traditionall y distr ibuted across architects, full-stack engineers, data engineers, QA testers, and e ven academic wr iters and figure designers. They jointly deliv ered: the Optuna-based parameter search frame work with dependency -aw are computation graphs and end-to-end pipeline orchestration; the 7-table persistent Memor y DB; and the complete bilingual technical report conforming to academic standards. The recursiv e loop. Super imposing these tw o lay ers rev eals a recursiv e structure: one set of AI ag ents (the builder fleet) constructed anot her AI ag ent (Sor tify), which in tur n autonomously automates highly complex business logic . In this process, the human role elev ates from “craftsperson wr iting code ” to 37 Let the Ag ent Steer : Closed-Loop Ranking Optimization via Influence Exchang e “chief orchestrator defining rules, suppl ying high-dimensional intuition, and issuing acceptance cr iter ia.” This “ AI building AI” bootstrapping process is not merely a philosophically interesting isomor phism—it constitutes direct e vidence that multi-agent collaboration is viable f or sy stem engineering tasks demanding both deep algorithmic logic and academic r igor . 5.6 Implications Paradigm restructuring, not mer ely efficiency gains. When an entire project’ s algor ithm design, code implementation, experimental e xecution, and bilingual L A T E X repor t wr iting with figures are all completed b y a single person orc hestrating ag ents—with zero human-authored code and zero human-drafted te xt— this has mo ved decisivel y be y ond the Copilot-era paradigm of “code completion ” or “productivity tools.” It marks a res tr uctur ing of the paradigm itself: in traditional softw are engineering, the gap betw een “having a good idea ” and “shipping a sy stem” spans an enor mous implementation chasm. Ev en after conceiving a core insight like “decouple belief and pref erence via SEU, ” months of infrastructure construction, data cleaning, and debugging would be required to v alidate its value. T oday , implementation cost approaches zero. The ceiling of a project is no long er set b y a de v eloper’ s familiarity with framew ork APIs or a team’ s headcount, but b y the decision-maker ’ s dept h of understanding of business pain points, ar chit ectural taste f or comple x sys tems, and orc hestr ation ar tistry in directing agent collaboration. Dissolving barriers to complex sy stem building. The traditional barr ier to building production-g rade sy stems like Sor tify is not pr imar il y intellectual but operational : the coordination cost of multi-person teams, the communication o v erhead of translating design intent into implemented code, and the iteration latency betw een specifying a chang e and seeing its effect. When AI agents absorb the implementation burden, the binding constraint shifts from team size to the quality of a single individual’ s problem decomposition and design judgment . This implies that a domain e xper t who deeply understands a problem but lac ks a full engineering team can no w build and deplo y sys tems of equiv alent comple xity—a qualitativ e e xpansion of what is achie vable by a single practitioner . Cognitiv e le verag e v ersus cognitiv e replacement. A critical nuance is that the human contr ibution was not eliminated but concentr ated . The design decisions—wh y dual-c hannel rather than single-channel, wh y frame w ork -lev el control rather than direct parameter manipulation, why persistent memory rather than stateless rounds—required domain understanding, architectural taste, and judgment that the ag ents could not autonomously generate. What the ag ents eliminated w as the mechanical effor t of translating those decisions into r unning code, tested pipelines, and f or matted prose. The ratio of human cognitive contribution to total project output was thus e xtremely high per unit of human effor t, but the human effor t itself w as ir reducible f or the project to succeed. This is cognitiv e lever ag e , not cognitiv e replacement. Repr oducibility and v erifiability . Ev er y ar tif act in this project car ries a complete pro v enance trail: the agent conv ersations that produced each code module, the revie w decisions that accepted or rejected intermediate outputs, and the iteration history that refined the final result. This le v el of traceability is, parado xically , mor e comprehensiv e than what most multi-person team workflo ws produce, where design rationale is often lost betw een Slac k threads, whiteboard sessions, and undocumented code revie w s. The one-person orchestration model, by routing all decisions through a single point of accountability with AI-assisted record-keeping, may produce more auditable dev elopment histories than conv entional processes. Scalability of the model. The one-person f easibility demonstrated here is not an isolated cur iosity but an earl y instance of a patter n that will likel y become routine as AI coding agents mature. The specific combination that enabled it—a w ell-defined problem domain, modular sys tem architecture, and ag ents 38 Let the Ag ent Steer : Closed-Loop Ranking Optimization via Influence Exchang e capable of producing cor rect code from natural-language specifications—is not unique to Sor tify . An y project that can be decomposed into well-scoped, independently testable components is amenable to this de velopment model. The limiting f actor is not the tools but the human ’ s ability to hold the full sys tem design in mind and specify tasks with sufficient precision. The fact that this repor t—including this v er y paragraph—was authored by an AI agent under human direction is itself a demonstration of the thesis it describes. The boundary betw een human creativity and machine ex ecution has not disappeared, but it has mo v ed: the human pro vides the what and why ; the ag ents provide the how . For Sor tify , this division of labor was sufficient to deliver a production sys tem, deplo y it across tw o mark ets, and produce the comprehensive ev aluation and documentation presented in this repor t. Future technology builders will no longer be mired in the implementation sw amp but will operate as pure thinkers and commanders—this is not an optimization of efficiency but a redefinition of the act of creation itself. 39 Let the Ag ent Steer : Closed-Loop Ranking Optimization via Influence Exchang e 6. Conclusion, Limitations, and Future Dir ections W e ha v e presented Sor tify , an agent-s teered closed-loop sy stem that reframes ranking optimization as continuous influence e x chang e—where an LLM ag ent steers the rebalancing of ranking influence among competing f actors. Sortify addresses three structural limitations of traditional manual optimization—the offline-online transf er gap, entangled diagnostic signals, and s tateless round-b y-round operation—through a unified closed-loop architecture. The dual-channel adaptation frame work decouples transf er mapping cor rection (Belief ) from constraint penalty adjustment (Pref erence) into orthogonal dimensions; the LLM meta-controller operates on framew ork -lev el parameters, pro viding evidence-based cor rections to LMS calibration residuals; and the persistent Memor y DB accumulates calibration intelligence across rounds, suppor ting w arm-star t and cross-market transfer . Deplo yed on Country A and Countr y B recommendation platf or ms with the inner optimization loop operating autonomousl y in 4-hour cy cles , the sy stem produces tw o lev els of evidence: peak round-le v el per f or mance in the Countr y A w ar m-start experiment (GMV +9.2% , Orders +12.5% , with LLM cor rection items con v erging from 5 to 2 within 7 rounds), and deplo yment-validated perf or mance in Countr y B (GMV/UU +4.15% , A ds Re v enue +3.58% in 7-day A/B v alidation, promoted to production rollout). Despite these results, Sor tify exhibits se veral concrete limitations that constrain its cur rent applica- bility : • Parameter oscillation not fully conv erged. In the Country A w ar m-start e xper iment retained in the main te xt, ps_ads_wo still e xhibits a 4.5x residual pendulum effect (Section 4.5 ). The multi-modal objectiv e landscape created by the ads-org anic trade-off is a fundamental limitation that the single- objectiv e-with-penalties formulation can appro ximate but not resol ve. This oscillation indicates that the sy stem has transitioned from unbounded e xploration to constrained oscillation, but has not y et con ver ged to a single stable operating point. • Statistical uncertainty in lo w-traffic windo ws. The strong est results (GMV +9.2%, Orders +12.5% in Exp-401838 R7) w ere obser v ed dur ing a low -traffic ear ly morning windo w with approximatel y 12K impressions (Section 4.3 ). While the sys tem operated cor rectly , the statis tical po wer of these estimates is low er than for rounds with typical traffic volume. • Insufficient em pirical e vidence f or e xtreme structural br eaks. The retained Country A e xper iments primar ily demonstrate conv ergence in the number of LLM cor rection items, but do not co v er a sufficientl y long or sev ere post-w ar m-start lif ecy cle to validate handling of major str uctural breaks (Section 4.6 ). This means the e vidence presented f or the LLM meta-controller leans more to ward “reducing ongoing calibration w orkload” than “handling e xtreme mutations.” These limitations point to two directions f or future w ork. Firs t, replacing the single-objectiv e- with-penalties f or mulation with a multi-objective Pare to frontier approach would allow the sys tem to e xplicitly model the ads-org anic trade-off as a frontier rather than a single optimum, potentiall y eliminating the pendulum effect. Second, de veloping a confidence-w eighted transf er model that adjusts calibration aggressiv eness based on obser v ation v olume w ould allo w the sys tem to be more conser vativ e during lo w-traffic window s and more aggressive dur ing high-traffic per iods, reducing statis tical r isk without sacrificing conv erg ence speed. These e xtensions build naturally on Sortify’ s e xisting dual-channel and Memory DB architecture, requiring modifications to the objectiv e f or mulation and context assembl y rather than fundamental architectural changes. Finall y , the Sortify project itself—from the f oundational algorithm design and appro ximately 98,000 lines of engineering implementation, through 30 rigorous production experiment rounds, to the very drafting of this repor t—was ex ecuted entirely by a single human orches trating a swarm of AI agents, untouched by a single line of human code or draft te xt. This f act stands as a silent y et deaf ening e xper iment in its own r ight. As e xplored in Section 5 , it un veils an “ AI-generating- AI” meta-nesting logic: an AI fleet in the creation domain bir thed an indus tr ial-grade AI hub (Sortify) in the targ et domain, which in tur n autonomousl y go verns highly complex business operations. This transcends mere efficiency 40 Let the Ag ent Steer : Closed-Loop Ranking Optimization via Influence Exchang e optimization; it is a structural paradigm shift in software engineering and human exploration. When the long, arduous chasm betw een conceptualization and realization is fundamentall y obliterated, a br utal y et f ascinating ne w era emerg es: the ceiling of creation is no longer dictated b y the sheer scale of ex ecution capacity , but solely by the cognitiv e penetration and orches tration ar tistry of the solitary decision-maker . 41 Let the Ag ent Steer : Closed-Loop Ranking Optimization via Influence Exchang e R efer ences T ak uy a Akiba, Shotaro Sano, T oshihiko Y anase, T akeru Ohta, and Masanor i Ko yama. Optuna: A ne xt-generation hyperparameter optimization frame w ork. In Proceedings of the 25th A CM SIGKDD International Conf erence on Kno wledg e Discov er y & Data Mining , pages 2623–2631, 2019. doi: 10.1145/3292500.3330701. James O Berg er . Statistical Decision Theor y and Bayesian Analy sis . Springer , 2nd edition, 1985. Mirosla v Dudik, Dumitr u Erhan, John Langf ord, and Lihong Li. Doubly robust policy ev aluation and optimization. Statistical Science , 29(4):485–511, 2014. Matthias Feurer , Jos t T obias Spr ing enberg, and Frank Hutter . Initializing bay esian hyperparameter optimization via meta-learning. In Proceedings of the AAAI Confer ence on Artificial Intellig ence , v olume 29, 2015. doi: 10.1609/aaai.v29i1.9354. Ale xandre Gilotte, Clément Calauzènes, Thomas N edelec, Ale xandre Abraham, and Simon Dollé. Offline a/b testing f or recommender sy stems. In Pr oceedings of the Elev enth A CM International Conf erence on W eb Searc h and Data Mining , pages 198–206, 2018. doi: 10.1145/3159652.3159687. Frank Hutter, Lars Kotthoff, and Joaquin V anschoren. Automated Machine Learning: Me thods, Sy stems, Challeng es . Spr inger , 2019. Xiao Lin, Hongjie Chen, Changhua Pei, Fei Sun, Xuanji Xiao, Hanxiao Sun, Y ongfeng Zhang, W en wu Ou, and Peng Jiang. A pareto-efficient algor ithm f or multiple objectiv e optimization in e-commerce recommendation. In Proceedings of the 13th A CM Confer ence on Recommender Sys tems , pages 20–28, 2019. doi: 10.1145/3298689.3346998. Tie- Y an Liu. Lear ning to rank f or inf or mation retr iev al. F oundations and T rends in Information Retriev al , 3(3):225–331, 2009. German I Parisi, Ronald K emker , Jose L Part, Chr istopher Kanan, and Stef an W er mter . Continual lifelong learning with neural networks: A revie w . N eural Ne twor ks , 113:54–71, 2019. Shubhra Kanti Kar maker Santu, Parikshit Sondhi, and ChengXiang Zhai. On application of lear ning to rank f or e-commerce search. In Proceedings of the 40th International A CM SIGIR Conf erence on Resear c h and Development in Inf ormation Re trieval , pag es 475–484, 2017. doi: 10.1145/ 3077136. 3080838. Lei W ang, Chen Ma, Xue yang F eng, Ze yu Zhang, Hao Y ang, Jingsen Zhang, Zhiyuan Chen, Jiakai T ang, X u Chen, Y ankai Lin, W ayne Xin Zhao, Zhen-Hua W ei, and Hengshu Zhou. A surve y on larg e languag e model based autonomous ag ents. F rontier s of Computer Science , 18(6), 2024. doi: 10.1007/s11704- 024- 40231- 1. 42 Let the Ag ent Steer : Closed-Loop Ranking Optimization via Influence Exchang e A. Contributors Yin Cheng ( yin.cheng@shopee.com ) and his AI Ag ents were responsible f or all core w ork on this project: • Project De v elopment : Sy stem architecture design and full-stack engineer ing implementation • Algorithm Design : Conception and iteration of the P air wise Influence ranking algor ithm • Experiment Execution : Deplo yment, monitoring, and data analy sis of A/B experiments • Report W riting : Ideation, writing, and revision of this technical repor t A ckno wledgments Special thanks to Liao Zhou ( liao.zhou@shopee.com ) f or his deep in vol vement throughout the project—pro viding sustained discussion, f eedback, and e xper ience transf er on e xper imentation method- ology and de velopment environment ev olution, whic h play ed an impor tant role in the iterativ e refinement of our approach. W e also thank the f ollo wing colleagues f or their suppor t: xiyu.liang@shopee.com kailun.zheng@shopee.com dihao.luo@shopee.com tewei.lee@shopee.com zhangweiwei@shopee.com mark.cai@shopee.com jian.dong@shopee.com andy.zhanggx@shopee.com B. Implementation Details B.1 A/B Experiment Integration Sor tify integrates with the platf or m’ s e xisting A/B testing infrastructure rather than deplo ying its own e xper imentation frame work. Each parameter push to R edis tr iggers a traffic split between the control group (current production parameters) and the treatment group (Sor tify’ s optimized parameters). The A/B repor t is g enerated by the platf or m’ s standard metrics pipeline and pulled b y Sor tify’ s one-shot pipeline in Step 1. Time windo w alignment. All obser vation window s are snapped to 15-minute boundar ies to align with the platf or m’ s metr ics agg reg ation cadence. The minimum accumulation window of 3.5 hours ensures sufficient traffic volume f or stable uplift estimates in most time-of-da y conditions. The maximum windo w is capped at 3.5 hours to pre vent stale data from ear lier traffic patterns contaminating later observations. B.2 Redis Parame ter Publishing The 7-parameter v ector is serialized as JSON and wr itten to a Redis ke y monitored b y the sor ting service. The publication is atomic—either all 7 parameters update simultaneousl y or none do. A rollback mechanism allo ws rev er ting to the previous parameter set by re-publishing the PREV_PARAMS_JSON stored in yolo-state.env . B.3 State File Management T wo state files maintain continuity across pipeline e x ecutions and system restar ts: yolo-state.env — Y OLO loop state: YOLO_ROUND=5 LAST_PUSH_TIME=2026-03-05T18:45:00 LAST_ONLINE_FROM=2026-03-05T15:15:00 LAST_ONLINE_TO=2026-03-05T18:45:00 43 Let the Ag ent Steer : Closed-Loop Ranking Optimization via Influence Exchang e PREV_PARAMS_JSON={"ps_ads_wo": 3.51, ...} PREV_AB_REPORT_PATH=/path/to/report one-shot-latest.env — Last successful one-shot handoff: LATEST_RUN_TAG=20260302_143022 CONFIG_PATH=.../pdp-th-topk-order-guard-agent.next.json BEST_SO_FAR=.../search-artifacts/*_best_so_far.json B.4 Directory Structure Each round produces ar tifacts in a times tamped director y: updates/ |-- memory/ | ‘-- agent_memory.db <- Master DB (shared across rounds) |-- / | |-- online-loop.log <- 10-step pipeline output | |-- search.log <- Optuna trial results | |-- ab_report.md <- Online A/B metrics | |-- llm_proposal.json <- LLM output with evidence | |-- rule.publish.json <- Published parameters | |-- search-logs/ | | ‘-- *_trial_table.csv <- All 5,000 trial results | ‘-- search-artifacts/ | ‘-- *_best_so_far.json <- Best parameters found |-- yolo-state.env |-- yolo-event-log.md <- Audit log of all rounds ‘-- one-shot-latest.env C. No t ation T able 44 Let the Ag ent Steer : Closed-Loop Ranking Optimization via Influence Exchang e T able 12 | T AB-APP -02. Symbol definitions. Symbol Definition Introduced 𝜋 𝑞 ( 𝜽 ) Ranking per mutation for reques t 𝑞 under parameters 𝜽 Eq. 1 𝑆 𝑛 𝑞 Symmetric group acting on 𝑛 𝑞 items Eq. 1 S 𝑞 ( 𝜽 ) T otal score vector f or request 𝑞 Eq. 2 𝐻 𝑞 𝑖 𝑗 Comparison h yper plane 𝑥 𝑖 = 𝑥 𝑗 f or items 𝑖 , 𝑗 Eq. 2 𝐶 𝜋 Ranking chamber cor responding to permutation 𝜋 Eq. 2 𝜽 7-dimensional sor ting parameter v ector Eq. 10 F Set of all sor ting f actors Eq. 4 𝑆 𝑞 ( 𝑖 ; 𝜽 ) T otal score of item 𝑖 in reques t 𝑞 Eq. 3 Δ 𝑞 ( 𝑖 , 𝑗 ; 𝜽 ) T otal pairwise margin for item pair ( 𝑖 , 𝑗 ) Eq. 3 Δ 𝑞 , 𝑓 ( 𝑖 , 𝑗 ; 𝜽 ) Score difference contributed b y f actor 𝑓 on item pair ( 𝑖 , 𝑗 ) Eq. 4 𝑍 𝑞 𝑖 𝑗 ( 𝜽 ) T otal pair wise influence budg et f or item pair ( 𝑖 , 𝑗 ) Eq. 6 𝑠 𝑞 , 𝑓 ( 𝑖 , 𝑗 ; 𝜽 ) Pairwise influence share of factor 𝑓 f or item pair ( 𝑖 , 𝑗 ) Eq. 7 𝑃 𝑞 Inf or mativ e / top-sensitiv e pair set agg regated for reques t 𝑞 Eq. 9 𝑟 𝑞 𝑖 Rank of item 𝑖 in request 𝑞 Eq. 8 𝑤 𝑞 𝑖 𝑗 Rank -based exponential deca y w eight f or item pair ( 𝑖 , 𝑗 ) Eq. 8 𝜏 Decay rate parameter f or pair weighting Eq. 8 𝐼 𝑓 ( 𝜽 ) Aggreg ate Influence Share for f actor 𝑓 Eq. 9 J ( 𝜽 ) Composite search objectiv e function Eq. 10 𝜆 𝑗 Penalty weight f or constraint 𝑗 Eq. 10 𝑣 𝑗 ( 𝜽 ) Violation magnitude f or constraint 𝑗 Eq. 10 𝛼 T ransf er model slope (Belief c hannel) Eq. 12 𝛽 T ransf er model intercept (Belief c hannel) Eq. 12 𝜂 LMS lear ning rate (= 0.2) Eq. 13 𝑒 𝑡 T ransf er prediction er ror at round 𝑡 Eq. 13 Δ 𝛽 LLM LLM intercept adjus tment ( ∈ [ − 0 . 1 , + 0 . 1 ] ) Eq. 15 𝑝 𝑗 Normalized violation pressure f or constraint 𝑗 Eq. 16 𝛿 up Penalty tightening step size (= 0.25) Eq. 17 𝛿 do wn Penalty relaxation step size (= 0.08) Eq. 17 𝑚 LLM LLM penalty multiplier ( ∈ [ 0 . 5 , 2 . 0 ] ) Eq. 20 T able 13 | A bbreviations. Abbre viation Full Form GMV Gross Merchandise V alue PDP Product Detail Pag e TPE T ree-structured Parzen Estimator LMS Least Mean Squares Y OLO Y ou Only Liv e Once (continuous pipeline mode) KPI K ey Perf ormance Indicator CTR Clic k - Through Rate eCPM Effectiv e Cost P er Mille R OI R etur n on In ves tment 45
Original Paper
Loading high-quality paper...
Comments & Academic Discussion
Loading comments...
Leave a Comment