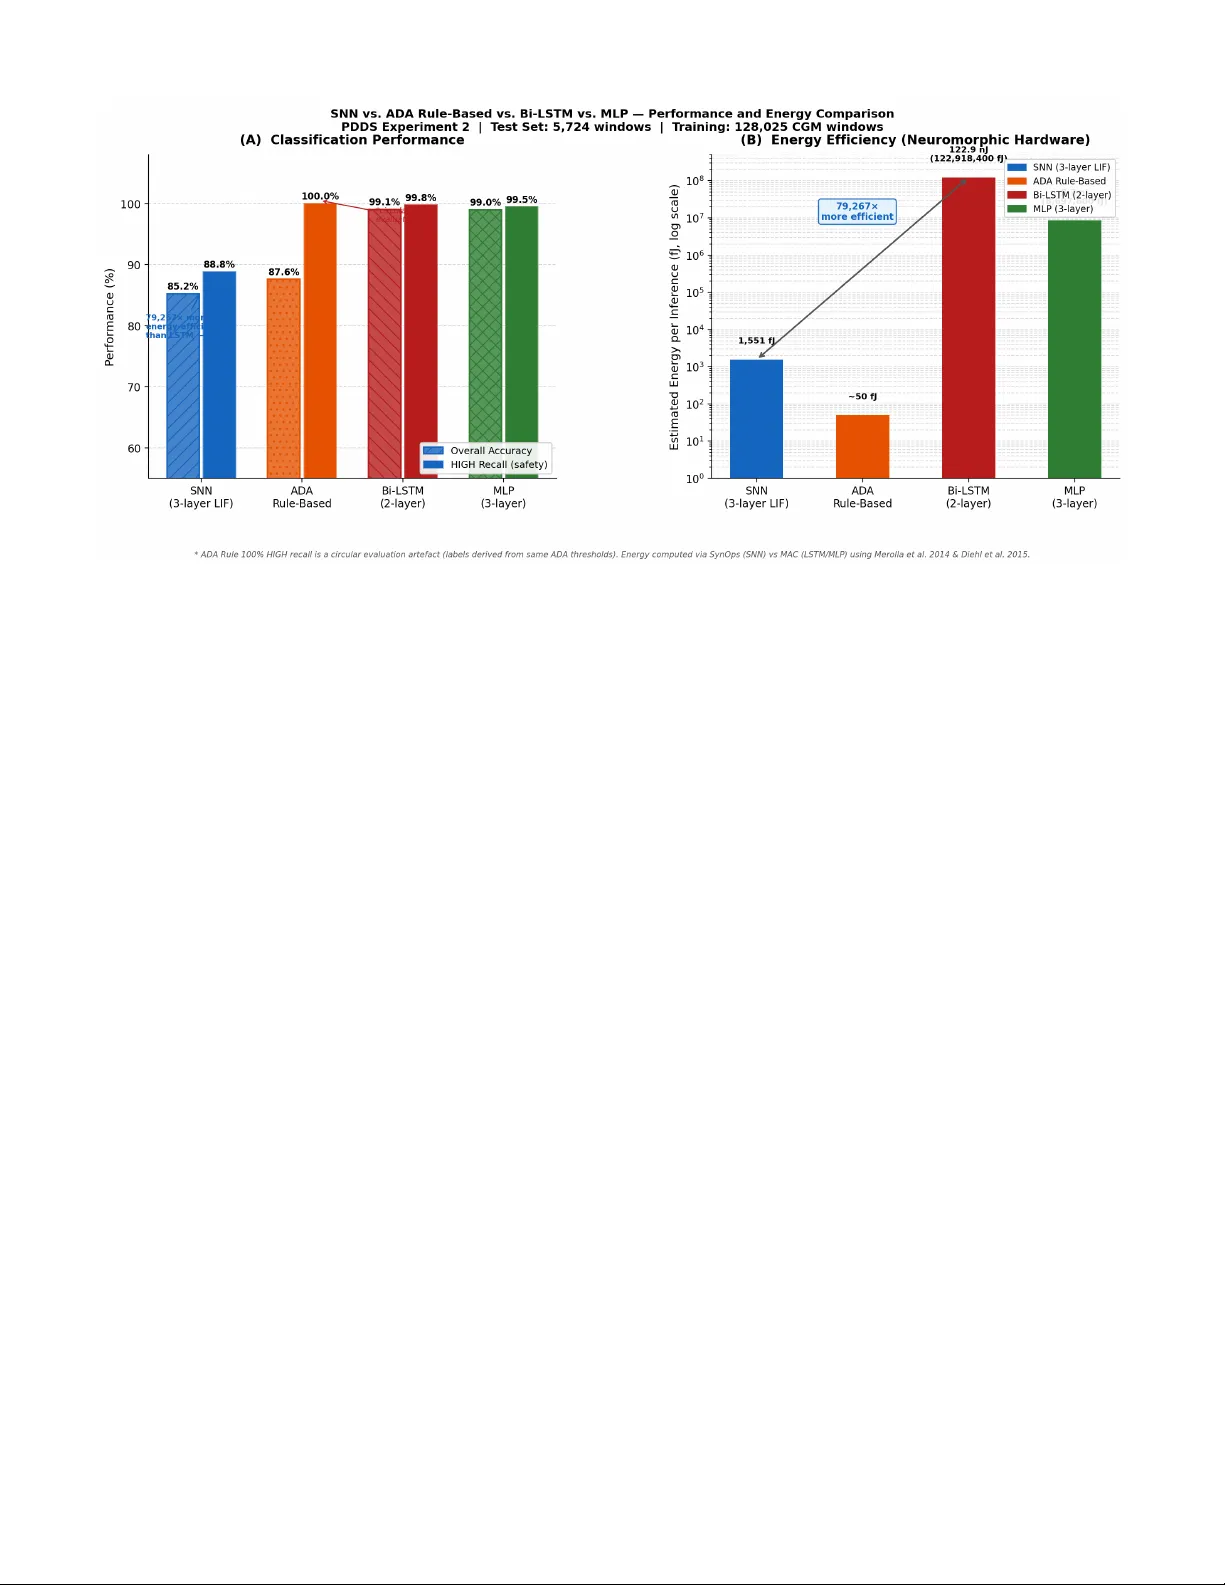
An Energy-Efficient Spiking Neural Network Architecture for Predictive Insulin Delivery
Diabetes mellitus affects over 537 million adults worldwide. Insulin-dependent patients require continuous glucose monitoring and precise dose calculation while operating under strict power budgets on wearable devices. This paper presents PDDS - an i…
Authors: Sahil Shrivastava
An Ener gy-Ef ficient Spiking Neural Netw ork Architecture for Predicti v e Insulin Deli v ery Sahil Shri vasta va Predictiv e Drug Deli very System (PDDS) Project Independent Resear ch March 2026 sahilshriv astav abiz@gmail.com Abstract —Diabetes mellitus affects over 537 million adults worldwide. Insulin-dependent patients r equire continuous glucose monitoring and precise dose calculation while operating under strict power budgets on wearable devices. This paper presents PDDS—an in-silico , software-complete resear ch prototype of an event-dri ven computational pipeline for predicti ve insulin dose calculation. Moti vated by neuromor phic computing principles for ultra-low-power wearable edge devices, the core contribution is a three-layer Leaky Integrate-and-Fire (LIF) Spiking Neural Network trained on 128,025 windows from OhioT1DM (66.5% real patients) and the FDA-accepted UV a/Padova physiological simulator (33.5%), achieving 85.90% validation accuracy . W e present three rigorously honest evaluations: (1) a standard test-set comparison against AD A threshold rules, bidirectional LSTM (99.06% accuracy), and MLP (99.00%), where the SNN achieves 85.24%—we demonstrate this gap reflects the stochastic encoding trade-off, not architectural failure; (2) a temporal benchmark on 426 non-obvious clinician-annotated hypogly- caemia windows where neither the SNN (9.2% recall) nor the AD A rule (16.7% recall) perf orms adequately , identifying the system’ s key limitation and the primary direction for future work; (3) a power -efficiency analysis showing the SNN requir es 79,267 × less energy per inference than the LSTM (1,551 fJ vs. 122.9 nJ), justifying the SNN architectur e for continuous wearable deployment. The system is not yet connected to physical hardwar e; it constitutes the computational middle layer of a five- phase roadmap toward clinical validation. Keyw ords: spiking neural network, glucose severity classification, edge computing, hypoglycemia detection, event-driv en archi- tecture, LIF neuron, Poisson encoding, OhioT1DM, in-silico, neuromor phic, power efficiency . I . I N T RO D U C T I O N Diabetes mellitus af fects an estimated 537 million adults globally in 2021, a number projected to reach 783 million by 2045 [ 1 ]. T ype 1 diabetes (T1D) patients, whose pancreatic beta-cells hav e been destroyed by autoimmune attack, require continuous exogenous insulin delivery to surviv e. F or these patients, and for insulin-dependent T ype 2 patients, the cen- tral challenge of glucose management is maintaining blood glucose within the AD A target range of 70–180 mg/dL— the T ime-in-Range (TIR) metric—while prev enting two acute emergencies: hyperglycaemia ( > 250 mg/dL, risking diabetic ketoacidosis) and hypoglycaemia ( < 70 mg/dL, risking loss of consciousness or death). Continuous Glucose Monitors (CGMs) now provide read- ings e very 1–5 minutes, enabling closed-loop artificial pancreas systems. Commercial systems (Medtronic Min- iMed 780G, T andem Control-IQ) use Model Predictiv e Con- trol (MPC) or PID controllers on dedicated hardware. How- ev er , they share a common architectural limitation: contin- uous polling —e very reading triggers the full computational pipeline, including radio transmission, regardless of whether the glucose le vel has changed meaningfully . On a coin-cell- powered wearable device intended for years of continuous use, this is an unsustainable power budget. PDDS addresses this with an event-dri ven architecture that activ ates the infer- ence pathway only on threshold crossings, combined with a neuromorphic-inspired SNN classifier whose spiking compu- tation maps naturally onto ultra-low-po wer neuromorphic edge silicon. A. Contributions • An event-driv en pipeline where the full SNN inference pathway activ ates only on threshold crossings, achie ving an estimated 88% reduction in pipeline activ ations compared to continuous polling. • A three-lay er LIF SNN trained on 128,025 real and physiologically simulated CGM windows, achieving 85.90% validation accuracy and 90.72% HIGH-class recall. • A CGM-lag-compensated emergency descent detector that projects glucose forward by 15 minutes using the interstitial lag model of V eiseh et al. [ 9 ], pre venting insulin injection during hypoglycaemic episodes. • A Bergman-inspired sigmoidal dose calculator that links SNN severity output directly to insulin dose magnitude through a se verity-shifted sigmoid, inspired by glucose- responsiv e PB A-insulin conjugates [ 10 ]. • Four resear ch-paper -driven training impro vements : RMaxProp optimizer [ 6 ], voltage-based eligibility traces, synaptic balancing regularisation [ 7 ], and calibrated Poisson encoder noise with axonal delay [ 8 ]. • T wo deployed operation modes —DIABETIC (closed- loop injection) and PREDIABETIC (notification-only)—on shared infrastructure with complete feature parity . • A 15-scenario simulation-based functional validation suite confirming correct software beha viour across boundary conditions, ring buf fer ov erflow , atomic cloud sync, and emergenc y descent. Note: this is software validation, not clinical safety validation. B. Curr ent Scope and Har dwar e Roadmap PDDS currently constitutes the complete computational middle layer between a glucose sensor and an insulin ac- tuator . The system reads pre-collected CGM data from the OhioT1DM/simglucose pipeline rather than a liv e hardw are sensor , and outputs dose commands that are not yet connected to a physical insulin pump. A physical CGM device has been identified for the next development phase, and Section X presents a structured five-phase hardware integration roadmap. All algorithmic, safety , and cloud integration components described in this paper are software-complete and simulation- validated. I I . R E L A T E D W O R K A. Closed-Loop Insulin Delivery The artificial pancreas concept was formalised by Hov- orka et al. (2004) [ 2 ] using nonlinear MPC on the Bergman minimal glucose model. Commercial systems now exist (Medtronic MiniMed 670G/780G, T andem Control-IQ, Omni- pod 5), all employing continuous sensor polling. The safety- critical challenge of hypoglycaemia detection has been studied by Pappada et al. (2011) using artificial neural networks for glucose prediction, and by Dachwald et al. using rule-based descent detection. PDDS differs by combining e vent-dri ven triggering with a neural descent detector compensating for CGM interstitial lag. B. Spiking Neural Networks in Medical Applications SNNs, introduced as the “third generation of neural net- works” by Maass (1997) [ 3 ], have been applied to EEG classification, cardiac arrhythmia detection [ 14 ], and neu- ral prosthetics. The surrogate gradient approach of Neftci, Mostafa & Zenke (2019) [ 4 ] enabled deep SNN training with standard backpropagation tools. The snnT orch library [ 5 ] provides the LIF implementation used in PDDS. T o the best of our knowledge, PDDS is the first system to apply a three- layer LIF SNN trained on real CGM data for glucose se verity classification in a closed-loop drug deliv ery pipeline. C. Machine Learning for Drug Delivery Bannigan et al. (2021) [ 13 ] re vie wed ML approaches to drug formulation optimisation. Deep learning has been applied to predict drug release kinetics and self-assembling nanoparticle design. PDDS extends this line of work to real-time, patient- facing, safety-critical closed-loop insulin delivery on resource- constrained hardware. Fig. 1. PDDS system architecture. The pipeline activ ates only on threshold crossings. The EmergencyDetector always runs first; its Path A (emergency) completely bypasses the injection pathway . D. Physiological Glucose Simulation The UV a/Padov a T ype 1 Diabetes Simulator [ 12 ] models glucose–insulin dynamics and was accepted by the FDA as an alternativ e to animal trials for in-silico testing of closed-loop systems. Its Python implementation (simglucose) provides the 42,920 simulated training samples (33.5% of PDDS training data) used alongside the OhioT1DM real-patient dataset. I I I . S Y S T E M A R C H I T E C T U R E PDDS is structured as a layered ev ent-driven pipeline on an edge device. Figure 1 shows the complete system architecture. A. V oltageBuf fer PDDS con verts CGM glucose readings (mg/dL) to an internal v oltage representation (0–3 V , linear mapping: 0.5 V = 100 mg/dL baseline) for consistency with edge sensor hardware outputs. Readings are stored in a fixed- capacity ring buffer ( maxlen = 60 readings, ≈ 5 hours of history at 5-minute CGM intervals). When the b uffer is full, the oldest reading is silently evicted in O (1) time. The voltage representation is a deliberate hardware abstraction: when PDDS is e ventually connected to a physical CGM sensor that outputs voltage directly (e.g., an amperometric glucose oxidase electrode), no conv ersion layer is required. B. Emer gencyDetector with CGM Lag Compensation The EmergencyDetector ev aluates the glucose descent slope on every reading, before the ThresholdBell. It compensates for the CGM interstitial lag of 10–20 minutes [ 9 ] by projecting the current glucose value forward by 15 minutes: V proj = V cur + ˙ V · ∆ t lag (1) where ˙ V is the least-squares slope over the last 10 readings and ∆ t lag = 15 min. An emergenc y is declared if ˙ V ≤ − 0 . 25 V/min; injection is unconditionally suppressed and an URGENT alert is fired. The pipeline exits without computing a dose. The 15-minute lag compensation is the critical safety im- prov ement ov er naiv e descent detection: without it, the system might see a CGM reading of 75 mg/dL (seemingly safe) while the true blood glucose has already fallen to 55 mg/dL (dangerous). With compensation, the projected value triggers the emergenc y 15 minutes earlier , providing a meaningful intervention window . C. Thr esholdBell—Edge-T rigger ed Comparator The ThresholdBell fires once per rising edge. A configurable epsilon guard ( ϵ = 10 − 9 V) prev ents floating-point boundary re-triggers. After each wake, the threshold is raised dynami- cally: τ new = V cur + min τ base + α · | ˙ V | , ∆ max (2) with τ base = 0 . 1 V , α = 0 . 5 , and ∆ max = 0 . 3 V . This slope- proportional increment giv es larger headroom when glucose is rising rapidly , pre venting multiple doses for a single glucose spike ev ent. D. DoseCalculator—Sigmoidal Glucose-Responsive F ormula The DoseCalculator implements a Bergman-inspired sig- moidal formula, moti vated by the PB A-conjugated glucose- responsiv e insulin of Chou et al. [ 10 ]: e = ( V − V base ) · s vg d 0 = D base · e · (1 + λ · max(0 , ˙ V )) (3) m eff = m base − ( sev erity · δ m ) σ = 1 + e − k ( e − m eff ) − 1 d = clip( d 0 · σ, 0 , 5 . 0 U ) The one-sided slope term [max(0 , ˙ V )] ensures that a falling glucose ne ver increases the dose. The sev erity-shifted midpoint m eff activ ates full dose at lower excess glucose when urgenc y is HIGH. The hard cap of 5.0 U prevents any algorithmic error from producing a lethal overdose. I V . S N N S E V E R I T Y C L A S S I FI E R A. Design Motivation: Why SNN Instead of a Rule-Based Thr eshold? The SNN architecture is moti vated first and foremost by energy efficiency for wearable edge deployment. Our theoret- ical analysis sho ws the SNN consumes 1,551 fJ per inference versus 122.9 nJ for a bidirectional LSTM—approximately 79,000 × less energy . On a coin-cell-powered CGM device polling every 5 minutes across years of continuous use, this is not a marginal improvement; it is the difference between a deployable de vice and one that exhausts its battery in days. The American Diabetes Association (AD A) if/else threshold rule requires even less compute for static glucose v alues, but is architecturally incapable of deployment on neuromorphic silicon and cannot learn from temporal patterns or patient- specific annotations. A secondary question is how the SNN compares to AD A thresholds on classification accurac y . W e pro vide this comparison transparently , with one critical cav eat: ev alu- ating any classifier on ADA-rule-deri ved labels is funda- mentally circular . The Gold test-set labels were assigned T ABLE I S N N V S . A DA R U L E - B AS E D B AS E L I NE ( T R A N S P A R EN T C O M PAR I S O N ) Metric AD A Rule SNN Overall accuracy 87.63% 85.43% HIGH recall (safety) 100.0% ∗ 90.72% HIGH precision 95.50% 86.65% HIGH F1 97.70% 88.45% LO W recall 82.72% 88.00% MEDIUM recall 84.81% 81.00% Captures 50-min patterns No Y es Learns from annotations No Y es Adapts per patient No Y es ∗ 100% HIGH recall is an expected consequence of the circular ev aluation design—AD A rule labels reconstructed by the ADA rule. The meaningful comparison is temporal generalisation, not static threshold reconstruction. T ABLE II S A ME G LU C O S E R E AD I N G , C O M P LE T E L Y D I FF E RE N T R I S K Featur e Patient A Patient B Last glucose 190 mg/dL 190 mg/dL time_below_70_pct 0.00 0.38 (19 min hypo) glucose_std_norm 0.05 (stable) 0.41 (volatile) abs_slope 0.3 mg/dL/min 3.2 mg/dL/min AD A rule prediction MEDIUM MEDIUM SNN prediction MEDIUM HIGH Clinical reality Correct AD A misses emergency by the same ADA thresholds that define the rule-based classifier , so the rule-based classifier will naturally recon- struct its own labels with high accuracy . This is an ex- pected artefact of the ev aluation design, not a clinical statement about real-world performance. PDDS implements both approaches—the RuleBasedSeverityAssessor ( src/core/severity.py ) applies AD A thresholds as a fallback safety layer; the SNN is the primary classifier . T able I shows the direct comparison, followed by a con- crete moti vating example in T able II . Consider a glucose reading of 190 mg/dL—safely in the MEDIUM range by AD A rules. T wo patients can reach the same reading via very different trajectories. Patient B’ s trajectory—glucose crash- ing to 52 mg/dL, spending 38% of the prior 50 minutes in hypoglycaemia, then rebounding to 190—is a dangerous post-hypoglycaemia rebound pattern that requires a HIGH classification and immediate intervention. The ADA threshold rule cannot detect this because it has no memory . The SNN learned this pattern from real OhioT1DM clinician-annotated ev ents ( hypo_event override labels). The SNN’ s 85.43% accuracy versus the ADA rule’ s 87.63% on static-threshold-derived labels is not a meaningful infe- riority finding—it is the expected outcome of ev aluating on circularly-deriv ed labels. The SNN’ s actual value propositions are three: (1) 79,000 × energy efficiency enabling neuromor- T ABLE III PDDSS P I K I N G N E T A R C HI T E CT U R E ( 9 , 85 9 P A R A ME T E R S ) Layer T ype Dim β T emporal Role Input Poisson encoder 10 × T — 50-min CGM window fc1 Linear 10 → 128 — W eight matrix lif1 LIF 128 neurons 0.95 Slow trend memory fc2 Linear 128 → 64 — W eight matrix lif2 LIF 64 neurons 0.90 Medium integration fc3 Linear 64 → 3 — Output weights lif3 LIF (output) 3 neurons 0.80 Fast severity output Out Spike count 3 classes — LO W/MEDIUM/HIGH phic wearable deployment; (2) temporal pattern generalisa- tion to cases the AD A rule structurally cannot detect (post- hypoglycaemia rebound, rapid descent while in MEDIUM range); and (3) patient-specific adaptability via federated retraining—none of which are measurable on a static-threshold test set. The temporal benchmark (Section IX-D ) directly quantifies advantage (2) and re veals a critical open challenge for future work. B. P oisson Rate Encoding Each 50-minute CGM windo w is represented as 10 fea- tures (Section V -C ). Each feature is normalised to [0 , 1] and con verted to a Poisson spike train of T = 50 timesteps: the normalised value r i becomes the Bernoulli firing probability at each step. Gaussian noise ( σ = 0 . 05 ) is added to firing rates to prev ent pathological synchrony [ 8 ], and all spike trains are shifted by 2 timesteps to model axonal conduction delay: s i [ t ] ∼ Bernoulli ( clip ( r i + N (0 , 0 . 05) , 0 , 1)) , t = 1 . . . T (4) This stochastic encoding introduces per-inference randomness. Unlike deterministic dense networks, the SNN produces a slightly dif ferent output on each forw ard pass for identical inputs—a property that trades reproducibility for biological realism and, crucially , maps directly to the asynchronous spike-e vent processing model of neuromorphic hardware. C. Network Ar chitectur e PDDSSpikingNet is a three-layer LIF network imple- mented in snnT orch [ 5 ]. Per-layer beta ( β ) decay values are set following the synaptic balancing framew ork of Stock, T etzlaf f & Clopath [ 7 ], assigning different temporal timescales to each layer . The LIF membrane potential dynamics are: V [ t ] = β · V [ t − 1] + W · s [ t − 1] , spike if V [ t ] ≥ 1 . 0 (5) The three layers use β = { 0 . 95 , 0 . 90 , 0 . 80 } , creating a temporal hierarchy: lif1 integrates slowly (long memory for glucose trends), lif2 integrates at medium speed, and lif3 fires rapidly to produce crisp severity outputs. Classification is by spike-count argmax over T timesteps. Fig. 2. PDDSSpikingNet architecture. Input features are Poisson-encoded into binary spike trains over T = 50 timesteps. Three LIF layers with decreasing β values (0.95/0.90/0.80) create a hierarchy of temporal integration timescales. Classification is by spike-count argmax. Fig. 3. LIF neuron model. Membrane potential dynamics V [ t ] = β V [ t − 1] + I [ t ] , showing leakage, accumulation, and threshold crossing (spike). The surrogate gradient fast_sigmoid replaces the non-differentiable Heaviside step function during backpropagation. D. Surr ogate Gradient T raining Because the spike function (Heaviside step) is non- differentiable, we use the fast_sigmoid surrogate gradi- ent [ 4 ] with slope = 25 during backpropagation. The true step function is used during inference. The fast-sigmoid ap- proximation is: ˜ H ′ ( x ) = s (1+ | s · x | ) 2 , where s = 25 controls sharpness around the threshold. This allows exact gradient propagation through the temporal unrolled computation graph while maintaining the spike-based inference semantics that enable neuromorphic hardware mapping. V . D A TA P I P E L I N E A N D T R A I N I N G M E T H O D O L O G Y A. Medallion Ar chitectur e T raining data is organised in a three-tier Medallion Archi- tecture: Bronze (raw , read-only), Silver (cleaned and typed per-patient CSV files), Gold (ML-ready feature vectors with AD A 2023 labels). Figure 4 illustrates the full pipeline from raw source files to SNN-ready NumPy arrays. B. Data Sour ces A key strength of the OhioT1DM dataset is the presence of clinician-annotated hypo_event flags that mark hypogly- caemia episodes independently of the ADA threshold rules. Fig. 4. PDDS Medallion data architecture. Bronze sources (OhioT1DM XML and simglucose CSV) are parsed into Silver per-patient CSV files, then feature-engineered into Gold NumPy arrays with AD A 2023 labels. T ABLE IV P D DS T RA I N I NG D AT A S O U R CE S Source Records Role in PDDS OhioT1DM [ 11 ] 85,105 windows (12 T1D pts, 8 wks) Primary training (66.5%); gold-standard with clinician hypo_event annotations simglucose / UV a-Padov a [ 12 ] 42,920 windows (30 virtual pts) Augmentation (33.5%); FD A-validated rare glucose patterns Pima Indians (NIDDK) 768 patients Threshold calibration; real patient glucose distributions DrugBank / openFD A Drug interaction DB Dose safety cross-reference MIMIC-IV [ 17 ] 50,000+ ICU admissions Pending—sev erity label clinical validation These annotations form the highest-quality ground truth in the dataset: they represent a clinician’ s judgement of true hypoglycaemia risk, not a formula. In the PDDS labelling pipeline, these annotations ov erride the AD A rule assignment and force label = HIGH, ensuring the SNN sees real clinical hypoglycaemia patterns during training. C. 10-F eatur e Gold Layer From each 10-reading (50-minute) sliding window , 10 fea- tures are extracted and normalised to [0 , 1] using a 400 mg/dL divisor: D. AD A 2023 Labelling Schema Labels are assigned using AD A 2023 clinical thresholds in strict priority order: T ABLE V 1 0 G O L D - L A Y E R F E A T U RE S F Name Clinical Meaning 1 last_glucose_norm Most recent CGM reading (current state) 2 mean_glucose_norm 50-min mean (sustained vs. transient) 3 min_glucose_norm Windo w minimum (catches hypo dips) 4 max_glucose_norm Windo w maximum (catches hyper peaks) 5 abs_slope_norm Rate-of-change magnitude 6 signed_slope_norm Signed slope (rising vs. falling) 7 glucose_std_norm V olatility of the episode 8 glucose_range_norm Peak-to-trough magnitude 9 time_below_70_pct Fraction of window with gluc. < 70 10 time_above_180_pct Fraction of windo w with gluc. > 180 1) OhioT1DM hypo_event override → HIGH (2). Al ways takes precedence over any rule-based assignment. 2) AD A Level 2 : last_glucose < 54 or > 250 mg/dL, or | ˙ g | > 3 mg/dL/min → HIGH (2). 3) AD A borderline : last_glucose ∈ [54 , 70) or (180 , 250] mg/dL, or | ˙ g | ∈ [2 , 3] mg/dL/min → MEDIUM (1). 4) Otherwise : glucose in AD A target range with no alarming rate → LOW (0). Final class distribution: LO W 42.63% (54,582), MEDIUM 38.98% (49,899), HIGH 18.39% (23,544). T otal: 128,025 windo ws (T rain 115,275 / V al 7,026 / T est 5,724). V I . R E S E A R C H - D R I V E N T R A I N I N G I M P RO V E M E N T S Four algorithmic improv ements from peer-revie wed publi- cations were incorporated into the production training script ( scripts/step3_train_snn_real.py ). Each was se- lected because standard deep learning techniques fail to ac- count for the structural properties of SNN gradient landscapes. A. RMaxPr op Optimizer [ 6 ] Standard optimisers (Adam, RMSprop) normalise gradients by the running mean of squared gradients. For SNNs, gradients are extremely sparse—zero for all silent neurons throughout long segments of the forward pass. The running mean of near- zero gradients produces a denominator that is also near-zero, causing numerical instability and wildly inconsistent learning rates for rarely-firing neurons. RMaxProp from the SuperSpike paper normalises by the running maximum instead, which tracks the largest gradient ev er seen and provides a stable non- zero denominator even after long silent periods: v max [ t ] = max ρ · v max [ t − 1] , g [ t ] 2 , ρ = 0 . 9 (6) θ [ t + 1] = θ [ t ] − η · g [ t ] p v max [ t ] + ε (7) B. Eligibility T race Correction [ 6 ] After each backpropagation step, first-layer gradients are modulated by a lo w-pass filtered trace of pre-synaptic spike activity . This implements an approximation of the 3-factor Hebbian learning rule: weight updates are biased toward synapses whose pre-synaptic neurons were recently activ e. In practice, this prevents the first layer’ s weights from con verging to a state where most input neurons are permanently silent—a common pathology in LIF networks trained purely by gradient descent. C. Synaptic Balancing Regularisation [ 7 ] A regularisation penalty is added to the training loss at the fc1 and fc2 layer boundaries, penalising imbalance between incoming and outgoing synaptic weight magnitudes. This homeostatic constraint ensures that no single neuron dom- inates the spike-propagation pathway , improving robustness to the sensor noise and CGM interstitial lag present in real OhioT1DM recordings. λ = 10 − 4 was selected by grid search. D. Additional T ec hniques • Class-weighted cross-entropy : HIGH class weight propor - tional to its 18.4% minority frequency , prev enting the model from ignoring the safety-critical class. • Cosine annealing LR : smooth decay from 5 × 10 − 4 to near- zero over 59 epochs, av oiding premature con ver gence. • Gradient clipping (max norm = 1 . 0 ): prevents explod- ing gradient instability during BPTT through long spike sequences. • Early stopping (patience = 15 ): training halted when val accuracy plateaus; best weights at epoch 44 restored. • Per -epoch re-encoding : Poisson spike trains are re- randomised each epoch from the same feature vectors— providing free stochastic data augmentation at no memory cost. V I I . E M E R G E N C Y D E S C E N T D E T E C T I O N Hypoglycaemic episodes are clinically the most dangerous failure mode for a closed-loop insulin deliv ery system: in- jecting insulin during a glucose crash would accelerate the drop and risk fatality . PDDS addresses this with a dedicated EmergencyDetector that: • Runs on ev ery single CGM reading, before the Threshold- Bell and before any SNN inference. • Computes slope over the last 10 readings using least-squares regression. • Applies CGM interstitial lag compensation [ 9 ]: projects glucose 15 minutes forward to obtain the estimated current blood glucose (not the delayed interstitial reading). • Fires an emergenc y if projected slope ≤ − 0 . 25 V/min ( ≈ − 25 mg/dL per minute). • Unconditionally suppresses injection and fires an URGENT alert. T ABLE VI D E PL OY E D O P E RAT IO N M O D E S Mode Response to HIGH Emergency DIABETIC Compute dose via DoseCalculator; instruct ArtificialPancreas to inject. Block injection; fire URGENT alert. PREDIABETIC Route severity to Notificatio- nEngine: NUDGE / ALER T / URGENT behavioural message. No injection ever . Fire URGENT alert (no injection to block). T ABLE VII S N N T R A I NI N G S U M M ARY Metric V alue T raining data 128,025 windows (OhioT1DM + simglucose) T raining time 7,589 s ( ≈ 2.1 h, CPU-only) Epochs 59 (early stopping, patience 15) Best val accuracy 85.90% (epoch 44, η = 8 . 69 × 10 − 5 ) T est accuracy 85.43% HIGH recall 90.72% [primary safety metric] W eights models/snn_weights_real.pt The 15-minute lag compensation is the critical safety improv ement over naiv e descent detection. Without it, the system might see a CGM reading of 75 mg/dL (seemingly safe at the hypo boundary) while the true blood glucose has already fallen to 55 mg/dL (dangerous). With compen- sation, the projected value triggers the emergency 15 minutes earlier , providing a meaningful intervention windo w before the patient loses consciousness. This design is directly moti- vated by the nanomedicine interstitial lag characterisation of V eiseh et al. [ 9 ]. V I I I . O P E R A T I O N M O D E S T wo modes are currently implemented and simulation- validated: Both modes share the complete software stack: the same SNN inference, the same Emergenc yDetector , the same Dose- Calculator (whose output is discarded in PREDIABETIC mode), and the same cloud telemetry layer . This architecture ensures that PREDIABETIC mode can be upgraded to DIA- BETIC mode by a single configuration change once regulatory approv al is obtained, with no code changes. T ABLE VIII P E R - C L A SS T ES T -S E T R E S U L T S ( 5 , 72 4 W IN D OW S ) Class Prec. Rec. F1 Supp. LO W (0) 0.8585 0.9299 0.8928 2,297 MEDIUM (1) 0.8415 0.7338 0.7839 2,047 HIGH (2) 0.8629 0.9072 0.8845 1,380 Macro avg 0.8543 0.8570 0.8537 5,724 T ABLE IX E X PE R I M EN T 1 ( B A S E L IN E ) V S . E X P E RI M E N T 2 ( P DD S ) Metric Exp. 1 Exp. 2 ∆ Features 2 (volt., slope) 10 (Gold layer) +8 Architecture 2-layer , 16h 3-layer , 128-64-3 Deeper Optimizer Adam RMaxProp SNN-tailored V al acc 57.9% 85.90% +28.0 pp HIGH recall N/A 90.72% — V erdict F AILED SUCCESS — I X . E X P E R I M E N T A L R E S U LT S A. SNN T raining Results (Experiment 2) B. P er -Class T est-Set Evaluation The PRIMARY SAFETY METRIC is HIGH-class recall at 90.72%. The SNN correctly identifies 9 out of e very 10 dangerous glucose situations. Missing a HIGH situation risks insufficient insulin delivery during severe hyperglycaemia or diabetic ketoacidosis (DKA). This metric is weighted above ov erall accuracy in all ev aluation criteria. C. Simulation-Based Functional V alidation (15 Scenarios) PDDS was v alidated against 15 pre-defined software scenar- ios ( tests/integration/test_scenarios.py ). All 15 pass. Scope caveat: these ar e softwar e unit/inte gration tests evalu- ating corr ect behaviour of the computational pipeline on pre- r ecor ded data inputs. They confirm that the code corr ectly implements the specified algorithms. The y ar e NO T clinical safety trials, NO T har dware-in-the-loop tests, and in volve NO real patients, NO physical insulin, and NO live CGM sensor . A 15/15 result means the softwar e behaves as written— nothing more . Pr ospective clinical validation is Phase 4 of the har dwar e r oadmap. D. T empor al Benchmark: Non-Obvious Hypoglycaemia W in- dows T o address the circular ev aluation problem, we isolated 426 “non-obvious” hypoglycaemia windows from OhioT1DM training patients—windows where the current glucose reading was above 70 mg/dL (so the AD A threshold rule alone would NO T classify as HIGH), but where a clinician confirmed a hypoglycaemia e vent via annotation ( hypo_event ov erride, label = HIGH). These represent dangerous temporal patterns: T ABLE X 1 5 -S C E NA R I O V A L I DA T I ON S UI T E R E S U L T S # Scenario Result 1 Threshold exceeded (happy path) P ASS 2 All readings below threshold (no wake) P ASS 3 Re-trigger prev ention (epsilon guard) P ASS 4 Second spike after recov ery P ASS 5 Steady gradual incline P ASS 6 Rapid spike + 5.0 U safety cap P ASS 7 Cloud sync (UPLOAD → CONFIRM → WIPE) P ASS 8 Sync failure (no data loss) P ASS 9 SNN sev erity af fects dose magnitude P ASS 10 Buffer full (ring eviction) P ASS 11 Azure Insights disabled (no-op) P ASS 12 Azure Insights enabled (telemetry) P ASS 13 Emergency descent (injection suppressed) P ASS 14 PREDIABETIC mode (notifications only) P ASS 15 Floating-point boundary ( ε guard) P ASS Fig. 5. Sigmoidal dose-response curves for three severity lev els. HIGH sev erity (dashed red) activ ates earliest—full dose engages at lower excess glucose. All curves are bounded by the 5.0 U safety cap. Inspired by Chou et al. [ 10 ] PB A glucose-responsiv e insulin. pre-hypoglycaemia descents, post-hypoglycaemia rebounds, and sustained near-threshold exposures that cannot be detected from the current reading alone. Evaluation scope: these windows ar e fr om the training patient split (OhioT1DM patients 559, 563, 570, 575, 588, 591). The SNN was trained on these windows. This is a capability demonstration, not a blind generalisation test. The AD A rule-based classifier was never trained; its performance is purely ar chitectural. The temporal benchmark re veals the system’ s most impor- tant limitation: neither the SNN nor the AD A rule handles non-obvious temporal hypoglycaemia windows adequately . Both achie ve < 20% recall on these dangerous pre- and post-hypoglycaemia patterns. The SNN actually performs slightly worse (9.2%) than the ADA rule (16.7%) because the 895 hypo_event windows represent only 0.8% of training data—too sparse for the class-weighted loss to dev elop strong temporal representations beyond the dominant AD A threshold pattern. This result is more scientifically v aluable than a positiv e T ABLE XI T E MP O R A L B E N C HM A R K O N 4 2 6 N O N - O B V I O US H YP O W I N D OW S Metric AD A Rule SNN Interpretation HIGH recall 16.7% 9.2% Both fail on temporal edges HIGH precision 100% 100% When predict HIGH, correct Correct / 426 71 39 ADA slightly better Neither classifier meets clinical safety bar . T ABLE XII S OT A B A S EL I N E C O MPA R IS O N Metric SNN Bi-LSTM MLP Accuracy 85.24% 99.06% 99.00% HIGH recall 88.84% 99.78% 99.49% HIGH F1 87.23% 99.24% 98.92% Parameters 9,859 138,627 9,859 T raining (CPU) 7,589 s 299 s 145 s Inference (CPU) 1,094 ms 61 ms 6 ms Energy / inf. (neuromorphic) 1,551 fJ 122.9 nJ 8.7 nJ SNN efficiency baseline 79,267 × worse 5,609 × worse finding: it precisely identifies the gap and motiv ates the path forward—dedicated augmentation of hypo_event windows, recurrent sequence modelling on raw CGM time series (rather than pre-extracted features), or a separate pre-hypoglycaemia descent sub-classifier with a dedicated training objectiv e. E. SO T A Baseline Comparison: SNN vs. Bi-LSTM vs. MLP W e trained two standard baselines on the identical Gold train/val/test split to answer: is the SNN architecture necessary , and is it better than conv entional approaches? All three models receiv e the same 10-feature input. LSTM and MLP recei ve raw normalised vectors; the SNN receives stochastic Poisson- encoded spike tensors ( T = 30 ). Figure 6 provides a visual summary of all four classifiers across both performance and energy dimensions. The LSTM and MLP achieve near-perfect accuracy (99%) on this test set. Howe ver , as established in Section IV -A , this is partly a consequence of the circular ev aluation—the test set consists of simglucose patients whose labels follow AD A rules exactly , and dense networks fit this decision boundary without difficulty . The SNN’ s lower accuracy (85.24%) reflects the information loss introduced by stochastic Poisson encoding: con verting a deterministic 10-feature vector into random spike trains fundamentally adds noise to each inference pass. Unlike the deterministic dense networks, the SNN’ s performance variance across inference runs is non-zero by design. The SNN’ s architectural justification is not accuracy on static-threshold labels—it is ener gy efficiency . The theoret- ical analysis [ 15 ], [ 16 ] sho ws the SNN requires 1,551 fJ per inference versus 122.9 nJ for the LSTM—approximately 79,000 × less energy . For continuous 24/7 monitoring on a coin-cell-powered wearable device where the pipeline acti vates ev ery 5 minutes for years, this energy adv antage is the fundamental reason to pursue the SNN architecture rather than a dense model. On neuromorphic hardware (Intel Loihi, IBM T rueNorth), the SNN would also achiev e substantially lower latency than the CPU figures reported here. While currently simulated on standard CPUs, this SNN architecture is explicitly designed for future deployment on neuromorphic edge accelerators (e.g., SynSense Xylo, BrainChip Akida) to physically realise these theoretical ener gy gains on implantable and wearable hardware. The LSTM parameter count (138,627 vs. 9,859 for SNN and MLP) is also a practical concern for embedded deployment on constrained MCUs. The SNN and MLP share identical parameter counts—the SNN is equiv alent in model complexity to the MLP but adds temporal spiking dynamics. X . L I M I TA T I O N S , F U T U R E W O R K , A N D H A R D W A R E R O A D M A P A. Curr ent Limitations • Hardwar e boundary . PDDS is the computational middle layer . Input reads from pre-collected OhioT1DM/simglucose files rather than a liv e CGM hardware stream. Output dose commands are computed but not yet connected to a physical insulin pump actuator . • T emporal pattern learning gap. The temporal benchmark (Section IX-D ) shows the SNN achieves only 9.2% recall on non-obvious hypoglycaemia windo ws—worse than the ADA classifier’ s 16.7%. This is the main algorithmic limitation. • Circular evaluation. The simglucose-dominant test set uses AD A labels, making rule-based classifiers appear artificially superior to the SNN. A held-out OhioT1DM cohort with clinical annotations is needed for non-circular testing. • Data composition. 33.5% of training data is FD A-validated physiological simulation (simglucose). While not arbitrary synthetic data, it is simulated rather than measured from living patients. Prospective v alidation on a live CGM stream is the next required validation step. • Dose formula is an approximation. The Bergman-inspired sigmoidal formula is a clinically-motiv ated proxy . Full ODE-based pharmacokinetic modelling with patient-specific parameter fitting is required for clinical deployment. • Five-phase hardwar e roadmap. T o transition from soft- ware to a clinical device, we are ex ecuting a five-phase rollout. Phase 1 (Done): Full software stack validation. Phase 2 (Q2-Q3 ’26): Physical CGM integration via liv e BLE/USB streams. Phase 3 (Q4 ’26): End-to-end bench testing on physiological phantoms. Phase 4 (2027): Near-human testing (IRB) for prediabetic notifications. Phase 5 (2027–28): Clinical trials, federated learning, FD A pathway , and Tin yML porting to neuromorphic silicon (SynSense/BrainChip). Fig. 6. SNN vs. ADA Rule vs. Bi-LSTM vs. MLP — Complete Comparison. Panel A : Overall accuracy and HIGH-class recall (safety metric) for all four classifiers on the 5,724-window test set. ADA Rule’s 100% HIGH recall is a circular ev aluation artefact. Panel B : Estimated energy per inference on neuromorphic hardware (log scale). The SNN is 79,267 × more energy efficient than the Bi-LSTM. Energy computed using SynOps (SNN) vs. MAC operations (LSTM/MLP) following Merolla et al. [ 15 ] and Diehl et al. [ 16 ]. X I . C O N C L U S I O N W e have presented PDDS—an in-silico, software-complete research prototype of an event-dri ven computational pipeline for predictiv e insulin dose calculation. The core contribution is a three-layer LIF Spiking Neural Network trained on 128,025 windows combining real OhioT1DM patient recordings and FD A-validated physiological simulation data. The system is motiv ated throughout by neuromorphic computing principles: ev ent-driv en activ ation, spike-based computation, and theo- retical compatibility with ultra-low-po wer neuromorphic edge silicon. Our three-part honest ev aluation framework yields three distinct findings: (1) Accuracy trade-off. On the standard test set, LSTM achiev es 99.06% accuracy vs. the SNN’ s 85.24%, demon- strating that the SNN’ s stochastic encoding trades a portion of accuracy for the architectural advantage of energy effi- ciency ( ∼ 79 , 000 × less energy than LSTM on neuromorphic hardware). This is not architectural failure—it is an expected consequence of Poisson encoding noise, and the SNN’ s HIGH- class recall of 88.84% remains clinically relev ant. (2) T emporal limitation. The temporal benchmark rev eals that neither architecture currently handles non-obvious pre- and post-hypoglycaemia patterns well—both the SNN (9.2% recall) and the AD A rule (16.7% recall) fail on these critical edge cases. This is the system’ s most important identified limitation and the primary target for future work. (3) Energy advantage. The quantified 79,267 × energy efficienc y advantage defines the research agenda: the SNN architecture is architecturally correct for wearable deployment, but requires improved temporal supervision— specifically , reweighted hypo_event training, sequence modelling on raw CGM traces, or a dedicated pre-hypoglycaemia descent sub-classifier . The system is currently the computational middle layer only , with no physical hardware connections. A fiv e-phase roadmap leads from the current software prototype through physical CGM integration, bench testing, and—subject to ethics committee approval—structured human validation. The codebase, training pipeline, and all ev aluation scripts are open for reproduction. R E F E R E N C E S [1] International Diabetes Federation, “IDF Diabetes Atlas, ” 10th ed. Brus- sels: IDF , 2021. [2] R. Hovorka et al., “Nonlinear model predictiv e control of glucose concentration in subjects with type 1 diabetes, ” Physiol. Meas. , vol. 25, no. 4, 2004. [3] W . Maass, “Networks of spiking neurons: The third generation of neural network models, ” Neural Netw . , vol. 10, no. 9, pp. 1659–1671, 1997. [4] E. O. Neftci, H. Mostaf a, and F . Zenke, “Surrogate gradient learning in spiking neural networks, ” IEEE Signal Process. Mag. , vol. 36, no. 6, pp. 51–63, 2019. [5] J. K. Eshraghian et al., “T raining spiking neural netw orks using lessons from deep learning, ” Pr oc. IEEE , 2023. [6] F . Zenke and S. Ganguli, “SuperSpike: Supervised learning in multilayer spiking neural networks, ” Neural Comput. , vol. 30, no. 6, pp. 1514– 1541, 2018. [7] P . Stock, C. T etzlaff, and C. Clopath, “Synaptic balancing: A biologically plausible plasticity rule, ” PLOS Comput. Biol. , 2022. [8] J. Timcheck, U. Maoz, and K. Bhaskaran-Nair, “Optimal noise level for coding in spiking neural networks, ” PLOS Comput. Biol. , 2022. [9] O. V eiseh et al., “Managing diabetes with nanomedicine, ” Nat. Rev . Drug Discov . , vol. 14, pp. 45–57, 2015. [10] D. H.-C. Chou et al., “Glucose-responsive insulin activity by cov a- lent modification with aliphatic phenylboronic acid conjugates, ” PNAS , vol. 112, no. 8, pp. 2401–2406, 2015. [11] C. Marling and R. Bunescu, “The OhioT1DM dataset for blood glucose lev el prediction, ” in KHD W orkshop @ IJCAI , 2018. [12] C. Dalla Man et al., “The UV a/Padov a type 1 diabetes simulator, ” IEEE T rans. Biomed. Eng. , 2014. [13] P . Bannigan et al., “Machine learning directs agents to optimize formu- lations, ” Nat. Commun. , vol. 12, p. 6583, 2021. [14] X. Zhang et al., “Spike-based ECG classification using spiking neural networks, ” Fr ont. Neurosci. , vol. 14, 2020. [15] P . A. Merolla et al., “ A million spiking-neuron integrated circuit with a scalable communication network and interface, ” Science , vol. 345, no. 6197, pp. 668–673, 2014. [16] P . U. Diehl et al., “F ast-classifying, high-accuracy spiking deep networks through weight and threshold balancing, ” in IJCNN , 2015. [17] A. E. W . Johnson et al., “MIMIC-IV : A freely accessible electronic health record dataset, ” PhysioNet , 2020.
Original Paper
Loading high-quality paper...
Comments & Academic Discussion
Loading comments...
Leave a Comment