The First OpenFOAM HPC Challenge (OHC-1)
The first OpenFOAM HPC Challenge (OHC-1) was organised by the OpenFOAM HPC Technical Committee (HPCTC) to collect a snapshot of OpenFOAM's computational performance on contemporary production hardware and to compare hardware-constrained submissions w…
Authors: Sergey Lesnik, Gregor Olenik, Mark Wassermann
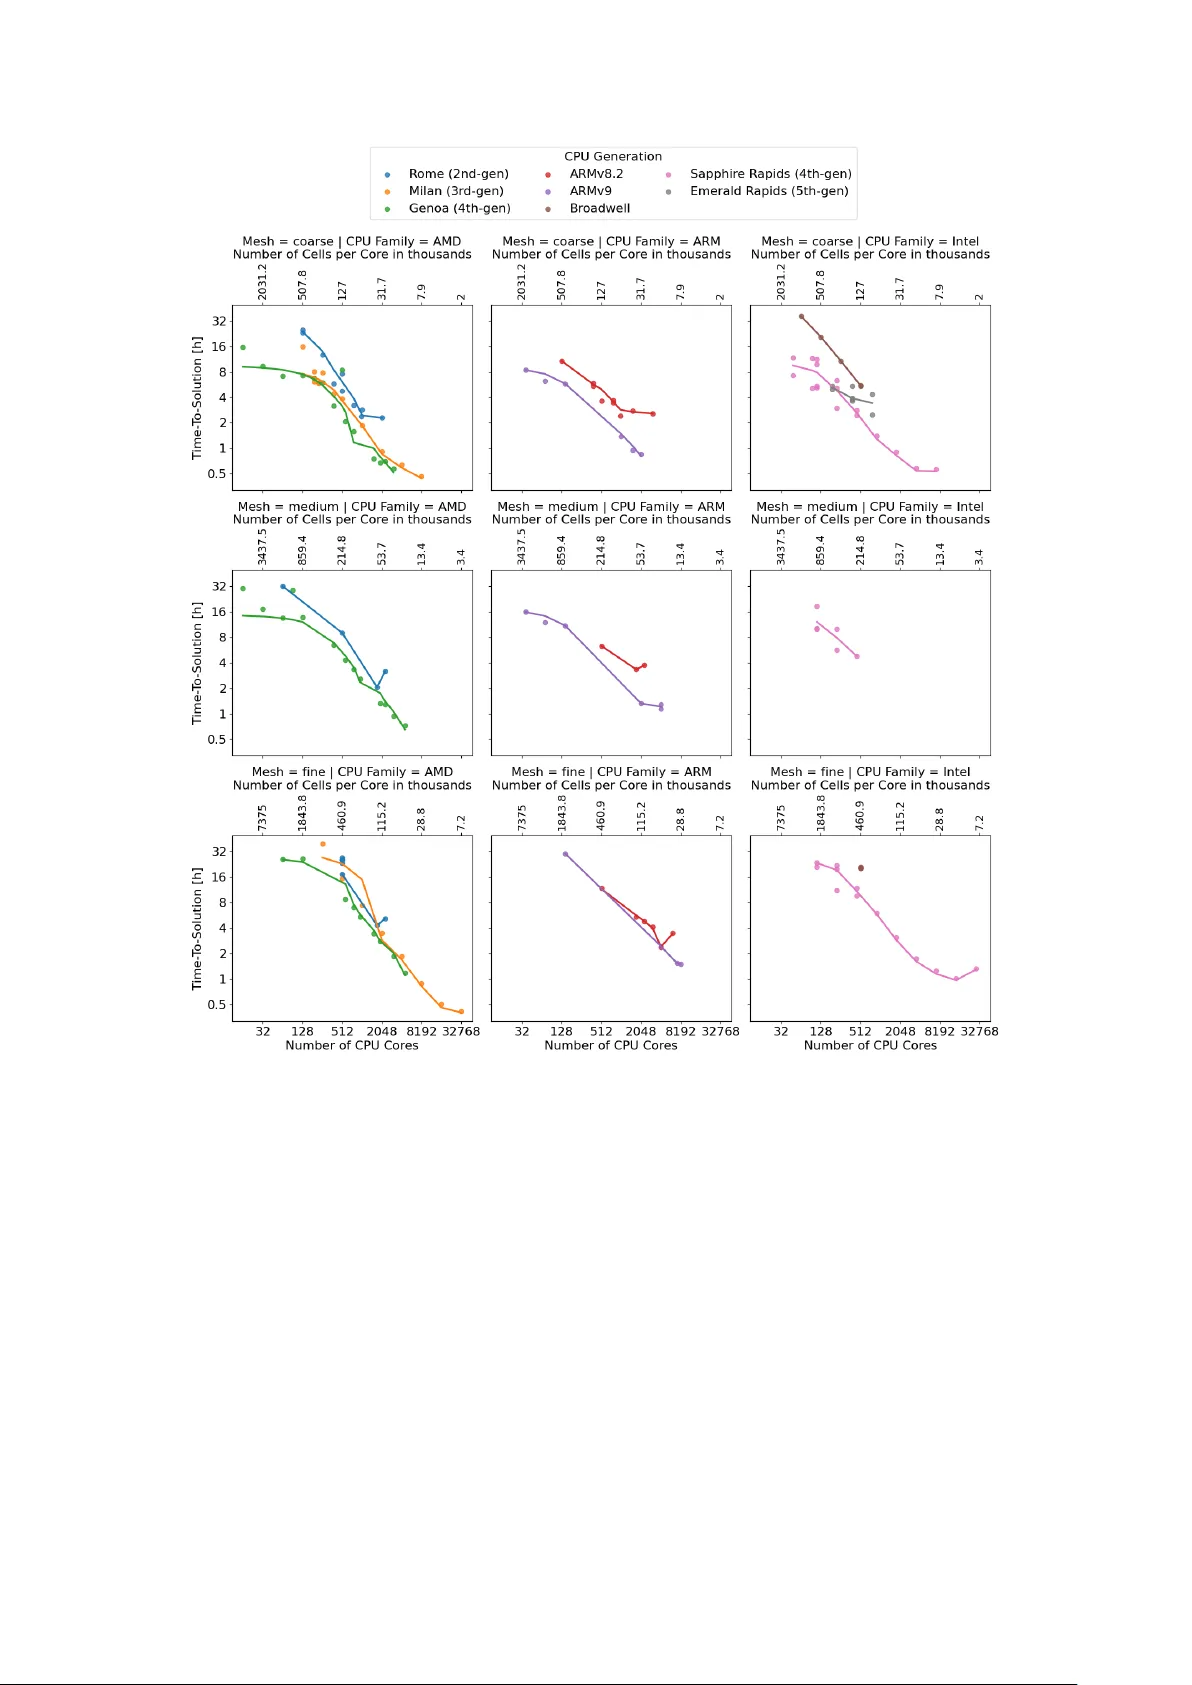
The First Op enF O AM ® HPC Challenge (OHC-1) Sergey Lesnik 1 , Gregor Olenik 2 , and Mark W asserman 3 1 Wikki GmbH, W ernigero de, Germany Email address : sergey.lesnik@wikki-gmbh.de 2 T echnical University of Munich (TUM), Munich, Germany Email address : gregor.olenik@tum.de 3 T oga Netw orks - a Huawei Company , Haifa, Israel DOI: TBD Results with v ersion(s): Op enF O AM ® v2412 Rep ository: h ttps://github.com/OpenFO AM-HPC-Challenge/OHC1 Abstract. The first OpenFO AM HPC Challenge (OHC-1) w as organised b y the Op enF OAM HPC T echnical Committee (HPCTC) to collect a snapshot of OpenFO AM ® ’s computational p erformance on contemporary production hardware and assess the impact of softw are optimisations on computational efficiency . Participan ts ran a common incompressible steady-state RANS case, the op en-closed cooling DrivAer (occDrivAer) configuration, on prescrib ed meshes, submitting either with the reference setup (hardware trac k) or with modified solv ers, decomp osition strategies, or accelerator offloading (softw are track). In total, 237 v alid data points were submitted by 12 contributors: 175 in the hardware track and 62 in the softw are track. The hardware track cov ered 25 distinct CPU mo dels across AMD, Intel, and ARM families, with runs spanning from single-node configurations up to 256 no des (32 768 CPU cores). W all-clock times ranged from 7.8 minutes to 65.7 hours and rep orted energy-to-solution from 2.1 to 236.9 kWh. Analysis of the hardw are track identified a P areto front of optimal balance betw een time- and energy-to-solution, and revealed that on-pac k age high-bandwidth memory (HBM) dominates single-node p erformance for next-generation CPUs. Softw are-track submissions ac hiev ed up to 28% low er energy per iteration, 17% higher performance per node, and 72% shorter time per iteration than the b est hardware-trac k results, with full GPU ports and selective-memory optimisations leading the p erformance range. This manuscript describ es the c hallenge organisation, the case setup and metrics, and presen ts the main findings from b oth trac ks together with an outlook for future challenges. Contents 1. In tro duction 2 2. Case Setup 2 3. Challenge Structure and Procedure 3 3.1. Metrics 3 3.2. Submission V alidation 4 4. Data Analysis 4 4.1. Hardw are T rac k 5 4.2. Soft ware T rac k 9 5. Conclusion and Outlo ok 12 5.1. Hardw are-track findings 12 5.2. Soft ware-trac k findings 13 5.3. Outlo ok 13 Ac knowledgemen ts 13 App endix A. Supplementary Material 13 App endix B. Data Rep ository 14 References 15 1 2 S. Lesnik, G. Olenik, and M. W asserman 1. In tro duction Op enF O AM is extensiv ely utilised in b oth academia and industry for research and design, with many applications requiring large computational resources. It is therefore common to find Op enF O AM among the principal consumers of compute capacity on High Performance Computing (HPC) clusters. T o sup- p ort future improv emen ts in resource efficiency , the first Op enF O AM HPC Challenge (OHC-1) was launc hed by the Op enF O AM HPC T echnical Committee (HPCTC). In this context, challenge problems are a commonly used to ol to test hardw are p erformance or to compare algorithmic approac hes and im- plemen tations. W ell-known examples include the High Performance Linpack (HPL) from the HPCC suite [1], which underpins the TOP500 list, and domain-sp ecific challenges in areas such as automotive CFD [2–4]. The term “challenge” is used here to encourage communit y con tributions aimed at improving computational efficiency rather than only rep orting baseline performance. The goal of OHC-1 was to gather a snapshot of Op enFO AM ® ’s p erformance on current production hardw are and to enable comparison of hardw are configurations with soft ware optimisations. F urthermore, the initiative aimed to: • collect data for ev aluating future algorithmic and implementation c hoices in Op enFO AM ® ; • assess efficiency and scalabilit y across hardware platforms; • compare p erformance of recen t Op enF OAM ® v ariants and softw are optimisations; • prop ose unified metrics to guide developmen t on next-generation systems; • promote a more relev an t communit y benchmark case than the commonly used Lid-Driv en Cavit y 3D case 1 . The results of OHC-1 were presented as a mini-symposium at the 20 th Op enF O AM W orkshop in Vienna on July 1, 2025. The c hallenge attracted submission of 237 data p oin ts contributed by 12 organisa- tions from academia and industry . The combined rep orted energy consumption of all submissions w as appro ximately 4715 kWh. The man uscript is structured as follows. Section 2 prese n ts the case setup and mesh options. Section 3 describ es the organisation of the HPC Challenge, the metrics, and the v alidation criteria. Section 4 summarises the submitted data p oin ts and Sections 4.1 and 4.2 presen t the main findings of the hardw are and softw are tracks. Section 5 concludes with a summary and outlo ok for future challenges. Section B describ es the public data rep ository where all submissions and analysis to ols are a v ailable. 2. Case Setup The HPCTC selected a single test case that had to b e representativ e of typical industrial usage, computationally demanding, and suitable as a surrogate for common sim ulation workloads without relying on features that would exclude alternative implemen tations. Based on thes e criteria, the case with the external aero dynamic flo w ov er a static DrivAer automotive mo del has b een chosen. It had already been studied in a similar form as case 2 in the AutoCFD2 workshop [2] and as case 2a in the AutoCFD3 and AutoCFD4 workshops [3, 4], so reference results were av ailable to v alidate submissions. The challenge case is the op en-closed co oling DrivAer (o ccDrivAer) configuration: external aerody- namic flo w around a full car with closed co oling inlets and static wheels. The geometry is based on the notc hbac k v arian t of the F ord Op en Co oling DrivAer (OCDA), with a complex underb o dy and engine ba y co oling channels. F or OHC-1 it w as configured as a steady-state, incompressible RANS simulation using the SIMPLE algorithm with fixed inner iterations. Several meshes w ere pre-generated using snap- p yHexMesh with three resolutions: 65, 110 and 236 million cells, whic h w ere denoted as 65M, 110M and 236M, resp ectiv ely . The case is a v ailable in the HPCTC rep ository 2 . The k – ω SST turbulence mo del was emplo yed with pre-defined differencing sc hemes ( fvSchemes ). Key case parameters are given in T able 1. The Reynolds num ber based on wheelbase L ref and inlet velocity is approximately 7 . 2 × 10 6 . T able 1. Case prop erties for the o ccDrivAer challenge case. Kinematic viscosity (Air) ν 1 . 507 · 10 − 5 m 2 / s Inlet velocity U 38 . 889 m / s Wheelbase L ref 2.78618 m Reynolds num ber Re 7 . 1899 · 10 6 – 1 https://develop.openfoam.com/committees/hpc/- /tree/develop/incompressible/icoFoam 2 https://develop.openfoam.com/committees/hpc/- /tree/develop/incompressible/simpleFoam/occDrivAerStaticMesh OpenFOAM ® HPC Challenge (OHC-1) 3 Figure 1 shows the geometry and representativ e mesh views: the full o ccDrivAer configuration, a mid-plane section, and an underb o dy cut. (a) occDrivAer geometry . (b) Mid-plane mesh. (c) Underbo dy mesh (cut at axle). Figure 1. Challenge case geometry and mesh. 3. Challenge Structure and Pro cedure After defining the computational scop e of the challenges, the pro cedure was structured as illustrated in fig. 2. Data submissions were categorised into t w o tracks: Hardw are trac k.: P articipants used the pro vided cas e setup and the official Op enFO AM ® v2412 release. Only the hardw are, num ber of no des and cores, and system softw are stac k could v ary . Soft w are trac k.: An y Op enF O AM ® v ersion and custom solv ers or modifications were allow ed, pro vided the mesh and ph ysical model remained unc hanged and solution The prop osed topics for inv estigation in the softw are track included accelerators, pre-/p ost-pro cessing (I/O), mixed- precision arithmetic, linear solvers, and renum bering/decomp osition strategies. Submissions were accepted after the v alidation of computational results describ ed in section 3.2. The submitted results were then analysed b y the organising committee based on a set of predefined metrics. A comprehensiv e analysis of the hardware track and softw are track results w as subsequen tly presen ted by the organisers in the form of a mini-symp osium at the 20 th Op enF O AM ® W orkshop. In addition, participants delivered in-depth presen tations discussing their individual con tributions and in vestigations. Figure 2. Ov erview of the OHC-1 pro cedure. 3.1. Metrics. The follo wing metrics were used to ev aluate and compare the submissions in b oth trac ks. Time-to-solution (TTS): The w all-clock time from the start of the main solver to completion of the prescrib ed num ber of iterations, excluding pre-processing and initialisation. Energy-to-solution (ETS): The total energy consumed during the solver run. Where direct p o w er measuremen ts w ere not a v ailable, energy was estimated from the Thermal Design Po w er (TDP) of the CPUs/GPUs. Pre-pro cessing wall-clock time: The wall-clock time for running the utilities that prepare the case for the run of the main solv er application, e.g. decomposition, ren umbering, initialisation with p otentialF oam. 4 S. Lesnik, G. Olenik, and M. W asserman Time p er iteration: The mean wall-clock time of a single SIMPLE iteration. Energy p er iteration: The mean energy consumed p er SIMPLE iteration, deriv ed from ETS divided by the n umber of iterations. FV OPS (Finite-V olume Op erations P er Second): A throughput metric proposed in [5] de- fined as the n um b er of mesh cells m ultiplied by the n um b er of iterations, divided b y the wall-clock time: FV OPS = N cells × N iter t WC . (1) FV OPS is often rep orted p er no de to enable comparison across different no de counts. FV OPS p er energy: The ratio of FV OPS to energy , giving an energy-efficiency throughput met- ric. During the data collection and analysis process, sev eral corrections and assumptions were necessary: • The n um b er of cores w as corrected to represent physic al cores; hyper-threading was disregarded. • If not rep orted by the participants, some v alues w ere added based on publicly av ailable data (e.g. TDP according to the CPU mo del). • The energy analysis is mostly b ase d on the or etic al TDP values rather than direct p ow er measure- men ts, which introduces uncertain t y . Only a small n um b er of submissions provided energy data from total cluster measuremen ts. • The fo cus of this work lies on providing an ov erview of the complete data set; analysis of indi- vidual simulations or submissions are outside of the scop e. When av ailable references to further publications for in-depth analysis is provided. 3.2. Submission V alidation. Since Hardware-trac k submissions used the prescrib ed setup. Their cor- rectness was inheren t in the use of the reference case. In contrast, Softw are-track submissions required additional v alidation to ensure that solution qualit y w as preserved despite an y mo difications in the soft- w are, case decomp osition, or employ ed algorithms. Participan ts were required to extract force co efficient con vergence histories at run time and analyse the mean and v ariance of the aero dynamic co efficients ( C d , C l , C s ) using the meanCalc 3 utilit y . The v alidity criterion was 2 σ ( µ ) < 0 . 0015 , (2) where σ ( µ ) denotes the standard error of the running mean µ of the respective force co efficient. Reference v alues obtained with standard Op enFO AM ® on the fine mesh were C d = 0 . 262, C l = 0 . 0787, and C s = 0 . 0116. The data analysis team double-chec k ed and cross-compared rep orted v alues with the submitted time series data. Figure 3 illustrates the v alidation pro cess for an example softw are-trac k submission. The top ro w sho ws the instan taneous force co efficients together with the running mean computed from iteration 1265 on wards. In this case, the iterations b efore iteration 1265 were iden tified by meanCalc as initialisation transien ts and thus were not taken into account for the ev aluation. The b ottom ro w sho ws the running double standard error of the sample mean 2 σ ( µ ), which m ust fall b elo w the threshold of 0.0015 for each co efficien t. F or this submission the final v alues are all within the acceptance criterion. The conv erged running-mean coefficients ( C d = 0 . 2682, C l = 0 . 0911, C s = 0 . 0177) are in reasonable agreement with the reference v alues, confirming that the soft w are mo difications preserved solution accuracy . 4. Data Analysis OHC-1 received contributions from 12 organisations spanning academia, researc h centres, and industry: Wikki Gm bH, Universit y College Dublin (UCD), CFD FEA Service, CINECA, Huaw ei, Universit¨ at der Bundesw ehr M ¨ unc hen, F ederal W aterw ays Engineering and Research Institute (BA W), Univ ersit y of Minho, T ec hnical Universit y of Munic h (TUM), United Kingdom A tomic Energy Authority (UKAEA), Engys, and E4 Computer Engineering. A total of 237 v alid data p oin ts were submitted: 175 in the hardware track and 62 in the soft ware trac k. Runs ranged from single-no de configurations up to 256 compute no des (32 768 CPU cores). W all-clo ck time to solution ranged from 7.8 min utes to 65.7 hours – a factor of ab out 560. Reported energy-to- solution (when provided) ranged from 2.1 to 236.9 kWh – a factor of about 110, resulting in a com bined rep orted consumption of approximately 4715 kWh across all submissions. T able 2 provides a summary of the key figures. The analysis is organised as follows. The hardware trac k (Section 4.1) examines the energy-time trade-off and iden tifies the P areto front, analyses strong scaling b ehaviour, isolates single-no de compute 3 meancalc.upstream- cfd.com/ OpenFOAM ® HPC Challenge (OHC-1) 5 Figure 3. Example meanCalc v alidation for a softw are-track submission. T op row: instan taneous force co efficien ts (blue) with running mean from iteration 1265 (orange) and reference v alue (green). Bottom ro w: conv ergence of 2 σ ( µ ) (blue) tow ards the acceptance threshold of 0.0015 (orange). T able 2. Ov erview of submitted data p oints (OHC-1). Submitted data p oints (total / hardware / softw are) 237 / 175 / 62 CPU mo dels (distinct) 25 GPU mo dels (distinct) 3 V endor split (AMD / Intel / ARM) 106 / 80 / 50 Max compute no des 256 CPU cores (min / max) 1 / 32 768 W all-clo ck time to completion (min / max) 7.8 min / 65.7 h Energy to solution (min / max), when rep orted 2.1 / 236.9 kWh T otal rep orted energy consumption ≈ 4715 kWh p erformance from interconnect effects, and discusses the impact of on-pack age high-bandwidth memory . The soft ware track (Section 4.2) is discussed b y optimisation category and compared to the hardware trac k in terms of FVOPS per node and energy p er iteration. 4.1. Hardw are T rac k. Hardw are-track submissions used the reference case and an official Op enFO AM ® release, whereby only hardw are, no de count, and system softw are could v ary . In total, 175 data p oints w ere submitted. Figure 4 giv es an ov erview of the submissions, showing the rep orted time-to-solution o ver a broad set of emplo y ed CPUs and the different mesh sizes. As shown in fig. 4b all three mesh sizes had numerous submissions, with some participants, e.g. 5, 7, and 13 submitting an equal amount of data p oin ts for all meshes. Some participants had a stronger fo cus on either coarse or fine mesh inv estigations, e.g. participan ts 8 and 6. In total, most data p oin ts where submitted for the coarse mesh and the least n umber for the medium, lik ely b ecause participan ts either fo cused on the single no de performance or the extreme scaling results. F urthermore the submitted data in the hardware trac k co v ers 20 distinct CPU mo dels across three ma jor vendor families: AMD (81 submissions), ARM (34), and In tel (60). Figure 4c sho ws a breakdown of the n um b er of submissions in to CPU vendors and individual CPU generations. 4.1.1. Ener gy–time tr ade-off and Par eto fr ont. A cen tral question in HPC w orkloads is the trade-off b et w een time-to-solution (TTS) and energy-to-solution (ETS). Figure 5 presen ts suc h a trade-off for all hardw are-track runs, faceted by mesh size. P areto fronts are shown as blac k lines indicating the optimal balance betw een TTS and ETS achiev ed with hardware released prior to that y ear. F rom the pareto fron ts, three distinct op erating regimes are visible: (1) Eficient : runs that minimise energy consumption at the cost of longer execution times (t ypically single-no de or small-scale runs on energy-efficient hardw are). 6 S. Lesnik, G. Olenik, and M. W asserman (a) (b) (c) Figure 4. Overview of hardware-trac k submissions, (a) Time-to-solution ov er num b er of utilized CPU cores, (b) num ber of submissions based on mesh type and con tributor ID, (c) num ber of submissions based on CPU vendor and CPU Generation. (2) F ast : runs that minimise wall-clock time b y using man y no des, at the expense of higher total energy . (3) Balanc e : runs that ac hieve a practical compromise b etw een energy and time. The shap es of the Pareto fronts for low er v alues of consumed energy demonstrate that relatively large impro vemen ts (low er v alues) of TTS can be ac hiev ed with low increases in ETS. On the other hand, for high ETS the P areto front confirms that increasing parallelism yields diminishing time savings while incurring substantially higher energy costs, consisten t with strong-scaling saturation effects discussed b elo w. F or eac h mesh, the three families occupy ov erlapping but distinct regions of the plot. ARM Figure 5. Energy-to-solution vs. time-to-solution for hardware-trac k runs, faceted by mesh size. Operating regimes and the Pareto fron t of optimal energy–time balance are indicated. submissions tend to cluster in the lo wer-energy region, reflecting recent man y-core, high-bandwidth- memory designs. AMD and In tel submissions span a wider range of no de coun ts and correspondingly wider ranges of b oth time and energy . Across all three meshes, the same qualitativ e trend holds: runs using more no des reduce time-to-solution but shift up w ard and to the right in energy consumption. 4.1.2. Str ong-sc aling b ehaviour. Strong scaling, whic h represents running a fixed problem size on an increasing num ber of CPU cores, reveals tw o distinct p erformance-limiting regimes: • Single-no de sc aling limit: Within a single no de, p erformance is b ounded b y memory bandwidth. As the n um b er of cores p er no de increases, conten tion for shared memory buses limits the per-core throughput. This effect is esp ecially pronounced for man y-core architectures. • Multi-no de sc aling limit: Bey ond a single no de, inter-node comm unication dominates the exe- cution time. Since Op enFO AM ® relies exclusively on MPI for parallelism, the communication o verhead gro ws with the surface-to-volume ratio of the domain decomp osition. A practical scal- abilit y limit of appro ximately 10 000 cells p er core w as observ ed across submissions. Below this threshold, comm unication costs exceed computational w ork. Depending on the CPU architecture, this limit may b e larger. OpenFOAM ® HPC Challenge (OHC-1) 7 Figure 6. Strong scaling: time-to-solution vs. n um ber of CPU cores for the coarse (top), medium (centre), and fine (b ottom) meshes with a segmentation based on CPU family: AMD (left), ARM (centre), and Intel (right). Curv es represen t fits to the corresponding data p oints using a lo cal regression mo del. Figure 6 sho ws detailed strong-scaling b ehaviour across three mesh resolutions (coarse, medium, fine), three CPU families (AMD, ARM, In tel), and pro cessor generations within eac h family . Time-to-solution is plotted against core count, with the corresp onding cells-p er-core indicated along the top axis. The data is represented by means of a scatter plot with the asso ciated curves that are fitted using lo cal regression. Only data with more than t w o p oints p er mesh and CPU generation is included in the plot to enable meaningful fitting. Across all arc hitectures and mesh sizes, time-to-solution decreases with increasing core count, confirming exp ected strong scaling b ehaviour. Ho w ever, none of the configurations exhibit ideal linear scaling o ver the full range. In some cases, the slop e of the curv es inv erts at higher core counts, indicating reduced parallel efficiency as the workload p er core diminishes and communication ov erhead b ecomes more significan t. This is typically observed in the range of 10 to 50 thousand cells p er core. Within eac h CPU family , new er generations generally ac hiev e lo w er absolute run times at comparable core coun ts. An alternativ e illustration of the scaling b ehaviour is presen ted in the app endix, fig. A.14. 8 S. Lesnik, G. Olenik, and M. W asserman Figure 7. Parallel efficiency vs. num ber of CPU cores for the coarse (top) and fine (b ottom) meshes with a segmentation based on CPU family: AMD (left), ARM (centr e), and Intel (right). Curves represent fits to the corresp onding data p oin ts using a lo cal regression mo del. 4.1.3. Par al lel efficiency. T o quantify how effectiv ely additional cores reduce time-to-solution, we com- pute a normalised parallel efficiency metric. F or each CPU sub-model with m ulti-node data, the efficiency is defined as the ratio of the minim um core-weigh ted time (i.e. the most efficient single run) to the core- w eighted time of each run: η = min i ( T i · N i ) T · N , (3) where T is the time-to-solution, N is the num b er of CPU cores, and the minimum is tak en ov er all m ulti-no de runs for that sub-mo del. Figure 7 shows the parallel efficiency for the coarse and fine meshes categorised by CPU family . The medium mesh was excluded from the analysis b ecause of the insufficien t amount of data points with m ulti-no de runs. The v alues are normalised according to the most efficient run from the corresp onding mesh and CPU family . Efficiency drops b elow unity as the core coun t increases, indicating communication o verhead. The rate of decline dep ends on CPU generation and vendor family: arc hitectures with higher p er-core memory bandwidth and more capable in terconnects maintain higher efficiency at larger core coun ts. Some of the CPU generations demonstrate higher parallel efficiency with the increasing num ber of cores indicating sup er-linear scaling, whic h is a kno wn pattern for mo dern computer arc hitectures [5]. 4.1.4. High Bandwidth Memory and L ast-L evel Cache effe ct. Hardware v endors address the memory- b ound b ottleneck of the applications such as OpenFO AM ® b y pro viding chip architectures with on-c hip memory , e.g. High Bandwidth Memory (HBM) or large Last-Level Cache (LLC). The following analysis pro vides insight on the impact of these approaches on the p erformance. First, single-no de runs are analysed to separate compute p erformance from in terconnect effects. Figure 8 sho ws the single-no de energy–time trade-off with data p oin ts coloured by last-level cac he category . F or the coarse and medium meshes, submissions with larger HBM configurations consistently occupy the lo w er-left (faster, more efficien t) region of the plot, demonstrating that on-pack age memory dominates single-no de p erformance in terms of speed and efficiency . This is consistent with the memory-b ound nature of sparse iterativ e OpenFOAM ® HPC Challenge (OHC-1) 9 Figure 8. Single-no de runs: time-to-solution vs. energy-to-solution, faceted b y mesh size and coloured b y last-level cac he category . solv ers used in Op enFO AM ® : the working set of Op enFO AM ® ’s field op erations and linear-algebra k ernels b enefits directly from higher memory bandwidth. In the case of the fine mesh, there were not enough submissions of single-no de runs for an analysis. The runs p erformed on the hardware with large last-lev el caches do not show a particular trend. The amount of data for computing the case on a single no de is orders of magnitude larger than the largest cac he sizes. Therefore, the computation is bound mainly b y the bandwidth of the main memory . This is different for the on-pack age memory chips, where the memory size is comparable of the problem size. Figure 9. Multi-no de runs: energy-to-solution vs. num ber of no des, faceted by mesh size and coloured b y last-level cac he category . Ho wev er, with the higher n umber of no des the data load p er CPU decreases. An insight of the LLC size impact on ETS for such runs is pro vided in fig. 9, whic h presents data p oints only for the computations on more than one no de. Additionally , only three cache sizes together with the on-pac k age memory cases w ere selected for a better o v erview. The diagrams may b e divided in to tw o areas at around 8, 16, 32 no des for the coarse, medium and fine mesh, resp ectiv ely . In the area of the low er no de count, the ETS for particular LLC sizes tend to sta y at the same lev el for the increasing num ber of no des. According to the observ ations from [5], here, the gro wing communication ov erhead seems to b e balanced by higher p erformance due to low er data amount p er CPU. In the area of the higher node count, this balancing do es not seem to hold and the energy efficiency starts to deteriorate. The runs with the 384 MB LLC are more energy efficient than other large LLC computation. This cannot b e attributed to the cache size alone since the larger LLC b elong to the new er hardw are generations that ma y bring other architectural impro vemen ts. 4.2. Soft w are T rac k. The softw are track allow ed mo difications to the default Op enFO AM ® setup to study for example the impact of solver c hanges, decomposition strategies, or hardware-specific optimi- sations. While hardw are w as unconstrained, the mesh and ph ysical mo delling (spatial and temp oral discretisation, turbulence mo del) had to remain unchanged. Contributions from five organisations (En- gys, CINECA, Huaw ei, Wikki GmbH, and KIT/TUM) fell in to the following broad categories: 10 S. Lesnik, G. Olenik, and M. W asserman • F ull GPU p orts [6, 7] (Engys, CINECA) • Offloading of linear solv ers to GPUs via OGL [8, 9] (KIT/TUM) • Decomp osition optimisations [6] (Wikki, KIT/TUM) • Mixed precision [10] (Hua w ei) • Selectiv e memory allo cation [6] (Huaw ei) • Coheren t I/O format [11] (Wikki) In the following only a high level ov erview of the impact of the optimisation tec hniques is presented, a full discussion of the individual techniques is outside the scop e of this work and the interested reader is referred to individual publications and conference con tributions in [6]. T able 3 summarises selected metrics comparing the b est soft w are-track and hardw are-track results. The softw are trac k represented appro ximately 26% of total submissions. T able 3. Comparison of key soft ware-trac k vs. hardware-trac k metrics. Metric Softw are T rack Hardware T rack Change w.r.t Hardware T rack Submitted results 62 175 26% of total Minim um energy p er iteration [J] 1867 2613 − 28% Maxim um p erformance [MFVOPS] 737 629 +17% 4.2.1. Distribution of submissions. Figure 10 illustrates the distribution of softw are-trac k submissions. Figure 10a sho ws the n umber of hardware- and soft w are-trac k submissions across different mesh sizes. Most soft ware-trac k data p oints corresp ond to the fine mesh, b oth in absolute num b ers and relativ e to the hardw are-track submissions. The breakdo wn of optimisation categories, sho wn in Figure 10, indicates that the ma jority of submissions fo cused on coherent I/O and m ultilevel decomposition. These are follow ed b y selective memory allo cation, mixed-precision solvers, custom decomposition tec hniques, and full GPU p orts. An analysis of the distribution of the optimisation categories across different no de counts reveals that several optimisation approac hes, suc h as linear solv er offloading, full GPU p orts, mixed-precision metho ds, and selectiv e memory allo cation, were primarily inv estigated at smaller scales, up to 16 no des. In contrast, multilev el decomp osition and coherent I/O w ere also explored at larger scales, exceeding 64 no des. Custom communication-optimized decomposition strategies were studied in the intermediate range, b et ween 16 and 64 no des. In addition to the CPU mo dels ev aluated in the hardware trac k, nine submissions utilized GPUs. These included six runs on NVIDIA A100-64, three on NVIDIA A100-40, and one on AMD MI100. (a) (b) Figure 10. Distribution of hardware and softw are trac k contributions b y mesh type (a) and distribution of softw are optimisation category contributions ov er num b er of no des (b). 4.2.2. FV OPS p er no de and ener gy p er iter ation. Figure 11 shows measured FV OPS per no de versus energy p er iteration in Joule for all submissions, with softw are-trac k p oints coloured by optimisation t yp e and hardware-trac k p oin ts in grey as reference. Since most submissions inv estigated strong scaling b eha viour, data p oints tend to cluster along diagonal lines. Several soft ware-trac k data p oints can be found in the upp er-left region of the plot, indicating higher throughput per no de and a low er energy OpenFOAM ® HPC Challenge (OHC-1) 11 consumption p er iteration compared to the default OpenFO AM ® v ersion. Here, namely the selectiv e memory allocation optimisation reduced the minimum required electric energy from 2613 Joule to 1867 Joule p er iteration. Additionally , full GPU p orts and selectiv e-memory optimisations ac hiev ed the highest FV OPS per node, with 58 and 36 MFV OPS respectively , with the b est soft ware-trac k result reaching appro ximately 4 × the maxim um hardw are-trac k performance of 14 MFVOPS p er no de. The increased Figure 11. FVOPS p er no de vs. energy p er iteration in Joules. Grey: hardw are trac k; coloured: softw are trac k by optimisation category . p eak p erformance is further reflected in the reported minim um wall-clock time required to compute a single timestep. As sho wn in table 4, the largest improv ements are observed for the coarsest mesh, with a reduction of 72%, follow ed b y the medium mesh, which exhibits a reduction of 44%. T able 4. Rep orted minimum time per timestep. Mesh coarse medium fine Hardw are T rac k 0.42 0.65 0.37 Soft ware T rac k 0.11 0.36 0.32 Change -72 % -44 % -14% It is imp ortant to note that, although full GPU p orts exhibited the highest p er-node p erformance, their comparativ ely limited strong-scaling efficiency constrained their o verall performance. Consequently , alternativ e optimisation strategies, suc h as custom decomp osition approac hes achiev ed the highest ag- gregate p erformance in terms of FVOPS. This b ehaviour is illustrated in fig. 12, which depicts FVOPS as a function of the n um ber of compute nodes for the fine mesh, categorised by optimisation strategy . Nev ertheless, GPU-based implementations required substantially fewer compute no des to achiev e com- parable p eak p erformance relative to CPU-only optimisation approac hes, corresponding to a reduction of approximately one order of magnitude (i.e., a factor of 10–15). 4.2.3. A er o dynamic c o efficient c onsistency. An important quality metric for softw are-track submissions is the consistency of the computed aero dynamic force co efficients across different optimisation approac hes and hardw are. Figure 13 shows box-and-strip plots of the mean drag ( C d ), lift ( C l ), and side-force ( C s ) co efficien ts across all submissions. The narro w in terquartile ranges for C d and C s indicate that most optimisations preserv e solution accuracy w ell. The slightly wider spread for C l reflects the kno wn sensitivit y of lift to solver settings, turbulence-mo del n umerics, and con vergence criteria. Overall, the distributions confirm that softw are-trac k submissions main tained acceptable agreement with the reference v alues, v alidating the meanCalc-based qualit y chec king pro cedure describ ed in Section 3.2. 12 S. Lesnik, G. Olenik, and M. W asserman Figure 12. FVOPS vs. no de count for soft w are-trac k submissions, coloured by optimi- sation category . T rendlines using p olynomial regression are sho wn as colored dash-dotted lines. Figure 13. Distribution of mean aerodynamic force coefficients ( C d , C l , C s ) across all submissions. Box plots show medians and in terquartile ranges; individual submissions are ov erlaid as strip p oints. 5. Conclusion and Outlo ok The first Op enFO AM HPC Challenge (OHC-1) collected 237 v alid data p oints from 12 contributing organisations across a hardw are track (175 submissions) and a soft w are track (62 submissions). Partici- pan ts ran the common o ccDrivAer steady-state RANS case on prescrib ed meshes, with hardware-trac k runs restricted to the reference setup and soft w are-track runs allo wing appro v ed solv er and decomp osition mo difications. 5.1. Hardw are-trac k findings. The hardware track pro vided a div erse baseline of OpenFO AM ® p er- formance on curren t pro duction systems, cov ering 25 CPU models from AMD, In tel, and ARM, with runs from single-no de configurations up to 256 nodes. The key findings are: • A P areto fron t of optimal balance b et w een time-to-solution and energy-to-solution w as iden tified, highligh ting that increasing parallelism yields diminishing time sa vings at substan tially higher energy cost. • A t small scale, next-generation CPUs (ARM, Intel, AMD) with on-pac k age high-bandwidth mem- ory (HBM) and man y-core architectures sho w significantly impro v ed single-no de p erformance. • A t large scale, inter-node comm unication dominates p erformance. Many-core architectures p ose a particular challenge for Op enF O AM ® , whic h curren tly relies solely on MPI parallelism. A practical strong-scaling limit of approximately 10 000 cells p er core was observ ed. • The maximum reported hardware-trac k p erformance was appro ximately 630 MFVOPS p er no de, with a minimum energy p er iteration of ab out 2613 J. OpenFOAM ® HPC Challenge (OHC-1) 13 5.2. Soft w are-trac k findings. The softw are track demonstrated that substantial gains are achiev able through algorithmic and implementation optimisations. Softw are-trac k submissions addressed multiple optimisation areas, e.g. full GPU p orts, GPU linear-solver offloading, decomp osition optimisation, mixed precision, selective memory allocation, and coheren t I/O. Compared to to the hardware track, the com- putations from the soft w are track ac hiev ed: • up to 28% lo w er minimum energy p er iteration (1867 vs. 2613 J); • 17% higher maximum FV OPS (737 vs. 629 MFVOPS); • up to 72% faster computation of a single timestep. A key insight is that soft ware optimisations on older-generation hardware can outp erform unoptimised runs on newer-generation CPUs, underscoring the imp ortance of co-optimising algorithms alongside hard- w are. 5.3. Outlo ok. OHC-1 establishes a reference dataset and unified metrics (FVOPS, energy p er iteration, time-to-solution) for future comparisons. Con tributions exceeded exp ectations, but the submission format needs to be tigh tened for future editions to further improv e comparability . Planned impro v emen ts for follo w-up challenges include: • encouraging more softw are-trac k participation (currently ∼ 20% of total submissions); • systematic inv estigation of netw ork in terconnect effects; • deriving b est-practice guidelines based on the collected submissions; • promoting the o ccDrivAer case as a more relev an t communit y b enchmark than the commonly used Lid-Driven Ca vit y; • con tinued publication and curation of the results dataset to enable further communit y analysis (see Section B). The HPCTC rep ository 4 remains the central place for case setups and submission guidelines. All OHC-1 submission data, analysis noteb o oks, and presen tations are publicly av ailable in the OHC-1 data rep osi- tory [12] as described in Section B. Ac kno wledgemen ts The authors gratefully ac kno wledge all contributors to OHC-1 for their submissions and participation in the mini-symposium: Elisab etta Boella, Ruggero Poletto, Eik e T angermann, Lydia Sc h ulze, Gabriel Mar- cos Magalh˜ aes, Aleksander Dubas, Simone Bn` a, Stefano Oliani, and Henrik Rusche, as well as the con- tributing organisations: Wikki GmbH, Univ ersit y College Dublin, CFD FEA Service, CINECA, Huaw ei, Univ ersit¨ at der Bundesw ehr M ¨ unc hen, F ederal W aterw ays Engineering and Research Institute, Univ er- sit y of Minho, T echnical Univ ersit y of Munich, United Kingdom Atomic Energy Authority , Engys, and E4 Computer Engineering. W e also thank the OpenFO AM HPC T echnical Committee for organising the challenge and pro viding the case setup and infrastructure. Parts of this work w ere supp orted b y the German F ederal Ministry of Education and Research (gran t n umber 16ME0676K). Author Contributions: Conceptualisation, S.L., G.O., and M.W.; metho dology , S.L., G.O., and M.W.; soft ware, S.L., G.O. and M.W.; v alidation, S.L., G.O., and M.W.; formal analysis, S.L., G.O., and M.W.; inv es- tigation, S.L., G.O., and M.W.; data curation, S.L., G.O. and M.W.; writing—original draft preparation, S.L., G.O., and M.W.; writing—review and editing, S.L., G.O., and M.W.; visualisation, S.L., G.O. and M.W.; pro ject administration, S.L., G.O. and M.W. All authors hav e read and agreed to the published version of the man uscript. App endix A. Supplementary Material An alternativ e illustration of the strong scaling b ehaviour shown in fig. 6 is pro vided in fig. A.14. In this figure, data points are group ed into bins according to the num ber of cells p er core for eac h mesh. The top row of fig. A.14 displa ys the observed FVOPS, while the b ottom ro w shows the n um b er of data p oin ts in each bin. Ideal scaling b ehaviour is indicated b y a red line. Most submissions fall within the range of 100,000 to 1 million cells p er core. F or b oth the coarse and fine meshes, only tw o submissions lie b elo w 16,000 cells p er core, and just one falls b elow 8,000 cells p er core. Consequen tly , the p oint at whic h strong scaling b egins to deteriorate, i.e. where further reductions in cells per core lead to decreased FV OPS can only b e appro ximated. How ever, the data indicate that FVOPS con tin ues to increase ev en to 8,000 cells per core. 4 https://develop.openfoam.com/committees/hpc 14 S. Lesnik, G. Olenik, and M. W asserman Figure A.14. Observed strong scaling b ehaviour of the FVOPS (top row) ov er the n umber of cells p er core for the different meshes and the n umber of data p oin ts p er bin for each mesh (b ottom row). App endix B. Data Repository While the case setup is a v ailable in the HPCTC repository 5 all submission data, analysis scripts, and summary presentations from OHC-1 were collected and made publicly av ailable in a dedicated GitHub rep ository [12]. 6 The rep ository is structured as follows: Submissions: The ra w submission spreadsheets (Excel files) from all 12 contributing organisations, together with asso ciated log files, input configurations, and force co efficient time series where pro vided. The submission data is licensed under CC BY 4.0. Analysis noteb o oks: A set of Jupyter noteb o oks used to pro duce the analysis and figures pre- sen ted in this pap er: • Overview.ipynb — submission statistics and ov erview plots; • HWTrack.ipynb — hardw are-trac k analysis (scaling, energy–time trade-off, single-node p er- formance); • SWTrack.ipynb — softw are-trac k analysis (category breakdo wns, GPU comparisons); • IO.ipynb — analysis of I/O optimisation submissions; • Interactive.ipynb — an in teractiv e noteb o ok for custom exploration of the full dataset. P arser utilities: OHCParser.py provides data parsing and me tric calculation routines that read the raw Excel submissions, compute deriv ed quantities (FV OPS, energy p er iteration, etc.), and pro duce a unified data.json file for accelerated loading. Presen tations: P articipant presentations delivered at the OHC-1 mini-symp osium, as w ell as sum- mary presentations for b oth tracks. In tro duction do cument: A PDF describing the full c hallenge rules, metrics, and data submission guidelines. The repository enables full repro ducibility of the results presen ted in this pap er and pro vides a starting p oin t for further communit y analysis. Researc hers are encouraged to use the in teractiv e notebo ok or the exp orted JSON dataset ( data.json ) for custom inv estigations. The source code is released under the MIT licence. The dataset is archiv ed on Zeno do with DOI 10.5281/zenodo.17063427 [12]. 5 https://dev elop.op enfoam.com/committees/hp c/incompressible/simpleF oam/o ccDrivAerStaticMesh; permalink: https://archive.softwareheritage.org/swh:1:dir:7a4df8317db04b28e1629b10e2a1284782268ec2;origin= https://develop.openfoam.com/committees/hpc;visit=swh:1:snp:f1fb62b1a7c53ee48c5132ea26171a3d7f5f6547; anchor=swh:1:rev:84c262431117f5c921db8335e368a12d0e9fa3f0;path=/incompressible/simpleFoam/ occDrivAerStaticMesh/ 6 https://github.com/OpenFOAM- HPC- Challenge/OHC1 OpenFOAM ® HPC Challenge (OHC-1) 15 References [1] J. Dongarra and P . Luszczek, “HPC challenge: Design, history , and implementation highligh ts,” in Contemp orary High Performanc e Computing . Chapman and Hall/CRC, 2017, pp. 13–30. [2] N. Ashton et al. , “Summary of the 2nd Automotive CFD Prediction W orkshop,” in Pr o ce e dings of the 2nd Automotive CFD Pr e diction Workshop , 2021, case 2: DrivAer configuration. [Online]. Av ailable: https://autocfd.org [3] ——, “Summary of the 3rd Automotiv e CFD Prediction W orkshop,” in Pro c e edings of the 3r d A utomotive CFD Pr e diction Workshop , 2022, case 2a: o ccDrivAer-type setup. [Online]. Av ailable: https://autocfd.org [4] ——, “Summary of the 4th Automotive CFD Prediction W orkshop,” in Pr o ce e dings of the 4th A utomotive CFD Pr e diction Workshop , 2024, case 2a: o ccDrivAer-type setup. [Online]. Av ailable: https://autocfd.org [5] F. C. C. Galeazzo, R. G. W eiß, S. Lesnik, H. Rusche, and A. Ruopp, “Understanding Sup erlinear Sp eedup in Current HPC Architectures,” IOP Confer ence Series: Materials Science and Engine ering , vol. 1312, no. 1, p. 012009, Aug. 2024. [6] 20th Op enF OAM Workshop Bo ok of A bstr acts . Zenodo, Nov. 2025. [Online]. Av ailable: https://doi.org/10.5281/ zenodo.18670150 [7] S. Bn´ a, G. Giaquinto, E. F adiga, T. Zanelli, and F. Bottau, “SPUMA: a minimally inv asive approach to the GPU porting of OPENFOAM ® ,” Computer Physics Communic ations , p. 110009, 2025. [8] G. Olenik, M. Ko c h, Z. Boutanios, and H. Anzt, “T ow ards a platform-portable linear algebra back end for OpenFO AM,” Me c c anic a , vol. 60, no. 6, pp. 1659–1672, 2025. [9] G. Olenik, M. Ko ch, and H. Anzt, “Inv estigating Matrix Repartitioning to Address the Over and Undersubscription Challenge for a GPU-Based CFD Solver,” in International Confer ence on High Performanc e Computing . Springer, 2025, pp. 468–479. [10] Y. Delorme, M. W asserman, A. Zameret, and Z. Ding, “A Nov el Mixed Precision Defect Correction Solv er for Heterogeneous Computing,” in High Performance Computing. ISC High Performance 2024 International Workshops - Hambur g, Germany, May 12-16, 2024, R evised Sele cte d Pap ers , ser. Lecture Notes in Computer Science, M. W eiland, S. Neuwirth, C. Kruse, and T. W einzierl, Eds., v ol. 15058. Springer, 2024, pp. 154–168. [Online]. Av ailable: https://doi.org/10.1007/978- 3- 031- 73716- 9 11 [11] R. G. W eiß, S. Lesnik, F. C. Galeazzo, A. Ruopp, and H. Rusche, “Coherent mesh representation for parallel I/O of unstructured polyhedral meshes,” The Journal of Sup er c omputing , vol. 80, no. 11, pp. 16 112–16 132, 2024. [12] S. Lesnik, G. Olenik, and M. W asserman, “1st Op enFO AM HPC c hallenge (OHC- 1): Data, scripts, and notebo oks,” Sep. 2025. [Online]. Av ailable: https: //archiv e.softwareheritage.org/swh:1:dir:d08c99b5c58d4d5a11ea866adb52602df3e857cf;origin=h ttps://github.com/ OpenFOAM- HPC- Challenge/OHC1;visit=swh:1:snp:865b6fea3884d0822e46cb ca995d6d51338cca2b;anchor=swh:1:rev: 1260c71b604c5f3455515aff54ad3e9b13a29f9b
Original Paper
Loading high-quality paper...
Comments & Academic Discussion
Loading comments...
Leave a Comment