Fast and Scalable Cellwise-Robust Ensembles for High-Dimensional Data
The analysis of high-dimensional data, common in fields such as genomics, is complicated by the presence of cellwise contamination, where individual cells rather than entire rows are corrupted. This contamination poses a significant challenge to stan…
Authors: Anthony Christidis, Jeyshinee Pynee, ee
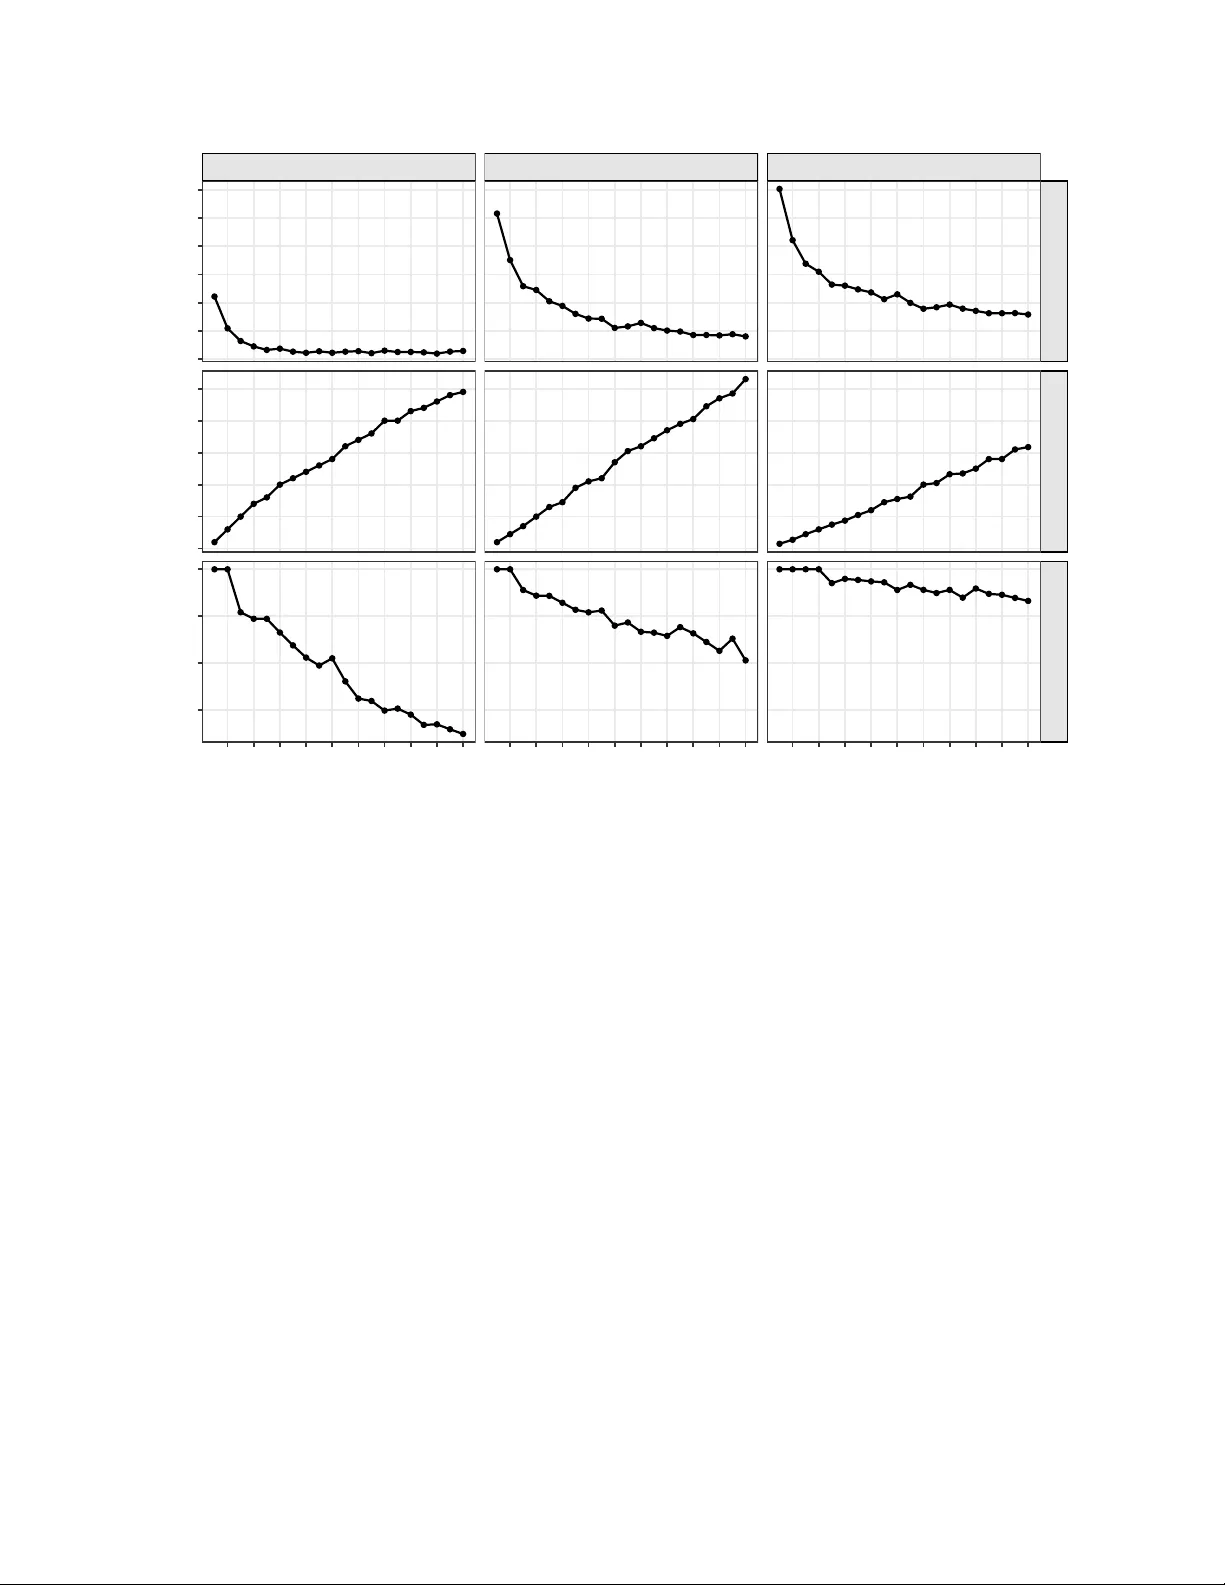
F ast and Scalable Cellwise-Robust Ensem bles for High-Dimensional Data An thony Christidis Departmen t of Statistics, Universit y of British Columbia Departmen t of Biomedical Informatics, Harv ard Medical School Jeyshinee Pyneeandee Departmen t of Statistics, Universit y of British Columbia Gabriela Cohen-F reue Departmen t of Statistics, Universit y of British Columbia Marc h 31, 2026 Abstract The analysis of high-dimensional data, common in fields such as genomics, is complicated b y the presence of cellwise contamination, where individual cells rather than entire rows are corrupted. This con tamination p oses a significan t challenge to standard v ariable selection tech- niques. While recen t ensem ble metho ds ha ve in tro duced deterministic framew orks that partition the predictor space to manage high collinearit y , these arc hitectures w ere not designed to handle cellwise con tamination, lea ving a critical methodological gap. T o bridge this gap, we propose the F ast and Scalable Cellwise-Robust Ensem ble (FSCRE) algorithm, a multi-stage framew ork in tegrating three k ey statistical stages. First, the algorithm establishes a robust foundation by deriving a cleaned data matrix and a reliable, cellwise-robust co v ariance structure. V ariable selection then pro ceeds via a comp etitiv e ensemble: a robust, correlation-based form ulation of the Least-Angle Regression (LARS) algorithm prop oses candidates for multiple sub-mo dels, and a cross-v alidation criterion arbitrates their final assignment. Despite its architectural com- plexit y , the prop osed metho d enjo ys fundamen tal theoretical guarantees, including in v ariance prop erties and local selection stabilit y . Through extensiv e sim ulations and a bioinformatics ap- plication, w e demonstrate FSCRE’s superior p erformance in v ariable selection precision, recall, and predictiv e accuracy across v arious con tamination scenarios. This work pro vides a unified framew ork connecting cellwise-robust estimation with high-performance ensem ble learning, with an implementation a v ailable on CRAN. Keywor ds: Robust Statistics; Cellwise Contamination; High-Dimensional Data; V ariable Selection; Ensem ble Learning; Correlation Outliers. 1 1 In tro duction High-dimensional data, where the num b er of predictors p far exceeds the num b er of observ ations n , is no w ubiquitous across scientific domains, from genomics and proteomics to finance and neu- roimaging. A primary goal in analyzing such data is to p erform v ariable selection: iden tifying a sparse subset of predictors that are genuinely associated with a resp onse v ariable. While numerous metho ds ha ve b een dev elop ed for this task, their fragilit y in the presence of data contamination remains a fundamental challenge. Classical metho ds, and even many mo dern techniques sp ecif- ically designed for sparse v ariable selection, can be severely compromised b y outliers, leading to unreliable mo dels and erroneous scientific conclusions. The traditional approac h to robust statistics has fo cused on casewise con tamination, where en tire observ ations (ro ws) are considered outliers (see, e.g., the ov erview in Maronna et al. , 2019 ). Ho wev er, in man y high-dimensional settings, a more insidious and realistic contamination mo del is cellwise, where only a few individual cells within the data matrix are corrupted ( Alqallaf et al. , 2009 ). These anomalies can arise from v arious sources, such as sensor malfunctions, data entry errors, or sample-sp ecific biological artifacts in “omics” data. Cellwise con tamination is particularly c hallenging as it do es not follo w a row-wise structure and can subtly distort the correlation structure of the data. As highlighted in recen t ov erviews of the field ( Ra ymaek ers and Rousseeu w , 2024b ), a small fraction of outlying cells can quickly contaminate a ma jority of the ro ws in high dimensions, rendering casewise metho ds ineffective. Moreo ver, a critical distinction, emphasized by Raymaek ers and Rousseeuw ( 2021a ), is b et ween mar ginal outliers and c orr elation outliers . While the former ma y b e detected b y examining v ariables individually , the latter are far more p ernicious: a cell’s v alue can be plausible within its own column but en tirely inconsisten t with the m ultiv ariate pattern of its row. Suc h outliers directly compromise the cov ariance structure, thereb y misleading any v ariable selection metho d that relies on it for guidance. Significan t progress has b een made in dev eloping metho ds to address cellwise con tamination for sp ecific statistical tasks. Prime examples of these adv ances include techniques for data cleaning via imputation ( Rousseeuw and Bossche , 2018 ), direct robust estimation of co v ariance matrices ( Ray- maek ers and Rousseeu w , 2024a ), and end-to-end robust sparse regression estimators designed for high dimensions ( Bottmer et al. , 2022 ; Su et al. , 2024 ). While these metho ds represen t the state- of-the-art, their reliance on complex, non-conv ex global optimization can p ose significant compu- tational c hallenges as the num b er of predictors grows. F urthermore, they are primarily designed as single-mo del estimators and do not leverage the adv antages of mo dern ensemble frameworks. 2 On a parallel trac k, ensemble frameworks ha ve emerged as a widely adopted strategy for ana- lyzing high-dimensional data. While randomization-based metho ds like Random F orest ( Breiman , 2001 ) and Random GLM ( Song et al. , 2013 ) are foundational, recent adv ances ha ve introduced deterministic, comp etitiv e frameworks that explicitly partition the predictor space among multiple sub-mo dels ( Christidis et al. , 2020 , 2025 ). These mo dern architectures are particularly effective at managing complex collinearity structures and improving predictiv e stability . How ev er, b oth classic and mo dern ensemble paradigms share a fundamental limitation: they are not designed to handle cellwise con tamination. The individual base learners can b e easily misled by corrupted cell v al- ues, and ev en recen t robust ensembles ha v e fo cused exclusiv ely on the casewise setting ( Christidis and F reue , 2026 ). Consequen tly , a significan t metho dological gap remains, as no existing metho d successfully embeds the principles of cellwise-robust estimation within a scalable, comp etitiv e par- titioning architecture for robust v ariable selection. In this pap er, we address this gap b y in tro ducing the F ast and Scalable Cellwise-Robust Ensem- ble (FSCRE) algorithm, a nov el, multi-stage arc hitecture for p erforming robust sparse regression that is designed to b e b oth computationally efficient and mo dular. It sidesteps the complexity of global optimization b y structuring the problem as an iterative comp etition. The framew ork in tegrates three k ey stages: (i) A R obust F oundation , where state-of-the-art cellwise imputation pro vides a clean data matrix from which a reliable, scalable cellwise-robust cov ariance structure is estimated. (ii) Principle d Candidate Pr op osal , where a robust, correlation-based formulation of the Least- Angle Regression (LARS) algorithm ( Efron et al. , 2004 ; Khan et al. , 2007 ) proposes candidate predictors for a set of comp eting mo dels. (iii) Pr e dictive Arbitr ation , where cross-v alidation arbitrates the comp etition, assigning the b est predictor to a single sub-mo del to form a final, disjoint ensemble. This integrated architecture results in a pro cedure for robust v ariable selection within the linear mo del, amidst the dual challenges of high-dimensionalit y and structured, cellwise contamination. The prop osed framew ork is v alidated b oth theoretically and empirically . W e establish its theoretical rigor b y proving key inv ariance prop erties, by formally analyzing its computational complexity , and by sho wing that its selection decisions are lo cally stable with resp ect to p erturbations of the robust foundation. This is complemented by comprehensive simulations and a bioinformatics data application, demonstrating state-of-the-art p erformance in b oth v ariable selection and prediction. 3 The remainder of this pap er is organized as follows. Section 2 provides a detailed review of the relev an t literature. Section 3 presents the metho dology of the FSCRE algorithm. In Section 4 , w e establish theoretical prop erties of the algorithm, including in v ariance guarantees, a computational complexit y b ound, and a lo cal selection stability result. Section 5 contains an extensive simulation study comparing FSCRE to state-of-the-art competitors. In Section 6 , we demonstrate the practical utilit y of our metho d on a bioinformatics data application. Finally , Section 7 concludes with a summary and discussion of future work. 2 Bac kground and Literature Review Addressing the formidable challenge of sparse regression in the p ≫ n setting under cellwise con tamination fundamentally requires tools from b oth robust and high-dimensional statistics. This section reviews k ey developmen ts across these fields, alongside adv ances in ensemble metho ds, to rev eal the specific metho dological gap our prop osed framework addresses. 2.1 Regression under Cellwise Con tamination W e consider the standard high-dimensional linear regression mo del, whic h is assumed to hold for the latent, unobserv ed clean data: y ∗ = X ∗ β + ε where y ∗ is the n × 1 true resp onse v ector, X ∗ is the n × p matrix of true predictors, β is the p × 1 vector of unknown co efficien ts, and ε is the n × 1 v ector of random errors. W e op erate in the c hallenging p ≫ n setting, where the true co efficien t vector β is assumed to b e sparse. The dual goals are to accurately identify the supp ort of β (v ariable selection) and to ac hiev e high predictiv e accuracy from the observed, contaminated data, all while maintaining computational efficiency . This task is significan tly complicated by the presence of cellwise contamination ( Alqallaf et al. , 2009 ). Instead of observing the true data matrix [ y ∗ , X ∗ ], we observ e a contaminated v ersion [ y , X ] where individual cells are corrupted. This pro cess can b e formally mo deled for the predictors as: X = ( 1 np − B X ) ⊙ X ∗ + B X ⊙ Z X where ⊙ denotes the element-wise Hadamard pro duct. Here, B X is an n × p binary matrix of con tamination indicators, whose en tries are often modeled as i.i.d. Bernoulli( δ X ) random v ariables, 4 and Z X is an n × p matrix of arbitrary , p oten tially adversarial, outlying v alues. Similarly , the resp onse vector is con taminated according to: y = ( 1 n − b y ) ⊙ y ∗ + b y ⊙ z y where b y is an n × 1 binary v ector with en tries often mo deled as i.i.d. Bernoulli( δ y ) and z y is a vector of arbitrary con taminating v alues. Under this framew ork, the arbitrary v alues in Z X can manifest as either marginal or correlation outliers ( Ra ymaekers and Rousseeuw , 2021a ). While marginal outliers p ossess extreme univ ariate magnitudes, correlation outliers are sp ecifically structured to distort the co v ariance matrix while remaining univ ariately plausible. Consequen tly , even a sparse con tamination matrix B X can severely mislead v ariable selection algorithms that rely on standard empirical cov ariance structures. 2.2 Cellwise-Robust Metho dologies In resp onse to the problem outlined in Section 2.1 , a rich literature has developed metho ds for robust estimation and regression. F oundational w ork has addressed the problem of data cle aning and r obust c ovarianc e estimation . The Detect Deviating Cells (DDC) algorithm ( Rousseeuw and Bossc he , 2018 ) is a cornerstone of the data cleaning paradigm, and its scalability is enabled by fast, transformation-based robust correlation estimators ( Raymaek ers and Rousseeuw , 2021b ). In parallel, direct robust estimation of cov ariance and precision matrices has b een a ma jor fo cus, with metho ds evolving from the tw o-step generalized S-estimator ( Agostinelli et al. , 2015 ) to the recen t cellwise MCD estimator ( Raymaek ers and Rousseeu w , 2024a ), with many ideas extended to the high-dimensional setting ( T arr et al. , 2016 ; Loh and T an , 2018 ; P acreau and Lounici , 2023 ). Building up on these concepts, a parallel trac k has developed end-to-end c el lwise-r obust r e- gr ession metho ds. In the low er-dimensional setting, prominent approaches include the Sho oting S-estimator ( ¨ Ollerer et al. , 2016 ) and the Cellwise Robust M-regression (CRM) ( Filzmoser et al. , 2020 ), the latter of whic h emplo ys SP ADIMO ( Debruyne et al. , 2019 ) to iden tify con taminated cells. F or the sparse, high-dimensional setting, key estimators include Sparse Sho oting S ( Bottmer et al. , 2022 ) and CR-Lasso ( Su et al. , 2024 ). While these metho ds represen t the current state-of-the-art, they are single-mo del estimators that rely on complex, non-conv ex optimization strategies. 5 2.3 Ensem ble Metho ds and the Unaddressed Metho dological Gap Separate from the developmen ts in robust statistics, ensem ble framew orks ha ve emerged as a highly effectiv e to ol for analyzing high-dimensional data, primarily due to their abilit y to impro ve pre- dictiv e accuracy and manage complex collinearity structures. The landscap e of such ensembles is div erse, spanning: (i) r andomization-b ase d metho ds , such as Random F orest ( Breiman , 2001 ) and Random GLM ( Song et al. , 2013 ); (ii) gr adient b o osting algorithms , like XGBoost ( Chen and Guestrin , 2016 ); and (iii) deterministic, c omp etitive fr ameworks , whic h partition the predictor space among multiple mo dels through a structured optimization pro cess ( Christidis et al. , 2020 , 2025 ). Among these, the comp etitiv e partitioning architecture is particularly adept at managing complex collinearit y structures, a common c hallenge in high-dimensional v ariable selection. Ho wev er, these approaches share a fundamental limitation. Despite their structural differences, existing ensemble framew orks are not designed to handle cellwise con tamination. Ev en recent adv ances in robust ensembles hav e fo cused exclusiv ely on the casewise setting ( Christidis and F reue , 2026 ), leaving a significant metho dological gap in the curren t literature. Addressing this gap requires integrating the principles of cellwise-robust estimation into a scalable and comp etitiv e ensem ble framework. This in tegration can b e achiev ed b y embedding a computationally efficien t v ariable selection engine into a comp etitiv e framework. The LARS algorithm ( Efron et al. , 2004 ) pro vides an ideal foundation for this engine; its correlation-based formulation is not only easily robustifiable but also highly efficient, as it op erates entirely in the lo wer-dimensional correlation space ( Khan et al. , 2007 ). By embedding this robust LARS engine within a framework that partitions the predictor space through a sequence of lo cally-optimal decisions, it is p ossible to create a metho d that is b oth cellwise-robust and computationally tractable, while p ossessing attractive theoretical prop erties suc h as inv ariance to the data’s represen tation. T o date, how ever, a metho dology that formally in tegrates these components for cellwise-robust v ariable selection is lac king. 3 The F ast and Scalable Cellwise-Robust Ensem ble Algorithm This section details the metho dology of the F ast and Scalable Cellwise-Robust Ensemble (FSCRE) algorithm. As outlined in the introduction, FSCRE provides a framew ork for robust v ariable selec- tion and regression in high-dimensional settings under cellwise contamination. The arc hitecture is designed to b e b oth computationally efficien t and mo dular, structuring the v ariable selection prob- 6 lem as an iterative comp etition rather than a single, complex global optimization. The pro cedure unfolds in three key stages, whic h w e detail below. 3.1 Robust F oundation The first stage of the FSCRE architecture establishes a robust foundation for the subsequent v ariable selection pro cess. Given an observ ed, p oten tially contaminated data matrix [ y , X ], the framew ork requires a reliable mapping from this contaminated space to tw o essential outputs: a cleaned data matrix and a robust correlation structure. Imp ortan tly , this stage is designed to b e highly mo dular; it can incorp orate any adv anced cellwise-robust imputation and co v ariance estimation metho d. T o achiev e this efficien tly in our implementation, w e adopt a t wo-step approac h, first isolating and correcting cellwise errors b efore applying classical estimators. In the detection phase, producing the cleaned data matrix relies on an imputation algorithm that is scalable and free from strict distributional assumptions. W e fulfill these requiremen ts b y forming the join t data matrix Z = [ y , X ] and applying the Detect Deviating Cells (DDC) algorithm ( Rousseeu w and Bossche , 2018 ). T o ov ercome the O ( np 2 ) computational b ottlenec k of the original DDC pro cedure, w e leverage the scalable metho dology of Ra ymaekers and Rousseeuw ( 2021b ). This utilizes fast appro ximate nearest-neigh b or algorithms on transformed data to reduce the complexit y to O ( np log( p )), yielding the first required output, a cleaned matrix Z imp = [ y imp , X imp ], efficiently in high-dimensional regimes. In the analysis phase, w e derive t he correlation structures directly from Z imp . While sp ecialized robust estimators like the wrapping metho d ( Raymaek ers and Rousseeu w , 2021b ) are highly effec- tiv e, they are primarily designed for handling uncleaned con taminated data. Because the preceding DDC step already neutralized the outlying cells, we compute the standard sample correlation on the cleaned matrix. This strategy main tains the initial robustness and guaran tees a p ositiv e semi- definite correlation matrix. This stage outputs the p × p sample correlation matrix of the imputed predictors, R X , and the p -dimensional predictor-resp onse sample correlation vector, r y . These three outputs, sp ecifically the imputed matrix Z imp alongside the t w o correlation struc- tures R X and r y , serv e as the sole inputs for the comp etitiv e selection engine describ ed next. As noted, the FSCRE arc hitecture allo ws for different robust estimators to b e used in this stage; ho wev er, any chosen imputation mo dule m ust satisfy sp ecific equiv ariance prop erties, as our DDC implemen tation does, to ensure that the o verall pro cedure inherits the formal theoretical guaran tees established later in Section 4 . 7 3.2 The Robust LARS Candidate Prop oser The engine for prop osing v ariables within the FSCRE framew ork is a robust v ersion of the LARS algorithm ( Efron et al. , 2004 ). The classical LARS pro cedure op erates in the n -dimensional data space, requiring costly computations inv olving the full data matrix at every step. W e instead lev erage the computationally efficien t, correlation-based form ulation detailed by Khan et al. ( 2007 ). This formulation allows the LARS v ariable entry path to b e determined analytically , op erating exclusiv ely on the p -dimensional correlation structures deriv ed in Section 3.1 . By replacing a recurring O ( np ) op eration with muc h faster operations that are indep enden t of n , this approach is fundamen tal to the algorithm’s scalability , particularly in the p ≫ n regime. F urthermore, this form ulation is inheren tly mo dular, as any robust correlation matrix can serve as its input. F or any giv en sub-mo del k , the prop oser’s ob jective is to identify the next predictor that would join the LARS path from the p o ol of curren tly av ailable predictors. This candidate is the inactive predictor that first satisfies the equiangular condition with the current active set. The pro cedure, whic h we term the Robust LARS Prop oser, is detailed in Algorithm 1 . It tak es as input the global robust correlation matrix R X , the set of globally av ailable predictors V , and the sub-mo del’s curren t state (its active set S k , sign v ector s k , and dynamic correlation v ector r ( k ) ). The core of this procedure is a search for the minimum step size γ along the curren t equiangular direction. Given the active set S k , its sign v ector s k , and the maximal activ e correlation r A , the geometric quantities defining the equiangular direction are first computed: w k = a k ( D k R S k D k ) − 1 1 | S k | and a k = 1 ⊤ | S k | ( D k R S k D k ) − 1 1 | S k | − 1 / 2 where R S k is the submatrix of R X for the indices in S k , and D k = diag( s k ). F or every a v ailable predictor j ∈ V , we then calculate its correlation with this direction, a j = ( D k r j,S k ) ⊤ w k , where r j,S k con tains the correlations betw een predictor j and the activ e predictors. The step sizes required for predictor j to join the activ e set are then: γ + j = r A − r ( k ) j a k − a j and γ − j = r A + r ( k ) j a k + a j The candidate predictor, j ∗ k , is the one corresp onding to the minim um p ositiv e step size, γ ∗ k = min j ∈ V { γ + j , γ − j } . These computations are detailed in Algorithm 1 . 8 Algorithm 1 Robust LARS Candidate Prop oser Input: Global correlation matrix R X ; Sub-mo del state ( S k , s k , r ( k ) ); Set of a v ailable predictors V . Initialize: Candidate predictor index j ∗ k , step size γ ∗ k , and inner pro ducts { a j } j ∈ V . 1: if S k = ∅ then 2: j ∗ k ← arg max j ∈ V | r ( k ) j | ; γ ∗ k ← | r ( k ) j ∗ k | ; a j ← sign( r ( k ) j ∗ k ) · [ R X ] j, j ∗ k for all j ∈ V . 3: return ( j ∗ k , γ ∗ k , { a j } j ∈ V ). 4: Let r A ← | r ( k ) j | for an y j ∈ S k . ▷ Current correlation of the active set. 5: Let R S k b e the submatrix of R X for indices in S k , and D k ← diag( s k ). 6: Compute a k and w k based on the active set S k . 7: Initialize γ ∗ k ← ∞ , j ∗ k ← n ull. 8: for eac h predictor j ∈ V do ▷ Search only ov er globally av ailable predictors. 9: Let r j,S k b e the vector of correlations betw een predictor j and predictors in S k . 10: Compute and store a j ← ( D k r j,S k ) ⊤ w k . 11: Compute p ositiv e step sizes γ + j and γ − j (set to ∞ if denominator is non-p ositiv e). 12: γ j ← min( γ + j , γ − j ). 13: if γ j < γ ∗ k then 14: γ ∗ k ← γ j ; j ∗ k ← j . 15: return ( j ∗ k , γ ∗ k , { a j } j ∈ V ). 3.3 Predictiv e Arbitration and Final Mo del Fitting The final stage of the FSCRE algorithm embeds the Robust LARS Prop oser (Algorithm 1 ) within a comp etitiv e ensemble framew ork that partitions the predictor space. This architecture is based on a hybrid “prop oser-arbiter” mec hanism. The Robust LARS Prop oser serves as the principled candidate generator, leveraging its computational efficiency and geometric prop erties. A cross- v alidation criterion then serv es as the data-driv en arbiter, ensuring that v ariable selection is guided b y out-of-sample predictiv e p erformance. The main comp etitiv e pro cedure is detailed in Algorithm 2 . A t each iteration, the algorithm calls the Robust LARS Prop oser for each of the K sub-mo dels to generate a set of candidate prop osal tuples, ( j, k ). T o arbitrate this comp etition, the predictive b enefit of eac h p oten tial mo ve is ev aluated using v -fold cross-v alidation with a least-squares (LS) fit on the imputed data, [ y imp , X imp ]. The use of LS here is a pragmatic choice to maintain computational tractabilit y within the highly iterative lo op. The single candidate tuple that offers the greatest reduction in prediction error wins the comp etition. The algorithm terminates when the maximum relative b enefit falls b elo w a pre-sp ecified tolerance τ . Once the selection pro cedure partitioned the predictors into disjoint sets S 1 , . . . , S K , a final robust mo del is fit for each sub-mo del. This t w o-tiered approach to robustness is a delib erate 9 Algorithm 2 The FSCRE Comp etitiv e Selection F ramework Input: Imputed data [ y imp , X imp ]; Robust correlations ( r y , R X ); Number of mo dels K ; T oler- ance τ . Initialize: Initialize activ e sets S k ← ∅ and sign v ectors s k ← ∅ , for k = 1 , . . . , K . Initialize mo del-sp ecific correlation states r ( k ) ← r y , for k = 1 , . . . , K . Initialize av ailable predictor indices V ← { 1 , . . . , p } . 1: do 2: Let C ← ∅ . ▷ Initialize the set of prop osals for this iteration. 3: for k = 1 , . . . , K do 4: ( j ∗ k , γ ∗ k , { a ( k ) j } ) ← RobustLARSProposer( R X , S k , s k , r ( k ) , V ). 5: if j ∗ k = n ull then 6: B ( j ∗ k , k ) ← CV-Error( S k ) − CV-Error( S k ∪ { j ∗ k } ). 7: Add ( B ( j ∗ k , k ) , j ∗ k , γ ∗ k , { a ( k ) j } , k ) to C . 8: if C = ∅ then 9: break 10: ( B win , j win , γ ∗ win , { a win j } , k win ) ← arg max ( B ,j,γ , { a } ,k ) ∈ C B . ▷ Break ties randomly . 11: E k win ← CV-Error( S k win ). 12: if B win > 0 and B win / E k win > τ then 13: Assign Winner and Up date State: 14: Add j win to S k win and its corresp onding sign to s k win . 15: V ← V \ { j win } . ▷ Remov e winner from global p o ol. 16: r ( k win ) j ← r ( k win ) j − γ ∗ win · a win j , for all j ∈ V . ▷ Up date correlation state. 17: else 18: Set B win ← 0. ▷ Signal termination. 19: while B win > 0 and V = ∅ 20: return The disjoint predictor sets S 1 , . . . , S K . design choice that balances computational sp eed with statistical reliability: w e use fast LS during the iterative selection pro cess and a robust estimator for the final mo del fit. F or each sub-mo del k , we fit a robust MM-estimator ( Y ohai , 1987 ) on the data [ y imp , X imp ,S k ]. This step requires that p k = | S k | < n , a condition that is not a practical limitation in sparse settings. The final prediction for a new observ ation is the a verage of the predictions from these K robustly fitted mo dels. The n um b er of mo dels, K , is a key tuning parameter con trolling the ensem ble’s complexity . Increasing K partitions distinct groups of correlated predictors in to different sub-mo dels, reducing the selection bias of a single greedy mo del. Because the resulting sub-mo dels ha ve disjoin t predictor sets, their errors are less correlated, making aggregation effectiv e at reducing ov erall prediction v ariance ( Ueda and Nak ano , 1996 ). While an excessively large K could b e detrimental, v alues from 5 to 10 typically provide a near-optimal balance, as demonstrated by a sensitivity analysis of prediction accuracy and v ariable selection provided in App endix A. 10 4 Theoretical Prop erties and Complexit y In this section w e establish k ey properties of the FSCRE algorithm. Although the complexit y of the full pro cedure precludes a full analysis of its statistical risk, we derive inv ariance and equiv ariance prop erties, a computational complexity b ound, and a local selection stability result with resp ect to the robust foundation. T ogether these results provide a principled theoretical underpinning for the metho d. 4.1 In v ariance and Equiv ariance Prop erties A well-designed statistical algorithm should pro duce results that are indep enden t of arbitrary c hoices in data represen tation. W e formally state several k ey in v ariance and equiv ariance p rop erties of the FSCRE algorithm. These results dep end on the specific equiv ariance prop erties of the c hosen imputation and correlation mo dules. W e assume throughout that the implementation utilizes an affine-equiv arian t imputation metho d, suc h as DDC, follow ed by the standard sample correlation. F ormal pro ofs are deferred to App endix B. Prop osition 1 (General Affine Inv ariance) . The set of sele cte d pr e dictor indic es r eturne d by the FSCRE algorithm is invariant to p er-c olumn affine tr ansformations o f the observe d data matrix [ y , X ] . The affine in v ariance of the FSCRE framew ork is a direct consequence of the equiv ariant nature of its underlying comp onen ts. Provided the imputation pro cedure is equiv ariant to affine transfor- mations of the data columns, as is the case with our DDC implementation, the sample correlations computed on the imputed data are inheren tly inv ariant to these original transformations. Since the en tire selection pro cess, from the LARS propos als to the CV arbitration, op erates exclusively on these in v arian t structures, the final set of selected v ariables remains unc hanged. Prop osition 2 (Perm utation Equiv ariance) . The FSCRE algorithm is e quivariant with r esp e ct to p ermutations of the pr e dictor c olumns. L et π b e a p ermutation of the indic es { 1 , . . . , p } . If E = { S 1 , . . . , S K } is the ensemble r eturne d for X , then the ensemble r eturne d for the p ermute d matrix X π is { π ( S σ (1) ) , . . . , π ( S σ ( K ) ) } for some p ermutation σ of the mo del indic es. This prop ert y is guaranteed by the symmetric treatment of all predictors throughout the algo- rithm. Both the cellwise imputation and the sample correlation computation are strictly equiv arian t 11 to column p erm utations. By breaking an y ties for the winning candidate uniformly at random dur- ing the comp etition stage, we ensure no implicit bias is introduced by a v ariable’s initial p osition in the data matrix, th us preserving the symmetry of the entire architecture. Prop osition 3 (In tercept In v ariance) . The sele ction of pr e dictor variables by the FSCRE algorithm is invariant to the inclusion of an inter c ept term in its internal r e gr ession mo dels. This in v ariance holds b ecause the core selection mec hanics op erate on ce n tered quan tities. Correlation is, by definition, inv ariant to shifting. The LARS engine op erates on correlations with residuals, and the CV error is calculated from these same residuals. In a mo del with an in tercept, these residuals are mean-centered by construction, so explicitly including one do es not alter the selection sequence. 4.2 Computational Complexit y A key feature of the FSCRE algorithm is its computational scalabilit y . W e formally analyze its complexity , whic h is primarily determined by the one-time pre-computation phase and the subsequen t iterative selection lo op. Prop osition 4 (Computational Complexit y) . L et n b e the numb er of observations, p the numb er of pr e dictors, K the numb er of ensemble mo dels, and k max the total numb er of sele cte d variables. In the typic al p ≫ n sp arse setting, the c omputational c omplexity of the FSCRE fr amework is: O np 2 + k max · K · p ¯ s wher e ¯ s is the aver age sub-mo del size. The first term c orr esp onds to the c omputation of the sample c orr elation matrix on the impute d data, and the se c ond term governs the iter ative sele ction lo op. The dominant first term, O ( np 2 ), corresp onds to the computation of the full p × p sample correlation matrix on the DDC-imputed data, and represen ts the theoretical b ottlenec k of the pre- computation phase. While quadratic in p , this op eration reduces to a dense matrix pro duct, an op eration that is hea vily optimized in mo dern numerical linear algebra libraries suc h as BLAS. Consequen tly , despite the quadratic dep endence on p , this step is fast in practice even for large p , as confirmed by the empirical timing results in Section 5 . W e note that this b ound can in principle b e reduced to O ( np log( p )) by replacing the sample correlation with the fast wrapping estimator of Ra ymaekers and Rousseeuw ( 2021b ), combined with their scalable DDC implementation; how ever, 12 w e delib erately opted for the sample correlation on imputed data as it prov ed more accurate in our in vestigations, and its practical cost remains highly manageable. The second term, O ( k max · K · p ¯ s ), gov erns the iterativ e selection lo op. At eac h of the k max iterations, the Robust LARS Prop oser is called once p er sub-model at cost O ( p ¯ s ), arising from searc hing ov er the av ailable predictors with an active set of av erage size ¯ s . The v -fold cross- v alidation step contributes an additional p er-iteration cost of O ( K · v · n · ¯ s 2 ); in the t ypical p ≫ n sparse regime where ¯ s is small, this is dominated by the O ( K · p ¯ s ) prop osal cost and do es not alter the ov erall leading term. The final MM-fits add a negligible cost of O ( K · n · ¯ s 2 ), indep enden t of p . A detailed deriv ation of the complexit y is provided in App endix C, and the practical sp eed of our implemen tation is demonstrated empirically in Section 5 . 4.3 Lo cal Selection Stabilit y The FSCRE pro cedure dep ends on the robust foundation only through three ob jects: the predictor- predictor correlation matrix, the predictor-resp onse correlation v ector, and the imputed data ma- trix. Let T = ( R X , r y , Z imp ) denote this triple, and write E ( T ) = { S 1 ( T ) , . . . , S K ( T ) } for the ensem ble returned b y Algorithm 2 when run on T with fixed K and tolerance τ > 0. W e are interested in the b eha viour of E ( T ) under small p erturbations of T around a fixed reference triple ˜ T = ( ˜ R X , ˜ r y , ˜ Z imp ). T o formalize this, we imp ose a mild generic-p osition condition at ˜ T . When Algorithms 1 – 2 are run on ˜ T , all internal regression problems in the cross-v alidation step are well p osed, and all selection and stopping comparisons used by the algorithm are strict, so there are no exact ties or b oundary cases. This condition, required by the following prop osition, is stated in more detail in App endix D. Prop osition 5 (Lo cal Selection Stability) . Fix K and τ > 0 , and supp ose the r efer enc e triple ˜ T = ( ˜ R X , ˜ r y , ˜ Z imp ) satisfies the generic-p osition c ondition describ e d ab ove. Then ther e exists η > 0 such that, for any triple T = ( R X , r y , Z imp ) with ∥ R X − ˜ R X ∥ + ∥ r y − ˜ r y ∥ + ∥ Z imp − ˜ Z imp ∥ < η , the FSCRE algorithm run on T makes exactly the same de cisions as when run on ˜ T . In p articular, the final ensembles c oincide: E ( T ) = E ( ˜ T ) . The pro of is pro vided in App endix D. Prop osition 5 shows that FSCRE is lo cally constant as a 13 function of its robust foundation: once the imputed data and correlation structure are determined up to a small p erturbation, the selected ensem ble remains unc hanged. In particular, the m ulti-stage comp etitiv e architecture do es not amplify small errors in the robust foundation in to qualitativ ely differen t mo dels. 5 Sim ulation Study T o v alidate the p erformance of the FSCRE algorithm, we conducted a comprehensive simulation study designed to mimic challenging high-dimensional regression scenarios. The study ev aluates the metho d’s v ariable selection accuracy and predictive p erformance against a suite of state-of- the-art comp etitors and baseline metho ds across a v ariety of contamination settings, ranging from classical casewise outliers to sophisticated structured cellwise mo dels that distort the correlation structure. F urthermore, to explicitly verify our theoretical claims regarding scalabilit y , we include a dedicated empirical timing study to demonstrate the algorithm’s computational efficiency as both the sample size and the num b er of predictors increase. 5.1 Data Generation and Con tamination Mo dels W e generate data from the linear mo del y = X β + ε with n = 50 and p = 500. The rows of the clean design matrix X are drawn from N p ( 0 , Σ ). T o mo del complex collinearit y , Σ has a blo c k-diagonal structure: activ e predictors are group ed in blo c ks of size 25 with correlation ρ = 0 . 8, while the bac kground correlation is ρ 0 = 0 . 2. The co efficien t vector β is sparse, with ∥ β ∥ 0 ∈ { 50 , 100 , 200 } non-zero entries drawn uniformly from [0 , 5] with random signs. The error ε is scaled to achiev e a target SNR ∈ { 0 . 5 , 1 , 2 } . W e examine five contamination mec hanisms, with C denoting the set of con taminated indices and α the contamination prop ortion. 1. Casewise: A prop ortion α ∈ { 0 . 1 , 0 . 2 } of ro ws i ∈ C are replaced b y high-lev erage outliers x i ∼ N p ( 0 , 0 . 1 I ) + c u , where u is the smallest eigenv ector of Σ and c = 2. The resp onse is y i = x ⊤ i β cont , where β cont distorts active co efficien ts b y a factor of 100. 2. Cellwise Marginal: A random subset of cells ( i, j ) ∈ C with prop ortion α ∈ { 0 . 05 , 0 . 1 } are replaced by x ij ∼ N ( µ ′ , 1) with µ ′ = 10, a large shift from the clean mean. 3. Cellwise Correlation: This structured scenario targets the cov ariance matrix. F or a con- taminated row i , a subset of cells J (ov erall prop ortion α ∈ { 0 . 05 , 0 . 1 } ) is selected. Let 14 Σ J b e the submatrix for these cells and v min its eigenv ector corresp onding to the smallest eigen v alue. Cells are replaced by x i,J = γ p | J | v min with γ = 3. This aligns con tamination with the direction of least v ariation, masking it from univ ariate filters. 4. Mixture Scenarios: W e consider Mixtur e Mar ginal and Mixtur e Corr elation , where a frac- tion α 1 = 0 . 1 of ro ws are casewise contaminated, and the remainder are sub ject to cellwise con tamination at rate α 2 = 0 . 05. 5.2 Metho ds W e compare the performance of FSCRE against a comprehensive suite of baseline and state-of-the- art metho ds. T o isolate the effects of data cleaning, ensem ble arc hitecture, and robust estimation, the comp etitors are organized as follo ws: • Prop osed F ramew ork: W e ev aluate the full FSCRE algorithm ( K = 10) alongside a single-mo del v ariant, Robust LARS (RLARS) ( K = 1), implemen ted in our srlars pac k age av ailable on CRAN ( Christidis and Cohen-F reue , 2026 ). This comparison isolates the sp ecific p erformance gains attributable to the comp etitiv e partitioning architecture. • DDC-Augmented Baselines: T o contrast our integrated arc hitecture with standard tw o- step sequential pip elines, we include DDC-EN (standard Elastic Net applied to DDC- imputed data) and DDC-RGLM (Random GLM applied to imputed data). W e use the cellWise pac k age ( Raymaek ers and Rousseeuw , 2026 ) for DDC, glmnet ( F riedman et al. , 2010 ) for the elastic net, and randomGLM ( Song and Langfelder , 2022 ) for the ensem ble. The latter serves as a strong benchmark, representing a generic cellwise-robustified ensemble. • Sparse and Cellwise-Robust Estimators: W e compare against leading purp ose-built metho ds using their authors’ implementations: the iterativ e Sparse Sho oting S (Sparse- S) estimator ( Bottmer et al. , 2022 ) and the regularization-based CR-Lasso ( Su et al. , 2024 ). • Non-Robust Baseline: The standard Elastic Net (EN) , implemen ted in glmnet , is included to quan tify the impact of con tamination on non-robust metho ds. All metho ds utilizing DDC employ ed the scalable fast DDC implemen tation a v ailable in cellWise . T uning parameters w ere selected using standard cross-v alidation pro cedures pro vided by their re- sp ectiv e pack ages. 15 F or scenarios in volving pure casewise contamination, we additionally include sparse least- trimmed squared ( SparseL TS ) ( Alfons et al. , 2013 ), implemented in robustHD ( Alfons , 2021 ), and the adaptiv e p enalized elastic net S-estimator ( PENSE ) estimator ( Kepplinger , 2023 ), imple- men ted in pense ( Kepplinger et al. , 2026 ). These metho ds serve as gold-standard b enc hmarks for casewise outliers; ho w ever, they are excluded from the cellwise and mixture scenarios due to their inheren t lac k of theoretical robustness to cellwise con tamination and their prohibitive computa- tional cost in such settings. 5.3 P erformance Measures W e ev aluate estimator p erformance using four metrics, a veraged o v er N = 50 simulation runs. 1. Mean Squared Prediction Error (MSPE): Computed on an indep enden t, uncontam- inated test set of size m = 5 , 000. F or test resp onse vector y test and prediction ˆ y test , MSPE = ∥ ˆ y test − y test ∥ 2 2 /m . 2. Recall (RC): The prop ortion of true activ e co efficien ts correctly iden tified as non-zero. Let A = { j : β j = 0 } be the true active set and ˆ A = { j : ˆ β j = 0 } be the selected set. Then Recall = | ˆ A ∩ A| / |A| . 3. Precision (PR): The prop ortion of selected co efficien ts that are truly active, defined as Precision = | ˆ A ∩ A| / | ˆ A| . High precision indicates effectiv e control of false discov eries. 4. Computation Time (CPU): The av erage time in seconds to fit the mo del, serving as empirical v alidation of scalability . Note that v ariable selection metrics (RC and PR) are not rep orted for DDC-RGLM; b ecause this sp ecific baseline uses an ensemble of 100 randomly seeded mo dels, it trivially selects nearly all v ariables across the ensemble, rendering selection metrics uninformative. 5.4 Results The simulation grid encompasses a wide arra y of configurations across v arious con tamination pro- p ortions, sparsity levels, and signal-to-noise ratios. T o synthesize these results robustly , we first computed av erage relativ e ranks, providing a summary of o verall p erformance stabilit y . As detailed in T able 1 for the cellwise and mixture scenarios, the prop osed FSCRE framework consisten tly achiev ed the top rank (1.0 to 1.2) for predictive accuracy (MSPE) while maintaining a 16 highly competitive balance of recall and precision. By con trast, the single-mo del robust estimators, Sparse-S and CR-Lasso, yielded consistently p oor MSPE rankings. This degradation highlights a known vulnerability of non-conv ex global optimization in high dimensions: when confron ted with severe blo c k-collinearity and structured con tamination, highly irregular optimization surfaces frequen tly preven t conv ergence to a generalizable minimum, yielding high-v ariance predictions. T able 1: Average relative ranks of the ev aluated metho ds across all cellwise and mixture contami- nation scenarios. A rank of 1 indicates the b est p erformance among the seven metho ds. The top t wo p erforming metho ds in each column are highlighted in b old. Cellwise Marginal Cellwise Correlation Mixture Marginal Mixture Correlation Metho d MSPE RC PR MSPE RC PR MSPE RC PR MSPE RC PR EN 4.7 5.1 5.6 3.6 3.2 4.6 5.0 5.8 6.0 4.8 5.6 4.8 DDC-EN 3.1 3.1 4.7 3.7 3.8 5.4 2.4 3.4 4.2 2.3 3.6 4.7 DDC-R GLM 1.9 – – 1.8 – – 3.1 – – 3.1 – – Sparse-S 6.8 1.7 1.1 6.7 1.6 1.2 6.3 1.8 1.1 6.3 1.4 1.0 CR-Lasso 6.2 3.9 4.7 6.3 5.0 4.9 6.7 3.6 4.8 6.7 3.4 5.4 RLARS 4.2 5.9 1.9 4.7 6.0 1.8 3.4 5.2 1.9 3.8 5.4 2.0 FSCRE 1.1 1.3 3.0 1.2 1.4 3.0 1.0 1.2 3.0 1.0 1.6 3.1 T o visualize absolute p erformance, Figure 1 details the MSPE distribution for the top com- p etitiv e metho dologies under a representativ e Mixtur e Corr elation scenario. Because MSPE is scaled b y the noise v ariance, the theoretical low er b ound is 1.0. Across v arying SNRs and sparsit y lev els, FSCRE consistently demonstrates the low est median prediction error, tigh tly approaching this b ound using only K = 10 deterministic sub-mo dels. This sup erior accuracy stems directly from its v ariable selection prop erties (Figure 2 ). Comparing FSCRE strictly against the DDC-EN pip eline highligh ts the fundamental adv antage of comp etitiv e partitioning. By forcing candidate v ariables to comp ete across disjoin t sub-mo dels, FSCRE effectiv ely regularizes against false discov- eries to yield substan tially higher precision, while simultaneously av oiding the extreme greediness of standard p enalized metho ds to achiev e higher recall. Finally , to ensure that the capacity to handle cellwise outliers does not compromise baseline p erformance, we ev aluated the metho ds on uncon taminated data and pure casewise con tamination (T able 2 ). FSCRE ranked first in MSPE on clean data, indicating that its m ulti-mo del selec- tion strategy inherently b enefits predictiv e accuracy even without con tamination. Under casewise con tamination, we b enc hmark ed the framework against PENSE and SparseL TS, the established gold-standards for ro w-wise outliers. FSCRE remained highly comp etitiv e, slightly outp erforming PENSE in av erage MSPE rank (1.2 v ersus 1.9) and precision, while maintaining strong recall. 17 Low Signal (SNR = 0.5) Moderate Signal (SNR = 1.0) High Signal (SNR = 2.0) 50 100 200 50 100 200 50 100 200 1.0 1.5 2.0 2.5 3.0 Number of Active Predictors MSPE DDC−EN DDC−RGLM FSCRE Figure 1: MSPE across 50 splits for the Mixtur e Corr elation scenario. Performance is ev aluated across three SNRs and three sparsit y levels. Because the error is scaled b y the noise v ariance, the optimal p ossible MSPE is 1.0. Low Signal (SNR = 0.5) Moderate Signal (SNR = 1.0) High Signal (SNR = 2.0) Recall Precision 50 100 200 50 100 200 50 100 200 0.0 0.2 0.4 0.6 0.00 0.25 0.50 0.75 1.00 Number of Active Predictors DDC−EN FSCRE Figure 2: Recall (top row) and precision (b ottom row) across 50 splits for the Mixtur e Corr elation scenario, comparing the DDC-EN pip eline with the prop osed FSCRE algorithm. This shows that FSCRE pro vides state-of-the-art protection against insidious cellwise structures without sacrificing reliabilit y in clean or traditionally contaminated settings. 18 T able 2: Average relative ranks of the ev aluated metho ds for the uncontaminated (Clean) and pure Casewise con tamination scenarios. A rank of 1 indicates the b est performance among the nine metho ds. The top tw o p erforming metho ds in eac h column are highlighted in b old. Clean Data Casewise Metho d MSPE R C PR MSPE R C PR EN 5.6 6.2 4.3 6.6 7.6 5.4 DDC-EN 3.4 4.2 6.3 3.8 4.7 5.4 DDC-R GLM 2.7 – – 5.1 – – Sparse-S 8.4 2.3 1.0 8.4 2.2 1.1 CR-Lasso 8.6 5.1 6.2 8.6 4.6 6.7 SparseL TS 6.9 6.4 8.0 4.6 5.7 7.9 PENSE 3.3 1.3 4.8 1.9 1.4 4.6 RLARS 5.1 8.0 2.0 4.8 7.4 2.0 FSCRE 1.0 2.3 3.3 1.2 2.4 2.9 5.5 Computational Scalabilit y Study T o empirically v alidate the complexit y b ounds established in Section 4.2 , w e conducted a dedicated computational scalability study . W e fo cused on the most challenging Mixtur e Corr elation scenario (SNR = 1, ∥ β 0 ∥ = 50) to stress-test the algorithms with highly structured correlation outliers. W e measured total CPU execution time across a full-factorial grid of dimensions, v arying sample size n ∈ { 50 , 100 , 200 , 500 } and predictors p ∈ { 50 , 100 , 500 , 1 , 000 , 2 , 000 , 5 , 000 } . T o pro vide a b enc hmark, we compared the full FSCRE ensem ble ( K = 10) against the tw o-step sequen tial baseline (DDC-EN), which utilizes the same fast DDC imputation follow ed b y standard Elastic Net regularization. Each of the 24 configurations was replicated 50 times. The results of this study confirm our theoretical scaling claims. While we computed execu- tion times across the en tire grid, Figure 3 visualizes t wo representativ e slices on logarithmic axes to illustrate this b eha vior. The left panel demonstrates that b oth metho ds exhibit the exp ected near-linear scaling with dimension p . The execution time of FSCRE tracks almost identically with the DDC-EN baseline across all scales; for instance, the full FSCRE pro cedure on a hea vily con- taminated dataset with n = 100 and p = 5 , 000 completed in under 5 seconds on a v erage. This negligible computational ov erhead is a key practical adv an tage. It empirically demonstrates that the complex, iterativ e arc hitecture of FSCRE (in volving parallel LARS paths, cross-v alidation tour- namen ts, and final robust fitting) imp oses virtually no computational ov erhead b ey ond a standard p enalized regression on imputed data. 19 0.1 0.3 1.0 3.0 50 100 500 1000 5000 Number of Predictors ( p ) Median CPU Time (Seconds) 0.5 1.0 2.0 50 100 200 500 Sample Size ( n ) Median CPU Time (Seconds) FSCRE DDC−EN Figure 3: Median computational execution time (in seconds) for the prop osed FSCRE algorithm and the baseline DDC-EN pip eline, plotted on logarithmic axes. Left: Time as a function of the n umber of predictors p , with sample size fixed at n = 100. Right: Time as a function of sample size n , with predictors fixed at p = 1 , 000. 6 Bioinformatics Data Application T o demonstrate the practical utilit y and robustness of the FSCRE algorithm on real-w orld, high- dimensional data, w e apply it to a proteogenomics prediction task. The cen tral dogma of molecular biology dictates that mRNA is translated into protein; ho wev er, the observ ed correlation b et w een mRNA expression and protein abundance is frequently low ( V ogel and Marcotte , 2012 ). This discrepancy is driv en not only by p ost-translational regulation but also by severe technical noise. Mass sp ectrometry , the standard technique for measuring protein abundance, is notoriously prone to sp oradic missingness, v arying detection limits, and intensit y spikes ( Karpievitc h et al. , 2012 ), whic h closely mirror the cellwise contamination paradigm. 6.1 Data Description and Prepro cessing W e utilized matc hed transcriptomic and proteomic data from the Breast Inv asive Carcinoma (BR CA) cohort of The Cancer Genome A tlas (TCGA; W einstein et al. , 2013 ), accessed via the curatedTCGAData pac k age ( Ramos et al. , 2020 ). Our ob jectiv e is to predict the protein abundance of a key cancer driver using the global mRNA expression profile. W e selected the Estrogen Recep- tor alpha (ER- α ) as our target protein. ER- α is the defining biomark er and primary therap eutic target for the luminal subt yp es, which represent the v ast ma jority of breast cancer cases ( Prat 20 et al. , 2015 ), and its expression is known to ha ve a strong transcriptional basis, providing a reliable biological signal to mo del. The resp onse v ector y consists of the standardized Reverse Phase Protein Array (RPP A) ex- pression v alues for ER- α . The predictor matrix X consists of the corresp onding RNA-sequencing data. After matching samples with b oth RNA and protein data and removing observ ations with missing resp onse v alues, the final dataset comprised n = 882 observ ations. T o establish a rigorous high-dimensional setting ( p ≫ n ), w e first remo v ed genes with near-zero v ariance, and then retained the p = 500 genes with the highest absolute marginal correlation with the target protein. Finally , b oth the predictors and the resp onse were standardized to hav e zero mean and unit v ariance prior to analysis. 6.2 T argeted Contamination Strategy W e ev aluated the predictiv e p erformance of FSCRE against the comp etitor metho ds (Section 5.2 ) across 50 random data splits. Each split randomly allo cated n = 50 observ ations to training and the remaining m ≈ 830 to testing. This restricted training size delib erately enforces a rigorous high-dimensional environmen t ( p = 500 ≫ n = 50), stress-testing the algorithms under severe data scarcit y . The mo dels were ev aluated under t wo conditions: 1. Original Data: Mo dels w ere trained on the unadulterated splits to establish baseline p erfor- mance amidst natural biological and technical noise. 2. T ar gete d Artificial Contamination: In highly collinear data, ℓ 1 -p enalized metho ds can b ypass random outliers by selecting clean, correlated proxies. T o test estimator resilience rather than feature redundancy , we m ust introduce unignorable contamination. F or each split, w e iden tified the 30 most predictive genes via a standard Elastic Net mo del, and then injected cellwise outliers ( ± 10 standard deviations) in to 15% of the cells within these specific columns. This targeted strategy mimics a realistic tec hnical failure, such as a lo calized prob e malfunction affecting the primary biological signal. A truly robust metho d must reco v er this essential biological information rather than discarding it. 6.3 Results and Biological In terpretabilit y The predictiv e p erformance across the 50 random splits for the ER- α target is visualized in Figure 4 . The single-mo del robust estimators (Sparse-S and CR-Lasso) are excluded from this visualization; 21 consisten t with our simulation findings, they struggled to conv erge amidst the dense collinearity of the real-world data, yielding unstable predictions with MSPEs far outside the b ounds of the figure. On the original, unadulterated data, a strong biological signal is eviden t. The non-robust Elastic Net achiev ed the low est median MSPE, while the FSCRE ensemble incurred a slight efficiency p enalt y , a standard and exp ected trade-off for robust estimators op erating on largely clean data. Ho wev er, the in tro duction of targeted artificial contamination clearly demonstrated the sup e- riorit y of the prop osed framework. Under this adv ersarial scenario, the prediction error of the standard Elastic Net deteriorated significan tly , exhibiting b oth a higher median MSPE and wider v ariance. The DDC-augmented sequen tial baselines provided only partial protection. In stark con- trast, the FSCRE metho d demonstrated strong robustness, with its MSPE distribution remaining virtually unchanged. Consequen tly , under targeted con tamination, FSCRE consistentl y outp er- formed all other ev aluated metho ds, pro viding the lo west median prediction error and the tightest v ariance across the splits. 0.5 0.7 0.9 1.1 EN DDC−EN DDC−RGLM RLARS FSCRE MSPE Original Data Contaminated Data Figure 4: MSPE across 50 random splits for the prediction of ER- α protein abundance. The mo dels w ere ev aluated on b oth the original TCGA data (ligh t grey) and data sub jected to targeted artificial cellwise contamination in the training set (dark grey). Bey ond predictiv e accuracy , the abilit y to stably select biologically meaningful v ariables under con tamination is a key adv antage of our approach. The target protein, ER- α , is directly enco ded 22 b y the ESR1 gene ( P atel and Jeselsohn , 2022 ). On clean data, the baseline Elastic Net correctly iden tified ESR1 in 88% of the 50 splits. Ho wev er, under targeted contamination, its ℓ 1 p enalt y failed, dropping ESR1 from the mo del in all but 14% of splits. The tw o-step robust baseline (DDC-EN) fared worse (8% recov ery). Conv ersely , FSCRE successfully recov ered ESR1 in 88% of the con taminated splits, mirroring its uncontaminated baseline. F urthermore, by partitioning predictors into disjoint sub-mo dels, FSCRE preven ts dominant features from masking secondary biological signals. F or instance, FSCRE selected TBC1D9 , a hea vily co-expressed defining mark er of the ER-p ositiv e phenot yp e ( Kazi et al. , 2021 ), in 58% of the contaminated splits. Notably , Elastic Net entirely ov erlo ok ed this gene even on clean data (0% reco v ery), highlighting the severe masking effect of the ℓ 1 p enalt y . FSCRE similarly reco v ered other classical secondary drivers, suc h as the co-regulatory transcription factor GA T A3 (34% recov ery; Eeckhoute et al. , 2007 ), whic h single-mo del baselines almost completely missed ( ≤ 6%). Ultimately , FSCRE provides b oth sup erior predictive stability under contamination and a richer, biologically v alidated feature set. 7 Summary and F uture W ork In this pap er, we introduced the F ast and Scalable Cellwise-Robust Ensemble (FSCRE) algorithm to address a metho dological gap in high-dimensional data analysis. While ensemble frameworks excel at managing collinearity and impro ving predictive accuracy , they lac k inheren t resilience against cellwise con tamination. FSCRE bridges this divide by synthesizing state-of-the-art impu- tation, a computationally efficient robust LARS engine, and a comp etitiv e, cross-v alidation-driv en partitioning architecture. Extensiv e simulations demonstrated the adv an tages of this integrated approach. Across a wide sp ectrum of contamination mo dels, from classical casewise to sophisticated adversarial correlation outliers, FSCRE generally outp erformed non-robust ensembles and state-of-the-art robust single- mo del estimators in c hallenging configurations. By forcing v ariables to comp ete across disjoint sub- mo dels, the algorithm effectively regularizes against false discov eries, yielding improv ed balances of precision and recall that frequently translate to sup erior predictive accuracy . These empirical successes w ere corrob orated b y our application to TCGA proteogenomics data. When sub jected to targeted artificial contamination designed to disrupt ℓ 1 -p enalized metho ds, FSCRE maintained stable predictions. F urthermore, the ensem ble’s disjoin t nature facilitated the iden tification of secondary biological driv ers that were often mask ed in single-mo del alternatives. 23 Bey ond empirical p erformance, the design of FSCRE is theoretically grounded. W e established k ey inv ariance and equiv ariance prop erties guaranteeing the algorithm’s ob jectivity , and sho wed that its m ulti-stage selection is lo cally stable with resp ect to perturbations in the robust foundation. Moreo ver, our complexit y analysis show ed that b y structuring selection as a sequence of lo cally- optimal decisions, FSCRE sidesteps the non-conv ex global optimization b ottlenec ks limiting many mo dern robust estimators, yielding a highly scalable framew ork. Sev eral promising a ven ues remain for future researc h. First, the framew ork’s inherent mo du- larit y allows seamless in tegration of future adv ances in cellwise imputation, provided they satisfy the necessary equiv ariance prop erties. Second, in tro ducing a regularization parameter to relax the strict disjoint constraint would allo w con trolled v ariable sharing, p oten tially capturing more com- plex biological in teractions. Finally , extending this architecture to generalized linear mo dels, suc h as logistic or Cox regression, would broaden its applicability to high-dimensional classification and surviv al analysis tasks. App endix A: Empirical Sensitivit y Analysis for the Number of Mo dels ( K ) In Section 3.3 of the main man uscript, we state that the n um b er of mo dels, K , acts as a key tuning parameter controlling the complexity of the FSCRE ensemble. T o empirically v alidate the recommended range of K ∈ [5 , 10], we conducted a targeted sensitivity analysis ev aluating the framew ork’s p erformance across a fine grid of K v alues. W e utilized the highly structured Mixtur e Corr elation con tamination scenario with a mo derate signal-to-noise ratio (SNR = 1 . 0). T o ensure our findings generalize across differen t underlying mo del complexities, we ev aluated three lev els of sparsity: 50, 100, and 200 activ e predictors out of p = 500. F or eac h configuration, w e v aried K from 1 to 20 and computed the median Mean Squared Prediction Error (MSPE), Recall, and Precision o ver 50 indep enden t replications. The results, visualized in Figure 5 , clearly illustrate the structural trade-offs go verned by K : • Prediction Error (MSPE): Across all sparsity levels, the prediction error exhibits a char- acteristic “elb o w”. The MSPE drops sharply as K increases from 1 (which corresp onds to a single-mo del robust LARS) to approximately 5. Bey ond K = 10, the prediction error generally plateaus, indicating diminishing returns for out-of-sample accuracy . • V ariable Selection (Recall and Precision): Increasing K provides the ensemble with 24 Active Predictors: 50 (10%) Active Predictors: 100 (20%) Active Predictors: 200 (40%) Prediction Error (MSPE) Recall Precision 2 4 6 8 10 12 14 16 18 20 2 4 6 8 10 12 14 16 18 20 2 4 6 8 10 12 14 16 18 20 1.1 1.2 1.3 1.4 1.5 1.6 1.7 0.0 0.1 0.2 0.3 0.4 0.5 0.4 0.6 0.8 1.0 Number of Models ( K ) Median P erformance V alue Figure 5: Median Mean Squared Prediction Error (MSPE), Recall, and Precision of the FSCRE algorithm as a function of the num b er of sub-mo dels ( K ). Results are shown for the Mixtur e Corr elation scenario (SNR = 1 . 0) across three sparsity lev els (50, 100, and 200 active predictors) o ver 50 replications. more capacity to partition and select v ariables, leading to a strict, nearly linear increase in Recall (middle ro w). How ev er, this expanded capacit y even tually leads to the inclusion of noise v ariables, reflected by the steady decline in Precision (b ottom row). The predictiv e arbitration stage of FSCRE is designed to balance this exact trade-off. The optimal prediction accuracy observed in the K ∈ [5 , 10] range o ccurs because the ensemble has gro wn just enough to capture the most critical underlying biological/true signals (driving down MSPE) without yet accumulating a critical mass of false discov eries that would otherwise inflate the prediction v ariance. Consequently , choosing K within this 5 to 10 range provides a highly effectiv e, stable, and computationally efficien t default for general high-dimensional applications. 25 App endix B: Detailed Pro ofs of Inv ariance and Equiv ariance This section provides the formal mathematical pro ofs for the theoretical prop ositions (Prop osi- tions 1 - 3 ) concerning the ob jective design of the algorithm, as stated in Section 4.1 of the main man uscript. The proofs rely on the structural definitions of the FSCRE f ramew ork, the correlation- based formulation of the LARS engine, and the equiv ariance prop erties of the underlying imputation and correlation estimators. 7.1 Preliminary Lemma T o establish the inv ariance of the full FSCRE pro cedure, w e first formally verify the equiv ariance prop erties of the foundational data cleaning step. While noted conceptually b y Rousseeuw and Bossc he ( 2018 ), w e pro vide the explicit algebraic pro of here for completeness. Lemma 1. L et x j b e a c olumn of the observe d data matrix. L et an affine tr ansformation b e applie d such that x ′ j = c j x j + a j 1 , wher e c j ∈ R \ { 0 } and a j ∈ R . L et DDC ( x j ) r epr esent the c olumn after c el lwise imputation. The DDC imputation pr o c e dur e is p er-c olumn affine e quivariant, satisfying: DDC ( x ′ j ) = c j DDC ( x j ) + a j 1 Pr o of. The DDC algorithm op erates in three distinct phases: initial standardization, cellwise prediction in the standardized space, and subsequent destandardization. Phase 1 (Standardization): DDC first estimates a robust lo cation m j and scale s j . These sp ecific estimators (e.g., the median and MAD) are affine equiv arian t and scale equiv ariant, re- sp ectiv ely: m ′ j = c j m j + a j and s ′ j = | c j | s j . The raw data is standardized to Z -scores: z ij = ( x ij − m j ) /s j . Under transformation, the new Z -scores are: z ′ ij = c j x ij + a j − ( c j m j + a j ) | c j | s j = c j ( x ij − m j ) | c j | s j = c j | c j | z ij = sign( c j ) z ij Th us, an affine transformation in the original space reduces to a strict sign assignment in the standardized Z -space. Phase 2 (Prediction): DDC predicts anomalous cells using robust slop es b j h b et w een stan- dardized v ariables z j and z h . If z ′ j = sign( c j ) z j and z ′ h = sign( c h ) z h , the robust slop e transforms as b ′ j h = sign( c j c h ) b j h . The prediction for a cell i in column j relies on terms of the form b j h z ih . 26 This term transforms as: b ′ j h z ′ ih = sign( c j c h ) b j h sign( c h ) z ih = sign( c j ) · (sign( c h )) 2 · b j h z ih Because (sign( c h )) 2 = 1, this simplifies to b ′ j h z ′ ih = sign( c j )( b j h z ih ). Because every component term used to predict the cell is scaled by sign( c j ), any symmetric com bination rule (such as the w eighted mean used in DDC) will yield a predicted v alue that scales iden tically: ˆ z ′ ij = sign( c j ) ˆ z ij . If cell i is flagged, it is replaced b y this prediction. Letting z imp ij denote the final imputed cell in Z -space, it holds universally that ( z imp ) ′ ij = sign( c j ) z imp ij . Phase 3 (Destandardization): The final imputed v alue is calculated by reversing the stan- dardization: x imp ij = z imp ij s j + m j . F or the transformed data: ( x imp ) ′ ij = ( z imp ) ′ ij s ′ j + m ′ j = sign( c j ) z imp ij | c j | s j + ( c j m j + a j ) Because sign( c j ) · | c j | = c j , this resolv es to: ( x imp ) ′ ij = c j ( z imp ij s j ) + c j m j + a j = c j ( z imp ij s j + m j ) + a j = c j x imp ij + a j This satisfies the definition of p er-column affine equiv ariance. Pro of of Prop osition 1: General Affine Inv ariance Prop osition 1. The set of sele cte d pr e dictor indic es r eturne d by the FSCRE algorithm is invariant to p er-c olumn affine tr ansformations of the observe d data matrix [ y , X ] . Pr o of. Let Z = [ y , X ] be the n × ( p + 1) data matrix. Consider the p er-column affine transfor- mation Z ′ , where z ′ j = c j z j + a j 1 for c j = 0 and j = 0 , . . . , p . W e pro ceed b y induction. By Lemma 1, the DDC pro cedure is affine equiv ariant. Thus, the imputed matrices satisfy z ′ imp ,j = c j z imp ,j + a j 1 . Because sample correlation is shift-inv ariant and scale-equiv ariant up to sign, the resulting structures R ′ X and r ′ y satisfy: [ R ′ X ] il = sign( c i c l )[ R X ] il (1) [ r ′ y ] j = sign( c 0 c j )[ r y ] j (2) Base Case ( t = 0 ): With empty active sets, LARS prop oses j ∗ k = arg max j ∈ V | [ r y ] j | . By ( 2 ), 27 j ′∗ k = arg max j ∈ V | sign( c 0 c j )[ r y ] j | = j ∗ k , with prop osed sign s ′∗ k = sign( c 0 c j ∗ k ) s ∗ k . In the arbitration stage, OLS fits are affine equiv ariant ( ˆ y ′ = c 0 ˆ y + a 0 1 ), yielding residuals e ′ = c 0 e . The CV error scales strictly as E ′ = c 2 0 E . The relativ e b enefit B ( j, k ) / E old is therefore in v ariant to c 2 0 , ensuring iden tical ‘argmax‘ ev aluations across all mo dels. The selected predictor j win is inv ariant. Inductive Step: Assume at iteration t , the activ e sets match ( S ′ k = S k ), and the states satisfy s ′ i = sign( c 0 c i ) s i (for i ∈ S k ) and r ′ ( k ) j = sign( c 0 c j ) r ( k ) j (for j ∈ V ). Let D k = diag( s k ) and D ′ k = diag( s ′ k ). By ( 1 ) and the inductive h yp othesis, the ( i, l )-th en try of the signed correlation submatrix is: s ′ i R ′ il s ′ l = s i sign( c 0 c i ) R il sign( c i c l ) s l sign( c 0 c l ) = s i R il s l since sign( c 2 0 c 2 i c 2 l ) = 1. Thus, D ′ k R ′ S k D ′ k = D k R S k D k . It follows immediately that the LARS quan tities a ′ k = a k and w ′ k = w k . F or inactive predictors, a ′ j = ( D ′ k r ′ j,S k ) ⊤ w ′ k = sign( c 0 c j ) a j . The LARS step sizes up date as: γ ′ + j = r ′ A − r ′ ( k ) j a ′ k − a ′ j = r A − sign( c 0 c j ) r ( k ) j a k − sign( c 0 c j ) a j Ev aluating for sign( c 0 c j ) ∈ { 1 , − 1 } sho ws the set of p ositiv e step sizes { γ ′ + j , γ ′− j } is iden tical to { γ + j , γ − j } . The minim um step size γ ′∗ k = γ ∗ k and candidate j ∗ k are inv arian t. As in the base case, the c 2 0 scaling of CV errors preserves the relativ e arbitration decision. Finally , the correlation state up dates analytically: r ′ ( k win ) j ← sign( c 0 c j ) r ( k win ) j − γ ∗ win sign( c 0 c j ) a win j = sign( c 0 c j ) r ( k win ) j − γ ∗ win a win j main taining the inductiv e h yp othesis. Thus, the selection sequence is strictly in v ariant. Pro of of Prop osition 2: P erm utation Equiv ariance Prop osition 2. The FSCRE algorithm is e quivariant with r esp e ct to p ermutations of the pr e dictor c olumns. L et π b e a p ermutation of the indic es { 1 , . . . , p } . If E = { S 1 , . . . , S K } is the ensemble r eturne d for X , then the ensemble r eturne d for the p ermute d matrix X π is { π ( S σ (1) ) , . . . , π ( S σ ( K ) ) } for some p ermutation σ of the mo del indic es. Pr o of. Let π : { 1 , . . . , p } → { 1 , . . . , p } b e a bijectiv e p erm utation mapping. The j -th column of the p erm uted matrix X π corresp onds to the π − 1 ( j )-th column of X . W e pro ceed by induction on 28 the selection steps t , showing that the state of the algorithm on X π maps p erfectly to the state on X via π for predictors and a p erm utation σ ( t ) for the K sub-mo dels. As established, the DDC imputation algorithm computes robust correlations to find nearest neigh b ors. Because correlation is a pairwise metric indep enden t of column p osition, column p er- m utation strictly comm utes with the imputation operator, yielding an imputed matrix X imp ,π whose columns are identically p erm uted. The resulting sample correlation structures inherently satisfy [ R X,π ] π ( i ) ,π ( j ) = [ R X ] ij and [ r y ,π ] π ( j ) = [ r y ] j . Base Case ( t = 0 ): All K sub-mo dels are initialized with empt y active sets and correlation state r ′ ( k ) = r y ,π . The LARS prop oser searc hes for the maxim um absolute correlation. Because the set of a v ailable correlations is identical up to reordering, the maxim um v alue is iden tical. Let M b e the set of indices ac hieving this maxim um in X . The corresp onding set in X π is π ( M ). Since all K mo dels are identical, they generate K identical prop osals. F or any prop osal j ∗ ∈ M , the cross-v alidated prediction error of a single-v ariable least-squares fit dep ends solely on the v alues within that column, not its index, yielding iden tical CV b enefits: B ( j ∗ , k ) = B ′ ( π ( j ∗ ) , k ′ ) for all k , k ′ . Thus, a K -wa y tie exists for the maxim um b enefit. The algorithm resolv es this tie uniformly at random. Let k win win v ariable j ∗ in the original run, and k ′ win win π ( j ∗ ) in the p erm uted run. Because b oth mo dels are drawn uniformly from iden tical sets, w e define a p erm utation σ (1) suc h that σ (1) ( k win ) = k ′ win , pairing the remaining empt y mo dels arbitrarily . Thus, S ′ k ′ = { π ( j ∗ ) } = π ( S σ − 1 ( k ′ ) ), establishing equiv ariance. Inductive Step: Assume at iteration t , there exists a mo del p erm utation σ suc h that for all k : S ′ σ ( k ) = π ( S k ), the sign vectors match, and [ r ′ ( σ ( k )) ] π ( j ) = [ r ( k ) ] j for all a v ailable j ∈ V . Consider mo del k and its counterpart k ′ = σ ( k ). Because S ′ k ′ = π ( S k ), the submatrix R ′ S ′ k ′ is iden tical to R S k sub ject to a symmetric row/column p erm utation b y π . Because the determinan t and inv erse of a matrix are inv ariant to symmetric p erm utations, the LARS normalization scalar is inv ariant ( a ′ k ′ = a k ), and the weigh t vector w ′ k ′ is simply w k p erm uted by π . F or an y inactive predictor j ∈ V , its correlation with the equiangular direction is a ′ π ( j ) = ( D ′ k ′ r ′ π ( j ) ,S ′ k ′ ) ⊤ w ′ k ′ . Because b oth v ectors in this inner pro duct are p erm uted b y the exact same mapping π relative to the original run, the dot pro duct is strictly in v arian t: a ′ π ( j ) = a j . Consequen tly , the analytical LARS step sizes are identical: γ ′ π ( j ) = γ j . The minimum step size γ ′∗ k ′ = γ ∗ k corresp onds exactly to the mapp ed candidate π ( j ∗ k ). During arbitration, the design matrix for mo del k ′ is formed by columns S ′ k ′ ∪ { π ( j ∗ k ) } = π ( S k ∪ { j ∗ k } ). As least-squares fits are inv arian t to column ordering, the CV prediction error 29 and resulting b enefit are iden tical: B ′ ( π ( j ∗ k ) , σ ( k )) = B ( j ∗ k , k ). Let W b e the set of ‘(v ariable, mo del)‘ tuples tying for the maximum b enefit. The corresp onding set in the p erm uted run is W ′ = { ( π ( j ) , σ ( k )) : ( j , k ) ∈ W } . A winner is drawn uniformly at random. Let ( j win , k win ) and ( j ′ win , k ′ win ) be the winners in the original and p erm uted runs, resp ectiv ely . Because the draw is uniform ov er bijectively mapp ed sets, the probabilistic equiv alence is preserv ed. If ( j ′ win , k ′ win ) = ( π ( j win ) , σ ( k win )), the tied, symmetrically identical mo dels are simply relab eled to define a new p erm utation σ ( t +1) that maintains the corresp ondence. Finally , the winning mo del’s correlation state is up dated analytically . Because γ ′∗ = γ ∗ and a ′ π ( j ) = a j , the up date strictly mirrors the original run: [ r ′ ( k ′ win ) ] π ( j ) ← [ r ′ ( k ′ win ) ] π ( j ) − γ ′∗ a ′ π ( j ) = [ r ( k win ) ] j − γ ∗ a j main taining the inductiv e h yp othesis for the new av ailable p o ol V ′ = V \ { π ( j win ) } . Since the initial state is equiv ariant, all geometric prop osals and CV b enefits are identical, and state up dates preserve the mapping algebraically , the sequence of assignmen ts is identical up to a p erm utation σ of the arbitrary mo del lab els. Therefore, the final ensemble satisfies E ′ = { π ( S σ (1) ) , . . . , π ( S σ ( K ) ) } . Pro of of Prop osition 3 : In tercept In v ariance Prop osition 3. The sele ction of pr e dictor variables by the FSCRE algorithm is invariant to the inclusion of an inter c ept term in its internal r e gr ession mo dels. Pr o of. The FSCRE v ariable selection pro cedure relies sequentially on tw o ev aluation mec ha- nisms: candidate prop osal via the correlation-based LARS algorithm, and arbitration via cross- v alidated least-squares prediction error. W e demonstrate that b oth mechanisms yield identical sequences regardless of explicit intercept inclusion. Invarianc e of Candidate Pr op osal: The LARS prop oser (Algorithm 1 ) op erates exclusively on the sample correlation matrix of the imputed predictors, R X , and the v ector of correlations with the current residuals, r ( k ) . The sample P earson correlation is strictly in v arian t to lo cation shifts; mathematically , the centering op eration within the correlation formula orthogonally pro jects the data onto the space p erpendicular to the in tercept v ector 1 . Therefore, augmen ting the data matrix with a column 1 do es not alter the correlation b et ween an y tw o predictor columns or b et w een a predictor and the resp onse. Consequently , the initial structures R X and r y are identical whether 30 an in tercept is conceptually included or not. Because the LARS path calculations ( a k , w k , and γ ) are purely analytical functions of these centered correlation structures, the sequence of prop osed candidate v ariables is strictly in v ariant. Invarianc e of Pr e dictive Arbitr ation: During arbitration, candidate v ariables are ev aluated based on their reduction of the v -fold cross-v alidation error, defined as the mean squared prediction error (MSPE) of the out-of-sample residuals e = y test − ˆ y test . Let X S denote the design matrix for an active set. Fitting a least-squares mo del with an intercept, y = β 0 1 + X S β + ε , yields the standard iden tit y ˆ β 0 = ¯ y − ¯ X S ˆ β . Substituting this intercept estimate demonstrates that fitting a mo del with an intercept is mathematically equiv alent to mean-centering b oth the resp onse and all predictors prior to fitting a mo del without an intercept. The competition arbitrates based on the relative b enefit, B ( j, k ) = E ( S k ) − E ( S k ∪ { j } ). Because explicitly fitting an intercept consisten tly shifts the predictions to account for the training fold’s global mean, it applies a uniform translational adjustmen t that minimizes the baseline error around that mean across all ev aluated mo dels. The reduction in squared error pro vided sp ecifically by the structural addition of the new predictor x j ˆ β j remains mathematically iden tical. Since b oth the geometric prop osals generated by the LARS engine and the comparative predic- tiv e b enefits ev aluated by the CV arbiter are inv ariant to global lo cation shifts, explicitly including an in tercept term has no effect on the ‘argmax‘ assignmen ts at an y iteration. The resulting sequence of selected predictors and the final disjoint ensemble are iden tical. App endix C: Deriv ation of Computational Complexit y This section provides the detailed step-b y-step deriv ation of the computational complexity b ound presen ted in Proposition 4 . Pro of of Prop osition 4 : Computational Complexity Prop osition 4. L et n b e the numb er of observations, p the numb er of pr e dictors, K the numb er of ensemble mo dels, and k max the total numb er of sele cte d variables. When using a ful ly sc alable pr e-c omputation str ate gy in the typic al p ≫ n sp arse setting, the over al l c omputational c omplexity of the FSCRE fr amework is appr oximately: O ( np log ( p ) + k max · K · p ¯ s ) 31 wher e ¯ s denotes the aver age sub-mo del size. Pr o of. The total theoretical computational cost of the FSCRE algorithm is determined by summing the costs incurred during its three main stages: (1) Robust F oundation, (2) Comp etitiv e Ensem ble Selection, and (3) Final Mo del Fitting. Let s k = | S k | denote the active set size for mo del k , and ¯ s ≈ 1 K P K k =1 s k b e the av erage sub-mo del size. The pre-computation stage (Robust F oundation) consists of cellwise data imputation follo wed b y correlation matrix estimation. Under the assumption of a fully scalable strategy , the algo- rithm utilizes the fast DDC metho dology prop osed by Raymaek ers and Rousseeu w ( 2021b ), which b ypasses exact pairwise correlation calculations via fast appro ximate nearest-neighbor searches, b ounding the imputation cost at approximately O ( np log( p )). T o main tain this scalabilit y b ound , the prop osition assumes the use of a fast transformation-based estimator, such as the wrapping metho d ( Ra ymaek ers and Rousseeu w , 2021b ), whic h computes the required p × p robust correlation matrix R X in O ( np ) op erations. The total theoretical pre-computation cost is therefore b ounded b y O ( np log( p )) + O ( np ) = O ( np log ( p )). The Comp etitiv e Ensemble Selection lo op executes for at most k max iterations. Within each iteration, ev ery mo del prop oses a candidate. The robust LARS prop oser (Algorithm 1 ) requires in verting the s k × s k signed correlation submatrix, costing O ( s 3 k ), and computing the equiangular v ector w k in O ( s 2 k ) op erations. T o find the optimal step size γ , the algorithm ev aluates the matrix- v ector pro duct ( D k r j,S k ) ⊤ w k for all a v ailable predictors j ∈ V . Since | V | ≈ p , this searc h costs O ( ps k ). Because p ≫ n > s k in the target sparse regime, the O ( ps k ) search strictly dominates the O ( s 3 k ) inv ersion. Summing ov er all K mo dels, the total proposal cost per iteration is O ( K · p ¯ s ). The prop osals are subsequen tly arbitrated via v -fold cross-v alidation. Fitting a standard least- squares regression on a training set of size ≈ n with s k + 1 predictors using QR decomp osition costs O ( n ( s k + 1) 2 ). F or v folds across K models, the total arbitration cost p er iteration is O ( K · v n ¯ s 2 ). Multiplying the p er-iteration costs b y k max yields the total cost of the iterative lo op: O ( k max · K · p ¯ s + k max · K · v n ¯ s 2 ). Because p ≫ n and ¯ s is small, the p ¯ s term strictly dominates, simplifying the asymptotic lo op cost to O ( k max · K · p ¯ s ). Finally , the algorithm fits an MM-estimator to each of the K sub-mo dels. The cost for a mo del of size s k is b ounded by O ( C iter · ns 2 k ), where C iter reflects the maxim um n um b er of rew eigh ting iterations. Executed exactly once p er sub-mo del at the end of the pro cedure, the total cost is O ( K · n ¯ s 2 ). Crucially , this op eration is indep enden t of the dimension p , rendering it negligible compared to the pre-computation and selection lo op costs. 32 Com bining the asymptotically dominant costs yields the ov erall complexity b ound: C total = O ( np log ( p )) + O ( k max · K · p ¯ s ) + O ( K · n ¯ s 2 ) Dropping the asymptotically negligible final fitting term, the theoretical complexit y of the scalable FSCRE framework is b ounded by O ( np log( p ) + k max · K · p ¯ s ), which completes the pro of. App endix D: Detailed Pro of of Lo cal Selection Stabilit y This section pro vides a detailed pro of of the lo cal selection stability result stated in Section 4.3 of the main manuscript. W e first describ e the generic-p osition condition assumed there, and then pro ve that, under this condition, the FSCRE selection map is lo cally constant as a function of its robust foundation. As in the main text, the robust foundation of FSCRE is summarized by the triple T = ( R X , r y , Z imp ) , where R X is the p × p predictor–predictor correlation matrix, r y is the p -dimensional predictor– resp onse correlation v ector, and Z imp = [ y imp , X imp ] is the imputed data matrix. F or an y such triple T , let E ( T ) = { S 1 ( T ) , . . . , S K ( T ) } denote the collection of disjoint activ e sets returned by the FSCRE pro cedure when Algorithm 1 and Algorithm 2 are run on T with fixed K and tolerance τ > 0. W e fix a reference triple ˜ T = ( ˜ R X , ˜ r y , ˜ Z imp ) and consider the run of FSCRE on ˜ T . This induces a finite sequence of iterations indexed by t = 1 , . . . , L , where in eac h iteration the algorithm maintains active sets S ( t ) k and correlation states r ( k,t ) for k = 1 , . . . , K , calls the Robust LARS Proposer for eac h sub-model, forms a comp etition set of proposals, selects a winning proposal, and either updates the corresponding mo del or terminates. Because each predictor can b e selected at most once, L ≤ k max + 1 < ∞ . 33 Generic-P osition Condition at ˜ T The lo cal stability result relies on the following generic-p osition condition at ˜ T . • All internal regression problems arising in the cross-v alidation step are well p osed. That is, for ev ery sub-mo del k and ev ery activ e set S ( t ) k visited along the run at ˜ T , the design matrix ˜ X imp ,S ( t ) k has full column rank, so that the corresponding Gram matrices are in vertible. • At ev ery call to the Robust LARS Prop oser along the run at ˜ T , and for ev ery sub-mo del k , the minimizing step size γ j o ver the a v ailable predictors is ac hieved by a unique index, and the gap b et w een this minim um and all comp etitors is strictly p ositiv e. • At ev ery iteration t , among all prop osals in the comp etition set, there is a unique winning prop osal with strictly larger cross-v alidated b enefit than an y comp etitor. • At ev ery iteration t , the con tinuation/termination inequality used in Algorithm 2 is strict. In particular, the normalized b enefit of the winning prop osal differs from τ by a p ositiv e margin, so the algorithm do es not lie exactly on the stopping boundary . Under con tinuous data distributions, suc h generic-p osition conditions hold with probabilit y one, since exact ties and boundary equalities o ccur with probabilit y zero. W e no w pro v e that, under this condition, FSCRE is lo cally stable. Pro of of Prop osition 5 : Local Selection Stability W e work with an y fixed norm ∥ · ∥ on the concatenated en tries of ( R X , r y , Z imp ); the particular c hoice is immaterial. F or conv enience w e restate the result here. Prop osition (Lo cal Selection Stabilit y). Fix K and τ > 0 , and supp ose the r efer enc e triple ˜ T = ( ˜ R X , ˜ r y , ˜ Z imp ) satisfies the generic-p osition c ondition ab ove. Then ther e exists η > 0 such that, for any triple T = ( R X , r y , Z imp ) with ∥ R X − ˜ R X ∥ + ∥ r y − ˜ r y ∥ + ∥ Z imp − ˜ Z imp ∥ < η , the FSCRE algorithm run on T makes exactly the same de cisions as when run on ˜ T . In p articular, E ( T ) = E ( ˜ T ) . 34 Pr o of. The pro of has tw o parts. First we note that all scalar quantities used in the algorithmic decisions are con tinuous functions of T in a neighbourho o d of ˜ T . Secondly , we use the strict inequalities pro vided by the generic-position condition to sho w that these decis i ons cannot change when T is sufficiently close to ˜ T . Con tinuit y of decision quan tities. A t any iteration t and for an y sub-mo del k , the Robust LARS Prop oser uses: • submatrices and subv ectors of R X and r y , such as R X,S ( t ) k and r y ,S ( t ) k ; • the signed correlation matrix A k = D k R X,S ( t ) k D k , with D k = diag( s k ) the diagonal matrix of signs for S ( t ) k ; • the equiangular direction and normalization w k = a k A − 1 k 1 | S ( t ) k | , a k = 1 ⊤ | S ( t ) k | A − 1 k 1 | S ( t ) k | − 1 / 2 ; • inner pro ducts a j = ( D k r j,S ( t ) k ) ⊤ w k for j in the a v ailable set; • step sizes γ + j = r A − r ( k,t ) j a k − a j , γ − j = r A + r ( k,t ) j a k + a j , γ j = min( γ + j , γ − j ) , where r A is the current absolute active correlation and r ( k,t ) is the current correlation state for sub-mo del k . Because R X and r y en ter these express ions only through linear op erations, and b ecause at ˜ T the matrices A k are inv ertible by the generic-p osition condition, it follows that in a small neigh b ourho o d of ˜ T the matrices A k remain in v ertible and their in verses dep end contin uously on R X . Thus a k , w k , a j and the step sizes γ ± j are all contin uous functions of T , as long as the denominators a k ± a j sta y aw ay from zero. The generic-p osition condition guarantees exactly that at ˜ T , and therefore in some neighbourho o d of ˜ T these denominators remain b ounded aw ay from zero as w ell. Similarly , the cross-v alidation errors CV-Error( S ( t ) k ; T ) 35 used in Algorithm 2 are computed from ordinary least-squares fits on folds of Z imp . The generic- p osition condition ensures that at ˜ T all Gram matrices ˜ X ⊤ imp ,S ( t ) k ˜ X imp ,S ( t ) k are inv ertible. In a small neigh b ourho o d of ˜ Z imp , these matrices remain inv ertible and their inv erses, the corresp onding co efficien t estimates, residuals and squared residuals, all dep end contin uously on Z imp . Therefore the cross-v alidation errors, b enefits B ( j, k ; T ) = CV -Error( S ( t ) k ; T ) − CV-Error( S ( t ) k ∪ { j } ; T ) , and normalized b enefits R ( j, k ; T ) = B ( j, k ; T ) CV-Error( S ( t ) k ; T ) are contin uous functions of T in a neighbourho o d of ˜ T . Preserv ation of decisions in a neigh b ourho o d of ˜ T . Along the run of FSCRE on ˜ T there is a finite set of comparisons that determine: • for eac h sub-mo del k and iteration t , whic h index j ∗ , ( t ) k minimizes γ j o ver the a v ailable predictors; • for eac h iteration t , which prop osal ( j ( t ) win , k ( t ) win ) maximizes B ( j, k ; ˜ T ) in the comp etition step; • for each iteration t , whether the normalized b enefit R ( t ) ( ˜ T ) is greater than or less than or equal to τ . By the generic-position condition, eac h of these comparisons is strict at ˜ T , i.e., the winner beats all competitors by a strictly positive margin and the stopping inequality is not on the b oundary . Let δ > 0 b e the minim um of all these p ositiv e margins across all iterations and comparisons. By contin uit y of all the scalar quan tities inv olv ed, there exists η > 0 such that, whenev er ∥ T − ˜ T ∥ < η , ev ery such scalar quantit y ev aluated at T differs from its v alue at ˜ T b y less than δ / 3. In particular, the orderings of the γ j ( T ) and B ( j, k ; T ), and the sign of R ( t ) ( T ) − τ , are the same as at ˜ T for all t . W e now argue b y induction on t that, under ∥ T − ˜ T ∥ < η , the entire sequence of states and decisions for FSCRE on T is iden tical to that on ˜ T . A t t = 1, b oth runs start from the same initial state (all active sets empty , same initial correlation states, same a v ailable set). Because the orderings and signs of the relev ant decision quan tities at T match those at ˜ T , the same candidates are prop osed, the same prop osal wins, and the same stop/con tin ue decision is taken. Thus the states after iteration 1 coincide. 36 Assume that after iteration t − 1 the states for T and ˜ T coincide. At iteration t , the same argumen t applies: the strict inequalities defining which γ j is smallest, which b enefit is largest, and whether to stop or contin ue, all hav e the same signs at T as at ˜ T . Therefore the same candidate is chosen for eac h sub-mo del, the same winning prop osal is selected, and the same stop/contin ue decision is made. Hence the states after iteration t coincide. By induction, the states coincide at the end of every iteration up to termination. In particular, FSCRE terminates after the same num b er of iterations on T and ˜ T , and the final ensembles satisfy E ( T ) = E ( ˜ T ) for all T with ∥ T − ˜ T ∥ < η . This prov es the lo cal selection stability result. Co de and Data The scripts used to generate the synthetic data, conduct the simulation studies, and p erform the bioinformatics data application are publicly av ailable. The complete co debase, along with instruc- tions for execution, can b e accessed at https://github.com/AnthonyChristidis/FSCRE- Simulations . The prop osed metho dology is implemented in the srlars R pack age, which is av ailable on CRAN. Conflict of In terests The authors declare no p otential conflict of in terests. References Agostinelli, C., A. Leung, V. J. Y ohai, and R. H. Zamar (2015). Robust estimation of multiv ariate lo cation and scatter in the presence of cellwise and casewise con tamination. T est 24 (3), 441–461. Alfons, A. (2021). robustHD: An R pack age for robust regression with high-dimensional data. Journal of Op en Sour c e Softwar e 6 (67), 3786. Alfons, A., C. Croux, and S. Gelp er (2013). Sparse least trimmed squares regression for analyzing high-dimensional large data sets. The Annals of Applie d Statistics , 226–248. 37 Alqallaf, F., S. V an Aelst, V. J. Y ohai, and R. H. Zamar (2009). Propagation of outliers in m ultiv ariate data. The Annals of Statistics , 311–331. Bottmer, L., C. Croux, and I. Wilms (2022). Sparse regression for large data sets with outliers. Eur op e an Journal of Op er ational R ese ar ch 297 (2), 782–794. Breiman, L. (2001). Random forests. Machine le arning 45 (1), 5–32. Chen, T. and C. Guestrin (2016). X GBo ost: A scalable tree b o osting system. In Pr o c e e dings of the 22nd ACM SIGKDD International Confer enc e on Know le dge Disc overy and Data Mining , pp. 785–794. A CM. Christidis, A. and G. Cohen-F reue (2026). srlars: F ast and Sc alable Cel lwise-R obust Ensemble . R pac k age v ersion 2.0.1. Christidis, A.-A. and G. C. F reue (2026). Robust multi-model subset selection. Journal of Com- putational and Gr aphic al Statistics . Christidis, A.-A., L. Lakshmanan, E. Smucler, and R. Zamar (2020). Split regularized regression. T e chnometrics 62 (3), 330–338. Christidis, A.-A., S. V an Aelst, and R. Zamar (2025). Multi-mo del subset selection. Computational Statistics & Data Analysis 203 , 108073. Debruyne, M., S. H¨ oppner, S. Serneels, and T. V erdonc k (2019). Outlyingness: which v ariables con tribute most? Statistics and Computing 29 (4), 707–723. Eec khoute, J., E. K. Keeton, M. Lupien, S. A. Krum, J. S. Carroll, and M. Bro wn (2007). P ositiv e cross-regulatory lo op ties gata-3 to estrogen receptor α expression in breast cancer. Canc er r ese ar ch 67 (13), 6477–6483. Efron, B., T. Hastie, I. Johnstone, and R. Tibshirani (2004). Least angle regression. Filzmoser, P ., S. H¨ oppner, I. Ortner, S. Serneels, and T. V erdonc k (2020). Cellwise robust m regression. Computational Statistics & Data Analysis 147 , 106944. F riedman, J. H., T. Hastie, and R. Tibshirani (2010). Regularization paths for generalized linear mo dels via co ordinate descen t. Journal of statistic al softwar e 33 , 1–22. 38 Karpievitc h, Y. V., A. R. Dabney , and R. D. Smith (2012). Normalization and missing v alue imputation for lab el-free lc-ms analysis. BMC bioinformatics 13 (Suppl 16), S5. Kazi, M. S., M. M. Zameer, A. A. Momin, A. Kothari, K. Ahamed, H. Padh, R. Sreejith, A. Kulk a- rni, A. Sharma, M. B, and K. S (2021). Tb c1d9: An imp ortan t mo dulator of tumorigenesis in breast cancer. Me dic al Onc olo gy 38 (8), 95. Kepplinger, D. (2023). Robust v ariable selection and estimation via adaptive elastic net s-estimators for linear regression. Computational Statistics & Data A nalysis 183 , 107730. Kepplinger, D., M. Salibi´ an-Barrera, and G. Cohen F reue (2026). p ense: Penalize d Elastic Net S/MM-Estimator of R e gr ession . R pack age v ersion 2.5.0. Khan, J. A., S. V an Aelst, and R. H. Zamar (2007). Robust linear mo del selection based on least angle regression. Journal of the A meric an Statistic al Asso ciation 102 (480), 1289–1299. Loh, P .-L. and X. T an (2018). High-dimensional robust precision matrix estimation: Cellwise corruption under ϵ -con tamination. Ele ctr onic Journal of Statistics 12 (1), 1429–1467. Maronna, R. A., R. D. Martin, V. J. Y ohai, and M. Salibi´ an-Barrera (2019). R obust statistics: the ory and metho ds (with R) . John Wiley & Sons. ¨ Ollerer, V., A. Alfons, and C. Croux (2016). The sho oting s-estimator for robust regression. Computational Statistics 31 (3), 829–844. P acreau, G. and K. Lounici (2023). Robust co v ariance estimation with missing v alues and cell-wise con tamination. A dvanc es in Neur al Information Pr o c essing Systems 36 , 72124–72136. P atel, J. M. and R. M. Jeselsohn (2022). Estrogen receptor alpha and esr1 m utations in breast cancer. In Nucle ar R e c eptors in Human He alth and Dise ase , pp. 171–194. Springer. Prat, A., E. Pineda, B. Adamo, P . Galv an, A. F ern´ andez, L. Gaba, M. D ´ ıez, M. Viladot, J. P ´ erez- Garc ´ ıa, M. Mu ˜ noz, et al. (2015). Clinical implications of the in trinsic molecular subt yp es of breast cancer. The Br e ast 24 , S26–S35. Ramos, M., L. Geistlinger, S. Oh, L. Schiffer, R. Azhar, H. Ko dali, I. de Bruijn, J. Gao, V. J. Carey , M. Morgan, and L. W aldron (2020). Multiomic integration of public oncology databases in bio conductor. JCO Clinic al Canc er Informatics 1 (4), 958–971. PMID: 33119407. 39 Ra ymaekers, J. and P . Rousseeu w (2021a). Handling cellwise outliers by sparse regression and robust cov ariance. Journal of Data Scienc e, Statistics, and Visualisation 1 (3). Ra ymaekers, J. and P . Rousseeuw (2026). c el lWise: Analyzing Data with Cel lwise Outliers . R pac k age v ersion 2.5.5. Ra ymaekers, J. and P . J. Rousseeu w (2021b). F ast robust correlation for high-dimensional data. T e chnometrics 63 (2), 184–198. Ra ymaekers, J. and P . J. Rousseeuw (2024a). The cellwise minimum cov ariance determinant estimator. Journal of the Americ an Statistic al Asso ciation 119 (548), 2610–2621. Ra ymaekers, J. and P . J. Rousseeu w (2024b). Challenges of cellwise outliers. Ec onometrics and Statistics . Rousseeu w, P . J. and W. V. D. Bossc he (2018). Detecting deviating data cells. T e chnometrics 60 (2), 135–145. Song, L. and P . Langfelder (2022). r andomGLM: R andom Gener al Line ar Mo del Pr e diction . R pac k age v ersion 1.10-1. Song, L., P . Langfelder, and S. Horv ath (2013). Random generalized linear mo del: a highly accurate and interpretable ensem ble predictor. BMC bioinformatics 14 (1), 5. Su, P ., G. T arr, S. Muller, and S. W ang (2024). Cr-lasso: Robust cellwise regularized sparse regression. Computational Statistics & Data Analysis 197 , 107971. T arr, G., S. M¨ uller, and N. C. W eb er (2016). Robust estimation of precision matrices under cellwise con tamination. Computational Statistics & Data Analysis 93 , 404–420. Ueda, N. and R. Nak ano (1996). Generalization error of ensem ble estimators. In Pr o c e e dings of International Confer enc e on Neur al Networks (ICNN’96) , V olume 1, pp. 90–95. IEEE. V ogel, C. and E. M. Marcotte (2012). Insights in to the regulation of protein abundance from proteomic and transcriptomic analyses. Natur e r eviews genetics 13 (4), 227–232. W einstein, J. N., E. A. Collisson, G. B. Mills, K. R. Shaw, B. A. Ozenberger, K. Ellrott, I. Shmule- vic h, C. Sander, and J. M. Stuart (2013). The cancer genome atlas pan-cancer analysis pro ject. Natur e genetics 45 (10), 1113–1120. 40 Y ohai, V. J. (1987). High breakdown-point and high efficiency robust estimates for regression. The A nnals of statistics , 642–656. 41
Original Paper
Loading high-quality paper...
Comments & Academic Discussion
Loading comments...
Leave a Comment