The Load Management Paradox: Correcting the Healthy-Worker Survivor Effect in NBA Injury Modeling
In professional sports analytics, evaluating the relationship between accumulated workload and injury risk is a central objective. However, naive survival models applied to NBA game-log data consistently yield a paradox: players who recently logged h…
Authors: Yue Yu, Guanyu Hu
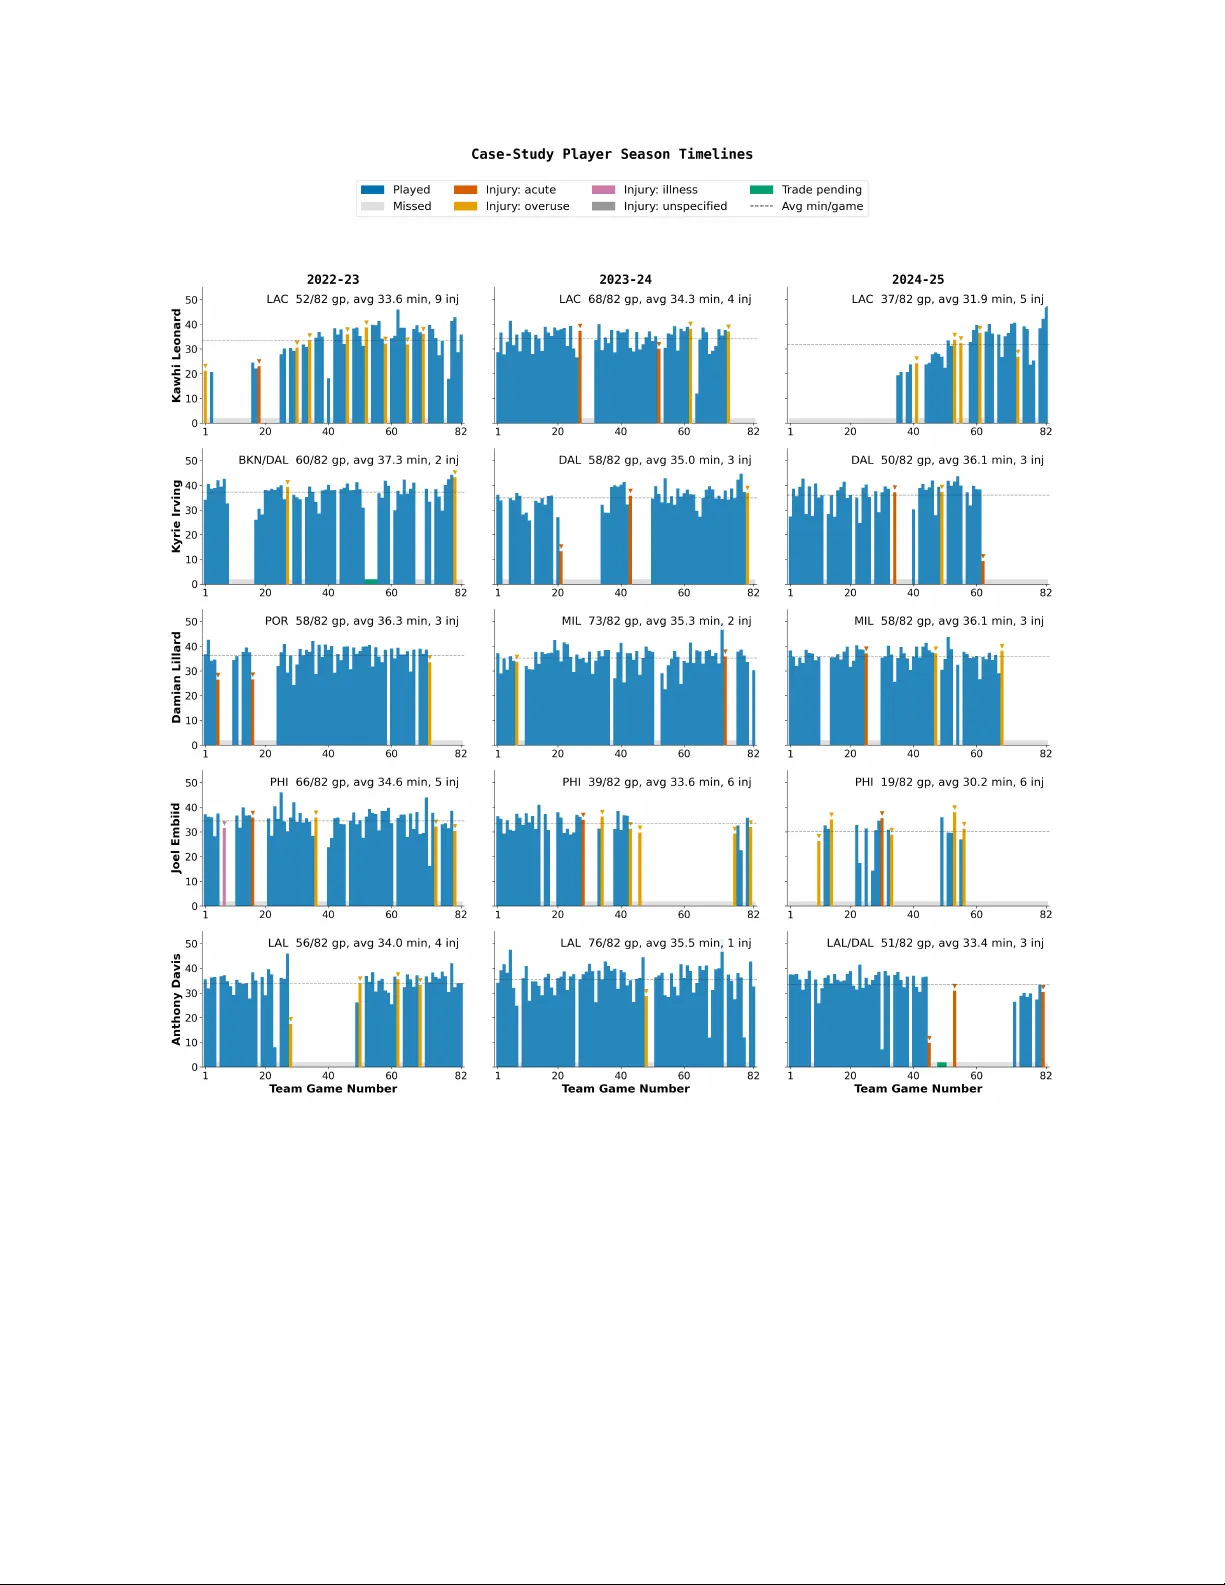
The Load Managemen t P arado x: Correcting the Health y-W ork er Surviv or Effect in NBA Injury Mo deling Y ue Y u ∗ Guan yu Hu † Abstract In professional sp orts analytics, ev aluating the relationship b et w een accumulated w orkload and injury risk is a cen tral ob jective. Ho wev er, naive surviv al mo dels applied to NBA game-log data consistently yield a parado x: pla yers who recen tly logged heavy min utes app ear less lik ely to sustain an injury . W e demonstrate that this counterin tuitiv e result is an artifact of the health y-work er su rvivor effect, wherein conditioning on game participation induces sev ere collider bias driv en by unobserved laten t fitness. T o address this structural confounding, we develop a Marginal Structural Piecewise Exp onen tial Mo del (MS-PEM) that unifies inv erse probability of treatmen t weigh ting (IPTW) with flexible piecewise-exp onen tial additive models and w eighted cum ulative exp osure (WCE). A simulation study confirms that this selection mechanism is mathematically sufficien t to entirely reverse the sign of the true association b et ween w orkload and injury . Applying the MS-PEM to 78,594 play er-game observ ations across three NBA seasons (encompassing 771 play ers and 2,439 injury ev ents), w e find that adjusting for observed selection reliably shifts the hazard back to ward the underlying physiological relationship. While the exact magnitude of the correction is sensitiv e to outcome-mo del regularization (atten uating the parado xical weigh t function by 1% to 2% under conserv ative cross-v alidation and up to 63% to 78% under lighter p enalization), the p ositiv e direction of the causal correction is highly robust across m ultiple prop ensity sp ecifications and doubly robust chec ks. Ultimately , these results pro vide a metho dological template for bias-aw are sp orts injury mo deling, while cautioning that mo dels relying strictly on observ ational game logs will systematically underestimate the true risk of heavy workloads without ric her physiological data for full causal identification. Keyw ords: Causal inference, Marginal structural mo dels, Sp orts analytics, Surviv al analysis, W eighted cum ulative exp osure 1 In tro duction 1.1 Load management in professional sp orts Managing play er w orkload has b ecome a central problem in professional sp orts, b oth practically and statistically . In the NBA, teams, medical staffs, and league officials routinely mak e decisions ab out pla ying time, rest, and return-to-pla y under subs tan tial uncertain ty ab out how recen t exp osure affects subsequen t injury risk. These decisions hav e consequences that extend b ey ond individual health. Injury-related absences can alter team p erformance, pla yoff qualification, and roster strategy , while also affecting tic ket sales, broadcasting v alue, and fan engagemen t. During the 2023–24 NBA ∗ Departmen t of Statistics, Indiana Universit y; e-mail: yyu3@iu.edu † Departmen t of Statistics and Probability , Michigan State Universit y; e-mail: huguanyu@msu.edu 1 season alone, teams filed more than 12 , 000 official injury rep orts, underscoring the scale of the problem and the extent to whic h injury risk shapes the mo dern league. F rom a scien tific p erspective, the issue is equally important. The In ternational Olympic Committee has iden tified external training load as a key determinant of injury risk across sp orts ( Soligard et al. , 2016 ), an d consensus statements in sp orts medicine hav e emphasized that injury etiology is dynamic, multifactorial, and inherently longitudinal ( Meeuwisse , 1994 ; Meeuwisse et al. , 2007 ; Bahr and Krosshaug , 2005 ). A large applied literature has therefore sough t to quantify ho w recen t w orkload influences injury incidence, athlete a v ailability , and p erformance capacit y ( F o x et al. , 2018 ; Windt and Gabb ett , 2017 ; Imp ellizzeri et al. , 2019 ). In professional basketball, this question is esp ecially salient b ecause play er exp osure is measured at high frequency through detailed game logs, and b ecause teams activ ely interv ene on w orkload through rest decisions, min ute restrictions, and rotation management. These practices are often group ed under the lab el of “load management” and ha ve b ecome sufficien tly prominen t to motiv ate explicit league p olicy resp onses ( Po well , 2024 ). Their visibilit y increased sharply after the T oronto Raptors rested Kawhi Leonard for 22 regular-season games in 2018–19, a strategy widely viewed as helping preserve his av ailability during the play off run that culminated in the franc hise’s first NBA c hampionship. Despite the practical imp ortance of these decisions, the central empirical question remains unresolv ed: do es the r e c ent p attern of playing time c ausal ly affe ct injury risk? A t first glance, professional basketball seems to offer an ideal setting for answ ering this question. Injury ev ents are recorded, workload is measured rep eatedly o ver time, and time-to-ev ent metho ds provide a natural framew ork for relating evolving exp osure histories to subsequen t risk ( Nielsen et al. , 2019a , b ). A straigh tforward strategy is therefore to fit surviv al mo dels to play er game-log data, using measures of recent minutes or game load as predictors of injury hazard. Ho wev er, this seemingly natural approach leads to a striking and coun terintuitiv e empirical pattern. Across a wide range of sp ecifications, seasons, and sample definitions, pla yers with greater recen t pla ying time app ear to face lower subsequent injury risk. The estimated asso ciation b etw een recen t workload and injury hazard is often negative and statistically precise. T ak en literally , suc h findings w ould suggest that heavier recent exp osure is protectiv e against injury . That interpretation is difficult to reconcile with substantiv e knowledge from sp orts medicine, with the physiological rationale underlying load managemen t itself, and with the broader concern that accumulated stress ma y elev ate injury risk ( Gabb ett , 2016 ; Imp ellizzeri et al. , 2020 , 2021 ). W e refer to this empirical pattern as the load managemen t parado x . 1.2 The paradox and its causal origin Our central claim is that the load management paradox should not b e interpreted as evidence that pla ying more basketball preven ts injury . Rather, it is consistent with a selection mec hanism built in to game-log data: only play ers who are sufficiently healthy , av ailable, and chosen to participate accum ulate observed w orkload. Conditioning on realized participation therefore induces a nontrivial dep endence betw een recen t w orkload and laten t health status, whic h can in turn distort the estimated w orkload–injury relationship. This mechanism is naturally understo o d through the lens of the health y-work er surviv or effect ( Chec ko w ay et al. , 2004 ; Buckley et al. , 2015 ), a well-kno wn source of bias in occupational and en vironmental epidemiology . In that s etting, individuals who remain at work tend to b e healthier than those who reduce exp osure or lea ve employmen t, so naïv e analyses can generate an apparently protectiv e association b et ween cumulativ e exp osure and adverse health outcomes. More broadly , this 2 is an instance of time-v arying confounding affected b y prior exp osure, for whic h standard regression adjustmen t can fail ( Robins , 1986 ; Robins et al. , 2000 ; Hernán and Robins , 2010 ). The same logic applies in professional basketball. Play ers who contin ue to log heavy min utes are, b y construction, those who ha ve remained healthy enough to sta y on the court, while play ers whose health has deteriorated are less lik ely to accum ulate further observ ed exp osure. As a result, observed workload is not simply a treatment v ariable; it is also a consequence of time-v arying health and selection. This p erspective changes the statistical problem in a fundamental wa y . The difficult y is not merely that the hazard function may b e nonlinear, that pla yer heterogeneity may b e substantial, or that recurren t-even t pro cesses may b e complex. Rather, the primary challenge is one of c ausal identifiability . If the data are generated under time-v arying selection, then increasingly flexible predictiv e mo dels—whether based on splines, frailties, machine learning, or deep neural net works— do not b y themselv es reco ver the causal effect of workload on injury risk. Flexibilit y can reduce appro ximation error, but it cannot remov e bias induced b y conditioning on p ost-baseline v ariables that are jointly determined by latent health and prior exp osure ( Daniel et al. , 2013 ; V anderW eele , 2019 ). This observ ation motiv ates the metho dological agenda of the pap er. W e seek to develop a framew ork that is appropriate for the structure of sp orts injury data while explicitly addressing the causal problem created b y selective participation. Such a framework should satisfy three ob jectiv es. First, it should diagnose and formalize the source of the parado x using a longitudinal causal structure that mak es the selection mechanism transparent ( Greenland et al. , 1999 ; P earl , 2009 ; Kalkhov en , 2024 ). Second, it should retain the strengths of mo dern surviv al analysis, including the abilit y to mo del time-v arying exp osures, recurrent risk, and lagged workload effects flexibly ( Bender et al. , 2018 ; Bender and Scheipl , 2018 ; Ramjith et al. , 2024 ). Third, it should provide a principled strategy for bias reduction, rather than treating the observed workload pro cess as exogenous. The approach developed in this paper pursues these goals by combining causal w eighting with flexible piecewise-exp onen tial surviv al mo deling and w eighted cumulativ e exp osure. In doing so, we aim not only to study load management in the NBA, but also to contribute a broader statistical template for settings in whic h exp osure, observ ation, and even t risk ev olve jointly ov er time. More generally , the pap er illustrates ho w questions that appear, on the surface, to concern nonlinear prediction in sports analytics may instead require a causal framew ork to b e meaningfully interpreted. 1.3 Related work Our research is situated at the in tersection of three distinct metho dological domains: surviv al analysis for sports injuries, causal inference with time-v arying exp osures, and the statistical mo deling of w orkload accumulation. Surviv al analysis in sports injury researc h. A gro wing literature establishes time-to-even t metho ds as the natural framew ork for sp orts injury data, primarily b ecause injury pro cesses inv olve dynamic risk sets, recurrent even ts, and time-v arying exp osures ( Nielsen et al. , 2019a , b ). Within this domain, Bender et al. ( 2018 ) introduced piecewise-exp onen tial additive mo dels (P AMMs), whic h represent the surviv al lik eliho o d through a P oisson regression on interv al-augmented data to p ermit flexible estimation of baseline hazards and cov ariate effects. Bender and Scheipl ( 2018 ) subsequen tly provided the corresp onding softw are implementation. Recen t work has extended P AMMs for applied sp orts settings; for example, Zumeta-Olaskoaga et al. ( 2025 ) incorp orated w eighted cumulativ e exp osure (W CE) terms to model the lagged effects of training load in soccer, 3 while Ramjith et al. ( 2024 ) developed recurrent-ev ent extensions. In basketball, Macis et al. ( 2024 ) applied Co x prop ortional hazards mo dels with frailty terms to NBA injury risk, and W u et al. ( 2025 ) prop osed Bay esian mo dels for subsequen t injuries. Limitation and our departure: A critical limitation of these existing surviv al applications is their reliance on the assumption that exp osure assignment and risk-set inclusion are strictly exogenous. As noted in a recent scoping review ( Cortés et al. , 2025 ), the v ast ma jorit y of surviv al-based sp orts injury studies fail to address non-random selection mechanisms. Our metho d explicitly corrects this ov ersigh t b y embedding an in verse probability weigh ting mechanism directly into the surviv al likelihoo d, adjusting for the realit y that exposure histories and game participation are join tly and endogenously determined. Causal inference for time-v arying exp osures. The necessity of adjusting for join t determina- tion connects directly to the literature on causal inference under time-v arying confounding. Marginal structural mo dels (MSMs), pioneered by Robins et al. ( 2000 ), utilize inv erse probabilit y weigh ting (IPW) to iden tify causal con trasts b y constructing a pseudo-p opulation wherein treatment assignmen t is rendered indep enden t of measured time-v arying confounders. Hernán and Robins ( 2010 ) pro vide a comprehensive treatment of MSMs and related approac hes like g-computation. This framew ork is essen tial when past exp osure affects future confounders th at subsequently influence future exp osure, a dynamic closely mirroring the health y-w orker surviv or effect observ ed in o ccupational epidemiology ( Buc kley et al. , 2015 ). In sp orts science, researchers hav e increasingly adv o cated for such causal p erspectives. Shrier ( 2007 ) argued for causal frameworks in injury prev ention, Kalkhov en ( 2024 ) emphasized the utilit y of directed acyclic graphs, and Imp ellizzeri et al. ( 2019 ) identified collider bias and rev erse causation as paramoun t threats in training load studies. Limitation and our departure: While the sp orts medicine communit y has conceptually recognized these biases, the literature curren tly lacks a unified statistical arc hitecture capable of executing these longitudinal corrections while accommodating distributed lag effects. Our work op erationalizes these conceptual w arnings, moving from theoretical discussions of bias to their rigorous empirical quan tification and correction within a flexible surviv al framework. W orkload–injury research. Empirically , our study is motiv ated by the w orkload–injury litera- ture, where the acute-to-c hronic workload ratio (ACWR) has historically served as the dominan t summary metric ( Gabb ett , 2016 ; Blanc h and Gabb ett , 2016 ). Ho wev er, A CWR suffers from sev ere mathematical coupling ( Lolli et al. , 2019 ), lac ks a coherent causal in terpretation ( Imp ellizzeri et al. , 2020 , 2021 ), and has pro duced highly inconsistent results across meta-analyses ( W ang et al. , 2020 ; Qin et al. , 2025 ). The WCE framework offers a statistically principled alternative by estimating a smo oth weigh ting function to characterize how past exp osures accumulate into current risk ( Sylvestre and Abrahamo wicz , 2009 ; Kelly et al. , 2024 ). In the sp ecific con text of basketball, prior research has explored game load and fatigue ( Lewis , 2018 ), correlates of season-ending in juries ( Menon et al. , 2024 ), and deep learning approac hes for injury prediction ( Cohan et al. , 2021 ; Lee et al. , 2018 ). Limitation and our departure: Despite shifting tow ard more sophisticated machine learning and W CE mo dels, a p erv asive structural blind spot remains. Almost all existing w orkload mo dels inheren tly condition on observed game participation and a v ailable game logs. Our metho dology demonstrates that without causal adjustment, even the most flexible predictive mo dels will absorb this selection bias, structurally underestimating the injury risk of high-workload athletes. 4 1.4 Con tributions and organization T o address the foundational gaps across these three literatures, w e combine causal metho ds for time-v arying exp osures with flexible cumulativ e surviv al models. The sp ecific aim is to accurately estimate injury risk under dynamic participation pro cesses while formally neutralizing selection bias. This pap er mak es four distinct metho dological and empirical con tributions: 1. Causal formalization of the paradox: W e formalize the healthy-w ork er surviv or effect in professional bask etball via a longitudinal causal D AG. This arc hitecture mak es explicit the selection mechanism induced by game participation and clarifies precisely why naive w orkload–injury analyses yield parado xical protective asso ciations. 2. Dev elopmen t of the MS-PEM framework: W e prop ose a marginal structural piecewise- exp onen tial mo del that directly integrates inv erse-probability-of-observ ation weigh ting with piecewise-exp onen tial additive mo dels and weigh ted cumulativ e exp osure. This nov el synthesis unifies causal adjustment for time-v arying selection with flexible hazard regression. 3. Sim ulation-based v alidation: W e ev aluate the proposed approac h in a controlled simulation study . W e demonstrate that the healthy-w orker mechanism is mathematically sufficient to en tirely reverse the sign of the estimated workload weigh t function, whereas our prop osed w eighting strategy substan tially attenuates this artifact and recov ers the true underlying exp osure–risk dynamic. 4. Empirical application and op en-source implemen tation: W e apply the MS-PEM to a comprehensiv e three-season NBA benchmark dataset comprising 78 , 594 observ ations and 2 , 439 injury even ts. Alongside rep orting robust diagnostic evidence and characterizing play er risk profiles across workload tiers, w e pro vide a fully repro ducible Python implementation to facilitate immediate adoption and extension b y the sp orts analytics communit y . Ultimately , this pap er mov es b ey ond simply identifying the flaws in existing predictiv e mo dels. W e contribute a generalized, actionable statistical template for com bining causal inference with surviv al analysis in an y applied setting where exp osure, a v ailability , and ev ent risk co-ev olve longitudinally . The remainder of the article unfolds as follo ws. Section 2 grounds the study by introducing the NBA dataset, providing descriptive evidence of the paradox, formalizing the causal arc hitecture, and establishing the baseline mo dels. Building up on this foundation, Section 3 develops the prop osed MS-PEM metho dology . In Section 4 , w e employ a simulation study to v alidate our approach and isolate the mechanics of the healthy-w orker survivor effect under con trolled conditions. The empirical application is detailed in Section 5 , where we translate the statistical corrections into practical implications for sp orts science. Finally , Section 6 concludes with a syn thesis of the study’s limitations and directions for future metho dological extensions. F or ease of exp osition, supplemental n umerical results and diagnostics are provided in the supplemen tary materials. 2 The NBA W orkload–Injury Problem 2.1 Data sources and construction W e construct surviv al datasets for three NBA regular seasons: 2022–23, 2023–24, and 2024–25 (the “p ost-CO VID era,” after the return to standard 82-game schedules). W e restrict to these seasons for t wo reasons. First, the COVID-affected seasons (2019–20 through 2021–22) featured bubble play , shortened calendars, and mass absences under health-and-safety proto cols that confound injury 5 coun ts with non-injury missed games ( T orres-Ronda et al. , 2022 ; Allahabadi et al. , 2024 ). The compressed 2020–21 schedule raised injury incidence b y 42% relative to pre-pandemic baselines ( Morika wa et al. , 2022 ). Second, publicly av ailable injury data b efore ∼ 2017 lac ks standardized daily rep orting; the NBA’s league-wide injury surveillance system w as refined ov er sev eral y ears ( Mac k et al. , 2019 , 2025 ). Data are collected from three sources: • Game logs : The nba_api pac kage ( Patel , 2026 ) pro vides p er-pla yer, p er-game statistics including minutes play ed, home/a wa y status, and game date. • Injury rep orts : Official NBA injury rep orts are scrap ed from the league’s public archiv es, yielding 12 , 141 (2022–23), 12 , 773 (2023–24), and 14 , 089 (2024–25) raw entries. • Sc hedule data : F ull regular-season schedules ( 2 , 460 games p er season) are obtained via nba_api . Injury definition. An injury event is recorded at the last playe d game b efore a play er is listed as “Out” on the official injury rep ort with a musculosk eletal or trauma-related reason. That is, the ev ent time t stop in the coun ting-pro cess record corresp onds to the cumulativ e min utes at the end of the last game play ed b efore the absence b egins; the play er then exits the risk set un til returning to pla y . This con ven tion ensures that even ts are anchored to pla yed-game interv als, consisten t with the coun ting-pro cess formulation. Absences due to rest, p ersonal reasons, illness, and league susp ension are excluded. After filtering, we retain 8 , 618 (2022–23), 8 , 523 (2023–24), and 9 , 676 (2024–25) injury-related rep orts. Recurren t ev ents. A pla yer may exp erience m ultiple injuries in a season. In the Andersen–Gill framew ork ( Andersen and Gill , 1982 ), each injury constitutes a separate ev ent. After an injury , the pla yer exits the risk set for the duration of the absence and re-en ters when the first play ed game after the absence is recorded. A new even t is distinguished from a contin uation of the p rior absence b y requiring at least one play ed game b etw een successiv e injury episo des. The gap time b et w een the last game b efore absence and the first game after return is not counted tow ard cumulativ e min utes. Coun ting-pro cess format. F or eac h play er–season, w e construct a counting-process dataset in the Andersen–Gill format ( Andersen and Gill , 1982 ). Each row represen ts one game interv al ( i, t start , t stop , δ, x i ( t )) , where t start and t stop are cumulativ e minutes pla yed before and after the game, δ ∈ { 0 , 1 } is the even t indicator, and x i ( t ) is a vector of time-v arying cov ariates. F ollowing Nielsen et al. ( 2019a ), we use cum ulative minutes pla yed as the time scale. Co v ariates. Each pla yer-game observ ation carries: • Rest da ys : calendar days since previous game; also binned as back-to-bac k ( ≤ 1 ), short ( 2 ), normal ( 3 ), and extended ( > 3 ). • Recen t 7-day load : total minutes in the last sev en games. • Consecutiv e games : games without a gap of more than tw o days. • Season phase : early (games 1–27), mid (28–55), late (56–82). • Home/a wa y : binary indicator. • Age and BMI : baseline demographic and anthropometric v ariables. • W orkload tier : four-lev el classification (High-Usage Star, Starting Role Play er, Rotation Pla yer, Low-Min utes Reserve) from K -means clustering; see App endix C . 6 2.2 Descriptiv e evidence: the paradox in ra w data T able 1 summarizes the com bined dataset: 78 , 594 play er-game observ ations across 771 unique pla yers, with 2 , 439 injury ev ents (ov erall rate: 3 . 10% , or 1 . 37 p er 1 , 000 minutes). T able 1: Dataset summary by season. Season Obs Pla yers Ev ents Rate (%) P er 1000 min 2022–23 25,892 539 801 3.09 1.37 2023–24 26,399 572 735 2.78 1.28 2024–25 26,303 569 903 3.43 1.47 Com bined 78,594 771 2,439 3.10 1.37 A first glimpse of the paradox. Figure 1 shows Kaplan–Meier surviv al curves stratified b y game-gap t yp e. Back-to-bac k games show the highest surviv al probability ( 1 . 08 injuries p er 1 , 000 min utes), while extended rest shows the low est ( 1 . 88 p er 1 , 000 minutes). This is the load managemen t parado x in its ra west form: compressed sc heduling app ears protective. As the causal framew ork in Section 2.3 predicts, this pattern is consisten t with selection—pla yers at elev ated risk are rested on bac k-to-back nights, leaving only the healthiest in the sample. Figure 1: Kaplan–Meier surviv al curv es by game-gap category . Bac k-to-back games sho w paradox- ically higher surviv al, consistent with healthy-w orker selection rather than a protectiv e effect of compressed schedules. 7 2.3 Causal structure: a longitudinal D AG The health y-work er surviv or effect in sp orts. The healthy-w orker surviv or effect ( Buckley et al. , 2015 ) is w ell do cumented in o ccupational epidemiology . In the NBA, an analogous mechanism op erates at the game level: play ers who are fatigued, nursing minor complain ts, or at elev ated risk are systematically rested by team medical staffs. The play ers who do take the court are, on av erage, the healthiest members of the roster. This selection is informative : it dep ends on the same latent fitness that also determines injury risk. The D A G. Figure 2 shows the single-timep oin t causal D AG, illustrating ho w the “Playing” no de acts as a collider b et ween observ ed workload, unobserved fitness, and injury . Figure 3 extends this to a time-indexed causal graph. Figure 2: Single-timep oint causal D AG for the workload–injury relationship, sho wing the full set of observ ed and unobserv ed v ariables. The “Pla ying” no de is a collider: conditioning on it op ens a non-causal path b et ween workload and injury through latent fitness. Figure 3 presen ts the time-indexed causal graph. Let t index game opp ortunities. At each t , the data-generating pro cess in volv es four v ariables: • L t : time-v arying cov ariates and cum ulative workload (observed); • U t : laten t fitness (unobserv ed); • A t ∈ { 0 , 1 } : selection indicator (plays the game or is rested); • Y t ∈ { 0 , 1 } : injury outcome. 8 The causal relationships are: L t − → A t , U t 99K A t , L t − → Y t , U t 99K Y t , A t − → Y t , A t − → L t +1 , L t − → L t +1 , U t 99K U t +1 . Dashed arro ws denote pathw ays inv olving the unobserv ed v ariable U t . The selection no de A t is a collider : both L t and U t p oin t in to it. Every game-log analysis implicitly conditions on A t = 1 (only play ed games generate observ ations), which op ens the non-causal path L t → A t ← U t → Y t . This path creates a spurious negativ e asso ciation b et ween w orkload L t and injury Y t : among play ers who do play , those with high cumulativ e loads tend to b e the fittest (otherwise they would hav e b een rested), and fitness is protective against injury . Figure 3: Longitudinal causal D AG for the NBA workload–injury relationship across tw o game p eriods. L t : cov ariates/workload; U t : latent fitness (unobserv ed); A t : game participation (collider); Y t : injury . Conditioning on A t = 1 op ens the non-causal path L t → A t ← U t → Y t , creating the load management paradox. 2.4 Baseline mo dels confirm the paradox T o quantify the paradox b efore dev eloping the bias correction, we fit a Cox prop ortional hazards mo del ( Cox , 1972 ) using the Andersen–Gill extension ( Andersen and Gill , 1982 ) for counting-process data. T able 2 rep orts hazard ratios from the Co x model fitted to 78 , 594 observ ations with 14 cov ariates. Recen t 7-day load sho ws a significant negative asso ciation (HR = 0 . 993 , p < 0 . 001 ): eac h additional 9 min ute in the past week is asso ciated with a 0 . 7% reduction in hazard. Both Starting Role Pla yers and Rotation Play ers show significantly lo wer hazard than Low-Min utes Reserves. These are the first quantitativ e signatures of the paradox. T able 2: Cox prop ortional hazards: hazard ratios with 95% confidence interv als. Co v ariate HR 95% CI p -v alue Age (p er y ear) 1.020 (1.012, 1.028) < 0.001 BMI (p er unit) 0.990 (0.971, 1.010) 0.336 Home game 1.023 (0.954, 1.096) 0.524 Recen t load (7d, p er min) 0.993 (0.992, 0.994) < 0.001 Consecutiv e games 1.005 (0.992, 1.019) 0.440 Gap: short (vs. B2B) 1.031 (0.933, 1.139) 0.552 Gap: normal (vs. B2B) 1.049 (0.929, 1.184) 0.442 Gap: extended (vs. B2B) 0.996 (0.882, 1.123) 0.942 Tier: High-Usage Star 0.954 (0.861, 1.058) 0.372 Tier: Starting Role 0.831 (0.751, 0.919) < 0.001 Tier: Rotation Play er 0.832 (0.762, 0.908) < 0.001 Note: Season-phase cov ariates are included in the mo del but omitted from the table. Bold indicates p < 0 . 05 . Sc ho enfeld residual tests reject proportionality for recen t 7-day load ( p = 0 . 0001 ), the High- Usage Star tier ( p = 0 . 0011 ), and game-gap categories (see Figure 15 ), motiv ating the flexible piecewise-exp onen tial approach developed in Section 3 . 3 The MS-PEM F ramew ork W e now dev elop the marginal structural piecewise-exp onen tial model, a unified framework that com bines (i) flexible surviv al mo deling via piecewise-exponential additive mo dels, (ii) cumulativ e exp osure mo deling via weigh ted cumulativ e exp osure, and (iii) causal bias correction via inv erse probabilit y weigh ting. Figure 4 presents the complete mathematical architecture of the MS-PEM, and Figure 5 provides an o verview of the data-pro cessing pip eline. 10 Figure 4: Mathematical architecture of the MS-PEM framework. Counting-process game-log data feed three interacting comp onents: (1) a logistic selection mo del that estimates game-participation probabilities b π it and pro duces stabilized inv erse-probability w eights d S W it = ¯ π / b π it , creating a pseudo- p opulation free of observed selection bias; (2) a piecewise-exponential additive model (P AMM) with B-spline smo oth terms f 0 , f 1 , f 2 for the baseline hazard, rest-da ys effect, and their interaction on interv al-censored Poisson data; and (3) a w eighted cumulativ e exp osure (WCE) mo dule that summarizes the lagged effect of past min utes via a smo oth weigh t function w ( ℓ ) = P k γ k B k ( ℓ ) ov er L = 10 game lags. The three components are unified in the MS-PEM ob jectiv e: the IPW-rew eighted p enalized P oisson log-likelihoo d with ridge p enalt y α , yielding partially bias-corrected estimates of the workload–injury relationship. 11 Figure 5: The MS-PEM data-pro cessing pip eline. Game-log data are conv erted to counting-process format, then pro cessed along tw o paths: a causal correction path (selection model → stabilized IPW weigh ts) and a surviv al mo deling path (PED transformation → P AMM + W CE). Both paths com bine in the MS-PEM, which fits the IPW-w eighted P AMM+W CE to pro duce partially corrected estimates. 3.1 Causal estimand and iden tifiability T arget parameter. Let ¯ A t = ( A 1 , . . . , A t ) denote the game-participation history and ¯ L t the co v ariate history through time t . The causal estimand is the marginal hazard function in a pseudo-p opulation where game participation is indep enden t of unmeasured confounders: h ∗ ( t | x ( t )) = lim ∆ t → 0 1 ∆ t Pr Y t = 1 | x ( t ) pseudo-pop , where the pseudo-p opulation is created by reweigh ting eac h observ ation to break the asso ciation b et w een A t and U t ( Robins et al. , 2000 ; Hernán and Robins , 2010 ). Under the standard MSM framew ork, this hazard is identified via stabilized inv erse probability weigh ts (see Section 3.4 ). Iden tification assumptions. Under the MSM framework ( Robins et al. , 2000 ; Hernán and Robins , 2010 ), h ∗ is identified if three conditions hold: 1. Consistency : the observ ed outcome under the actual participation history equals the p otential outcome. 12 2. P ositivit y : Pr( A t = 1 | ¯ L t , ¯ A t − 1 ) > 0 for all t and feasible cov ariate histories. 3. Sequen tial exchangeabilit y : Y t ( ¯ a ) ⊥ ⊥ A t | ¯ L t , ¯ A t − 1 —no unmeasured confounders of the participation–outcome relationship at each t . P artial iden tification under violated exc hangeability . W e emphasize that sequential ex- c hangeability is a strong assumption that is unlikely to hold exactly in our setting: latent fitness U t is inheren tly unobserved in publicly a v ailable data, and it affects b oth game participation and injury risk. Our IPW weigh ts condition on observed co v ariates (age, BMI, recen t load, rest da ys, back-to-bac k indicator) and can therefore only partially accoun t for the selection mechanism. F urthermore, as the simulation in Section 4 demonstrates, U t also affects minutes pla yed p er game, creating an additional confounding channel. W e align with the standard applied causal inference approac h by pro ceeding with the MSM metho dology while remaining transparent ab out p oten tial assumption violations ( Hernán and Robins , 2010 ). The IPW-corrected estimates represent a p artial c orr e ction that remov es the comp onen t of selection bias attributable to observed cov ariates, effectively moving the estimates tow ard the causal target without fully reaching it. T o systematically assess the gap b et ween this partial adjustmen t and full causal identification, we rely on four complemen tary analytical to ols wo ven throughout the manuscript. Sp ecifically , we ev aluate cov ariate balance diagnostics alongside a m ulti-sp ecification prop ensit y analysis paired with an AIPW doubly robust chec k in Section 5.2 , in vestigate simulation-based sensitivity to the prop ensity mo del sp ecification in Section 4.3 , and quan tify the potential impact of residual unmeasured confounding using E-v alues in App endix B . 3.2 Piecewise-exp onen tial additive mo del The piecewise-exp onential framew ork ( Bender et al. , 2018 ; Zumeta-Olaskoaga et al. , 2025 ) transforms the surviv al likelihoo d into a Poisson regression on augmented data. W e partition the cum ulative- min utes axis in to J = 20 quantile interv als and create an augmented dataset where, for pla yer i in in terv al j : δ ij | µ ij ∼ Poisson ( µ ij ) , log µ ij = log(∆ t ij ) | {z } offset + η ij . (3.1) The linear predictor includes smo oth B-spline terms: η ij = f 0 ( t j ) | {z } baseline + f 1 ( r i ) | {z } rest days + f 2 ( t j , r i ) | {z } interaction + x ⊤ i β , (3.2) where f 0 is the smo oth baseline log-hazard ( 8 B-spline bases), f 1 is the smo oth rest-days effect ( 6 bases), f 2 is a tensor-prod uct in teraction ( 4 × 4 = 16 bases), and x ⊤ i β includes linear co v ariates. P arameters are estimated b y maximizing the p enalized Poisson log-likelihoo d: ℓ p ( ψ ) = X i,j δ ij log µ ij − µ ij − α 2 θ ⊤ S θ , (3.3) with α selected via 5-fold group ed cross-v alidation. 13 3.3 W eighted cum ulative exp osure The WCE comp onen t ( Sylvestre and Abrahamo wicz , 2009 ) mo dels how min utes pla yed in past games contribute to current hazard: W CE i ( t ) = L X ℓ =1 w ( ℓ ) · m i,t − ℓ , (3.4) where m i,t − ℓ is minutes play ed ℓ games ago and w ( ℓ ) = P K k =1 γ k B k ( ℓ ) is a smo oth weigh t function represen ted via K cubic B-splines with L = 10 lags. The full linear predictor becomes η ij = f 0 ( t j ) + γ ⊤ e z i ( t j ) + x ⊤ i β , (3.5) where e z i ( t ) = B ⊤ M i ( t ) is the WCE feature v ector and B ∈ R L × K is the B-spline basis matrix. 3.4 Selection mo del and in verse probabilit y weigh ting The selection mo del estimates the probability that pla yer i plays in game t : b π it = Pr( A it = 1 | x it ) = logit − 1 ( x ⊤ it α ) , (3.6) where x it includes age, BMI, recent 7-day load, rest da ys, and back-to-bac k indicator. W e exclude consecutiv e games from the selection mo del b ecause it is a p ost-treatmen t v ariable determined by the pla y/rest decision itself. The selection dataset includes b oth pla yed and missed games for all rostered play ers. Eac h play ed-game observ ation receiv es a stabilized weigh t ( Hernán and Robins , 2010 ): d S W it = ¯ π b π it , where ¯ π is the marginal probabilit y of playing, truncated at the 1st and 99th p ercentiles to limit extreme weigh ts. Figure 6 illustrates the effect of IPW: in the pseudo-population, the asso ciation b et ween observ ed co v ariates and playing status is remo ved. T o the extent that observed cov ariates capture the selection mechanism, this atten uates the collider bias path wa y . Because U t remains unobserved, the atten uation is partial. 14 Figure 6: Identification via IPW. In the pseudo-p opulation, the arro ws from observ ed cov ariates to A t are remov ed (crossed-out edges), breaking the collider bias to the extent that observ ed co v ariates capture the selection mechanism. Residual bias from unobserv ed U t remains. 3.5 The unified MS-PEM The MS-PEM in tegrates the causal correction directly into the estimation b y fitting the P AMM+WCE mo del on IPW-reweigh ted data. The three mo dels ab ov e (P AMM, WCE, IPW) are all naive in the causal sense if applied separately: they condition on game participation ( A t = 1 ), which op ens the collider bias pathw ay . The MS-PEM maximizes the IPW-weighte d p enalized log-lik eliho o d: ℓ MS-PEM ( ψ ) = X i,j d S W ij δ ij log µ ij − µ ij − α 2 θ ⊤ S θ . (3.7) This is the marginal structural mo del analog: the IPW weigh ts create a pseudo-p opulation in which selection in to playing is indep enden t of observed co v ariates, and the P AMM+WCE captures the flexible exp osure–response relationship in that pseudo-p opulation. The resulting weigh t function b w MS-PEM ( ℓ ) estimates the partially corrected effect of past workload on curren t injury hazard— partially corrected b ecause the IPW addresses the observ ed comp onen t of selection but cannot eliminate confounding from unmeasured latent fitness. Comparison strategy . T o quan tify the magnitude of selection bias, w e fit b oth the naiv e (un weigh ted) and IPW-corrected (MS-PEM) v ersions of the P AMM+W CE and compare their w eight functions and hazard ratio estimates side b y side. 3.6 Estimation and implementation All mo dels are implemented in Python using statsmodels ( Seab old et al. , 2010 ) for the P oisson GLM and lifelines ( Da vidson-Pilon , 2019 ) for Cox prop ortional hazards. The ridge p enalty 15 parameter α is selected via 5-fold group ed cross-v alidation (group ed b y play er to preven t data leakage). The selection mo del uses scikit-learn ’s logistic regression. The full pipeline—data collection, surviv al formatting, mo del fitting, and figure generation—is released as a repro ducible Python package. 4 Sim ulation Study: V alidating the HWSE and MS-PEM Before applying the MS-PEM to observ ational NBA game logs, we v alidate our framework under con trolled conditions where the true workload–injury asso ciation is known. This simulation is designed to answer t wo critical questions: First, is the healthy-w orker survivor effect (HWSE) mathematically sufficient to rev erse the sign of a true p ositiv e hazard effect? Second, to what exten t can Inv erse Probabilit y of T reatment W eighting (IPTW) recov er the true causal effect when unmeasured latent fitness confounds b oth participation and exposure v olume? 4.1 Data-generating pro cess W e simulate a stylized professional sp orts season consisting of N = 500 pla yers, each with T = 80 game opp ortunities. The data-generating pro cess (DGP) explicitly enco des the HWSE through dual c hannels of confounding: • Laten t fitness: U it follo ws an AR(1) pro cess with p ersistence ρ = 0 . 95 and an innov ation standard deviation σ U = 0 . 3 . This creates stable, auto-correlated b etw een-play er differences in baseline fitness. • Selection mo del (Participation): The probability of playing a given game is Pr ( A it = 1 | U it , age i ) = logit − 1 (1 . 5 + 2 . 0 · U it − 0 . 03 · age i ) . Consequen tly , fitter pla yers are substan tially more likely to b e selected to play . • Con tin uous exp osure (Min utes play ed): Conditional on participating ( A it = 1 ), minutes dep end hea vily on laten t fitness: m it ∼ N (25 + 3 · U it , 5 2 ) , clipp ed to the interv al [10 , 40] . This creates a secondary channel of confounding: fitter pla y ers not only play more games, but they log heavier minutes when they do pla y . • T rue weigh t function: The true lagged effect of workload on injury is p ositiv e , defined as w ∗ ( ℓ ) = 0 . 005 · exp ( − 0 . 2 ℓ ) for lags ℓ = 1 , . . . , 10 . In this ground-truth realit y , hea vier recent min utes actively increase subsequen t injury hazard. • Injury mo del: The true injury hazard conditional on playing is Pr ( Y it = 1 | A it = 1) = logit − 1 ( − 3 . 5 − 1 . 0 · U it + 0 . 03 · age i + W CE i ( t )) , where the weigh ted cumulativ e exp osure (W CE) is computed strictly using the true p ositive weigh t function w ∗ ( ℓ ) . The defining feature of this DGP is that U it acts as a p erv asiv e, unmeasured confounder. It drives b oth discrete selection (who pla ys) and con tinuous exp osure (how muc h they pla y), mirroring the complex realities of NBA rotation management that standard game-log analyses fail to disentangle. W e compare tw o primary settings: (i) no selection bias ( α U = 0 , γ U = 0 ), where all confounding c hannels are neutralized, and (ii) the HWSE presen t , reflecting the full DGP describ ed ab o ve. F or each scenario, we execute 50 Monte Carlo replications. 4.2 Results: The mechanics of sign reversal Figure 7 presen ts the estimated weigh t functions a veraged across the 50 replications. The results demonstrate how easily standard surviv al mo dels are compromised by structural selection bias. 16 Figure 7: Sim ulation results: estimated weigh t functions b w ( ℓ ) across 50 replications. (a) Without selection bias, naive estimators successfully recov er the true p ositiv e weigh t function. (b) Under the HWSE, the naive estimator entirely reverses the sign: the true p ositiv e effect ( w ∗ (1) = +0 . 004 ) is falsely estimated as strongly negative ( b w (1) = − 0 . 023 ). IPW utilizing observ ed cov ariates provides a partial correction, shifting the curv e back tow ard the truth. No selection bias. When the HWSE channels are disabled, the naive P oisson GLM with a B-spline WCE recov ers the true w eight function with high fidelit y . The mean estimated w eigh t at lag 1 is b w (1) = +0 . 0039 , precisely mirroring the true v alue of w ∗ (1) = +0 . 0041 , with a negligible mean bias of − 0 . 0004 across all lags. F urthermore, the baseline demographic co efficien ts are p erfectly reco vered (estimated age effect = 0 . 025 , true = 0 . 030 ). HWSE present. Crucially , under the full data-generating p rocess, the naive estimator completely rev erses the sign of the w eight function. The estimated weigh t at lag 1 collapses to b w (1) = − 0 . 023 against the true w ∗ (1) = +0 . 004 . The en tire weigh t function at recen t lags b ecomes steeply negative, p erfectly repro ducing the paradoxical artifact observ ed in the real NBA empirical data. Applying IPTW using the observ ed cov ariates (age and recen t 7-day load) provides a partial, but incomplete, correction. The IPW-adjusted estimate improv es to b w IPW (1) = − 0 . 021 , an 18% reduction in the magnitude of the spurious negativ e asso ciation. This partial correction is theoretically exp ected: while IPTW adjusts for the binary selection mec hanism ( A it ) based on observ able proxies of fitness, it cannot fully deconfound the secondary con tinuous channel ( m it ) driv en by the unobserv ed U it . 4.3 Sensitivit y to selection strength and recurren t ev ents T o assess the robustness of the sign-rev ersal phenomenon, w e v aried the strength of the healthy- w orker mec hanism across four configurations: no selection ( α U = 0 , γ U = 0 ), weak ( α U = 0 . 5 , γ U = 1 . 0 ), mo derate ( α U = 1 . 0 , γ U = 2 . 0 ), and strong ( α U = 2 . 0 , γ U = 3 . 0 ). 17 T able 3: Simulation: mean weigh t-function bias across selection-strength scenarios. Scenario α U γ U Naiv e Bias IPW Bias Ev ent Rate None 0.0 0.0 − 0 . 0008 − 0 . 0008 6.1% W eak 0.5 1.0 − 0 . 0040 − 0 . 0039 5.5% Mo derate 1.0 2.0 − 0 . 0055 − 0 . 0051 4.9% Strong 2.0 3.0 − 0 . 0057 − 0 . 0047 3.9% Note: Bias is calculated as the mean of b w ( ℓ ) − w ∗ ( ℓ ) across all lags and replications. The IPW mo del utilizes observ ed cov ariates (age, recen t load). As detailed in T able 3 and Figure 8 , the magnitude of the bias increases monotonically with selection strength, confirming that the HWSE mechanism is the direct engine of the sign rev ersal. Concurren tly , the efficacy of the IPW correction also scales with selection strength ( 3% correction under weak selection, 8% under mo derate, and 18% under strong). This aligns with causal inference theory: reweigh ting b ecomes more informative when selection is pronounced and the prop ensit y mo del captures a larger share of the structural v ariance. 18 Figure 8: Simulation: estimated w eight functions across four selection-strength scenarios. The bias scales monotonically with the severit y of the selection mec hanism, with IPW correction proving most effective under the strong-selection DGP . Prop ensit y model missp ecification. As a stress test, w e compared a correctly sp ecified prop ensit y mo del (age, recen t load) against a missp ecified mo del (age only) under the strong-selection DGP . The missp ecified mo del provided zero correction (mean bias = − 0 . 0057 , iden tical to the naive estimate), while the correctly sp ecified mo del reduced the bias to − 0 . 0048 ( 17% improv emen t). This highlights that the magnitude of correction observ ed in our real-data application is inheren tly constrained by the richness of the co v ariate set a v ailable in public game logs. Recurren t-ev ent dep endence. Finally , w e tested the framew ork under a mo dified DGP where prior injuries activ ely reduce subsequent fitness (e.g., an injury p enalty of 1 . 0 , deca ying at a rate of 0 . 9 p er game). This introduces recurrent-ev en t frailt y , a hallmark of sp orts medicine where past injuries are the strongest predictor of future injuries. The structural bias pattern remained qualitativ ely identical: the naive bias w as − 0 . 0054 , and the IPW-corrected bias was − 0 . 0042 ( 24% impro vemen t). This confirms that the paradoxical sign-reversal p ersists even under complex, ev ent-dependent biological frailties. 19 4.4 Implications for the empirical application The sim ulation study cements tw o foundational premises for our empirical analysis of NBA load managemen t. First, it prov es that the HWSE is mathematically sufficien t to entirely reverse the sign of the w orkload–injury asso ciation. Second, it demonstrates that applying IPW using observ able game-log v ariables pro vides a reliable, alb eit partial, correction. It forces the estimated hazard back to ward the physiological truth, even when unmeasured latent fitness remains. 5 Application to NBA Load Managemen t: Deconfounding the W orkload–Injury P aradox 5.1 The naive artifact: Quan tifying the parado x T o ev aluate the workload–injury relationship, w e first fit the uncorrected Piecewise Exp onential A dditive Mixed Mo del (P AMM) with weigh ted cumulativ e exp osure (WCE) to the 96 , 960 augmen ted observ ations. This baseline mo del ac hieves a substantial improv ement in fit (AIC = 24 , 836 vs. 112 , 360 for a standard P AMM) utilizing fewer effective parameters ( 12 . 3 vs. 19 . 9 ). Figure 9 displays the estimated weigh t function b w ( ℓ ) . All estimated weigh ts are negativ e , with the largest magnitude app earing at lag 5 ( b w (5) = − 0 . 134 ) and remaining consistently b elo w zero across the full 10-game window ( b w (1) = − 0 . 096 , b w (10) = − 0 . 089 ). Interpreted naively , this suggests that pla yers who log hea vier minutes in recent games face a lower subsequent injury hazard. Ph ysiologically , it is highly improbable that playing heavy minutes five games ago activ ely shields a pla yer from acute injury to da y . Instead, this u niformly negative weigh t p erfectly encapsulates the mathematical signature of the load management paradox. As demonstrated in our prior sim ulations, this pattern is the expected artifact of the healthy-w ork er survivor effect (HWSE) built into the game-log data, wherein only the most robust play ers are p ermitted to accumulate con tinuous exp osure. Figure 9: Naive weigh t function b w ( ℓ ) o ver a 10- game lag window. All weigh ts are negative, illustrating the defining signature of the load managemen t paradox. The sim ulation study (Section 4 ) confirms the HWSE can artificially pro duce this entire pattern. 20 5.2 MS-PEM correction and selection dynamics Selection mo del. T o disentangle workload from laten t health, our Marginal Structural Piecewise Exp onen tial Mo del (MS-PEM) first mo dels the selection mechanism: the probability of game participation Pr ( A it = 1 | x it ) . The logistic regression rev eals highly informativ e selection dynamics. F actors such as bac k-to-back scheduling (OR = 1 . 49 ), recen t 7-day load (OR = 1 . 02 ), and BMI (OR = 1 . 02 p er unit) are strong predictors of pla ying time. These o dds ratios suggest a league-wide pattern where rest is strategically deplo yed during dense schedule patches (back-to-bac ks), while hea vier pla yers are managed differently . Crucially , this confirms our structural h yp othesis: healthier, more active play ers are selectiv ely chosen to participate. IPW w eigh t diagnostics and co v ariate balance. Applying In verse Probability of T reatmen t W eigh ting (IPTW), the stabilized weigh ts exhibit a mean of 0 . 90 (range: [0 . 42 , 2 . 45] ), retaining 77% of the original effective sample size ( n eff = 74 , 741 of 96 , 960 ). The mean w eight below 1 . 0 reflects the stabilization structure ( ¯ π / b π ) and the fundamental asymmetry b et ween marginal and conditional pla y rates in professional sp orts. T able 4 rep orts standardized mean differences (SMDs) b efore and after IPW reweigh ting. While the IPW successfully balances baseline demographics (SMDs for age and BMI drop well below 0 . 10 ), time-v arying co v ariates lik e recen t load and rest days retain larger SMDs ( 0 . 96 and 0 . 67 , resp ectiv ely). T able 4: Cov ariate balance b efore and after IPW rew eighting (standardized mean differences). Co v ariate Mean (Play ed) Mean (Rested) SMD (Before) SMD (After) Age 25.44 25.11 0.08 0.05 BMI 24.64 24.44 0.11 0.06 Recen t load (7d) 125.5 18.5 1.72 0.96 Rest days 5.23 103.5 0.74 0.67 Bac k-to-back 0.128 0.025 0.39 0.27 Note: SMD = | mean play ed − mean rested | / p ooled SD. W e emphasize that applying conv entional cross-sectional balance thresholds (e.g., SMD < 0 . 10 ) to time-v arying co v ariates in a longitudinal MSM is conceptually misplaced. As established b y Cole and Hernán ( 2008 ) and Robins et al. ( 2000 ), the IPW pseudo-p opulation ensures the joint indep endence of the entir e tr e atment history and the c onfounder history , rather than enforcing marginal balance at eac h discrete time p oin t. F urthermore, the p ersisten t imbalance in recen t load reflects a near-structural p ositivit y issue ( P etersen et al. , 2012 ): a play ed game has a nonzero recen t load by definition. This creates a distributional separation that parallels the “informative-presence bias” well-documented in electronic health records ( Goldstein et al. , 2016 ), where observ ation in tensity is inheren tly correlated with underlying health status. Figure 10 nev ertheless demonstrates substan tial o verlap in the prop ensit y score distributions in regions where play/rest decisions are most uncertain. 21 Figure 10: Propensity score ov erlap: distribution of b π it = Pr ( A it = 1 | x it ) for play ed (blue) and rested (orange) games. The substantial ov erlap supp orts approximate p ositivit y in the clinically relev ant subp opulation. 5.3 Corrected hazard surfaces and sensitivit y Figure 11 compares the naive and IPW-corrected weigh t functions. Under a cross-v alidated p enalt y , the MS-PEM shrinks the negative weigh ts tow ard zero by 1 – 2% across all lags. Ho wev er, this correction magnitude is highly sensitive to the outcome-mo del p enalization. Figure 11: WCE weigh t functions: naiv e (a) vs. MS-PEM corrected (b). While conserv ative CV- regularization yields a 1 – 2% atten uation, lighter fixed penalties yield upw ards of 78% atten uation, though the p ositiv e direction of the correction remains remarkably stable. As detailed in T able 5 , when utilizing a lighter, fixed regularization ( α = 0 . 1 ) across multiple prop ensit y sp ecifications (Logistic, GBM, Ensemble, and Ov erlap W eigh ting ( Li et al. , 2018 )), the atten uation ranges from 63% to 78% . Overlap weigh ting, which targets the subp opulation where 22 clinical equip oise holds, pro duces the strongest attenuation ( 78 . 0% ). The con vergence of these distinct prop ensit y metho ds provides strong qualitativ e evidence that the parado x is primarily driv en by confounding. Ev en if the exact quantitativ e correction is tethered to the outcome mo del’s h yp erparameter, the dir e ction of the correction is unequiv o cal. T able 5: Sensitivity of the W CE weigh t function to prop ensity mo del sp ecification ( α = 0 . 1 ). Metho d b w (1) A tten uation (%) ESS ESS (%) Naiv e (unw eigh ted) − 0 . 094 — 96,960 100.0 IPW-Logistic − 0 . 023 75.7 43,136 61.5 IPW-GBM − 0 . 035 62.8 14,393 20.5 IPW-Ensem ble − 0 . 028 70.2 26,868 38.3 Ov erlap − 0 . 021 78.0 40,061 57.1 The shift in the hazard surface (see Figure 12 ) demonstrates the practical impact of this correction. By adjusting for selection, the MS-PEM elev ates the hazard rates at high cumulativ e loads compared to the naive surface. Once we mathematically account for the fact that only the fittest pla yers survive to accumulate high loads, we find that the true underlying risk of that accum ulated load is substan tially higher than naiv e mo dels imply . Figure 12: Hazard surface comparison. (a): naive (biased) estimates. (b): MS-PEM (IPW-corrected) estimates. The corrected surface shows elev ated hazard at high cumulativ e workloads, p eeling bac k the protective illusion of the HWSE. 5.4 Pla y er risk profiles and the inv erted load gradien t The load managemen t parado x do es not manifest uniformly across the league; it is highly dep endent on pla yer role. T able 6 demonstrates that Lo w-Min utes Reserves suffer the highest p er-min ute injury rate ( 2 . 49 p er 1 , 000 min utes)—more than double that of Starting Role Play ers. This lik ely stems from a combination of cold-starts off the b enc h, erratic intensit y , and the selectiv e reality that the most durable reserves are contin uously promoted out of this tier and into heavier rotation roles. 23 T able 6: Injury statistics by w orkload tier. Tier Pla yer-Games Ev ents Rate (%) P er 1000 min High-Usage Star 16,261 705 4.34 1.31 Starting Role Play er 16,528 508 3.07 1.17 Rotation Play er 33,361 879 2.63 1.31 Lo w-Minutes Reserve 12,444 347 2.79 2.49 Ho wev er, the paradox is most striking among High-Usage Stars. As illustrated in Figure 13 , this cohort exhibits an in verted load gradien t : p er-game injury rates actually de cr e ase from 4 . 58% in the low est recen t-load quartile to 3 . 73% in the highest. Among NBA stars, those with the heaviest recen t workloads are precisely those who are healthy enough to sustain them, artificially driving do wn their observ ed injury rate. Figure 13: Injury rate (%) by workload tier and recent 7-da y load quartile. High-Usage Stars exhibit a paradoxical inv erted gradient (higher load corresp onds to low er injury rate), the direct tier-level manifestation of selection bias. 6 Discussion and Concluding Remarks 6.1 Resolving the load managemen t paradox Naiv e surviv al mo dels applied to NBA game-log data consisten tly pro duce a dangerous paradox: pla yers who recently logged hea vy min utes appear less likely to sustain an injury . In this pap er, w e hav e demonstrated that this paradox is not evidence of a physiological protective effect, but 24 rather the mathematical artifact of the health y-work er surviv or effect (HWSE). By formalizing the problem via a longitudinal causal DA G, w e identified sev ere collider bias at the game-participation no de: only the most robust, healthy play ers are selected b y coac hes to accumulate high w orkloads. Our prop osed Marginal Structural Piecewise Exponential Mo del (MS-PEM) provides the first bias-a ware surviv al analysis of NBA injury risk that formally addresses this selection mechanism. By unifying inv erse probability of treatmen t weigh ting (IPTW) with flexible piecewise-exp onen tial additiv e mo dels and w eighted cumulativ e exp osure (WCE), w e offer a metho dological template for detecting, quantifying, and partially correcting this bias. The IPW correction attenuates the paradoxical WCE weigh ts b y 1 – 2% under conserv ative cross- v alidated regularization, and b y 63 – 78% under ligh ter p enalization across four distinct propensity sp ecifications. This range, supp orted b y an AIPW doubly robust chec k consisten t with adequate outcome-mo del sp ecification, indicates that while the exact magnitude of the correction remains sensitiv e to regularization, the dir e ction of the correction is highly stable. As confirmed by our sim ulation study in Section 4 , the HWSE is entirely sufficient to rev erse the sign of a true p ositive w orkload–injury asso ciation, and adjusting for observed selection reliably shifts the hazard bac k to ward the true underlying risk. 6.2 The structural nature of the bias across sp orts The implications of this paradox extend far b eyond professional basketball. A ny observ ational analysis of workload and injury that conditions on athlete participation is highly susceptible to this structural bias. This encompasses w orkload studies in so ccer ( Zumeta-Olaskoaga et al. , 2025 ), rugb y ( Bache-Mathiesen et al. , 2022 ), and cric ket, as well as the v ast literature relying on the A cute:Chronic W orkload Ratio (A CWR) ( Gabb ett , 2016 ) computed strictly from play ed-game data. Because this bias arises directly from the causal graph top ology rather than from sample size limitations or functional form missp ecification, standard predictiv e mo dels—including highly flexible mac hine learning approac hes—will reliably learn and amplify this artifact if they are not explicitly constrained by a causal framework. 6.3 Limitations of observ ational correction The most consequential limitation of this framew ork is that IPW only corrects for selection on observe d cov ariates; it cannot entirely eliminate bias emanating from unobserved latent fitness. Because the exact fraction of selection captured b y observ ed cov ariates cannot b e p erfectly determined from game logs alone, we view the MS-PEM as providing a p artial ly c orr e cte d estimate. Our sim ulation study highlights this limit: when latent fitness also dictates contin uous exp osure v ariations (e.g., minute restrictions within a game), IPW provides incomplete correction even when the binary selection confounder is known. F urthermore, our injury definition inherits the coarseness of official NBA injury rep orts ( Mack et al. , 2019 ). Minor complain ts that do not result in an “Out” status go unrecorded, and prophylactic rest absences ma y o ccasionally mask underlying micro-traumas. W e also treat all injuries as a single outcome class, despite acute contact injuries and c hronic ov eruse conditions lik ely following differen t etiological pathw ays ( T orres-Ronda et al. , 2022 ). Finally , the workload tier classification is constructed from season-level summaries, making it a p ost-baseline, exp osure-con taminated construct rather than a clean baseline cov ariate; this must b e kept in mind when in terpreting tier-stratified results. 25 6.4 Practical implications and future directions F or NBA front offices and sp orts science staffs, the central takea w ay is highly actionable: workload– injury mo dels that blindly condition on game participation will systematically underestimate injury risk for high-w orkload play ers. This is most acutely visible among High-Usage Stars, who exhibit an inv erted load gradien t—the clearest tier-lev el evidence of the paradox. Relying on naiv e mo dels ma y lead teams to falsely conclude that heavy w orkloads are “safe” for their most v aluable play ers, when in reality , those w orkloads are simply a mark er of peak baseline fitness. F ully deconfounding the workload–injury relationship to optimize rest-day p olicies requires mo ving b ey ond observ ational game logs. Bridging the remaining gap to full causal identification will require: 1. W earable sensor data : Con tinuous physiological monitoring (e.g., heart rate v ariability , accelerometry) that captures latent fitness directly , closing the unobserved confounding gap. 2. Instrumen tal v ariables : Sources of exogenous v ariation in w orkload (e.g., schedule random- izations, acute trav el disruptions) unrelated to injury risk through other paths. 3. Negativ e con trols : Utilizing exp osure and outcome v ariables known to b e causally null to b enc hmark residual confounding ( Hernán and Robins , 2010 ). Ultimately , sp orts analytics must transition from predictive asso ciations to causal realities. Metho dologies like the MS-PEM provide the necessary first step, demonstrating that without ac knowledging playing time as a consequence of health, w e cannot accurately measure it as a cause of injury . Co de av ailability . All co de, data collection scripts, and analysis noteb ooks are a v ailable at https://github.com/ khrisyu9/nba- load- management . References Allahabadi, S. , Galiv anche, A. R. , Coss, N. , Tenzing, N. , Ga tto, A. P. , Murra y, J. C. , Allahabadi, S. and P andy a, N. K. (2024). Severe acute respiratory syndrome coronavirus 2 did not substantially impact injury patterns or p erformance of play ers in the national basketball asso ciation from 2016 to 2021. A rthr osc opy, Sp orts Me dicine, and R ehabilitation 6 100841. Andersen, P. K. and Gill, R. D. (1982). Cox’s regression mo del for counting pro cesses: a large sample study . The annals of statistics 1100–1120. Bache-Ma thiesen, L. K. , Andersen, T. E. , Dalen-Lorentsen, T. , Clarsen, B. and F agerland, M. W. (2022). Assessing the cumulativ e effect of long-term training load on the risk of injury in team sp orts. BMJ Op en Sp ort & Exer cise Me dicine 8 . Bahr, R. and Krossha ug, T. (2005). Understanding injury mechanisms: a key comp onent of prev enting injuries in sp ort. British journal of sp orts me dicine 39 324–329. Bender, A. , Groll, A. and Scheipl, F. (2018). A generalized additive mo del approac h to time-to-ev ent analysis. Statistic al Mo del ling 18 299–321. 26 Bender, A. and Scheipl, F. (2018). pammtools: Piece-wise exp onen tial additive mixed mo deling to ols. arXiv pr eprint arXiv:1806.01042 . Blanch, P. and Gabbett, T. J. (2016). Has the athlete trained enough to return to play safely? the acute: c hronic w orkload ratio p ermits clinicians to quantify a pla yer’s risk of subsequen t injury . British journal of sp orts me dicine 50 471–475. Buckley, J. P. , Keil, A. P. , McGra th, L. J. and Ed w ards, J. K. (2015). Ev olving methods for inference in the presence of health y work er survivor bias. Epidemiolo gy 26 204–212. Checko w a y, H. , Pearce, N. and Kriebel, D. (2004). R ese ar ch metho ds in o c cup ational epidemiolo gy , vol. 34. Oxford Univ ersity Press. Cohan, A. , Schuster, J. and Fernandez, J. (2021). A deep learning approac h to injury forecasting in nba basketball. Journal of Sp orts A nalytics 7 277–289. Cole, S. R. and Hernán, M. A. (2008). Constructing in verse probability weigh ts for marginal structural mo dels. A meric an journal of epidemiolo gy 168 656–664. Cor tés, J. , Nielsen, R. O. and Casals, M. (2025). Metho dological quality and reporting using time-to-ev ent data in sp orts science and medicine: a scoping review. BMJ Op en Sp ort & Exer cise Me dicine 11 . Co x, D. R. (1972). Regression mo dels and life-tables. Journal of the r oyal statistic al so ciety: Series B (metho dolo gic al) 34 187–202. D aniel, R. M. , Cousens, S. N. , De St a vola, B. L. , Kenw ard, M. G. and Sterne, J. A. (2013). Metho ds for dealing with time-dep enden t confounding. Statistics in me dicine 32 1584–1618. D a vidson-Pilon, C. (2019). lifelines: surviv al analysis in python. Journal of Op en Sour c e Softwar e 4 1317. F ox, J. L. , St anton, R. , Sargent, C. , Wintour, S.-A. and Scanlan, A. T. (2018). The asso ciation b et ween training load and p erformance in team sp orts: a systematic review. Sp orts Me dicine 48 2743–2774. Gabbett, T. J. (2016). The training—injury prev ention parado x: should athletes b e training smarter and harder? British journal of sp orts me dicine 50 273–280. Goldstein, B. A. , Bha vsar, N. A. , Phelan, M. and Pencina, M. J. (2016). Controlling for informed presence bias due to the num b er of health encounters in an electronic health record. A meric an journal of epidemiolo gy 184 847–855. Greenland, S. , Pearl, J. and R obins, J. M. (1999). Causal diagrams for epidemiologic research. Epidemiolo gy 10 37–48. Hernán, M. A. and Robins, J. M. (2010). Causal infer enc e . CR C Bo ca Raton, FL. Impellizzeri, F. M. , Mar cora, S. M. , Coutts, A. J. et al. (2019). In ternal and external training load: 15 years on. Int J Sp orts Physiol Perform 14 270–273. 27 Impellizzeri, F. M. , Tenan, M. S. , Kempton, T. , Nov ak, A. and Coutts, A. J. (2020). A cute: chronic w orkload ratio: conceptual issues and fundamental pitfalls. International journal of sp orts physiolo gy and p erformanc e 15 907–913. Impellizzeri, F. M. , W oodcock, S. , Coutts, A. , F anchini, M. , McCall, A. and Vigotsky, A. (2021). What role do c hronic workloads play in the acute to chronic workload ratio? time to dismiss acwr and its underlying theory . Sp orts Me dicine 51 581–592. Jolliffe, I. T. and Cadima, J. (2016). Principal comp onen t analysis: a review and recen t dev elopments. Philosophic al tr ansactions of the r oyal so ciety A: Mathematic al, Physic al and Engine ering Scienc es 374 20150202. Kalkhoven, J. T. (2024). Athletic injury research: frameworks, mo dels and the need for causal kno wledge. Sp orts Me dicine 54 1121–1137. Kell y, T.-L. , Sal ter, A. and Pra tt, N. L. (2024). The weigh ted cumulativ e exp osure metho d and its application to pharmaco epidemiology: a narrativ e review. Pharmac o epidemiolo gy and drug safety 33 e5701. Lee, C. , Zame, W. , Yoon, J. and V an Der Schaar, M. (2018). Deephit: A deep learning approac h to surviv al analysis with comp eting risks. In Pr o c e e dings of the AAAI c onfer enc e on artificial intel ligenc e , v ol. 32. Lewis, M. (2018). It’s a hard-kno c k life: Game load, fatigue, and injury risk in the national bask etball asso ciation. Journal of A thletic T r aining 53 503–509. Li, F. , Mor gan, K. L. and Zasla vsky, A. M. (2018). Balancing cov ariates via prop ensit y score w eighting. Journal of the A meric an Statistic al A sso ciation 113 390–400. Llo yd, S. (1982). Least squares quantization in p cm. IEEE tr ansactions on information the ory 28 129–137. Lolli, L. , Ba tterham, A. M. , Ha wkins, R. , Kell y, D. M. , Strud wick, A. J. , Thorpe, R. , Gregson, W. and A tkinson, G. (2019). Mathematical coupling causes spurious correlation within the con ven tional acute-to-c hronic w orkload ratio calculations. British journal of sp orts me dicine 53 921–922. Ma cis, A. et al. (2024). The role of the frailty in the ev aluation of injury risk factors for national bask etball asso ciation play ers. Computational Statistics 40 1985–2003. Mack, C. D. , Herzog, M. M. , Maak, T. G. , Bedi, A. , Gond alia, R. , Meisel, P. , Azar, F. M. , Mancell, J. , Nelson, A. and DiFiori, J. (2025). Epidemiology of injuries among national basketball asso ciation play ers: 2013-2014 through 2018-2019. Sp orts he alth 17 585–593. Mack, C. D. , Meisel, P. , Herzog, M. M. , Callahan, L. , O akkar, E. E. , W alden, T. , Sharpe, J. , Dreyer, N. A. and DiFiori, J. (2019). The establishmen t and refinemen t of the national basketball asso ciation play er injury and illness database. Journal of athletic tr aining 54 466–471. Meeuwisse, W. H. (1994). Assessing causation in sp ort injury: a m ultifactorial mo del. Clinic al Journal of Sp ort Me dicine 4 166–170. 28 Meeuwisse, W. H. , Tyreman, H. , Hagel, B. and Emer y, C. (2007). A dynamic model of etiology in sp ort injury: the recursiv e nature of risk and causation. Clinic al journal of sp ort me dicine 17 215–219. Menon, S. , Morika w a, L. , Tummala, S. V. , Buckner-Petty, S. and Chhabra, A. (2024). The primary risk factors for season-ending injuries in professional basketball are minutes play ed p er game and later season games. A rthr osc opy : The Journal of A rthr osc opic & R elate d Sur gery 40 2468–2473. Morika w a, L. H. , Tummala, S. V. , Brinkman, J. C. , Buckner Petty, S. A. and Chhabra, A. (2022). Effect of a condensed nba season on injury risk: An analysis of the 2020 season and pla yer safety . Orthop ae dic journal of sp orts me dicine 10 23259671221121116. Nielsen, R. O. , Ber telsen, M. L. , Ramsko v, D. , Møller, M. , Hulme, A. , Theisen, D. , Finch, C. F. , For tington, L. V. , Mansournia, M. A. and P arner, E. T. (2019a). Time- to-ev ent analysis for sp orts injury research part 1: time-v arying exp osures. British journal of sp orts me dicine 53 61–68. Nielsen, R. O. , Ber telsen, M. L. , Ramsko v, D. , Møller, M. , Hulme, A. , Theisen, D. , Finch, C. F. , For tington, L. V. , Mansournia, M. A. and P arner, E. T. (2019b). Time- to-ev ent analysis for sp orts injury research part 2: time-v arying outcomes. British journal of sp orts me dicine 53 70–78. P a tel, S. (2026). n ba_api: An api client pac kage to access the apis of n ba.com. https://github. com/swar/nba_api . Python pac kage, version 1.11.4, accessed 2026-03-04. Pearl, J. (2009). Causality . Cambridge univ ersity press. Petersen, M. L. , Por ter, K. E. , Gruber, S. , W ang, Y. and V an Der Laan, M. J. (2012). Diagnosing and resp onding to violations in the p ositivity assumption. Statistic al metho ds in me dic al r ese ar ch 21 31–54. Powell, S. (2024). Nba sends teams the results found in load management study . https: //www.nba.com/news/nba- sends- data- load- management- study . A ccessed: 2026-03-04. Qin, W. , Li, R. and Chen, L. (2025). Acute to chronic workload ratio (acwr) for predicting sp orts injury risk: a systematic review and meta-analysis. BMC Sp orts Scienc e, Me dicine and R ehabilitation 17 285. Ramjith, J. , Bender, A. , R oes, K. C. and Jonker, M. A. (2024). Recurren t even ts analysis with piece-wise exp onen tial additive mixed mo dels. Statistic al Mo del ling 24 266–287. R obins, J. M. (1986). A new approach to causal inference in mortality studies with a sustained exp osure p eriod—application to control of the healthy w orker surviv or effect. Mathematic al Mo del ling 7 1393–1512. R obins, J. M. , Hernan, M. A. and Brumba ck, B. (2000). Marginal structural mo dels and causal inference in epidemiology . Epidemiolo gy 11 550–560. R ousseeuw, P. J. (1987). Silhouettes: a graphical aid to the in terpretation and v alidation of cluster analysis. Journal of c omputational and applie d mathematics 20 53–65. 29 Seabold, S. , Perktold, J. et al. (2010). Statsmodels: econometric and statistical mo deling with python. scipy 7 92–96. Shrier, I. (2007). Understanding causal inference: the future direction in sp orts injury prev ention. Clinic al journal of sp ort me dicine 17 220–224. Soligard, T. , Schwellnus, M. , Alonso, J.-M. , Bahr, R. , Clarsen, B. , Dijkstra, H. P. , Gabbett, T. , Gleeson, M. , Hägglund, M. , Hutchinson, M. R. et al. (2016). How m uch is to o m uch?(part 1) in ternational olympic committee consensus statement on load in sp ort and risk of injury . British journal of sp orts me dicine 50 1030–1041. Syl vestre, M.-P. and Abrahamowicz, M. (2009). Flexible mo deling of the cumulativ e effects of time-dep enden t exp osures on the hazard. Statistics in me dicine 28 3437–3453. Torres-R onda, L. , Gámez, I. , R ober tson, S. and Fernández, J. (2022). Epidemiology and injury trends in the national basketball asso ciation: Pre-and p er-co vid-19 (2017–2021). PL oS one 17 e0263354. V anderWeele, T. J. (2019). Principles of confounder selection: Tj v anderweele. Eur op e an journal of epidemiolo gy 34 211–219. V anderWeele, T. J. and Ding, P. (2017). Sensitivity analysis in observ ational researc h: in tro ducing the e-v alue. A nnals of internal me dicine 167 268–274. W ang, C. , V argas, J. T. , Stokes, T. , Steele, R. and Shrier, I. (2020). Analyzing activit y and injury: lessons learned from the acute: chronic w orkload ratio. Sp orts Me dicine 50 1243–1254. Windt, J. and Gabbett, T. J. (2017). Ho w do training and comp etition workloads relate to injury? the workload—injury aetiology mo del. British journal of sp orts me dicine 51 428–435. Wu, P. P.-Y. , Yu, Y. Y. , Toohey, L. A. , Drew, M. , Sisson, S. A. , Grazian, C. and Mengersen, K. (2025). Next generation mo dels for subsequent sp orts injuries. A pplie d Sto chastic Mo dels in Business and Industry 41 e70034. Zumet a-Olasko aga, L. , Bender, A. and Lee, D.-J. (2025). Flexible mo delling of time-v arying exp osures and recurren t even ts to analyse training load effects in team sp orts injuries. Journal of the R oyal Statistic al So ciety Series C: A pplie d Statistics 74 391–405. 30 A A dditional Figures W e present additional figures in App endix A to illustrate details ab out data and our metho ds. Figure 14: F orest plot of Co x prop ortional hazards ratios with 95% confidence interv als. Figure 14 visually summarizes the baseline Cox results and mak es the paradox esp ecially clear. Age is the most consisten t p ositiv e predictor of injury risk, while recent 7-day load enters with a statistically precise hazard ratio b elo w one. W e do not interpret that negative recen t-load co efficien t as evidence that heavier w orkloads are protectiv e; rather, it is the same parado xical pattern motiv ating the pap er, consistent with healthy-w orker surviv or selection. The figure also sho ws that Starting Role Play ers and Rotation Pla yers ha ve low er estimated hazard than Low-Min utes Reserves, whereas most game-gap indicators remain comparativ ely close to the n ull with wider uncertain ty . 31 Figure 15: Log-log surviv al plots b y game-gap type, sho wing violation of the proportional hazards assumption. Figure 15 shows that if the prop ortional hazards assumption held exactly , the log-log curves w ould b e approximately parallel. Instead, the four gap-type curves clearly diverge and re-conv erge o ver cumulativ e minutes, esp ecially for the extended-rest group in the middle p ortion of the curve. This indicates that the effect of schedule spacing is not constant ov er the exp osure history , whic h helps justify moving from a standard Co x mo del to the more flexible piecewise-exp onen tial framew ork used later in the pap er. 32 Figure 16: Smo oth baseline hazard from the piecewise-exp onen tial mo del. The non-monotonic shap e reflects both fatigue accum ulation and surviv orship selection. Figure 16 sho w that the estimated baseline hazard is distinctly non-monotone: it declines through m uch of the cumulativ e-minutes range and then rises again late in the exp osure history . A natural in terpretation is that these t wo phases combine survivor selection and ph ysiological accumulation. Early in the season, the risk set b ecomes increasingly enriched for pla yers healthy enough to keep pla ying, which can push the baseline hazard do wnw ard; later, once cumulativ e exp osure b ecomes large, accumulated workload app ears to push the hazard bac k up. This shap e is exactly the kind of pattern that a rigid parametric or prop ortional-hazards baseline w ould struggle to represen t. Figure 17: Hazard surface from the tensor-pro duct interaction of rest days and cumulativ e minutes in the P AMM baseline mo del. The hazard surface plot, Figure 17 (a), shows that injury risk v aries jointly across rest days and cumulativ e min utes rather than along either axis alone. The slice plot, Figure 17 (b), suggests that shorter rest tends to shift the hazard upw ard across most cumulativ e-minute levels, while all 33 curv es retain a non-monotone shap e ov er cumulativ e minutes, with risk dipping in the middle range and reb ounding at very high totals. Importantly , it should b e read as a descriptive summary from the baseline P AMM: it captures complex structure in the observed data, but it do es not by itself separate genuine fatigue effects from the selection mechanism emphasized throughout the paper. Figure 18: Calibration plot comparing predicted and observ ed even t rates by decile. Figure 18 is a useful calibration diagnostic b ecause it highligh ts b oth the impro vemen t ac hieved b y the mo del and its remaining limitations. The plain P AMM tends to underpredict even t risk almost uniformly , with predicted probabilities clustered near zero while observed even t rates remain around t wo to three p ercen t across deciles. Adding the W CE term pro duces more spread in predicted risk and b etter separates low- and high-risk bins, but the p oin ts still do not fall tigh tly on the 45-degree line, esp ecially in the highest predicted-risk deciles. Accordingly , these mo dels are more informative ab out relative hazard structure and bias patterns th an ab out p erfectly calibrated absolute injury probabilities. 34 Figure 19: Distribution of injury even ts by p osition, season phase, and gap t yp e. Sev eral descriptive patterns in Figure 19 match the pap er’s broader argumen t. First, back- to-bac k games again show the low est raw even t rate, while short and normal gaps app ear riskier, whic h is another unadjusted manifestation of the load-management paradox rather than evidence that compressed schedules are protective. Second, ev ent rates rise mo destly to ward the late season, consisten t with cum ulative wear ov er time. Third, the b o dy-part panel sho ws that ankle and knee injuries are among the most common named categories, but the large “unsp ecified” group also highligh ts a limitation of public injury rep orts: the observed outcome p ool is etiologically heterogeneous, so the paper’s single-outcome hazard mo del should b e in terpreted as a useful aggregate approximation rather than a mec hanism-sp ecific injury mo del. 35 Figure 20: Distribution of key workload v ariables across the combined dataset. F rom Figure 20 , we can see that the even t and no-ev ent distributions ov erlap heavily for all four w orkload summaries, whic h is an imp ortan t practical p oint: no single threshold in minutes, recent load, acute:chronic ratio, or consecutiv e games cleanly separates injury from non-injury observ ations. This is one reason simple cutoff-based rules can b e misleading in this setting. The figure instead supp orts the mo deling strategy of the pap er, where risk is treated as longitudinal, cumulativ e, and m ulti-v ariable rather than reducible to a one-dimensional screening rule. 36 Figure 21: Play er workload cluster profiles. The radar plot, Figure 21 , confirms that the clustering pro cedure reco vers in terpretable role-based w orkload profiles. High-Usage Stars sit at the top of the minutes and recent-load axes, Starting Role Pla yers remain high but b elo w stars, Rotation Play ers o ccupy the middle range, and Low-Min utes Reserv es are characterized by little sustained workload and the most rest days. This is useful for descriptiv e stratification b ecause it shows that “workload tier” is not merely relab eled min utes pla yed; it also reflects contin uity of pla y and exposure accum ulation. At the same time, these tiers are constructed from season-level summaries, so they should b e read as descriptive play er archet yp es rather than clean baseline causal co v ariates. 37 Figure 22: Season timelines for five case-study play ers across three seasons. In Figure 22 , we present the injury histories of five case-study star play ers who suffered with high-frequen t or dev astating injuries ov er the 2022–2025 seasons. These timelines mak e the selection problem visually in tuitive. In general, extended stretches of high-minute games are observed only when a pla yer remains healthy and av ailable enough to stay in the rotation, whereas injuries and missed p erio ds in terrupt the exp osure history in highly play er-sp ecific wa ys. The figure also reveals substan tial heterogeneity across b oth play ers and seasons, further motiv ating the pap er’s use of recurren t-even t metho ds and time-v arying cov ariates. F or example, Kawhi Leonard, who is widely 38 asso ciated with load management, sho ws rep eated app earances of “injury: o veruse,” often follow ed by short absences ov er the three seasons, underscoring the practical imp ortance of w orkload monitoring in his case. Kyrie Irving pro vides a differen t pattern: despite exp eriencing a lumbar back sprain during the 2024–25 season, he con tinued to pla y under a dense game sc hedule until sustaining a season-ending left A CL tear later in the year. Anthon y Da vis, b y con trast, missed a substantial n umber of games around the midseason trade to Dallas and then suffered a left adductor strain in his Ma veric ks debut, whic h sidelined him for more than a month afterward. More broadly , these case studies of s ev eral star play ers illustrate that observ ed workload is not purely an exogenous driv er of future injury risk; it is also shap ed by a pla yer’s evolving health status and a v ailability . Figure 23: Simulation: estimation bias under HWSE. (a) W eigh t function bias at each lag f or naive, IPW-observ ed, and IPW-oracle estimators. (b) Age co efficien t bias across scenarios and mo dels. Figure 23 clarifies where the healthy-w orker surviv or effect do es the most damage. In panel (a), the bias is most severe at the shortest lags, exactly where recen t w orkload should matter most biologically , and then shrinks to ward zero at longer lags. The observed-co v ariate IPW estimator atten uates the short-lag bias but do es not eliminate it, showing that weigh ting on publicly a v ailable v ariables pro vides only a partial correction. P anel (b) further shows that the distortion is not limited to the WCE curv e: the same selection mechanism can also bias ordinary regression co efficients such as age. T aken together, the simulation supp orts the pap er’s main empirical message that the causal correction mo ves the estimates in the right direction, but cannot fully reco ver the truth when laten t fitness remains unobserved. B E-V alue Sensitivit y Analysis F ollowing V anderW eele and Ding ( 2017 ), we compute E-v alues for k ey Cox hazard ratios, and the results are shown in T able 7 . F or HR < 1 , E -v alue = HR − 1 + q HR − 1 ( HR − 1 − 1) . The contin uous p er-min ute recent-load E-v alue ( 1 . 09 ) is scale-dep enden t: very weak confounding p er min ute suffices to explain the asso ciation. 39 T able 7: E-v alue sensitivit y analysis for k ey hazard ratios. Co v ariate HR E-v alue (p oin t) E-v alue (CI b ound) Recen t load (7d) 0.993 1.09 1.08 Tier: Starting Role 0.831 1.70 1.40 Tier: Rotation Play er 0.832 1.69 1.44 Gap: short 1.031 1.21 1.35 C Pla y er W orkload Tier Clustering Pla yers are classified into workload tiers using the follo wing pip eline, applied separately to each season’s game logs: 1. F eature aggregation. F or eac h play er with at least 10 games, we compute 14 p er-season summary statistics spanning five domains: volume (mean minutes, field-goal attempts, re- b ounds, p ersonal fouls p er game), availability (games play ed, fraction of games with ≥ 30 min utes), usage (usage rate), playmaking (mean assists), defense/physic ality (mean steals, blo c ks, offensive reb ounds, free-thro w attempts), and efficiency (true sho oting p ercen tage). 2. Standardization and PCA. F eatures are z -scored, then reduced via principal comp onent analysis ( Jolliffe and Cadima , 2016 ) retaining 85% of total v ariance. 3. K -means clustering. W e fit K -means ( Llo yd , 1982 ) on the PCA scores for k ∈ { 3 , . . . , 7 } and select the k maximizing the silhouette score ( Rousseeuw , 1987 ). All three seasons yield k = 4 . 4. Lab eling. Clusters are rank ed by centroid mean minutes and assigned interpretable names: High-U sage Star (highest min utes and usage rate), Starting R ole Player , R otation Player , and L ow-Minutes R eserve . Pla y ers with fewer than 10 games are assigned to the Lo w-Minutes Reserv e tier b y default. Figure 21 , the radar plot, sho ws the normalized cen troid profiles for the four tiers. 40
Original Paper
Loading high-quality paper...
Comments & Academic Discussion
Loading comments...
Leave a Comment