Visual or Textual: Effects of Explanation Format and Personal Characteristics on the Perception of Explanations in an Educational Recommender System
Explanations are central to improving transparency, trust, and user satisfaction in recommender systems (RS), yet it remains unclear how different explanation formats (visual vs. textual) are suited to users with different personal characteristics (P…
Authors: Qurat Ul Ain, Mohamed Amine Chatti, Nasim Yazdian Varjani
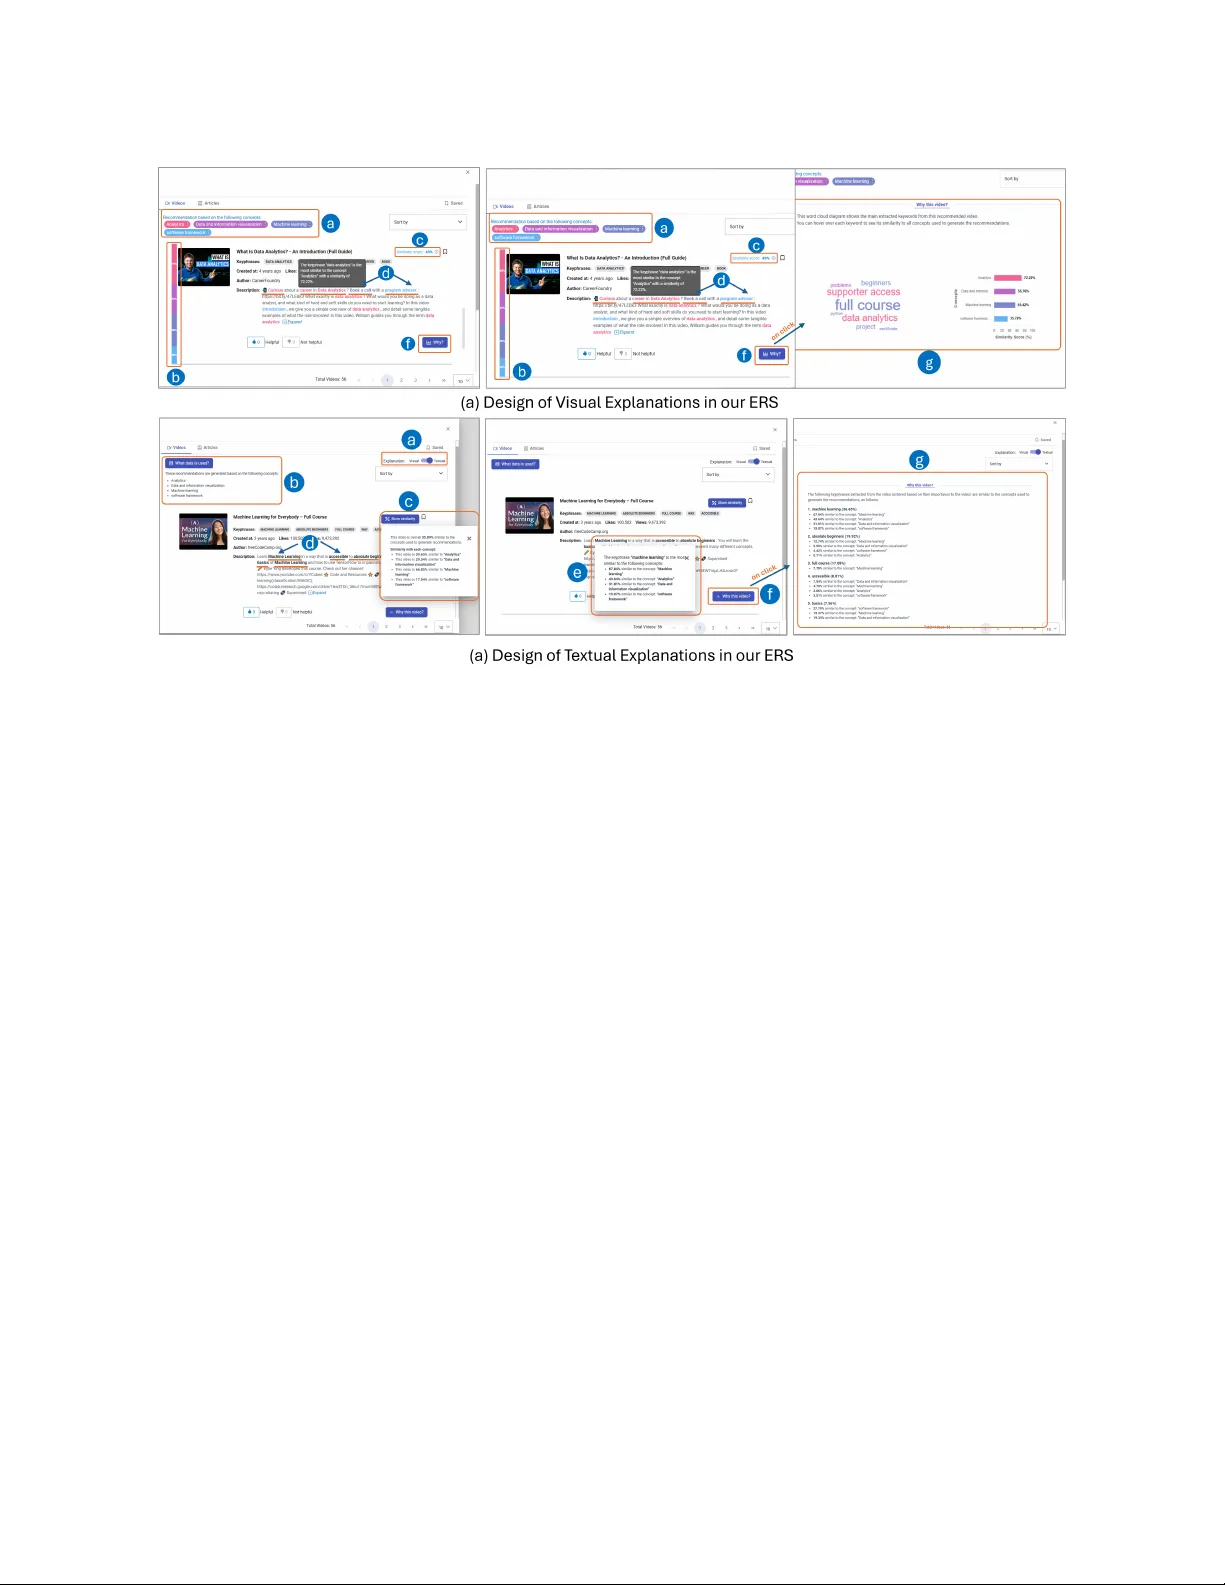
Visual or T extual: Eects of Explanation Format and Personal Characteristics on the Perception of Explanations in an Educational Recommender System Qurat Ul Ain qurat.ain@stud.uni- due.de University of Duisburg-Essen Duisburg, Germany Mohamed Amine Chatti mohamed.chatti@uni- due.de University of Duisburg-Essen Duisburg, Germany Nasim Y azdian V arjani nasim.yazdian@rwth- aachen.de RWTH Aachen University Aachen, Germany Farah Kamal farah.kamal@stud.uni- due.de University of Duisburg-Essen Duisburg, Germany Astrid Rosenthal-von der Pütten arvdp@itec.r wth- aachen.de RWTH Aachen University Aachen, Germany Abstract Explanations are central to impro ving transparency , trust, and user satisfaction in recommender systems (RS), yet it remains unclear how dierent explanation formats (visual vs. textual) are suited to users with dierent personal characteristics (PCs). T o this end, we report a within-subject user study (n=54) comparing visual and textual explanations and e xamine how explanation format and PCs jointly inuence perceived control, transparency , trust, and satis- faction in an educational recommender system (ERS). Using robust mixed-eects models, we analyze the moderating eects of a wide range of PCs, including Big Five traits, need for cognition, decision making style, visualization familiarity , and technical expertise. Our results show that a well-designed visual, simple, interactive , selec- tive, easy to understand visualization that clearly and intuitively communicates how user prefer ences are linked to recommenda- tions, fosters perceived control, transparency , appr opriate trust, and satisfaction in the ERS for most users, independent of their PCs. Moreover , we derive a set of guidelines to support the eective design of explanations in ERSs. CCS Concepts • Computing methodologies → A rticial intelligence ; • Human- centered computing ; • Information systems → Decision sup- port systems ; Ke ywords Educational Recommender Systems, Explainable AI, Explanation, Transpar ency , Trust, Personality , User study Permission to make digital or hard copies of all or part of this work for personal or classroom use is granted without fee provided that copies are not made or distributed for prot or commercial advantage and that copies bear this notice and the full citation on the rst page. Copyrights for components of this work owned by others than the author(s) must be honor ed. Abstracting with cr edit is permitted. T o copy otherwise, or republish, to post on servers or to redistribute to lists, r equires prior specic permission and /or a fee. Request permissions from permissions@acm.org. UMAP ’26, Gothenburg, Sweden, © 2026 Cop yright held by the owner/author(s). Publication rights licensed to A CM. ACM ISBN 978-x-xxxx-xxxx-x/Y Y/MM https://doi.org/XXXXXXX.XXXXXXX A CM Reference Format: Qurat Ul Ain, Mohamed Amine Chatti, Nasim Y azdian V arjani, Farah K a- mal, and A strid Rosenthal-von der Pütten. 2026. Visual or T extual: Ef- fects of Explanation Format and Personal Characteristics on the Percep- tion of Explanations in an Educational Recommender System. In Proceed- ings of June 08–11, 2026 (UMAP ’26). ACM, New Y ork, NY, USA, 10 pages. https://doi.org/XXXXXXX.XXXXXXX 1 Introduction Explanations have become an integral component of modern rec- ommender systems (RSs) [ 7 , 71 ]. Explainability refers to providing human-understandable information about why a particular item was recommended and how the system works internally [ 61 ]. Ex- planations aim to improve users perceptions of trust, transparency , scrutability , ee ctiv eness, eciency , persuasiveness, and satisfac- tion with the system, which in turn can lead to better acceptance of recommendations [ 3 , 4 , 11 , 15 , 44 , 53 ]. Explanations are typically presented to the users either using visualizations (i.e., visual), or in natural language description (i.e., te xtual), referred to as explana- tion format [ 2 ]. Prior research suggests that users’ perceptions of RS and its explanations depend on how explanations are presented and are further shape d by individual dierences [ 8 , 25 , 31 , 59 ]. While explanations have b een evaluated in terms of various ex- planation styles [ 31 ] and var ying lev el of details [ 15 ], empirical evidence directly comparing explanation formats remains limited [ 31 , 59 ]. As a result, it is still unclear whether users perceive visual or textual e xplanations as mor e eective. Since explanations aim to help users understand the recommended items and make accurate decisions [ 40 ], their role is particularly important in e ducational settings, where decision making can directly inuence learning outcomes. Although explanations have recently been investigated in the context of educational recommender systems (ERS) [ 53 ], to the best of our knowledge, the comparative eects of explanation formats on users’ perceptions of ERS remain under explored. In par- allel, despite growing interest in incorporating personality into RS [ 60 ], only a limited number of studies have examined ho w personal characteristics (PCs) inuence users’ perceptions of explanations in RS [ 8 , 15 , 25 , 31 , 44 , 51 ]. Furthermore, the impact of PCs on the perception of explanations in ERSs has not yet been studied. UMAP ’26, Gothenburg, Sweden, Ain et al. T o bridge these gaps, in this work we systematically compare visual vs. textual explanations within an ERS and investigate how explanation format inuences users’ p er ceptions of the system. Specically , we examine the eects of explanation format on per- ceived control, transparency , trust, and satisfaction. In addition, we analyze how PCs, including Big Five traits, Need for Cogni- tion (NFC), Decision Making Style (DMS), Visualization Familiarity (VF) and T e chnical Expertise (TE) moderate users perceptions of explanation formats. The following r esearch questions guide our investigation: RQ1. How does explanation format (visual vs. textual) impact users’ perceptions of control, transparency , trust, and satisfaction with an ERS? RQ2. How do personal characteristics inuence users’ percep- tions of visual and textual explanations in terms of perceiv ed con- trol, transparency , trust, and satisfaction? T o answer these RQs, we conducte d a within-subject user study (n=54) using a mixed-method evaluation approach. Our results show that while textual and visual explanations supported comparable levels of perceiv ed control and transpar ency , visual explanations signicantly fostered higher trust and satisfaction. Furthermore, users with higher Agreeableness perceived more control and users with higher Conscientiousness perceived more trust, and satisfac- tion with visual explanations. Whereas, users with low intuitive DMS signicantly trust visual e xplanations more. Overall, visual explanations yielded higher perceived control, transparency , trust, and satisfaction, with these benets remaining largely consistent across users regardless of PCs. 2 Background and Related W ork 2.1 Explanation Format The e xplanation format refers to the way in which explanations are presented to the users [ 2 ]. Explanations can be conveyed through visual representations such as images, graphs, or charts (i.e., vi- sual) [ 7 ] or through natural language descriptions (i.e., textual) [ 3 , 71 ]. Visual explanations typically rely on graphical r epresenta- tions to communicate explanatory information. Common visual- ization techniques include bar charts, pie charts, histograms, tag clouds, saliency maps, scatter plots, line charts, and V enn diagrams [ 1 , 8 , 13 , 15 , 18 , 64 – 66 , 69 ]. In addition to charts, images have also been used as visual explanations [ 9 , 38 ]. For more details, we refer the interested readers to a recent comprehensive sur ve y of visu- ally explainable recommendation [ 7 ]. The most frequently use d approach for generating textual explanations is template-based using predened sentence templates that are populated based on the underlying recommendation algorithm [ 52 ]. These templates may incorporate various factors, such as input parameters and item features [ 27 , 40 , 59 ], similarity to other items [ 31 , 34 ], usage context [ 56 ], or similarity to other users [ 31 , 40 ]. Another method of gener- ating textual e xplanations without templates is natural language ex- planation that generates explanation sentences automatically using NLP and machine learning techniques [ 6 , 10 , 49 , 50 , 58 , 68 , 72 , 73 ], and more recently , employing LLMs [ 20 , 70 ]. Both explanation for- mats have proved to positively inuence users’ perceptions of RSs, including transparency [ 13 , 53 , 74 ], trust [ 44 , 53 , 69 ], and satisfac- tion [ 13 , 44 , 49 ]. Moreover , interactive explanations have pro ven to positively impact users perceived control [15, 18]. Prior research on explainable RS has mainly focused on compar- ing r ecommendations with and without explanations [ 44 ], dier ent explanation styles [ 24 , 31 ], or varying level of details [ 15 ]. However , although explanation format also inuences user e xperience [ 30 ], direct comparisons between visual and textual explanations remain rare. Notable exceptions include Kouki et al. [ 31 ], who found textual explanations to be more persuasive than visual ones, and Millecamp et al. [ 59 ], who reported that although users preferred visual expla- nations, lay users performed better with textual explanations. These ndings highlight the need for further systematic comparisons of explanation formats to better understand how they inuence users’ perceptions of explanations. Moreover , to the b est of our knowl- edge, the comparative eects of explanation formats hav e not yet been systematically investigated in the context of ERSs. T o address this gap, in this work we compare visual vs. te xtual explanations together in an ERS to investigate which format is best to convey explanatory information, to meet dierent explanation aims. 2.2 Personal Characteristics Recent resear ch has demonstrated that PCs inuence how users perceive explanations in RSs [ 8 , 25 , 31 , 42 , 44 , 45 , 59 ]. For instance, Millecamp et al . [44] investigated the role of Big Fiv e traits and NFC in the presence versus absence of explanations. Extending this line of work, Martijn et al . [42] investigated perception of explanation of users with low vs. high NFC, musical sophistication, and openness. Furthermore, Kouki et al . [31] examined how Big Five traits and VF relate to user preferences for e xplanation styles. Other PCs have also been explor ed in literature including DMS [ 51 ], user expertise [ 59 ], personal innovativeness, trust propensity , and domain knowledge [ 8 , 19 ]. O verall, prior work clearly indicates that PCs play an important role in shaping users’ p er ceptions of explanations and should be considered when designing e xplainable RSs. Ho wev er , the ee cts of PCs in comparing dierent explanation formats remain underexplor ed [31, 59]. 3 Visual and T extual Explanations in CourseMapper In our ERS in CourseMapp er , that recommends Y ouT ub e videos and Wikipedia articles to learners, we provide b oth visual and textual explanations to help learners understand why an item is recommended based on their selected inputs. The videos and articles are recommended based on the similarity score between keyphrases extracted from these resources and concepts that the user marked as "Did Not Understand" when interacting with a learning material (referred to as DNU concepts). Both visual and textual e xplanations draw upon this information. 3.1 Visual Explanation Design The design of visual explanations in CourseMapp er is adapted from our earlier research on interactive explanations dev eloped in RIMA [ 15 ]. These explanations were systematically designed using a Human-Centered Design (HCD) approach and popular catego- rization of intelligibility types [ 37 ] to come up with "what" , "why" , Visual vs. T extual Explanations in an ERS UMAP ’26, Gothenburg, Sweden, "how" , and "what-if " explanation with dierent levels of detail. Eval- uating those explanations in RIMA [ 8 , 15 ] revealed that the users found "what" and "why" explanations with abstract and interme di- ate level of detail the most understandable and eective. Wher eas, most of the users found "how" explanation, either too technical or unnecessary , so we decided not to have it in CourseMapper . The "what" explanation in CourseMapper revealing to the users what do es the system know about them, displays the user input (DNUs), as chips with dierent colors at the top of the recommen- dations (Figure 1-a(a)). The "why" explanation is further divided into two levels of detail, namely abstract and detailed. In the "Why (abstract)" explanation, with each recommended video and article, a cosine similarity score between the recommended item and the user input concepts is display ed at the top right corner of each recommendation (Figure 1-a(c)). Moreov er , a color band on the left side of the recommended item indicates the similarity score between the current item and user’s each input concept (Figure 1-(b)). Furthermore, the keyphrases in the description/abstract of the recommended video/article are highlighted in the color of the most similar input concept (Figure 1-a(d)). Hovering o ver a colored keyphrase shows its similarity score with the most similar input con- cept. Clicking on a keyphrase, opens a pop-up containing a bar chart that shows the similarity scores b etw een the selected keyphrase and the user’s top three most similar input concepts (Figure 1-a( e)). Furthermore, the "Why (detailed)" explanation is provided using the ’Why button’ (Figure 1-a(f )) which displays an interactive, col- ored word cloud containing all the keyphrases e xtracted from the description/abstract of the recommended vide o/article , allowing users to see all of them at a glance (Figur e 1-a(g)). Ho vering ov er any keyphrase in the word cloud, shows a colored bar chart on the right side of the word cloud and updates dynamically as a dier- ent keyphrase is hover ed over . It represents the similarity score between the hovered keyphrase and user’s top ve inputs. 3.2 T extual Explanation Design For textual explanations, we translated the exact information and level of detail used in visual explanations to textual format for each intelligibility type. T o ensure this one to one mapping from visual to textual format, the suitable textual explanation method was template-based explanation. This design choice ensur ed that both explanation formats conveyed the same information, allowing for a fair and controlled comparison between visual and textual explanations. A toggle button was used to switch between visual and textual explanation UIs (Figure 1-b(a)). For the "what" expla- nation, we display a (template-based) sentence to list down users’ input concepts (Figure 1-b(b)). In the "why (abstract)" explanation, with each recommendation, a ’Show Similarity’ button is displayed which sho ws the cosine similarity scor e between the recommended item and user’s each input concept (Figure 1-b(c)). Furthermore, the keyphrases in the description/abstract of the recommende d video/article are highlighted in b old (Figur e 1-b(d)). Hov ering over a keyphrase, displays the similarity score in percentage between that keyphrase and the most similar input concept. Furthermore, clicking on a keyword, opens a p op-up containing textual informa- tion that shows the similarity scores b etw een the selecte d keyphrase and the user’s top three most similar inputs (Figure 1-b( e)). "Why (detailed)" explanation is pr ovided using the ’Why button’ (Figure 1-b(f )). When clicked, it shows all the keyphrases extracted from the description/abstract of the recommende d video/article and their similarity score with user’s top ve input concepts (Figure 1-b( g)), following the template for all keyphrases from i to n as: "The fol- lowing keyphrases extracted from the video/article (ordered based on their relevance to the video) are similar to the concepts used to generate recommendations as follows: 1 to n): [ 𝐾 𝑒𝑦 𝑝ℎ𝑟 𝑎𝑠 𝑒 𝑖 . .. 𝑛 ] ([percentage similarity with the vide o]) • [similarity score %] similar to the concept "[ 𝐶 1 ]" ... "[ 𝐶 5 ]" . 4 User Study W e conducted a within-subject user study , where each participant examined both visual and textual explanations. The study design and procedure was approv ed by the Ethics Committee of the Uni- versity [Blinded Name] . The required sample size (n=54) was deter- mined a priori through power analysis ( eect size f = 0.25, pow er = 0.95) using G*Power [ 12 ], ensuring sucient statistical power to detect medium-sized eects. The study was conducte d online, participation was voluntary and took approximately one hour on average. Ev ery participant received a monetary compensation for their participation. 4.1 Participants Participants were recruited through adv ertisements distributed at universities and academic networks in Germany , Pakistan, and Iran (based on authors’ institutional and professional contacts). Participants were required to be at least 18 years old and procient in English. A total of 54 participants (29M, 25F), aged between 19 to 60 years (M = 29.0, SD = 8.02), completed the study . 4.2 Measures T o assess users’ p er ceptions of the RS and to capture relevant indi- vidual dier ences, w e emplo yed a set of standardized questionnair e measures assessing our dependent variables and PCs. 4.2.1 Dependent variables: Perceived control in RS measures if users felt in control in their interaction with the recommender [ 54 ]. It was measured on a 5-point Likert scale using a self-created item (adapted from [ 54 ]): "I feel in control of the level of information/details of the explanations provided in the system" . Transparency determines whether or not a system allows users to understand its inner logic, i.e. why a particular item is recommended to them [ 54 ]. W e mea- sured transparency using 12 items adopted from [ 23 ], on a 5-point Likert scale. T rust measures an individual’s willingness to depend on a specic technology [ 43 ]. It was evaluated using 8 items adopted from [ 43 ] on a 7-point Likert scale. Satisfaction refers to the over- all user experience with the RS, including whether users nd it useful, benecial, and worth recommending to others [ 29 ]. It was measured using 7 items adapted from [ 29 ] on a 5-point Likert scale . 4.2.2 Personal Characteristics (PCs): T o investigate individual dif- ferences in users’ responses to textual and visual explanations, we collected several PCs, measured using Likert scales in accordance with their original questionnaire specications. Big Five T raits : refer to the ve basic dimensions of personality in- cluding Openness, Conscientiousness, Extraversion, Agreeableness, UMAP ’26, Gothenburg, Sweden, Ain et al. Figure 1: Visual and T extual explanations in CourseMapp er and Neuroticism. These were measured using the questionnaire by Gosling et al . [14] which is both brief and highly reliable. Given prior evidence that Big Five traits signicantly aect users’ p er cep- tion of explanations [ 31 , 45 ], we aim to further investigate their inuence on explanation formats as well. Need for Cognition (NFC) : refers to the tendency for an individual to engage in and enjoy eortful cognitiv e activities [ 22 ]. Previous studies show that NFC aects how users process and benet from explanations [ 8 , 44 ]. Given the interactive and selectiv e nature of our visual and textual explanations, NFC is a relevant factor for further investigation. W e measure NFC using the NCS-6 scale [ 39 ]. Decision Making Style (DMS) : captur es how individuals typically process information when making decisions, with rational styles emphasizing analytical reasoning and intuitive styles relying on experience-based judgments [ 21 ]. Prior work in the RS domain indicates that DMS inuence users’ perceptions of explanations [ 25 , 51 ]. Given that explanations aim to support decision making, DMS represents a rele vant PC, motivating its inclusion in our study , measured using the 10-item Decision Styles Scale [21]. Visualization Familiarity (VF) : r efers to the extent to which users have experience with analyzing and graphing data visualizations. A higher visualization familiarity has been found to positively inuence users perception of visual explanations [ 8 , 31 ], which motivated us to further investigate this characteristic in our study . W e measured VF using 4 items adapted from [31]. T echnical Exp ertise (TE) : captures users’ perceived knowledge of recommender systems and their ability to comprehend how rec- ommendations are generated. TE was chosen as a PC in this study because it directly inuences how dierent explanation modalities are understood and use d by dierent users [ 8 , 59 ]. TE was measured using 2 items adapted from [35]. 4.3 Study Procedure The study was conducted thr ough one-to-one online sessions using Zoom. Each session began with an introduction to the study goals and proce dur e, followed by a pre-study questionnaire collecting demographic information and PCs. Participants then watched a short demonstration video introducing our ERS and its interface. Participants were randomly assigned to one of two explanation conditions (textual or visual) and given screen control to interact with the system. The y completed two tasks while following a think- aloud protocol. In the rst task, participants enrolled in a course of their choice, selecte d a PDF learning material, and marked concepts they did not understand while reading, which wer e then used to generate Y ouTube video recommendations. In the se cond task, par- ticipants explor ed the explanations corresponding to their assigned condition and reected on their experience. After completing the tasks, participants lled out a post-study questionnaire evaluating perceived contr ol, transparency , trust, and satisfaction. Participants then repeated the second task using the alternativ e explanation format, followed by the same questionnaire. Finally , participants answered open-ended questions about their experiences and pref- erences regarding visual and textual explanations and their impact on perceived control, transparency , trust, and satisfaction. 4.4 Data Analysis Composite scores for all D V s and PCs were calculated and quan- titative analyses were conducted in R. For RQ1, within-subje ct dierences between explanations wer e analyzed using Wilcoxon Visual vs. T extual Explanations in an ERS UMAP ’26, Gothenburg, Sweden, signed-rank tests (with Holm adjustment) due to non-normality (Shapiro– Wilk, all p < .001) [ 26 ], and eect sizes w ere reported. For RQ2, moderation eects wer e examined using robust mixed-eects models. Signicant interactions were followed up using estimated marginal means (EMMs) with 95% condence intervals, and robust- ness was conrmed using false discovery rate (FDR) correction. Qualitative responses were analyzed using thematic analysis [5]. 5 Results 5.1 Visual vs. T extual Explanations Participants’ perceptions of the ERS diered across explanation formats for some, but not all, e valuated dimensions. T able 1 sum- marizes the descriptive statistics. Perceived control did not dier signicantly b etw een explanation formats. Control ratings were comparable for textual (M = 3.85, SD = 0.98) and visual (M = 3.98, SD = 0.88) explanations, and the Wilcoxon signed-rank test indi- cated no statistically signicant dierence. Similarly , no signicant dierence was obser ved for perceived transparency . Participants reported comparable transparency levels for textual (M = 3.85, SD = 0.67) and visual explanations (M = 3.94, SD = 0.67). In contrast, ex- planation format signicantly aecte d perceiv ed trust , with higher ratings for visual e xplanations (M = 5.64, SD = 1.11) than for textual explanations (M = 5.28, SD = 1.33; V = 756, adjusted p = .007, r = .36), indicating a moderate eect. Similarly , satisfaction was higher for visual explanations (M = 4.21, SD = 0.59) than for textual ex- planations (M = 4.01, SD = 0.69). This dierence was statistically signicant, with a moderate eect size (V = 540.5, adjusted p = .014, r = .35). Figure 3 summarizes these results. Figure 2: T extual vs. visual explanations across all measures 5.2 Impact of Personal Characteristics Following RQ1, we examined whether presentation order inu- enced users’ perceptions and whether PCs moderated the eects of explanation format. W e tted robust linear mixed-eects models of the form: D V ∼ ExplanationT yp e × Or der + ExplanationT yp e × PC +( 1 | Participant ) , (1) Where, DV denotes dependent variables, ExplanationType ( visual vs. textual), presentation order (textual rst or visual rst), and PC (and interactions) as xed eects and participant as a random intercept, where moderators were mean- center ed. The main eects of explanation format replicated the RQ1 results and are therefore not discussed further . No signicant eects of presentation or der or its interaction with explanation format were observed for any D V , indicating that order did not confound the results. For perceived control, a non-signicant trend suggested higher ratings for visual explanations when presented at second order . O v erall, presenta- tion order did not meaningfully aect users’ evaluations, allowing moderation analyses to focus on PCs. (a) Agreeableness and Perceived Control (b) Conscientiousness and Trust (c) Conscientiousness and Satisfac- tion (d) Intuitive DMS and Trust Figure 3: The signicant interaction ee cts between PCs and explanation formats Big Five Traits: Agreeableness moderated the eect of explana- tion format on perceived control ( b = 0.24, t = 2.07), with visual explanations increasing control for users high in Agreeableness (b = 0.35, p = .037), but not for users low or average in A greeableness (Fig. 3a). Conscientiousness moderated the eects of explanation format on trust (b = 0.17, t = 2.20) and satisfaction (b = 0.10, t = 2.18), such that visual explanations led to higher trust and satisfaction for users with average to high Conscientiousness, but not for users low in Conscientiousness (Figs. 3b, 3c). No moderation eects were observed for Extraversion, Emotional Stability , or Op enness. Decision Making Style (DMS): Rational DMS did not moderate the eects of explanation format on any dependent variable. In UMAP ’26, Gothenburg, Sweden, Ain et al. T able 1: Descriptive and inferential statistics for visual and textual explanations. Dependent V ariable T extual (M ± SD) Visual (M ± SD) 𝑉 𝑝 -value Eect size ( 𝑟 ) Interpretation Perceived Control 3.85 ± 0.98 3.98 ± 0.88 240.5 0.378 0.08 (small) No dierence Transpar ency 3.85 ± 0.67 3.94 ± 0.67 666.0 0.426 0.10 (small) No dierence Trust 5.28 ± 1.33 5.64 ± 1.11 756.0 0.007 0.36 (moderate) Visual > T extual Satisfaction 4.01 ± 0.69 4.21 ± 0.59 540.5 0.014 0.35 (moderate) Visual > T extual contrast, intuitiv e DMS showed signicant main eects on per- ceived transparency (b = 0.33, t = 3.31), trust (b = 0.58, t = 3.12), perceived control (b = 0.33, t = 2.44), and satisfaction (b = 0.22, t = 2.52). A signicant interaction between explanation format and intuitive DMS was obser v ed for trust ( 𝑏 = − 0 . 23 , 𝑡 = − 2 . 23 ), in- dicating that although visual explanations increased trust o verall (b = 0.32, t = 2.85), this advantage decreased with higher intuitive DMS. Simple-eects analyses showed that visual explanations led to higher trust for users low ( Δ = 0 . 42 , 𝑧 = − 3 . 77 , 𝑝 < . 001 ) and average ( Δ = 0 . 25 , 𝑧 = − 3 . 11 , 𝑝 = . 002 ) in intuitive DMS, but not for highly intuitive users ( Δ = 0 . 07 , 𝑧 = − 0 . 61 , 𝑝 = . 54 ) (see Figure 3d). Other PCs: No mo deration eects were obser ved for Need for Cognition, Visualization Familiarity , or T echnical Expertise, as the interaction between explanation format and these characteristics was non-signicant across all dependent variables. 5.3 Qualitative Analysis 5.3.1 Visual vs. T extual. Answering the question, "Which explana- tion (textual or visual) do you prefer , and why?" , the majority of the users (n=46,) preferred visual explanations over textual ones because it is easy to understand (n=14) and "it’s very quick to under- stand" (n=14). Furthermore, participants found visual explanations quick and faster (n=14) as they " do not require a lot of time and eort to process it " (P34), conveyed information “ at rst glance (P36, P51)" , and "does not require clicking to get more information" (P6, P36, P33). The feature of visual explanations admired by most of the participants (n=17) is the use of consistent color-coding across all the visualizations, as they found it to be "attractive " (P44, P43, P17), "pleasing to the eyes" (P44, P45, P25), and "enjoyable " (P32). Only few users (n=6) preferred textual explanations over visual, mentioning that " text is more clear , structured and simple " (P19, P41, P46 P50), and " written information is more clear " (P46). Moreov er , two participants desired to hav e a combination of both formats, for instance, " T extual for me is to o much text, if we put some colors and visual elements in textual ones, it will be more helpful " (P26). 5.3.2 Per ceived Control. Regarding the question “Which explana- tion (textual or visual) gave you a sense of control with the ERS, and why?” , most participants (n=31) reported that visual explana- tions provided a stronger sense of control. They described visual explanations as more interactive , for instance, P52 explained, “ you see a colored word and want to interact with it. . . when you hover over a word, it shows graphs and changing p er centages, and the moving bars are very engaging ” . Similarly , P27 noted that, " if I want to know something about the colored words which are b eing shown to me, then I would interact with them " . In contrast, some participants (n=11) felt that textual explanations foster ed a greater sense of control as the y required explicit interaction to reveal additional information, as P53 noted, “ I feel more authority with playing with the information, and I can control the details I want to view or not ” . This perception was inuenced by the textual explanation design, which relied on bold key w ords rather than color-co ding and required users to ho ver or click to access additional information. Some participants (n=12) reported a similar sense of control for both formats, noting that they diered mainly in their use of color As P48 summarized, “ I can hover and click in the same way and I understand the things ” . 5.3.3 T ransparency . In response to the question “Which explana- tion gave y ou a sense of transparency , and why?” , most participants (n=32) preferred visual explanations because they were easier and quicker to understand, which helped them better and faster grasp how recommendations were generated. For example, P30 men- tioned, " it was more clear for me why the recommender chose this video ". Similarly , P43 stated; " it showed me everything clearly , to which topic was it more similar to ... It was more appealing, easy to interpret b ecause of the graphs and the colors " . On the other hand, some participants (n=11) reported that textual explanations pro- vided a str onger sense of transpar ency , highlighting that the greater amount of text conveyed a sense of richer detail. For example, “ Be- cause it’s more detailed, it shows everything and doesn’t feel like it’s hiding anything ” (P41). Furthermore , another group (n=11) per- ceived both explanation formats as e qually transparent as “ Both explanation formats reveal the same information ” (P51). With respect to explanation intelligibility types, participants consistently valued "what" and "why" (abstract) explanations, as these help ed them un- derstand which concepts inuenced the recommendations. Visual cues such as color band with similarity p er centages and color-coded keyphrases were particularly appreciated. In contrast, most par- ticipants (n=36) reported that why (detailed) explanations were unnecessary , describing them as "too much information" and they simply "do not need to know this detail" while making a decision to watch a video. 5.3.4 T rust. In response to the question “Which explanation gave you a sense of trust with the system, and why?” , participants ex- pressed mixed opinions. Most participants (n=23) reported that visual explanations fostered a stronger sense of trust in the system as they were more transparent and easier to understand, which made them feel more comfortable and condent in the system. For example, P38 expressed: "It’s more transparent, so I trust it more" Similarly , P48 explained, “I now know which concepts the system uses and how similar a video is to my concepts. I fe el like I know everything, and that makes me trust the system and its recommen- dations” . Additionally , P45 highlighte d, "b ecause I understand it more, and I can feel comfortable with it" . Other participants found Visual vs. T extual Explanations in an ERS UMAP ’26, Gothenburg, Sweden, visual explanations to be helpful in faster decision making which increased their trust in the system. For example, P9 pointed out: clicking on the keyphrases, and being able to know how close they can be to the concept, that will help me to directly select which vide o to watch " . Another substantial group of participants (n=18) r eported that both explanation formats fostered a similar sense of trust as it was driven by the information conv eyed, the quality of the rec- ommendations, or the support in decision making rather than by how easily or quickly the explanation could b e understood. As P50 explained, “Visual was just quicker , but when it comes to trust, it’s not about how quick it is to digest, but how accurate the results are” . A subset of participants (n=11) reported higher perceived trust with the ERS having explanations in textual format. These participants emphasized that textual explanations provided more complete and explicit information, which reduce d ambiguity and the need for interpretation. For instance, P43 explained, " it provides more detail so it gains my trust as I feel the system is telling me everything clearly . In visual you can be a little confused in interpreting the visual clues, but in textual everything is written and you don’t have to guess the meaning of a visualization ” . Others dir ectly associated words with credibility , with P52 stating that, “ the written information gives you a feeling that words are more trustable than visual ” . 5.3.5 Satisfaction. In response to the question “Which explana- tion gave you a sense of satisfaction with the system, and why?” , the majority of participants (n=45) preferr ed visual explanations. For many participants, satisfaction was driven by how eectiv ely the explanation helped them identify a relevant video, with visual explanations supporting ecient and more condent selection. For instance, P37 noted that visuals helped them to “make decisions faster , resulting in a better experience" . Similarly , P8 e xplained, “ I can use the color band to nd the desired video quickly ” , and P26 sum- marized as visual explanation helping them “nd a video that will help me understand a concept” . Another reason mentioned by many participants was visual explanations being quicker to understand. For instance, P5 described visual explanations as “quick to under- stand” , while P4 highlighted how visual elements such as, "the word cloud and color bands made key information visible right away" . This sentiment was echoed by P36, who preferred visuals b ecause they wanted to “dir ectly play the video without rst reading extensive text" . Another reason was that visual explanations improved satisfaction by making the system’s reasoning more transpar ent as P54 noted that, "understanding why the recommendation was made helped them feel satised with it" . Finally , while some found them “comfortable to use" (P27, P30), others describe d them as “more interactive and colorful” (P38), and nding "the graphs and word clouds useful" (P42). Related to satisfaction, textual explanations were preferred by a small subset of participants (n=8) as they were perceived as clearer , more detailed, and more reliable for de cision making. While P19 described them as “more clear and professional” , P41 found them “simple, and less colored” . Some participants expressed concerns that visual explanations could be confusing despite being engaging, as P43 explained, “ visual is catchy ... but you can be confused why it is so” . Some participants were satised with the amount of detail pro- vided by the textual explanation. For example, P46 emphasized that, “textual is explaining in a lot more detail” . Other participants r elated satisfaction to the ability to make good de cisions. For instance , P7 stated that the textual explanation “helpe d me to nd useful videos” . 6 Discussion In this section, we discuss the main ndings of our study in rela- tion to our research questions and provide some guidelines for the eective design of explanations in ERSs. 6.1 Visual vs. T extual Our qualitative ndings indicate a strong preference for visual expla- nations, as simple visual cues such as color-coding and interactive features (e .g., clicks and hover eects) enabled users to quickly and eortlessly understand the reasoning behind recommendations. Participants particularly valued that key explanatory information was pr esented upfront and could b e graspe d at a glance, supporting rapid decision making. This preference aligns with the inherent advantages of visual representations, which are generally processed more eciently than textual information and support faster com- prehension with lower cognitive eort [ 48 , 67 ]. Our ndings are consistent with earlier work by K ouki et al . [30] , who r eported that users tend to prefer simple visual formats over more complex ones. This also aligns with prior work pointing out that end-users do not necessarily benet from highly explorator y , information-heavy , or overly complex visual interfaces, even when such interfaces are visually sophisticated [ 53 ]. Design guideline : In line with estab- lished principles of data visualization, simplicity plays a critical role in the design of visual explanations as well. It is essential to provide visual explanations as simple as possible, yet with enough intuitive interaction mechanisms to allow users to quickly build an accurate mental model of how the ERS works. 6.2 Perceived Control Perceived control in RSs refers to users’ feeling that they can inu- ence the system’s behavior and actively engage with the informa- tion provided [ 55 , 63 ]. Our ndings indicate that visual explanations often fostered a stronger sense of control due to their interaction features, such as colors, clicks, hover eects, and dynamic visual elements, which encouraged exploration and active engagement. Participants felt that these interactions allowed them to control the explanation and decide what information to view and when. These ndings are in line with earlier research on explainable recommen- dation suggesting that perceived control increases when users can actively decide when and how much explanatory information to access, which reduces cognitive eort, rather than b eing presented with all information upfront [ 15 , 17 , 44 , 63 ]. This echoes the sugges- tion in [ 7 ] to provide layered visual explanations that follow a "Basic Explanation – Show the Important – Details on Demand" approach to help users iteratively build better mental models of how the RS works. This further aligns with suggestions in broader XAI resear ch stressing that the selective characteristic of explanation needs to be taken into account in order to achieve meaningful explanation [ 46 ]. Design guideline: Provide interactive visual explanations in ERSs that support selective and on-demand access to explanatory information, based on user’s needs. UMAP ’26, Gothenburg, Sweden, Ain et al. 6.3 Transpar ency Transpar ency in RS is related to the capability of a system to expose the reasoning behind a recommendation to its users [ 24 ] and is dened as users’ understanding of the RS’s inner logic [ 55 , 61 ]. Our study shows that visual explanations provided better sense of transparency with the ERS, mainly because they were easier and faster to understand that how r ecommendations were generated. Moreover , users found the "what" and "why (abstract)" explanations enough to understand (1) what data do es the system use and (2) why and how well does a recommended item t one’s preferences. By contrast, they found the "why (detailed)" explanation unne c- essary , as it contains too much information that is not needed to make a decision. Our ndings indicate that, in an ERS, an expla- nation does not need to be sound (i.e., the extent to which the explanation is truthful in describing the underlying system [ 32 ]) or complete (i.e., the e xtent to which all of the underlying system is describ ed by the explanation [ 32 ]). What is more imp ortant is that the explanation remains comprehensible to avoid o verwhelm- ing users. This is consistent with results of previous resear ch on XAI showing that for specic user groups, detailed explanation is often not needed b ecause the provision of additional explanations increases cognitive eort [ 28 , 33 , 69 ]. This is also in line with the suggestion provided by Kizilcec [28] who concluded that design- ing for eectiveness requires balanced interface transparency , i.e., “not too little and not to o much” . Design guideline: For increased transparency in ERSs, it is important to provide “what” and “why” visual explanations that clearly and intuitively communicate how user preferences are linked to recommendations, through visually interpretable representations that support users’ understanding of the system’s reasoning. Moreover , it is essential to provide a visual explanation with just the right amount of information which is "not too little and not too much" to allow users to build accurate mental models of how the ERS works, without overwhelming them. 6.4 Trust Trust has long been recognized as a key factor in e xplainable rec- ommendation. Tintarev and Mastho [61] conceptualize trust as "increasing users’ condence in the system" , while Pu et al . [54] frame it as part of users’ overall attitude towar d the system. More broadly , trust in RS can be dened as the extent to which users are condent in and willing to act on the basis of the recommenda- tions (adapted from [ 41 , 69 ]). Based on the alignment b etw een the perceived and actual performance of the system, Y ang et al . [69] distinguished b etween appropriate trust (i.e ., to [not] follow an [in]correct recommendation), overtrust, and undertrust. Our study indicates that both visual and textual explanations fostered users’ appropriate trust (i.e., users’ ability to rely on the ERS when it is correct and to recognize when it is incorrect) and facilitate d the decision making process (i.e., whether to watch a recommended video or not). However , the visual explanation yielded signicantly higher appropriate trust and faster decisions than the te xtual one. Our results further show that both explanation formats increased users’ trust in the ERS, because they are transparent and easy to un- derstand. This conrms prior ndings that providing transparency could enhance users’ trust in the RS [ 16 , 23 , 34 , 52 , 53 , 55 , 63 ] and that transpar ency and trust are often linked, following the intuition that users are more likely to trust systems they can understand than one that is a black box [ 57 ]. Further , we found that trust in an ERS can also depend on the system’s ability to pro vide accurate and useful recommendations. This outcome is consistent with prior research highlighting that users’ trust in the RS might b e inu- enced by its ability to formulate good recommendations [ 54 ] and the accuracy of the recommendation algorithm [ 62 ]. Overall, these dierent perspectives conrm that trust is a multi-facete d concept inuenced by multiple factors, as also highlighted in prior research on explainable recommendation [ 57 ] and XAI [ 36 , 47 , 69 ]. Design guideline: Provide visual e xplanations that are easy to understand to foster appropriate trust and ecient decision making in ERSs. 6.5 Satisfaction Satisfaction (i.e., increase the ease of use or enjoyment [ 63 ]) deter- mines what users think and feel while using an RS [ 54 ]. Our results show a wide agreement in favor of visual explanations fostering a better sense of satisfaction with the ERS. The visual explana- tion was perceived as more engaging and comfortable to interact with, easier to understand, and more eective to make a faster and condent decision on the usefulness of a recommendation, which contributed to increased satisfaction with the ERS. This indicates a p ositiv e asso ciation between ease to use, usefulness, and satis- faction. This aligns with the view on satisfaction presented in [ 52 ], noting that satisfaction is not considered as a single goal, but can be split into sub-goals of ease to use and usefulness. Moreover , our results show a positive corr elation between transparency and satisfaction. This is in line with earlier studies which found that the user’s overall satisfaction with an RS is assume d to be strongly related to transparency [ 4 , 13 , 15 , 16 , 63 ]. Design guideline: T o foster user satisfaction with the ERS, visual explanations should be easy to use and understand, engaging, comfortable to interact with, and supportive in quick decision making. 6.6 Personal Characteristics Our study shows that visual e xplanations signicantly increased perceived contr ol for users higher in Agreeableness, as well as trust and satisfaction for users higher in Conscientiousness. Moreov er , we found that users with high intuitive DMS beneted equally from both formats. One possible reason that might result in these prefer- ences is that agreeable and conscientious users b enet from the clar- ity and structure pr ovided by visual explanations, wher eas, users with intuitive DMS who rely on rst impressions when making de- cisions found b oth explanation formats intuitiv e enough to support immediate observability . However , despite the signicant eects that emerged in relation to Agreeableness, Conscientiousness, and intuitive DMS, the overall pattern remained consistent with the main eects obser ved across all users, namely that, compared to textual explanations, visual explanations led to higher levels of trust and satisfaction (both with signicance), perceived control, and transparency . This suggests that personalizing explanation for- mats based on Big Five traits may not be necessar y . Furthermore, our results show no moderating eects of other PCs (i.e., NFC, VF, and TE) on users’ perceptions of e xplanation formats. A possible explanation for the absence of these moderation eects lies in the deliberately simple and intuitive design of the explanations. Both Visual vs. T extual Explanations in an ERS UMAP ’26, Gothenburg, Sweden, explanations presented information clearly , did not require any complicated interaction, and avoided te chnical complexity . As a result, understanding the explanations did not demand additional cognitive eort, familiarity with advanced visualizations, or prior knowledge of RS. Design guideline: Visual explanations in ERSs that follow a clear , intuitive, and simple design would likely b e sucient for users with diverse PCs to foster p er ceived control, transparency , trust, and satisfaction. 7 Conclusion In this study , we investigated how explanation format (visual vs. textual) and users’ personal characteristics (PCs) impact their per- ceptions of control, transparency , trust, and satisfaction in an e du- cational recommender system (ERS), an area that still remained un- derexplored. Thr ough a within-subject user study (n=54), we found that visual explanations signicantly increase trust and satisfac- tion, while perceived control and transparency remain comparable across explanation formats. Furthermore, PCs played a limited role in shaping users’ perceptions of e xplanation formats, with visual explanations yielding consistent b enets across users. Based on our ndings, we derived design guidelines for the ee ctiv e design of explanations in ERSs. References [1] Amina Adadi and Mohammed Berrada. 2018. Pe eking inside the black-box: a survey on explainable articial intelligence (XAI). IEEE access 6 (2018), 52138– 52160. [2] Qurat Ul Ain, Mohamed Amine Chatti, Mouadh Guesmi, and Shoeb Joarder . 2022. A multi-dimensional conceptualization framework for personalized explanations in recommender systems. In Companion Proceedings of the 27th International Conference on Intelligent User Interfaces . 11–23. [3] Ibrahim Al-Hazwani, Gabriela Morgenshtern, Mennatallah El- Assady , and Jür- gen Bernard. 2025. f-RecX: A framework for designing eective textual ex- planations in recommender systems’ user interfaces. International Journal of Human-Computer Studies (2025), 103627. [4] Krisztian Balog and Filip Radlinski. 2020. Measuring recommendation expla- nation quality: The conicting goals of explanations. In Proceedings of the 43rd international ACM SIGIR conference on research and development in information retrieval . 329–338. [5] Virginia Braun and Victoria Clarke. 2021. Thematic analysis: A practical guide. (2021). [6] Shuo Chang, F Maxwell Harper , and Loren Gilbert T er v een. 2016. Crow d-based personalized natural language explanations for recommendations. In Proceedings of the 10th ACM conference on recommender systems . 175–182. [7] Mohamed Amine Chatti, Mouadh Guesmi, and Arham Muslim. 2024. Visualiza- tion for recommendation explainability: a survey and new perspectives. ACM Transactions on Interactive Intelligent Systems 14, 3 (2024), 1–40. [8] Mohamed Amine Chatti, Mouadh Guesmi, Laura V orgerd, Thao Ngo, Shoeb Joarder , Qurat Ul Ain, and Arham Muslim. 2022. Is more always better? The eects of personal characteristics and level of detail on the perception of explanations in a recommender system. In Proceedings of the 30th ACM Conference on User Modeling, Adaptation and Personalization . 254–264. [9] Xu Chen, Hanxiong Chen, Hongteng Xu, Y ongfeng Zhang, Yixin Cao, Zheng Qin, and Hongyuan Zha. 2019. Personalized fashion recommendation with visual explanations based on multimodal attention network: T owards visually explainable recommendation. In Proceedings of the 42nd international ACM SIGIR conference on research and development in information retrieval . 765–774. [10] Felipe Costa, Sixun Ouyang, Peter Dolog, and Aonghus Lawlor . 2018. A utomatic generation of natural language explanations. In Companion Proceedings of the 23rd International Conference on Intelligent User Interfaces . 1–2. [11] Vicente Dominguez, Pablo Messina, Ivania Donoso-Guzmán, and Denis Parra. 2019. The eect of explanations and algorithmic accuracy on visual recommender systems of artistic images. In Proceedings of the 24th International Conference on Intelligent User Interfaces . 408–416. [12] Franz Faul, Edgar Erdfelder , Albert-Georg Lang, and Axel Buchner . 2007. G* Power 3: A exible statistical power analysis program for the social, behavioral, and biomedical sciences. Behavior research metho ds 39, 2 (2007), 175–191. [13] Fatih Gedikli, Dietmar Jannach, and Mouzhi Ge. 2014. How should I explain? A comparison of dierent explanation types for recommender systems. Interna- tional Journal of Human-Computer Studies 72, 4 (2014), 367–382. [14] Samuel D Gosling, Peter J Rentfrow , and William B Swann Jr . 2003. A very brief measure of the Big-Five personality domains. Journal of Research in personality 37, 6 (2003), 504–528. [15] Mouadh Guesmi, Mohamed Amine Chatti, Shoeb Joarder , Qurat Ul Ain, Rawaa Alatrash, Clara Siepmann, and T annaz V ahidi. 2024. Interactive explanation with varying level of details in an e xplainable scientic literature recommender system. International Journal of Human–Computer Interaction 40, 22 (2024), 7248–7269. [16] Mouadh Guesmi, Mohamed Amine Chatti, Shoeb Joarder , Qurat Ul Ain, Clara Siepmann, Hoda Ghanbarzadeh, and Rawaa Alatrash. 2023. Justication vs. Transparency: Why and How Visual Explanations in a Scientic Literature Rec- ommender System. Information 14, 7 (2023). doi:10.3390/info14070401 [17] Mouadh Guesmi, Mohamed Amine Chatti, Laura V orgerd, Shoeb Joarder , Shadi Zumor , Yiqi Sun, Fangzheng Ji, and Arham Muslim. 2021. On-demand personal- ized explanation for transparent recommendation. In Adjunct Proceedings of the 29th A CM Conference on User Modeling, Adaptation and Personalization . 246–252. [18] Mouadh Guesmi, Mohamed Amine Chatti, Laura V orgerd, Shoeb Ahmed Joarder , Qurat Ul Ain, Thao Ngo, Shadi Zumor , Yiqi Sun, Fangzheng Ji, and Arham Muslim. 2021. Input or Output: Eects of Explanation Focus on the Perception of Explainable Recommendation with V arying Level of Details.. In Intrs@ recsys . 55–72. [19] Mouadh Guesmi, Mohamed Amine Chatti, Laura V orgerd, Thao Ngo, Shoeb Joarder , Qurat Ul Ain, and Arham Muslim. 2022. Explaining user models with dierent levels of detail for transparent recommendation: A user study . In Ad- junct Proceedings of the 30th ACM Conference on User Modeling, Adaptation and Personalization . 175–183. [20] Deepesh V Hada, Vijaikumar M, and Shirish K Shevade. 2021. Re xplug: Ex- plainable recommendation using plug-and-play language model. In Proceedings of the 44th international ACM SIGIR conference on research and development in information retrieval . 81–91. [21] Katherine Hamilton, Shin-I Shih, and Susan Mohammed. 2016. The development and validation of the rational and intuitive decision styles scale. Journal of personality assessment 98, 5 (2016), 523–535. [22] Curtis P Haugtvedt, Richard E Petty , and John T Cacioppo. 1992. Need for cognition and advertising: Understanding the role of p ersonality variables in consumer behavior . Journal of consumer psychology 1, 3 (1992), 239–260. [23] Marco Hellmann, Diana C Hernandez-Bocanegra, and Jürgen Ziegler . 2022. De- velopment of an instrument for measuring users’ perception of transparency in recommender systems. system 12 (2022), 7. [24] Jonathan L Herlocker , Joseph A K onstan, and John Riedl. 2000. Explaining col- laborative ltering recommendations. In Proceedings of the 2000 ACM conference on Computer supported coop erativ e work . 241–250. [25] Diana C Hernandez-Bocanegra and Jürgen Ziegler . 2021. Explaining review- based recommendations: Eects of prole transparency , presentation style and user characteristics. i-com 19, 3 (2021), 181–200. [26] David C Howell. 1992. Statistical methods for psychology . PWS-Kent Publishing Co. [27] Jinkyu Kim, Anna Rohrbach, Trevor Darrell, John Canny , and Zeynep Akata. 2018. T extual explanations for self-driving vehicles. In Proceedings of the European conference on computer vision (ECCV) . 563–578. [28] René F Kizilcec. 2016. How much information? Eects of transparency on trust in an algorithmic interface. In Proceedings of the 2016 CHI conference on human factors in computing systems . 2390–2395. [29] Bart P Knijnenburg, Martijn C Willemsen, Zeno Gantner , Hakan Soncu, and Chris Newell. 2012. Explaining the user experience of recommender systems. User modeling and user-adapted interaction 22, 4 (2012), 441–504. [30] Pigi Kouki, James Schaer , Jay Pujara, John O’Donovan, and Lise Getoor . 2017. User preferences for hybrid explanations. In Procee dings of the Eleventh ACM Conference on Recommender Systems . 84–88. [31] Pigi Kouki, James Schaer , Jay Pujara, John O’Donovan, and Lise Getoor . 2019. Personalized explanations for hybrid recommender systems. In Proce edings of the 24th international conference on intelligent user interfaces . 379–390. [32] T odd Kulesza, Margaret Burnett, W eng-K een W ong, and Simone Stumpf. 2015. Principles of explanatory debugging to p ersonalize interactiv e machine learning. In Proceedings of the 20th international conference on intelligent user interfaces . 126–137. [33] T odd Kulesza, Simone Stumpf, Margaret Burnett, Sherry Y ang, Irwin K wan, and W eng-Keen W ong. 2013. T oo much, too little, or just right? W ays explanations impact end users’ mental models. In 2013 IEEE Symp osium on visual languages and human centric computing . IEEE, 3–10. [34] Johannes Kunkel, Tim Donkers, Lisa Michael, Catalin-Mihai Barbu, and Jürgen Ziegler . 2019. Let me explain: Impact of personal and impersonal explanations on trust in recommender systems. In Proceedings of the 2019 CHI conference on human factors in computing systems . 1–12. [35] Johannes Kunkel, Thao Ngo , Jürgen Ziegler , and Nicole Krämer . 2021. Identifying group-specic mental models of recommender systems: A novel quantitative UMAP ’26, Gothenburg, Sweden, Ain et al. approach. In IFIP Conference on Human-Computer Interaction . Springer , 383–404. [36] Q V era Liao and S Shyam Sundar . 2022. Designing for responsible trust in AI systems: A communication perspective. In Pr oceedings of the 2022 A CM conference on fairness, accountability , and transparency . 1257–1268. [37] Brian Y Lim and Anind K Dey. 2009. Assessing demand for intelligibility in context-aware applications. In Proceedings of the 11th international conference on Ubiquitous computing . 195–204. [38] Y ujie Lin, Pengjie Ren, Zhumin Chen, Zhaochun Ren, Jun Ma, and Maarten De Rijke. 2019. Explainable outt recommendation with joint outt matching and comment generation. IEEE Transactions on Knowledge and Data Engineering 32, 8 (2019), 1502–1516. [39] Gabriel Lins de Holanda Coelho, Paul HP Hanel, and Lukas J. W olf. 2020. The very ecient assessment of need for cognition: Developing a six-item version. Assessment 27, 8 (2020), 1870–1885. [40] Hongyu Lu, W eizhi Ma, Yifan W ang, Min Zhang, Xiang W ang, Yiqun Liu, T at- Seng Chua, and Shaoping Ma. 2023. User perception of recommendation explana- tion: Are your explanations what users need? A CM Transactions on Information Systems 41, 2 (2023), 1–31. [41] Maria Madsen and Shirley Gregor . 2000. Measuring human-computer trust. In 11th australasian conference on information systems , V ol. 53. Citeseer , 6–8. [42] Millecamp Martijn, Cristina Conati, and Katrien V erbert. 2022. “Knowing me, knowing you”: personalized explanations for a music recommender system. User Modeling and User-Adapted Interaction 32, 1 (2022), 215–252. [43] Harrison McKnight, Michelle Carter , and Paul Clay. 2009. Trust in technology: Development of a set of constructs and measures. (2009). [44] Martijn Millecamp, Nyi Nyi Htun, Cristina Conati, and Katrien V erbert. 2019. T o explain or not to explain: the eects of personal characteristics when explaining music recommendations. In Proceedings of the 24th international conference on intelligent user interfaces . 397–407. [45] Martijn Mille camp , Nyi Nyi Htun, Cristina Conati, and Katrien V erbert. 2020. What’s in a user? T owar ds personalising transparency for music recommender interfaces. In Proceedings of the 28th A CM Conference on User Modeling, Adaptation and Personalization . 173–182. [46] Tim Miller . 2019. Explanation in articial intelligence: Insights from the social sciences. Articial intelligence 267 (2019), 1–38. [47] Tim Miller . 2022. Are we measuring trust correctly in explainability , interpretabil- ity , and transparency r esearch? arXiv preprint arXiv:2209.00651 (2022). [48] T amara Munzner . 2025. Visualization analysis and design. In Proceedings of the Special Interest Group on Computer Graphics and Interactive T echniques Conference Courses . 1–2. [49] Cataldo Musto, Pasquale Lops, Marco de Gemmis, and Giovanni Semeraro. 2019. Justifying recommendations through aspect-based sentiment analysis of users reviews. In Proceedings of the 27th ACM conference on user modeling, adaptation and personalization . 4–12. [50] Cataldo Musto, Fedelucio Narducci, Pasqu ale Lops, Marco De Gemmis, and Giovanni Semerar o. 2016. Explod: A frame work for explaining recommendations based on the linked open data cloud. In Proceedings of the 10th ACM Conference on Recommender Systems . 151–154. [51] Sidra Naveed, Tim Donkers, and Jürgen Ziegler . 2018. Argumentation-base d explanations in recommender systems: Conceptual framework and empirical results. In Adjunct Publication of the 26th Conference on User Mo deling, Adaptation and Personalization . 293–298. [52] Ingrid Nunes and Dietmar Jannach. 2017. A systematic review and taxonomy of explanations in decision support and recommender systems. User Modeling and User- Adapted Interaction 27, 3 (2017), 393–444. [53] Jeroen Ooge, Shotallo Kato, and K atrien V erb ert. 2022. Explaining recommen- dations in e-learning: Eects on adolescents’ trust. In Proceedings of the 27th International Conference on Intelligent User Interfaces . 93–105. [54] Pearl Pu, Li Chen, and Rong Hu. 2011. A user-centric evaluation framew ork for recommender systems. In Proceedings of the fth ACM conference on Recommender systems . 157–164. [55] Pearl Pu, Li Chen, and Rong Hu. 2012. Evaluating recommender systems from the user’s perspective: survey of the state of the art. User Mo deling and User-Adapted Interaction 22, 4 (2012), 317–355. [56] Masahiro Sato, Koki Nagatani, T akashi Sonoda, Qian Zhang, and T omoko Ohkuma. 2019. Context style explanation for recommender systems. Journal of Information Processing 27 (2019), 720–729. [57] Clara Siepmann and Mohamed Amine Chatti. 2023. Trust and transparency in recommender systems. arXiv preprint arXiv:2304.08094 (2023). [58] Peijie Sun, Le Wu, Kun Zhang, Y u Su, and Meng W ang. 2021. An unsupervised aspect-aware recommendation model with explanation text generation. ACM Transactions on Information Systems (TOIS) 40, 3 (2021), 1–29. [59] Maxwell Szymanski, Martijn Millecamp, and Katrien V erbert. 2021. Visual, textual or hybrid: the eect of user expertise on dierent explanations. In Proceedings of the 26th international conference on intelligent user interfaces . 109–119. [60] Nava Tintarev . 2017. Presenting diversity aware recommendations. In F A TREC W orkshop on Responsible Recommendation Procee dings . [61] Nava Tintarev and Judith Mastho. 2007. A survey of explanations in recom- mender systems. In 2007 IEEE 23rd international conference on data engineering workshop . IEEE, 801–810. [62] Nava Tintarev and Judith Mastho. 2010. Designing and evaluating explanations for recommender systems. In Recommender systems handbook . Springer , 479–510. [63] Nava Tintarev and Judith Mastho. 2015. Explaining Recommendations: Design and Evaluation . Springer US, Boston, MA, 353–382. doi:10.1007/978- 1- 4899- 7637- 6_10 [64] Chun-Hua T sai and Peter Brusilovsky . 2019. Explaining recommendations in an interactive hybrid social recommender . In Proce e dings of the 24th international conference on intelligent user interfaces . 391–396. [65] Jesse Vig, Shilad Sen, and John Riedl. 2009. T agsplanations: explaining recommen- dations using tags. In Proceedings of the 14th international conference on Intelligent user interfaces . 47–56. [66] Danding W ang, Qian Y ang, Ashraf Abdul, and Brian Y Lim. 2019. Designing theory-driven user-centric explainable AI. In Proceedings of the 2019 CHI confer- ence on human factors in computing systems . 1–15. [67] Colin Ware . 2019. Information visualization: perception for design . Morgan Kaufmann. [68] Yikun Xian, Zuohui Fu, Handong Zhao, Yingqiang Ge, Xu Chen, Qiaoying Huang, Shijie Geng, Zhou Qin, Gerard De Melo, Shan Muthukrishnan, et al . 2020. CAFE: Coarse-to-ne neural symbolic reasoning for e xplainable recommendation. In Proceedings of the 29th A CM International Conference on Information & Knowledge Management . 1645–1654. [69] Fumeng Y ang, Zhuanyi Huang, Jean Scholtz, and Dustin L Arendt. 2020. How do visual explanations foster end users’ appropriate trust in machine learning? . In Proceedings of the 25th international conference on intelligent user interfaces . 189–201. [70] Mengyuan Y ang, Mengying Zhu, Y an W ang, Linxun Chen, Yilei Zhao, Xiuyuan W ang, Bing Han, Xiaolin Zheng, and Jianwei Yin. 2024. Fine-tuning large lan- guage model based explainable recommendation with explainable quality reward. In Proceedings of the AAAI Conference on Articial Intelligence , V ol. 38. 9250–9259. [71] Y ongfeng Zhang, Xu Chen, et al . 2020. Explainable recommendation: A sur ve y and new persp ectives. Foundations and Trends ® in Information Retrieval 14, 1 (2020), 1–101. [72] Guoshuai Zhao, Hao Fu, Ruihua Song, T etsuya Sakai, Zhongxia Chen, Xing Xie, and Xueming Qian. 2019. Personalized reason generation for explainable song recommendation. A CM Transactions on Intelligent Systems and T echnology (TIST) 10, 4 (2019), 1–21. [73] Guoshuai Zhao, Hao Fu, Ruihua Song, Tetsuya Sakai, Xing Xie, and Xueming Qian. 2018. Why y ou should listen to this song: Reason generation for e xplainable recommendation. In 2018 IEEE International Conference on Data Mining W orkshops (ICDMW) . IEEE, 1316–1322. [74] Ruijing Zhao, Izak Benbasat, and Hasan Cavusoglu. 2019. Do users always want to know more? Inv estigating the relationship between system transparency and users’ trust in advice-giving systems. In Proceedings of the 27th European Conference on Information Systems .
Original Paper
Loading high-quality paper...
Comments & Academic Discussion
Loading comments...
Leave a Comment