A Ray-Based Characterization of Satellite-to-Urban Propagation
The evolution toward 6G communication systems is expected to rely on integrated three-dimensional network architectures where terrestrial infrastructures coexist with non-terrestrial stations such as satellites, enabling ubiquitous connectivity and s…
Authors: Nicolò Cenni, Marina Barbiroli, Vittorio Degli-Esposti
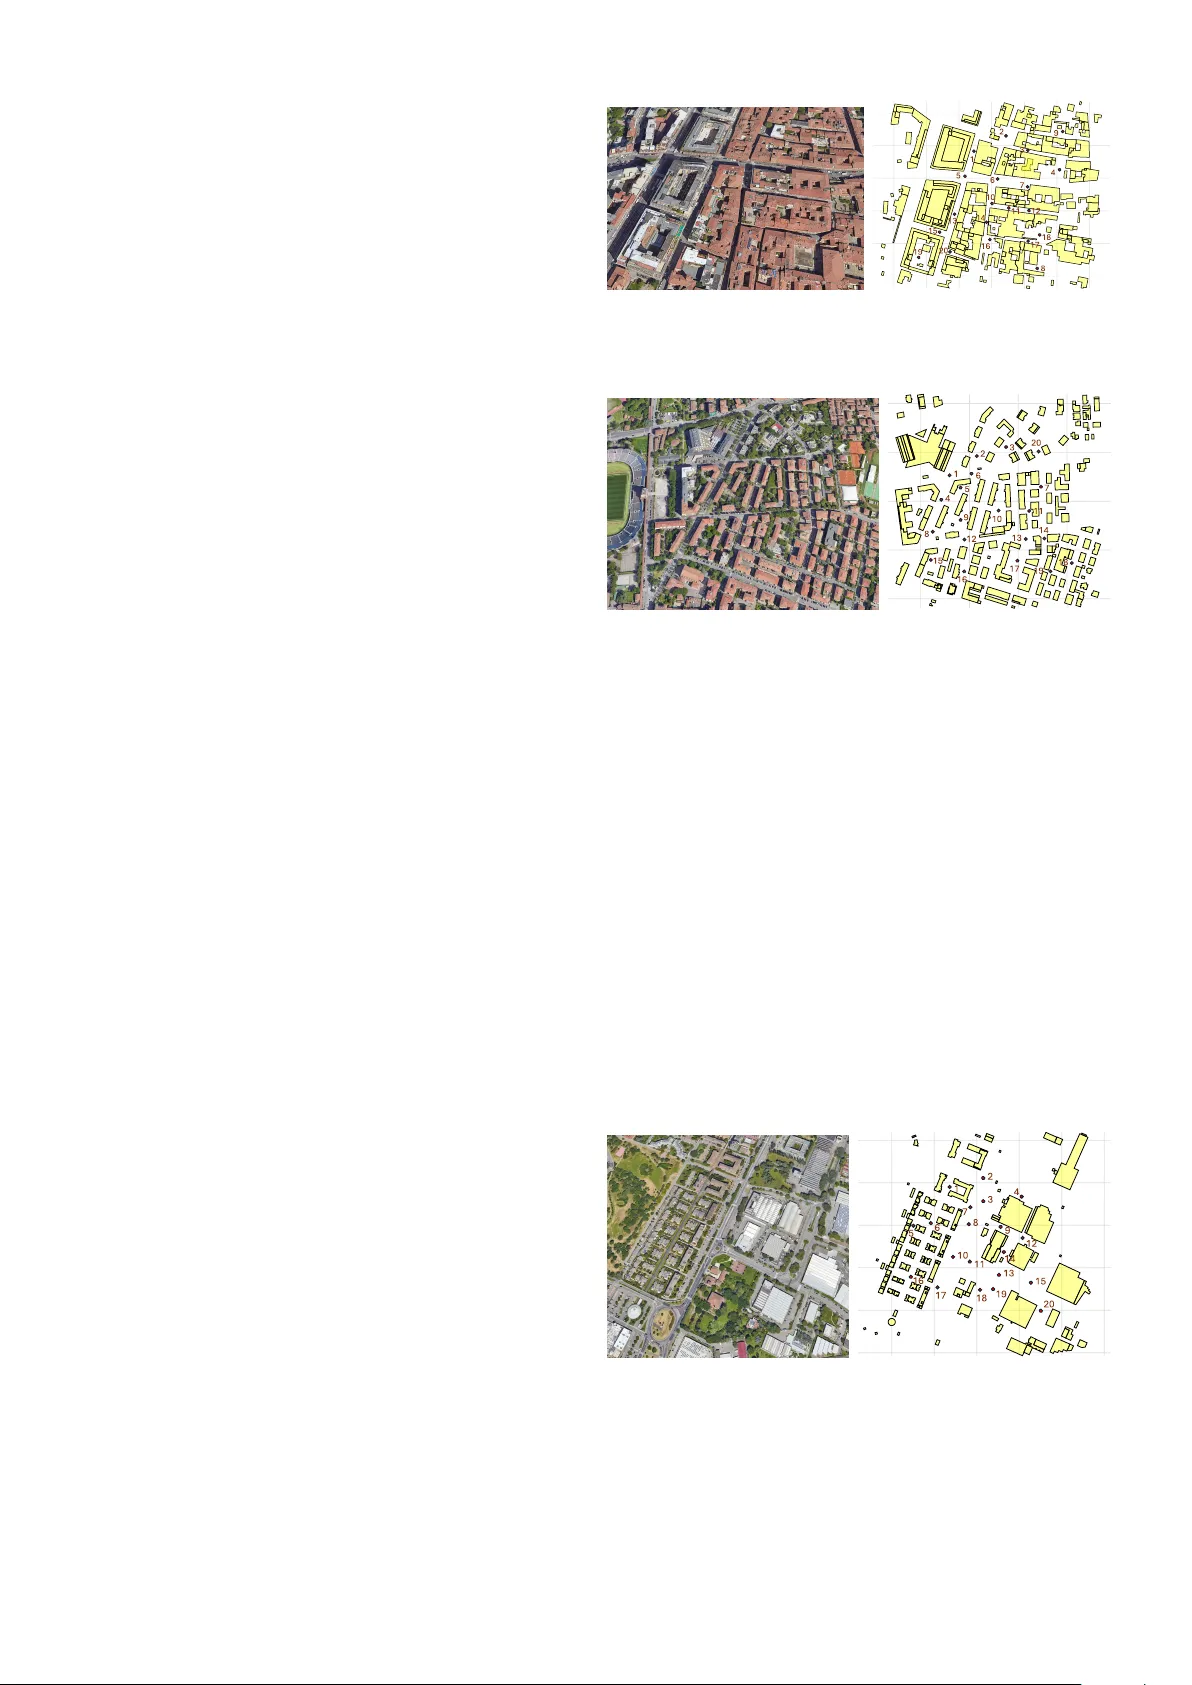
A Ray-Based Characterization of Satellite-to-Urban Propagation Nicol ` o Cenni, Marina Barbiroli, V ittorio Degli-Esposti, Enrico M. V itucci, Carla Amatetti, Franco Fuschini Abstract —The evolution toward 6G communication systems is expected to rely on integrated thr ee-dimensional network architectur es where terr estrial infrastructures coexist with non- terrestrial stations such as satellites, enabling ubiquitous con- nectivity and service continuity . In this context, accurate channel models f or satellite-to-ground propagation in urban en vironments are essential, particularly for user equipment located at street level where obstruction and multipath effects are significant. This work in vestigates satellite-to-urban propagation through deterministic ray-tracing simulations. Three repr esentative ur- ban layouts are considered, namely dense urban, urban, and suburban. Multiple use cases ar e in vestigated, including handheld devices, v ehicular terminals, and fixed rooftop r eceivers operating across several frequency bands. The analysis focuses on the relati ve importance of competing propagation mechanisms and on two key channel parameters, namely the Rician K -factor and the delay spread, which are relev ant for the calibration of channel models to be used in link- and system-level simulations. Results highlight the strong - and in some cases uncon ventional - dependence of channel dispersion and fading characteristics on satellite elevation, antenna placement, and urban morphology . Index T erms —Non-T errestrial Networks, 3D Networks, Ray T racing, Radio Propagation, Rician K -factor , Diffuse Scattering. I . I N T RO D U C T I O N The ev olution toward 6G networks to achiev e ubiquitous and high-capacity global connectivity demands the deployment of unified, seamless 3D network architectures where terrestrial infrastructures and non-terrestrial nodes such as Unmanned Aerial V ehicles, High Altitude Platforms and satellites com- plement each other [1]. The 3D architecture not only ensures reliable coverage for rural and underserved areas and main- tains connectivity during disruptive ev ents such as natural disasters but also enhances the performance of traditional terrestrial networks in a cost-effecti ve way . In addition, it supports service a vailability under high-mobility conditions and strengthens machine-to-machine communications by en- abling seamless service continuity . This ne w integrated 3D architecture is expected to include not only line-of-sight (LoS) user equipment (UE) on top of buildings, but also pedestrian The authors are with the Department of Electrical, Electronic and In- formation Engineering “G. Marconi, ” CNIT , Univ ersity of Bologna, Italy , e-mail: nicolo.cenni2, marina.barbiroli, v .degliesposti, enricomaria.vitucci, carla.amatetti2, franco.fuschini @unibo.it This work has been carried out in the framework of the 6G-NTN project, funded by the Smart Networks and Services Joint Undertaking (SNS JU) under the European Union’s Horizon Europe research and innovation programme under Grant Agreement No 101096479. The work was also supported in part by the EU COST Action INTERACT (Intelligence-Enabling Radio Communications for Seamless Inclusive Interactions), Grant CA20120. UE at street le vel and/or in vehicular mobility in non LoS (NLoS) locations. These ground stations can be deployed within dense urban environments, where obstructions such as street furniture and buildings can introduce significant propagation impairments and strongly impact the receiv ed signal quality . In this scenario, the a vailability of a highly accurate and reliable channel model, accounting for different propagation characteristics (multipath propagation in NLoS condition at ground level and LoS propagation on top of building), is crucial to effecti vely assess the overall system performance [2]. In this respect, performance and challenges of channel models for Non T errestrial Networks (NTN) are reported in [3]. Standardized channel models for link level simulations have been proposed by the 3GPP , though the T echnical Report 38.811 [4], leveraging the 3GPP New Radio channel model defined in 3GPP TR 38.901 [5] and by ITU- R P .681 [6]. These models are defined for the S and Ka bands and belong to the family of T apped Delay Line (TDL) models, where each tap represents a cluster of rays with similar delay and is associated with an amplitude coefficient statistically modeled according to a Rayleigh (LoS) or a Rice (NLoS) distrib ution. If effecti vely tuned, TDL models can be applied to different environments and elev ation angles. Other models rely on the clutter loss (CL) ev aluation, defined as the attenuation of signal po wer caused by the surrounding clutter of the receiv ers, e.g., buildings and ve getation on the ground [7]. In particular, in [7], some empirical values are pro- vided under different elev ation angles for the S-band and the Ka-band. Unfortunately , studies on Satellite-to-Ground (S2G) propagation in urban en vironments remain scarce, and standard models, including the 3GPP model, still exhibit limitations in both scope and reliability . As highlighted in [8], these include counter-intuiti ve K -factor trends, K -factor values reported only for the LoS condition, and frequency ranges restricted to the S and Ka bands. This paper aims at addressing these gaps by extending the ev aluation to the C, Q, and V frequency bands, and providing K -factor and Delay Spread (DS) estimates in both LoS and NLoS locations. These two parameters are key propagation indicators, as they capture the channel’ s dispersiv e characteristics and are essential inputs for TDL-based link- lev el simulators. Howe ver , it should be noted that Path Loss (PL) is also part of the 3GPP propagation model alongside the K -factor and DS. In this study , PL is not explicitly addressed because, from a propagation perspective, the key innov ati ve aspect of the 3D architecture envisioned for future satellite systems lies in enabling signal reception at street level and in NLoS condition. The primary challenge, therefore, is to analyze the relative importance of individual propagation mechanisms and model the sensitivity of channel dispersion properties and multipath effects to the different use cases en visaged for the forthcoming NTN. Excess attenuation at street le vel, compared to rooftop reception, does not introduce new elements beyond what has already been described in 3GPP channel models [4], [5]. The analysis is carried out through an image-based 3D Ray Tracing (R T) tool, dev eloped in house at the Univ ersity of Bologna and widely v alidated vs. measurements in urban en vironment [9], capable of simulating multipath propagation in indoor and outdoor environments with multiple interactions, including specular reflection, trans- mission, dif fraction, dif fuse scattering and combinations of these. Simulations are carried out in three different urban sce- narios, characterized by different building densities, namely: dense urban, urban and suburban. It is worth noting that the main objecti ve of the present study is to analyze the impact of propagation within the urban structure in the final segment of the satellite-to-urban link and to improve its modeling, rather than to study atmospheric effects. W e assume that such effects can be separately addressed according to specific models av ailable in the literature, that are beyond the scope of the present work. The remainder of the paper is or ganized as follows: Section II describes the simulation frame work and the considered environments; Section III explains how the propagation parameters are extracted from the simulations; Section IV presents and discusses the simulation results; finally , Section V draws some conclusions. I I . S I M U L A T I O N F R A M E W O R K A. Geometrical Description of the Scenarios Three areas of the city of Bologna (Italy) were selected as reference scenarios for the simulations and were reconstructed based on a digital database, with buildings, streets and other urban elements modeled as solid prisms, i.e. polygons with height. The dense urban scenario (Fig. 1) corresponds to the historical city center, characterized by narro w streets, enclosed courtyards, and a dense grid of mid-rise buildings. It covers an area of 340 m × 290 m and includes 200 buildings, with a mean height of 15 m and a 9 m standard deviation (T able I). The complex structure, including both small alleys and open squares, leads to frequent LoS obstructions and a high level of multipath components due to reflections and diffuse scattering. The urban scenario is represented by an area close to the city Stadium, a typical residential neighborhood featuring medium- density housing and small priv ate gardens (Fig. 2). The area spans 440 m × 440 m and includes 188 buildings, with a mean height of approximately 13 m and a standard deviation of 7 m (T able I). The geometry here provides a mixture of LoS and NLoS conditions, depending on the elev ation angle of the satellite. Compared to the dense urban area, this en vironment has more open spaces, resulting in improv ed LoS av ailability , especially at moderate to high elev ation angles. The suburban scenario encompasses a 540 m × 540 m peripheral district of (a) (b) Fig. 1: Bologna dense urban: aerial ov erview (a) and digital map for simulations highlighting the 20 receiv er grids’ positions (b). (a) (b) Fig. 2: Bologna urban: aerial ov erview (a) and digital map for simulations highlight the 20 receiver grids’ positions (b). Bologna where low-rise residential buildings are interspersed with industrial structures and green areas (Fig. 3). This con- figuration results in significantly lower building density , an av erage building height of 8 m, and 5 m standard deviation for a total of 184 buildings (T able I). Due to the sparse layout and reduced obstructions, this en vironment offers the highest LoS probability , even at low elev ation angles, and typically shows lower multipath richness. In order to perform a statistically significant analysis, 20 square receiver grids, each measuring 4 m per side and con- taining 15 × 15 receivers, are strategically placed throughout the map in each scenario, to capture as much en vironmental variability as possible. An overvie w of the selected recei ver spots in the digital maps is provided in Figs. 1b, 2b, 3b. The aerial transmitting station simulates a Low-Earth Orbit (a) (b) Fig. 3: Bologna suburban: aerial ov erview (a) and digital map for simulations highlighting the 20 receiver grids’ positions (b). RX Ele va t ion an gle (a) RX (b) Fig. 4: (a) Side view illustrating the satellite elev ation angle. (b) T op view showing an example configuration of six satellite azimuth angles uniformly spaced by 60°. Image generated using AI (Google Gemini) and refined by the authors. (LEO) satellite, assumed to be located at a distance of 500 km from the Earth surface. For each grid, nine satellite ele vation angles were considered (Fig. 4a), ranging from 10 ◦ to 90 ◦ in 10 ◦ increments. In addition, six azimuth angles were selected, starting from a randomly chosen direction and uniformly spaced at 60 ◦ intervals (Fig. 4b). The main information related to the geometrical description of the scenarios are summed up in T able I. T ABLE I: Simulations geometrical data Dense Urban Urban Suburban Map size 340 m × 290 m 440 m × 440 m 540 m × 540 m No. of buildings 200 188 184 Building density (no./km 2 ) 2028 971 631 Mean buildings height 15 m 13 m 8 m Elev ation range 10 ◦ , 20 ◦ , 30 ◦ , 40 ◦ , 50 ◦ , 60 ◦ , 70 ◦ , 80 ◦ Grid size 4 m No. of receivers per grid 225 Space to earth distance 500 km B. Link and Communication P arameters Since the receiving locations can be of course assumed well included inside the footprint of the satellite antenna in real applications, an isotropic radiation pattern has been considered at the aerial station for the sake of simplicity , with circular polarization in agreement with [4]. Three different antenna types are instead considered for the Earth equipment, depending on the communication frequency and addressing different use cases [4]: • Isotr opic : it accounts for handheld (or IoT) devices, working in the lo west frequency band (S/C) at 1.5 m from the ground level; • P atch-like : it still w orks in the S/C bands and is concei ved for vehicular application, where the antenna is placed on car roofs, with a mild directivity and vertical boresight direction reg ardless of the satellite position; • 60 cm equivalent aperture (V -SA T in [4]): it represents a directiv e antenna intended for fixed reception. In this case, to achieve a higher probability of LoS, the user equipment is raised at the (average) rooftop level, with antenna boresight always pointed towards the satellite po- sition. This antenna is most suited to the higher frequency bands, i.e Ka, Q and V bands, where a reasonably sized antenna can still provide adequate performance. The main properties of the dif ferent considered antennas at the earth end user are summarized in T able II. C. Ray T racing Simulator The simulations are conducted using the 3D R T tool de- veloped at the University of Bologna [9]. The input data of the R T simulator consists of ”Shape” format databases, where buildings and objects are modeled as polygons with height, corresponding to the rooftop lev el with respect to ground. The electromagnetic parameters (relativ e permittivity ϵ r and electric conductivity σ ) for each building wall are also included, as well as the 3D radiation characteristics of the antennas including the field polarization. Specular propagation mechanisms (reflections, edge diffractions) are modeled using geometric optics theory and its extensions, like the uniform theory of diffraction [10]–[12]. The field carried by the m-th ray at a given receiver location is computed according to the following equation: E m ( Rx ) = " N m Y k =0 D k ( λ 0 , ε r , σ ) · E T x 0 # · A ( r 0 , r 1 , ..., r N m ) · e − j 2 π λ 0 ( r 0 + r 1 + ... + r N m ) (1) where N m is the number of bounces of the m-th ray , E T x 0 = E T x ( r = 1 , θ 0 , ϕ 0 ) is the electric field emitted by the Tx antenna to ward the direction of the first reflec- tion/diffraction point – or toward the Rx, in the case of LoS rays – at a reference distance of 1 m , λ 0 = c 0 /f is the free- space wa velength corresponding to the simulation frequency , r k with k = 0 , 1 , .., N m is the length of the k-th ray segment, D k is a dyadic interaction coef ficient that depends on the k-th interaction type (reflection or diffraction), as well as the wa velength and the electromagnetic parameters, A is the spr eading factor that takes into account the total attenuation along the ray , and the complex exponential takes into account the phase shift corresponding to the total ray length. For LoS rays, the multiplication of dyadics in (1) degener - ates into the identity tensor D 0 = 1 , while the attenuation factor boils down to A = 1 /r 0 . For rays with specular reflections only , the dyadics D k are computed through the well-known Fresnel’ s coefficients, while the attenuation factor becomes A = ( r 0 + r 1 + .. + r N m ) − 1 . The expressions of dyadic coefficients and attenuation that are used for rays with edge dif fractions can be found in [10], [11]. In addition to specular interactions, one simulator key feature is the integration of a diffuse scattering model based on the Effecti ve Roughness (ER) approach, which takes into account non-specular dif fuse scattering mechanisms caused by surface or v olume irregularities [13]–[15]. The basic assump- tion of the ER model is that irregular walls are divided into T ABLE II: Use cases Use Case Earth Antenna T ype Polarization Frequency Band Directivity HPBW Position Handheld Isotropic Linear (vertical) S (1.98-2.2 GHz) / C (3.4-3.9 GHz) 0 dBi – Ground level (1.5 m) V ehicular Patch-like ∼ 6 dBi 120 ◦ Car Roof (1.5 m) Fixed 60 cm Aperture Circular Ka (17-30 GHz) ∼ 44 dBi 2.9 ◦ A verage Building Height Q (36-46 GHz) ∼ 48 dBi 1.8 ◦ V (46-56 GHz) ∼ 50 dBi 1.5 ◦ elements, or ”tiles” of a giv en area ∆ A , each one generates a scattered field computed as [14], [15]: E s ( Rx ) = K T S Γ( ˆ k i ) r i r s · s f ( ˆ k i , ˆ k s ) F ( ˆ k i ) ∆ A cos ϑ i · ˆ p s e j χ s (2) where ˆ k i , ˆ k s are the incidence and observation directions, respectiv ely , K T is an amplitude function depending on the Tx power and Tx antenna gain in the incidence direction ˆ k i , S ∈ [0 , 1] is the scattering parameter which depends on the degree of irregularity of the wall and expresses the percentage of field intensity diffused in non-specular directions at the expense of specular reflection, Γ( ˆ k i ) is the specular reflection coefficient computed for incidence direction ˆ k i , f ( ˆ k i , ˆ k s ) is a function that represents the shape of the scattering pattern, ϑ i = arccos ( − ˆ k i · ˆ n ) is the incidence angle, with ˆ n standing for the unit vector orthogonal to the wall surface, r i and r s are the length of the ray segments connecting the tile center with Tx and Rx, respectiv ely , ˆ p s is the polarization vector of the scattered field, χ s ∈ [ − π , π ] is a uniformly distributed random variable representing the phase of the scattering path, and F is a proper normalization factor of the scattering pattern, obtained through integration of the scattering function f on the whole half-space in front of the wall. The scattering function f ( ˆ k i , ˆ k s ) can hav e different forms, but the one that gave the best results in urban en vironments for microw av e and mm-wav e frequencies – and therefore used in the present work – is the single-lobe directive pattern, centered on the direction of specular reflection [13], [16], [17]: f ( ˆ k i , ˆ k s ) = 1 + cos ψ R 2 α R (3) where the exponent α R is a parameter that sets the pattern directivity – the higher α R , the narrower the lobe – while ψ R is the off-specular angle , that satisfies the following relation: cos ψ R = ˆ k r · ˆ k s = h ˆ k i − 2( ˆ k i · ˆ n ) ˆ n i · ˆ k s In order to ensure physical consistence of the ER model, a power balance between non-specular dif fuse scattering and specular interaction mechanisms – reflection, diffraction – is enforced. This leads to the relation S 2 + R 2 = 1 with R being the ”specular reduction factor”, as detailed in [13]. Correspondingly , the reduction factor R = √ 1 − S 2 is applied in (1) for all specular rays bouncing on walls where diffuse scattering is enabled (i.e. with S > 0 ). It is worth noting that, in order to calculate the rician K -factor , which is a propagation parameter dependent on multipath fading characteristics, an e valuation of the ”coher- ent” field is necessary , including its polarization and phase T ABLE III: Maximum number of interactions for each mechanism considered in R T simulations. The same values are adopted for all frequency bands and scenarios Interaction Mechanism Max. No. of Interactions # Reflections alone 3 # Diffractions alone 2 # Scatterings alone 1 # Reflections & scatterings together 2 # Reflections & diffractions together 2 # Diffractions & scatterings together 0 properties. This is naturally done for LoS and rays with specular interactions (reflections, edge diffractions) in accor- dance to (1). For diffuse scattering, polarization is modeled in (2) through the polarization vector ˆ p s which takes into account polarization rotations introduced by the scattering interaction, while the random phase χ s takes into account the stochastic nature of the dif fuse scattering mechanisms, that can be interpreted as the macroscopic effect of multiple micro- interactions (mainly dif fractions) caused by the rough surface and the internal volume irregularities [15]. Sequential combinations of different types of mechanisms such as reflections and diffractions in (1) are also possible, as well as reflections/dif fractions combined with diffuse scatter- ing by cascading (1) and (2). The maximum number of interactions considered in R T sim- ulations for different interaction types and their combinations is reported in T able III. The electromagnetic parameters used in the simulations with reference to different frequency bands and scenarios – including the relati ve dielectric permitti vity , conductivity , and the ER-model scattering parameter S – were obtained from the literature and previous work [16]–[18]. V alues are listed in T able IV for building walls, and in T able V for the terrain. The choice of diffuse scattering parameters for the terrain was made considering that a significant portion of the scatter- ing contribution from the ground depends on the fraction of area occupied by vehicles, which has been estimated through multiple representativ e maps for each type of environment. Therefore, the S values in T able V are highest for the dense urban scenario, characterized by the greatest vehicle density , followed by the urban and suburban scenarios. Moreover , the S values decrease with frequency , as the materials surface roughness becomes increasingly more significant at shorter wa velengths. Finally , in accordance with the previously cited works, the scattering tile area ∆ A was kept fixed to 5 × 5 m 2 , while the parameter α R was set for all simulations equal to 2 , which prov ed to be a suitable value for urban en vironments [16]. T ABLE IV: Electromagnetic parameters used in R T simulations for b uildings walls at two frequency bands. Identical values are assumed for all scenarios Parameters S/C bands Ka/Q/V bands Relativ e dielectric permittivity ε r 5 5.5 Conductivity (S/m) 0.01 0.4 Diffuse scattering parameter S 0.4 0.6 D. Ray Geometry Reuse and Narrowband Array Approxima- tion for Multi-F r equency and Multi-Antenna Evaluation T o reduce the computational burden associated to repeated R T simulations (e.g. at different frequency , and/or with dif fer- ent antenna patterns), a methodology was adopted where the geometric, electromagnetic, and spatial aspects of the problem are treated separately . First, the ray-path geometry is computed only once. This relies on the assumption that the set of propagation paths is frequency-independent, as it is determined exclusi vely by the physical environment and by the relativ e positions of the transmitter and recei ver . Frequenc y-dependent ef fects – such as material electromagnetic properties and phase rotation during propagation – are introduced in a post processing stage, where the field amplitude and phase of each ray are recalculated according to (1) and (2) for each frequency of interest. Second, the same R T realization obtained with isotropic antennas is reused to ev aluate dif ferent receiving antennas op- erating in different bands. The effect of the actual UE antenna is incorporated by weighting each ray with the corresponding antenna gain in its direction of arri v al. Since modifying the radiation pattern does not alter the ray geometry , this approach av oids the need for additional R T simulations while preserving deterministic propagation characteristics. Third, in order to ev aluate a dense grid of receiver locations, a ”narrowband array” approximation is applied [19], [20]. The electromagnetic field associated to each ray is computed only at the grid center and then extended to the entire 15 × 15 receiv er grid by assuming an impinging planar wav efront, thus introducing only phase shifts consistent with the relati ve receiv er positions. In other terms, the field computed through (1) and (2) are multiplied by the phase factor exp − j 2 π λ 0 ˆ k i · l n , l n = r n − r O (4) with the unit vector ˆ k i being the direction of incidence, while l n is the vector distance between the n-th location on the Rx grid ( r n ) and the grid center ( r O ). Overall, the adopted approach enables multi-frequency , multi-antenna, and multi-location ev aluation from a single R T run, providing a substantial reduction in computational complexity . The methodology adopted in this work is, in broad terms, analogous to the “Spatial filter for generating TDL channel model” described in Section 7.7.4 of [5], as both rely on a superposition-based approach. Ho we ver , it should be noted that the underlying channel models are inherently different: the R T is a deterministic point-to-point model, which is able to trace the set of possible paths between the Tx and Rx, while the TDL channel model is a statistical channel model able to represent a multipath fading environment by modeling the impulse response of the channel as a sum of delayed and scaled versions of the transmitted signal. E. Computation of T arg et Channel P arameters The Rician K -factor is often defined as the ratio of the power in the dominant component to the po wer in the re- maining scattered components. Ho wev er , in our scenario – where channel responses are obtained from a R T simulator – this definition can be ambiguous, as the distinction between the dominant path(s) and the scattered multipath components is not alw ays well-defined. T o a void this ambiguity , we adopt a statistical approach based on the Rician Probability Density Function (PDF). Specifically , we assume that the signal amplitude samples collected within each recei ver grid and normalized with respect to their av erage value, can be modeled as N independent observ ations of a random variable X following a Rician distribution with parameters ν and σ . If x 1 , x 2 , . . . , x N represent the observed samples, the Likelihood Function can be written as follows: L ( ν, σ ) = N Y i =1 x i σ 2 exp − x 2 i + ν 2 2 σ 2 I 0 x i ν σ 2 (5) Here, I 0 ( · ) denotes the modified Bessel function of the first kind and order zero. Then we estimate the parameters using the Maximum Likelihood (ML) method [21]: ( ˆ ν , ˆ σ ) = argmax ( ν,σ ) L ( ν, σ ) (6) Eventually , the Rician K -factor estimated value ( ˆ K ) is defined as follo ws: ˆ K = ˆ ν 2 2 ˆ σ 2 (7) This method provides a consistent and unambiguous charac- terization of the fading environment, based on the parame- ters of the underlying statistical model rather than heuristic power separation. A time efficient alternative to our ML-based estimator is the moment-method proposed by Greenstein et al. [22], which computes the Rician K -factor from the first and second moments of the received env elope. Comparing the two methods, the results hav e shown good agreement. The delay spread is used to characterize the temporal dispersion of the radio channel. In this work, the DS is computed only for the receiv er located at the central position at each receiv er grid for the sake of simplicity . The DS is defined as the square root of the second central moment of the po wer delay profile and is giv en by: DS = s P i P i ( τ i − ¯ τ ) 2 P i P i , (8) where P i and τ i denote the power and delay of the i -th multipath component, respectively , and ¯ τ is the mean excess delay , defined as ¯ τ = P i P i τ i P i P i . (9) T ABLE V: Electromagnetic parameters of terrain used in R T simulations for the 3 scenarios and the 2 frequency bands under study Parameters S/C bands Ka/Q/V bands Dense urban Urban Suburban Dense urban Urban Sub urban Relativ e dielectric permittivity ε r 5 5 5 5.5 5.5 5.5 Conductivity (S/m) 0.01 0.01 0.01 0.4 0.4 0.4 Diffuse scattering parameter S 0.5 0.4 0.25 0.75 0.6 0.375 Fig. 5: Line of sight probability in different scenarios I I I . R E S U LT S A N D D I S C U S S I O N This section includes and discusses some results extracted from R T simulations. First, LoS occurrence and the role played by different electromagnetic interactions (reflection, diffraction, and scattering) are inv estigated for different satel- lite elev ations and propagation scenarios. Then, the addressed propagation parameters (Ricean K -factor and delay spread) are analyzed at dif ferent frequencies and for the considered use-cases. Finally , their sensitivity to the urban layout is discussed. A. Line of Sight Pr obability LoS probability is easily computed from R T simulations, for the dif ferent urban type and deployment of UEs at roof or at street lev el (Fig. 5). Regardless of the specific case, LoS occurrence increases with satellite elev ation, which is obvious. Moving the ground station from street level to roof height also greatly improv es the LoS probability . Moreover , the greater the building density , the lo wer the LoS probability . For instance, in dense urban en vironment and user equipment at street level, LoS probability approaches 100% just when the satellite is close to zenith, whereas full LoS conditions already occur at 40 ◦ in the suburban case. It is worth noting that our R T simulations are in some disagreement with the LoS probability values suggested in [4], especially at lo w satellite ele vation in the dense- and sub-urban case. Although no details are provided in [4], a LoS probability equal to about 25% in dense urban context when the satellite at 10 ◦ elev ation appears actually too large. In this regard, on- field ev aluations reported in [23] (black dots in Fig. 5) seem in better agreement with R T results. B. Analysis of Pr opagation Mechanisms Fig. 6 presents stacked bar charts illustrating the av erage percentage contribution to the total received po wer of dif ferent 10 ◦ 50 ◦ 80 ◦ 0 10 20 30 40 50 60 70 80 90 100 Satellite Elev ation Angle Received Po wer Percentage (%) L R RD D S RS (a) Dense Urban – 3.5 GHz 10 ◦ 50 ◦ 80 ◦ 0 10 20 30 40 50 60 70 80 90 100 Satellite Elev ation Angle Received Po wer Percentage (%) L R RD D S RS (b) Dense Urban – 40 GHz 10 ◦ 50 ◦ 80 ◦ 0 10 20 30 40 50 60 70 80 90 100 Satellite Elev ation Angle Received Po wer Percentage (%) L R RD D S RS (c) Suburban – 3.5 GHz 10 ◦ 50 ◦ 80 ◦ 0 10 20 30 40 50 60 70 80 90 100 Satellite Elev ation Angle Received Po wer Percentage (%) L R RD D S RS (d) Suburban – 40 GHz Fig. 6: Stacked power contribution by propagation mechanisms at satellite elev ation angles 10°, 50°, and 80° for Dense Urban and Suburban scenarios at 3.5 GHz and 40 GHz. L – LoS, R – Reflections, RD – Reflections combined with Diffractions, D – Diffractions, S – Diffuse Scattering, RS – Reflections combined with Diffuse Scattering. propagation mechanisms. The analysis includes two reference scenarios, dense urban and sub urban, ev aluated at two frequen- cies (3.5 GHz and 40 GHz) and three satellite elev ation angles (10°, 50°, and 80°). Circular polarization is assumed for the satellite, while vertical polarization is used for the receivers, located at ground level. 1) Dense Urban Scenario: In the dense urban scenario at 3.5 GHz (Fig. 6a), the receiv ed signal at low satellite ele vation angles (e.g., 10°) is characterized by an almost complete absence of the LoS component (Fig. 5). In such conditions, the dominant contributions come from diffuse scattering and scattering combined with reflections. As explained in [24], pure reflections, while possible, require multiple bounces to reach the receiver due to the geometry and height of buildings, leading to high path loss, as for diffractions the receiv ers may be often located in a deep shadow region. As the elev ation angle increases to 50° and 80°, the LoS probability increases as well, becoming dominant and contributing to approximately 80% of the total received po wer . Reflections contribute to around 10%, diffractions about 3%, and the remaining 7% comes from scattering-related mechanisms. At 40 GHz (Fig. 6b), the main difference in the dense urban Fig. 7: Rician K -factor vs. satellite elev ation, urban en vironment scenario is an increased contrib ution from diffuse scattering for all ele vation angles at the expenses of the other mechanisms, especially diffraction, as shorter wavelengths generate less diffraction and more surface-roughness scattering. 2) Suburban Scenario: In the suburban scenario, the prop- agation en vironment is characterized by a very dif ferent profile. At 3.5 GHz (Fig. 6c) and 10° elev ation, the LoS component already contributes nearly 50% of the recei ved power . The remaining power is mainly attributed to reflections and diffractions. The dif fuse scattering component is less pronounced compared to the dense urban scenario. As the elev ation angle increases, the LoS component quickly becomes dominant, reaching 90% of the receiv ed power at 50°, while the contribution from other mechanisms becomes minor . At 80° elev ation, the reflection component gains a few percentage points relative to the LoS, due to the increase in intensity of ground reflections. At 40 GHz (Fig. 6d), similar trends are observed, although scattering plays more prominent role due to the already discussed surface roughness effects. At 10°, LoS contributes about 45%, and this rises above 80% at higher elev ation an- gles. Reflections and diffractions provide only minor contribu- tions, sho wing that although frequency affects the mechanism balance, the scenario itself remains the most influential factor . As the UEs are raised at (average) rooftop le vel, R T simulations sho w that the percentage of po wer carried by the direct path gets dominant in every scenario and basically at any elev ation angle, as the LoS probability is alw ays greater than 60% (Fig. 5). The general prev alence of the LoS component is further stressed by the use of highly directiv e radiation patterns (T able II). No figures hav e been included to in vestig ate the high-rise EU case, since there is basically no competition between the interaction mechanisms to be highlighted. C. Analysis of Pr opagation P arameter s Rician K -factor and delay spread are reported in Figs. 7, 8 against the satellite ele vation in urban environment, in the considered frequency bands, and for the different use cases. Similar trends hav e been obtained for the dense- and the sub- urban scenarios. Both Rician K -factor and delay spread are in general clearly affected by the occurrence of the LoS condition. This makes physical sense, as greater LoS probability entails the presence Fig. 8: Delay Spread vs. satellite elev ation, urban en vironment of a po werful, minimum-delay recei ved signal contribution with higher likelihood. At the same time, it does not auto- matically trigger a corresponding, equiv alent increase in the power carried by scattered multipath components arriving with long(er) delay . In fact, multipath structure and richness are greatly af fected by the density of items and obstructions, which is not expected to change a lot within the same en vironment. These considerations provide a general explanation for the reason why a greater LoS probability contributes – at least on the average – to increase the Rician K -factor and to reduce the delay spread. In the framework of the considered R T simulations, two main factors hav e a clear impact on the LoS condition (and therefore on the values of K -factor and DS): • The ele vation angle , as of course the satellite achieves easier visibility of the ground stations when it flies at higher elev ation. Close to zenith (80 ◦ -90 ◦ ) the Rician K - factor can be 10 to 30 dB greater than its value at the lowest elev ation (Fig. 7), whereas the delay spread can decrease by 1 to 2 order of magnitude (Fig. 8); • The height of the earth station : if moved from street- to roof-lev el, the Rician K -factor increases by more than 40dB (Fig. 7), whereas the delay spread reduces of 2/3 order of magnitude (Fig. 8). Although the significant difference in K -factor and DS values between the hand- held/vehicular case (antenna at ground level) and the fixed case (antenna at rooftop lev el) is also due to the different radiation pattern (T able II), the dif ference in antenna height is expected to represent a crucial aspect; T o some extent, the role played by the antenna radiation pattern alone stands out in the comparison between the hand- held and the vehicular case, where the antenna is always at ground level. A greater directivity makes a difference (up to about 10-15 dB for K -factor and up to one order of magnitude for DS) at larger elev ation angle (40 ◦ -90 ◦ ) , where the v ertical boresight direction of the patch antenna more easily corresponds to the LoS, dominant path, therefore boosting its intensity at the expense of the other scattered paths with longer propagation delay and direction of arriv al outside the main radiation lobe. W ith reference to the frequency sensitivity , not surprisingly S and C bands basically yield the same values (Figs. 8,7), i.e. they share the same propagation conditions. The same Fig. 9: Rician K -factor vs. satellite elev ation, sensiti vity to dif ferent en viron- ment Fig. 10: Delay Spread vs. satellite elevation, sensitivity to different environ- ment remark holds for the Q and the V bands, though to a lower extent. In comparison with the Ka band, the Rician K -factor at Q/V frequencies is about 5 dB greater, whereas quite light difference results for the delay spread. D. Influence of differ ent urban en vir onments The impact of the urban conte xt type on the considered propagation parameters is analyzed in Figs. 9, 10. Generally speaking, the curves related to the dif ferent urban scenarios (dense urban, urban and suburban) for the same frequency and use case are often somehow interleaved, meaning that the mechanisms that generate multipath richness and dispersion, and therefore af fect K -factor and DS v alues, appear to be quite complex. This is not a relev ant issue when the UEs are located at building levels (lines marked with stars in Figs. 9, 10), as the Rician K -factor values are then so large (several tens of dB) and the corresponding DS values are so small ( < 10 − 10 sec. on average) that time dispersion and fast fading look like really minor effects. Wireless propagation occurs as in free space conditions to a great extent. By contrast, when the UEs height is moved to street le vel, the free space approximation no longer holds and some interpretation of results might be of interest. In this respect, the existence of dominant, minimum- delay rays – such as the direct ray and single-bounce rays reflected by vertical building walls, which tend to suppress multipath richness, appears to be a discriminating factor at low satellite elev ation angles. In this case, increasing the elev ation from 10° to 30–40° raises the LoS probability and therefore decreases multipath richness, with a corresponding increase in the Rician K -factor and decrease in the DS. Moreover , suburban and urban environments appear to exhibit lower multipath richness than dense urban en vironments, where tall buildings often obstruct dominant rays – as expected. The situation is different at high elev ation angles. In this case, the LoS probability is very high across all urban lay- outs, and the degree of multipath richness, although low , is mainly determined by ground-lev el scattering due to clutter and vehicles. In the extreme case when elev ation is close to the zenith, vertical walls are not ”seen” from the satellite, and therefore they don’t generate any multipath. Under these conditions, suburban environments often show a lower Rician K -factor and higher delay spread than dense urban layouts, likely because the lower buildings density allows scattering from more distant terrain spots to be visible, thereby increas- ing richness and dispersion. This may result in a crossover between the suburban curves (green lines) and the other curves in Figs. 9 and 10, due to a milder slope factor in the suburban case. Parameter variation with ele vation, ho wev er , is not very pronounced at high elev ation angles. A negligible sensiti vity of both Rician K -factor and DS to the propagation scenario can be also noted for the handheld case (lines marked with empty circles in Figs. 9 and 10), where an isotropic radiation pattern is considered at the UE. A possible explanation is again related to the LoS proba- bility , that of course increases, irrespecti ve of the elev ation, moving from dense urban to urban and suburban layouts due to the lo wer building density . Generally speaking, a greater LoS occurrence across different en vironments is expected to produce a twofold effect. On the one hand, a more frequent existence of a dominant, weakly obstructed (if not obstructed at all) propagation path; on the other hand, a stronger multipath richness, as a sparser building layout opens the way to a larger number of multipath contributions with still significant intensity in spite of the long(er) propagation delays. The former effect of course contributes to increase the Rician K - factor and reduce the delay spread, whereas the latter works in the opposite direction. According to the R T simulations, a sort of balance between these two effects takes place, resulting in very close K -factor and DS v alues across the different urban layouts. It is worth pointing out that this result is somehow in contrast with the trend reported in [4], which highlights a difference of about one order of magnitude in delay spread between the dense urban and the suburban case up to 60 deg. elev ation. Providing a clear explanation for such dif ference is hardly possible, as delay spread values in [4] are reported as tabular data without any detail about their computation procedure. As far as the Rician K -factor is concerned, a fair comparison is not possible, as its assessment is limited in [4] to LoS conditions only , although LoS occurrence does not necessarily represent the standard case when the UE is located at street lev el. Anyway , some counter-intuiti ve trends for the Rician K -factor values reported in [4] appear evident, as already highlighted in [8]. The use of a receiving antenna with greater directivity and vertical boresight (vehicular case in Figs. 9 and 10) reduces the lateral scattering contributions reaching the UEs through the gaps in the building layer , while preserving the intensity of dominant contrib utions arriving from higher ele vation angles. Therefore, Rician K -factor v alues in the dense urban scenario remain smaller than those in the suburban environment, with the urban case in the middle (lines marked with triangles in Figs. 9 and 10). A corresponding rev ersed trend applies to DS values. I V . C O N C L U S I O N S This work in vestig ates satellite-to-urban propagation through deterministic ray-tracing simulations, aiming to determine dominant propagation mechanisms and characterize Rician K -factor and RMS delay spread under dif ferent urban layouts, user equipment configurations, and operating frequencies. The analysis highlights the strong dependence of these channel parameters on LoS conditions, which are primarily gov erned by satellite ele vation and receiv er placement. Results show that increasing the satellite elev ation signifi- cantly improves LoS probability , leading to larger Rician K - factor and reduced delay spread, as e xpected. The position of the user equipment also plays a major role: moving the receiv er from street le vel to rooftop height substantially in- creases the Rician K -factor and decreases the delay spread by sev eral orders of magnitude due to the higher likelihood of unobstructed propagation. Antenna characteristics further influence the channel statis- tics. Directiv e antennas with vertical boresight enhance the dominant path contribution while suppressing lateral multipath components, resulting in higher Rician K -factor and smaller delay spread compared to isotropic reception. Frequency de- pendence appears more limited, with similar propagation be- havior within the S/C and Q/V bands, although slightly larger Rician K -factor values are observed at higher frequencies due to enhanced scattering effects. Finally , the urban layout affects multipath richness and channel dispersion in a complex way , sometimes in contrast with common expectation and 3GPP standard models. Dense urban environm ents generally produce greater obstruction and richer multipath conditions at street le vel, whereas suburban layouts provide higher LoS probability but still allow scatter- ing from more distant surfaces. As a result, the sensiti vity of the Rician K -factor and delay spread to the specific urban morphology appears complex and case dependent. These findings contribute to the refinement of chan- nel models for satellite components of future integrated terrestrial–non-terrestrial networks. R E F E R E N C E S [1] M. Rihan, D. W ¨ ubben, A. Bhattacharya, M. Petrova, X. Y uan, A. Schmeink, A. Fellan, S. T ayade, M. Zarour, D. Lindenschmitt, H. Schotten, and A. Dekorsy , “Unified 3D networks: Architecture, challenges, recent results, and future opportunities, ” IEEE Open Journal of V ehicular T echnology , vol. 6, pp. 170–201, 2025. [2] S. B. Ati, H. Dahrouj, and M.-S. Alouini, “ An overvie w of performance analysis and optimization in coexisting satellites and future terrestrial networks, ” IEEE Open Journal of the Communications Society , vol. 6, pp. 3834–3852, 2025. [3] C. Zhang, Q. Li, C. Xu, L.-L. Y ang, and L. Hanzo, “Space-air-ground integrated networks: Their channel model and performance analysis, ” IEEE Open Journal of V ehicular T echnology , vol. 6, pp. 1501–1523, 2025. [4] 3GPP , “Study on new radio (NR) to support non-terrestrial networks, ” 3GPP , TR 38.811, 2020, release 15. [5] ——, “Study on channel model for frequencies from 0.5 to 100 GHz, ” 3rd Generation Partnership Project, TR 38.901, Mar. 2022, release 17. [6] ITU-R, “Propagation data required for the design of systems in the land-mobile satellite service, ” International T elecommunication Union, Recommendation P .681-11, 2019. [7] Y . Y u, C. Ling, A. Liu, J. Rodr ´ ıguez-Pi ˜ neiro, B. Guo, and X. Y in, “Measurement-based multiband clutter loss modeling for nonterrestrial networks, ” IEEE T ransactions on Antennas and Pr opagation , vol. 73, no. 2, pp. 1281–1285, 2025. [8] N. Cenni, V . Degli-Esposti, E. M. V itucci, F . Fuschini, and M. Barbiroli, “ A study on satellite-to-ground propagation in urban en vironment, ” in 2024 18th Eur opean Conference on Antennas and Propagation (EuCAP) , 2024, pp. 1–4. [9] E. M. V itucci, V . Degli-Esposti, F . Fuschini, J. S. Lu, M. Barbiroli, J. N. Wu, M. Zoli, J. J. Zhu, and H. L. Bertoni, “Ray tracing RF field prediction: An unforgi ving validation, ” International Journal of Antennas and Pr opagation , vol. 2015, no. 1, p. 184608, 2015. [Online]. A vailable: https://onlinelibrary .wiley .com/doi/abs/10.1155/2015/184608 [10] D. McNamara, C. Pistorius, and J. Malherbe, Introduction to the Uni- form Geometrical Theory of Diffr action , ser . Antennas and Propagation Library . Artech House, 1990. [11] R. Kouyoumjian and P . Pathak, “ A uniform geometrical theory of diffraction for an edge in a perfectly conducting surface, ” Pr oceedings of the IEEE , vol. 62, no. 11, pp. 1448–1461, 1974. [12] T . Hashimoto, X. Zhang, and C. D. Sarris, “Heuristic UTD diffraction coefficient for three-dimensional dielectric wedges, ” IEEE T ransactions on Antennas and Propa gation , vol. 69, no. 8, pp. 4816–4826, 2021. [13] V . Degli-Esposti, F . Fuschini, E. M. V itucci, and G. Falciasecca, “Mea- surement and modelling of scattering from buildings, ” IEEE Tr ansac- tions on Antennas and Propa gation , vol. 55, no. 1, pp. 143–153, 2007. [14] E. M. V itucci, N. Cenni, F . Fuschini, and V . Degli-Esposti, “ A reciprocal heuristic model for diffuse scattering from walls and surfaces, ” IEEE T ransactions on Antennas and Pr opagation , vol. 71, no. 7, pp. 6072– 6083, 2023. [15] E. M. V itucci, F . Mani, V . Degli-Esposti, and C. Oestges, “Polarimetric properties of diffuse scattering from building walls: Experimental pa- rameterization of a ray-tracing model, ” IEEE T ransactions on Antennas and Propa gation , vol. 60, no. 6, pp. 2961–2969, 2012. [16] F . Mani and C. Oestges, “Ray-tracing e valuation of dif fuse scattering in an outdoor scenario, ” in Pr oceedings of the 5th Eur opean Conference on Antennas and Propa gation (EUCAP) , 2011, pp. 3439–3443. [17] E. M. V itucci, V . Degli-Esposti, F . Mani, F . Fuschini, M. Barbiroli, M. Gan, C. Li, J. Zhao, and Z. Zhong, “T uning ray tracing for mm- wav e coverage prediction in outdoor urban scenarios, ” Radio Science , vol. 54, no. 11, pp. 1112–1128, 2019. [18] S. K odra, E. Bernardi, N. Cenni, J. Hu, M. Barbiroli, F . Fuschini, E. M. V itucci, J.-M. Molina Garcia-Pardo, M.-T . Mart ´ ınez-Ingl ´ es, S. Salous, and V . Degli-Esposti, “Multiband measurement-based characterization of building materials, ” IEEE Open Journal of Antennas and Pr opagation , vol. 6, no. 5, pp. 1490–1501, 2025. [19] M. Steinbauer, “The radio propagation channel: a non- directional, directional, and double-directional point-of-view , ” Dissertation, T echnische Universit ¨ at W ien, 2001. [Online]. A vailable: http://hdl.handle.net/20.500.12708/179603 [20] M. Steinbauer, A. Molisch, and E. Bonek, “The double-directional radio channel, ” IEEE Antennas and Pr opagation Magazine , vol. 43, no. 4, pp. 51–63, 2001. [21] H. L. V . Trees, Detection, Estimation, and Modulation Theory . John W iley & Sons, Ltd, 2001. [22] L. Greenstein, D. Michelson, and V . Erceg, “Moment-method estimation of the Ricean K-factor , ” IEEE Communications Letters , vol. 3, no. 6, pp. 175–176, 1999. [23] E. Lutz, D. Cygan, M. Dippold, F . Dolainsky , and W . Papke, “The land mobile satellite communication channel-recording, statistics, and channel model, ” IEEE Tr ansactions on V ehicular T echnology , vol. 40, no. 2, pp. 375–386, 1991. [24] V . Degli-Esposti, F . Fuschini, and D. Guiducci, “ A study on roof-to- street propagation, ” in Proceedings of the 8th International Confer ence on Electromagnetics in Advanced Applications (ICEAA 2003) , Turin, Italy , 2004, pp. 45–47.
Original Paper
Loading high-quality paper...
Comments & Academic Discussion
Loading comments...
Leave a Comment