Demographic Fairness in Multimodal LLMs: A Benchmark of Gender and Ethnicity Bias in Face Verification
Multimodal Large Language Models (MLLMs) have recently been explored as face verification systems that determine whether two face images are of the same person. Unlike dedicated face recognition systems, MLLMs approach this task through visual prompt…
Authors: Ünsal Öztürk, Hatef Otroshi Shahreza, Sébastien Marcel
Demographic F airness in Multimodal LLMs: A Benchmark of Gender and Ethnicity Bias in F ace V erification ¨ Unsal ¨ Ozt ¨ urk * Hatef Otroshi Shahreza * S ´ ebastien Marcel Idiap Research Institute, Switzerland { unsal.ozturk, hatef.otroshi, sebastien.marcel } @idiap.ch Abstract Multimodal Lar ge Languag e Models (MLLMs) have r e- cently been e xplor ed as face verification systems that deter - mine whether two face images ar e of the same person. Un- like dedicated face r ecognition systems, MLLMs appr oach this task through visual pr ompting and rely on gener al vi- sual and r easoning abilities. However , the demo graphic fairness of these models remains lar gely une xplor ed. In this paper , we pr esent a benchmarking study that evaluates nine open-sour ce MLLMs fr om six model families, rang- ing from 2B to 8B parameters, on the IJB-C and RFW face verification pr otocols acr oss four ethnicity gr oups and two gender gr oups. W e measur e verification accuracy with the Equal Err or Rate and T rue Matc h Rate at multiple oper- ating points per demogr aphic group, and we quantify de- mographic disparity with four FMR-based fairness met- rics. Our r esults show that F aceLLM-8B, the only face- specialised model in our study , substantially outperforms general-purpose MLLMs on both benchmarks. The bias patterns we observe differ fr om those commonly r eported for traditional face r ecognition, with differ ent groups being most affected depending on the benchmark and the model. W e also note that the most accurate models are not neces- sarily the fair est and that models with poor over all accur acy can appear fair simply because they pr oduce uniformly high err or rates acr oss all demogr aphic gr oups. Pr oject page: https://www .idiap.ch/paper/mllm-fairness 1. Introduction Face recognition is one of the most widely deployed bio- metric technologies. Modern face recognition systems typ- ically work by mapping a face image to a fixed-length numerical representation, called an embedding, using a deep neural network trained on large collections of labelled face images [ 30 ]. T o determine whether two images de- pict the same person, the system computes the distance * Equal contribution Demographic 1 . . . Demographic N MLLM “How similar are these people?” s 1 =0 . 72 s 2 =0 . 68 . . . s 1 =0 . 45 s 2 =0 . 51 Similarity Scores FMR 1 =0 . 12 FNMR 1 =0 . 13 . . . FMR N =0 . 21 FNMR N =0 . 09 Error Metrics Measure fairness Figure 1. Pipeline overvie w . Face pairs from each demographic group are independently prompted through an MLLM for pair- wise verification. The per-pair similarity scores are aggregated into group-le vel error metrics (FMR/FNMR), which are then com- pared across demographics to assess fairness. (or similarity) between their embeddings and compares it to a decision threshold. This embedding-based approach has reached high lev els of accuracy on standard bench- marks [ 7 , 17 , 26 , 38 ], and it is now used in applications ranging from border control and law enforcement to mobile device authentication. In recent years, Large Language Models (LLMs) have transformed natural language processing by demonstrating strong performance on a broad range of tasks through a single, general-purpose architecture [ 37 , 44 ]. This success has led to the dev elopment of Multimodal Large Language Models (MLLMs), which extend LLMs with the ability to process visual inputs alongside text [ 2 , 14 , 23 , 36 , 43 ]. Models such as Qwen-VL [ 28 ], LLaV A [ 22 , 23 ], and Idefics [ 21 ] can accept one or more images together with a text prompt, and produce a free-form textual response. This capability opens up the possibility of using MLLMs for face verification: giv en two face images, the model can be prompted to judge whether they belong to the same person, and its response can be conv erted into a similar- ity score. Unlike embedding-based systems, which require 1 specialised training on face identity labels, MLLMs ap- proach the task through visual question answering by re- lying on the general visual and reasoning abilities acquired during pretraining. Whether this approach can produce ac- curate and reliable verification scores is an open question. A separate but equally important concern is the fairness of face recognition systems across different demographic groups [ 8 , 20 ]. Face recognition systems have been sho wn to perform une venly across demographic groups defined by attributes such as ethnicity and gender , and studies hav e re- peatedly found that certain groups tend to ha ve higher error rates than others. [ 12 ]. This raises serious concerns when face recognition is used in high-stakes applications, because errors can have direct consequences for individuals [ 10 ]. Fairness in this context means that the system should pro- duce similar error rates across demographic groups at an operating point; if one group has a substantially higher false match rate or false non-match rate than another , the system is said to be biased against that group. [ 9 ]. While demographic fairness has been studied exten- siv ely for embedding-based face recognition, no compa- rable analysis e xists for MLLM-based f ace verification. It is not obvious that the bias patterns observed in tradi- tional systems will carry o ver to MLLMs, since the two ap- proaches dif fer fundamentally in ho w they process face im- ages and arriv e at a similarity judgment. Understanding the fairness properties of MLLMs is important, because these models are increasingly being considered for tasks that were previously handled by specialised systems. In this paper , we present a systematic demographic fair - ness ev aluation of MLLMs for face verification. W e ev al- uate nine MLLMs on the IJB-C and RFW verification pro- tocols across four ethnicity groups and two gender groups. W e measure v erification accuracy with the Equal Error Rate (EER) and T rue Match Rate (TMR) at standard operat- ing points, and we quantify demographic disparity with four complementary FMR-based fairness metrics at multi- ple thresholds. Our results show that no current MLLM ap- proaches the accuracy of dedicated embedding-based sys- tems, and that the bias patterns in MLLMs dif fer from those observed in traditional face recognition. 2. Related W ork 2.1. Bias in F ace Recognition Face recognition systems that use a single global decision threshold can produce different error rates for different de- mographic groups. Buolamwini and Gebru [ 4 ] demon- strated this for commercial gender classifications systems and concluded that darker-skinned female faces had higher error rates. Similarly , How ard et al. [ 12 ] showed that score distributions of different demographic groups are different and therefore ha ve an impact on system performance across demographic groups. Further studies examined how facial attributes such as hairstyle [ 3 ] and demographic-dependent properties of face regions [ 1 ] contribute to performance gaps between different groups. Sarridis et al. [ 29 ] similarly analysed intersectional biases over race, age, and gender and concluded that certain subgroups such as older African females experience larger error rates. K otwal and Mar- cel [ 20 ] provide a comprehensi ve surve y of demographic fairness in face recognition. 2.2. F airness Metrics f or Biometric Systems Follo wing the evidence of demographic bias in biometric systems, Grother et al. [ 10 ] at NIST conducted a large- scale ev aluation of over 100 commercially av ailable face recognition systems as part of the Face Recognition V en- dor T est, and reported FMR and FNMR values for vari- ous demographic groups. This prompted work on metrics that reduce per -group error rates into a scalar summarizing the fairness of a biometric system as a combination of val- ues measuring the “spread” of in-group FMR and FNMR values obtained by setting a global threshold. De Freitas Pereira and Marcel [ 6 ] proposed the Fairness Discrepancy Rate (FDR), which is based on the maximum dif ferential of FMR and FNMR across groups. A subsequent NIST re- port by Grother [ 9 ] confirmed that large demographic dif- ferentials persist across algorithms and introduced the In- equity Rate (IR), based on linear combinations of maxi- mum FMR and FNMR ratios, and the W orst-case Error- Rate Metric (WERM), which takes the exponent-weighted product of the maximum FMR and FNMR ratios to the ge- ometric mean across all groups. Ho ward et al. [ 13 ] pro- posed the Gini Aggregation Rate for Biometric Equitability (GARBE), which uses the Gini index of per-group FMR and FNMR values and showed that it better satisfies a set of interpretability criteria than previous measures. K ot- wal and Marcel [ 19 ] further proposed fairness measures based on pre-decision score distributions rather than post- decision error rates. These ef forts were eventually consol- idated into ISO/IEC 19795-10:2024 [ 15 ], which standard- ises the reporting of biometric performance v ariation across demographic groups. The standard specifies that FMR and FNMR dif ferentials and ratios should be reported per group, but it does not prescribe a single scalar fairness metric. In this paper , we mainly use metrics equi valent to FMR-based metrics described in the ISO standard. 2.3. F ace recognition with MLLMs Sev eral papers ha ve explored the applications of MLLMs for f ace-related tasks, including multimodal reasoning, face recognition, attrib ute analysis, deepfake detection, and anti- spoofing. A recent survey [ 33 ] provides a comprehensiv e ov erview of the applications of MLLMs and foundation models in biometrics and face recognition. 2 Early studies explored the use of pretrained MLLMs, such as ChatGPT [ 14 ], for face verification and predict- ing soft biometrics, such as age, gender , and ethnicity [ 11 ]. Jia et al. [ 16 ] also used ChatGPT for zero-shot face deep- fake detection. Shi et al. [ 35 ] explored chain-of-thoughts prompting for ChatGPT [ 14 ] and Gemini [ 36 ] for face anti- spoofing and deepfake detection. K omaty et al. [ 18 ] explored in-context learning with ChatGPT [ 14 ] for face anti-spoofing. W ang et al. proposed FaceBench [ 41 ] as a visual question-answering benchmark for facial attributes. Narayan et al. proposed FaceXBench [ 27 ] to bench- mark MLLMs on different face-related tasks, including expression recognition, attribute prediction, anti-spoofing, etc. FaceRecBench [ 31 ] was also proposed for bench- marking MLLMs for face verification. FaceXBench [ 27 ] used multiple-choice questions and F aceRecBench [ 31 ] used Y es/No questions for ev aluating the performance of MLLMs for face verification. In [ 34 ], MLLMs were bench- marked for heterogeneous face recognition. In this pa- per , we focus on fairness of MLLMs for face verification and benchmark bias MLLMs with multiple f airness metrics, which has not been studied for MLLMs. 3. Methodology This section describes our benchmarking methodology . Figure 1 summarises our pipeline. 3.1. F ace V erification with MLLMs T o ev aluate MLLMs for face verification, we provide MLLM with two face images and a text prompt. In the text prompt, we ask the model to compare the gi ven images and return a similarity score: Prompt ”On a scale from 0 to 100, ho w likely (as a single num- ber) are these two face images of the same person? Only output a single number (no other text). ” W e use the output of MLLM as similarity score (normalised to [0 , 1] .) to e valuate the model for f ace verification. 3.2. Datasets and Protocol W e ev aluate on two face v erification benchmarks. IJB-C. The IARP A Janus Benchmark-C (IJB-C) [ 25 ] contains 31,334 still images and 117,542 video frames of 3,531 subjects. As per the protocol, the images are organ- ised into biometric templates , where each template can con- tain anywhere from one image to sev eral hundred frames. The 1:1 verification protocol defines 19,557 template pairs, roughly half of which are genuine (same identity) and half impostor (different identities). W e labeled IJB-C with gen- der ( Male , Female ) and ethnicity labels ( African , East Asian , South Asian , Caucasian ). Due to the size of the protocol, we subsample 10,000 template comparisons, which results in 7,200 to 9,990 scored pairs per model de- pending on the model’ s ability to produce a v alid score for each pair . As a result of this sampling, we get 2,750 cross- ethnicity comparisons; and 670, 800, 700, 5,000, within- ethnicity comparisons for Africans, East Asians, South Asians, and Caucasians respecti vely . As for gender , we get 3,000 and 4,500 in-group female and male comparisons, and 2,500 cross-group impostor comparisons. This subset of IJB-C, took on av erage about 20 days of GPU compute on an NVIDIA H100 per MLLM to be ev aluated, and scal- ing to the entire benchmark remains challenging. RFW . Racial Faces in-the-Wild (RFW) [ 39 ] is a bal- anced face v erification benchmark designed specifically for studying ethnic bias. It contains four ethnicity groups (African, Asian, Caucasian, Indian), and each group con- tributes exactly 3,000 genuine and 3,000 impostor pairs, for a total of 24,000 pairs. RFW does not carry gender anno- tations, and we therefore do not consider this dataset for measuring gender-f airness. 3.3. Evaluated Models W e ev aluate nine open-source and publicly available MLLMs from six model families (T ab . 1 ). Eight of these, including Idefics3-8B-Llama3 [ 21 ], LLaV A-NeXT -Mistral- 7B [ 23 ], Ovis1.5-Llama3-8B [ 24 ], Qwen2-VL-2B [ 40 ], Qwen2-VL-7B [ 40 ], Qwen2.5-VL-3B [ 28 ], Qwen2.5-VL- 7B [ 28 ], and V alley2 [ 42 ], are general-purpose vision- language models that were not specifically designed for face-related tasks. The ninth, FaceLLM-8B [ 32 ], is fine- tuned for face analysis and is therefore the only model in our study with specialised face kno wledge. All ev aluations are performed in a zero-shot setting, meaning that the mod- els recei ve no fine-tuning and no in-context examples for the verification task. 3.4. T emplate-Lev el Scoring Since templates can contain multiple images or video frames, we need a w ay to reduce a template pair to a single similarity score. Gi ven a probe template T p = { x p 1 , . . . , x p m } and a gallery template T g = { x g 1 , . . . , x g n } , we form all m × n image pairs. For each pair ( x p i , x g j ) , we prompt the MLLM in a zero-shot fashion with both f ace im- ages and a standardised textual query that asks whether the two images depict the same person, for which the model returns a similarity score s ij ∈ [0 , 1] . The final template- lev el score is then computed as the arithmetic mean o ver all pairwise scores: s ( T p , T g ) = 1 mn m X i =1 n X j =1 s ij . (1) 3 T able 1. Evaluated MLLMs. P arams denotes approximate total parameter count. Model Family Params Idefics3-8B-Llama3 [ 21 ] Idefics3 8B Ovis1.5-Llama3-8B [ 24 ] Ovis 8B Qwen2-VL-2B [ 40 ] Qwen2-VL 2B Qwen2-VL-7B [ 40 ] Qwen2-VL 7B Qwen2.5-VL-3B [ 28 ] Qwen2.5-VL 3B Qwen2.5-VL-7B [ 28 ] Qwen2.5-VL 7B V alley2 [ 42 ] V alley 7B LLaV A-NeXT -Mistral-7B [ 23 ] LLaV A-NeXT 7B FaceLLM-8B [ 32 ] FaceLLM 8B One adv antage of this approach is that templates with man y images benefit from noise reduction: individual pairwise scores may be noisy , b ut av eraging ov er many pairs pro- duces a more stable estimate. This comes at the cost of quadratically many inferences. 3.5. V erification Metrics T o ev aluate verification performance, we sweep a decision threshold τ across the range [0 , 1] in steps of 0 . 005 (201 operating points) and compute the following error rates at each threshold: • False Match Rate (FMR): the proportion of impostor pairs whose similarity score meets or exceeds the thresh- old τ . A high FMR means the system incorrectly accepts many impostor pairs as genuine. • False Non-Match Rate (FNMR): the proportion of gen- uine pairs whose similarity score falls below τ . A high FNMR means the system incorrectly rejects many gen- uine pairs. • Equal Error Rate (EER): the operating point at which the FMR and FNMR are equal. The EER is a single num- ber that summarises the ov erall accuracy of the system. All metrics are computed both globally (over all pairs) and separately for each demographic group. W e also report the T rue Match Rate (TMR = 1 − FNMR) at fix ed FMR thresh- olds of 10%, 1%, and 0.1%, which correspond to increas- ingly strict security requirements. The full operating char- acteristic is plotted in Fig. 2 . 3.6. F airness Metrics W e compute four fairness metrics based on per -group FMRs and ev aluate these metrics at the global EER threshold as well as at three fixed FMR operating points (10%, 1%, 0.1%). Let G = { g 1 , . . . , g K } denote the K demographic groups, and let FMR g be the false match rate for group g at a giv en decision threshold. For brevity , we write e g ≡ FMR g and use the subscript F throughout (e.g. ∆ F , R F , M F , G F ). Maximum FMR differential. The dif ferential measures the range between the highest and lowest group error rates: ∆ = max g e g − min g e g (2) Since this is an absolute measure, its magnitude depends on the o verall le vel of FMR: a system with high FMR can hav e a large ∆ even if the relati ve dif ferences between groups are small. Perfect fairness achie ved at ∆ = 0 . Maximum FMR ratio. The FMR ratio compares the worst-case group to the best-case group: R = max g e g min g e g (3) A v alue of one indicates that all groups ha ve the same FMR. The ratio is a relati ve measure, which makes it useful for comparing disparity across dif ferent operating points. How- ev er , it becomes unstable when the minimum per-group FMR approaches zero, because even a small absolute dif- ference in the numerator leads to a very lar ge ratio. Maximum ratio to geometric mean. The maximum ratio to geometric mean normalises the worst-case group FMR by the geometric mean of all group FMR values: M = max g e g Q g e g 1 /K , (4) A value of M = 1 means that the worst-case group has the same FMR as the group av erage. Compared to the ratio R , which di vides by the minimum group FMR, the multi-group metric is more stable because the geometric mean pools in- formation from all groups and is less sensitive to a single group with a very lo w FMR. Gini coefficient. The Gini coefficient indicates the in- equality across all groups: G = P K i =1 P K j =1 | e i − e j | 2 K P K i =1 e i . (5) A v alue of G = 0 means that all groups ha ve the same FMR, As G approaches 1 , the FMR concentrates in a single group while the rest of the groups hav e near-zero FMR. “Decidability” index. In addition to threshold- dependent metrics, we compute the decidability index ( d ′ ) for each demographic group as defined in [ 5 ]: d ′ = µ genuine − µ impostor q 1 2 σ 2 genuine + σ 2 impostor , (6) where µ . and σ . are the mean and standard de viation of gen- uine and impostor score distributions. This measure quan- tifies how well the genuine and impostor score distribu- tions are separated, independently of any particular thresh- old choice and can be interpreted as the number of pooled standard deviations that separate the tw o distributions. 4 Figure 2. Detection Error Trade-of f (DET) curv es for all e v aluated models on the IJB-C 1:1 verification protocol. Lower -left is better . 4. Experimental Results T able 1 lists the nine MLLMs ev aluated in this study . LLaV A-NeXT -Mistral-7B produces only two unique sim- ilarity scores and fails to provide meaningful verification performance. W e exclude it from all subsequent analyses. 4.1. V erification P erf ormance T able 2 reports global and per-group EER together with TMR at three fixed FMR thresholds for both benchmarks. The DET curves in Fig. 2 visualise the full operating char- acteristic for ev ery model. IJB-C. FaceLLM-8B achieves the lo west global EER (5.13%), roughly half that of the next-best model, Qwen2- VL-7B (8.54%). Qwen2.5-VL-7B follows at 10.43%, and Idefics3-8B at 11.21%. The remaining four general-purpose models hav e considerably higher error rates, with V alle y2 at 16.17%, Qwen2.5-VL-3B at 22.89%, and Ovis1.5 and Qwen2-VL-2B near chance level (30.89% and 33.69%, re- spectiv ely). The TMR values in T ab . 2 are consistent with this ranking. At FMR = 10%, FaceLLM-8B correctly matches 98.0% of genuine pairs, whereas Ovis1.5 reaches only 34.6%. At the stricter FMR = 0.1% threshold, only four models produce scores with sufficient granularity to reach this operating point. RFW . All models perform worse on RFW than on IJB- C. FaceLLM-8B remains the best-performing model, but its EER rises from 5.13% to 29.46%; Qwen2-VL-7B simi- larly increases from 8.54% to 34.39%. Se veral models that are competiti ve on IJB-C, such as Idefics3-8B (35.08%) and Qwen2.5-VL-7B (34.98%), produce similar EER val- ues around 35% on RFW . Ovis1.5 and Qwen2-VL-2B ap- proach 50% EER, which corresponds to random guessing. This difference in model performance across these two datasets can be e xplained by the number of images per template: on average, IJB-C templates contain 20.3 media items (median 9), whereas RFW templates contain 3.6 (me- dian 3). Since MLLM-based verification relies on a veraging pairwise scores across all media items in a template compar - ison, the larger templates of IJB-C allow for better perfor- mance compared to RFW as the MLLMs hav e information to process per identity . Figure 3 shows the genuine and impostor score distribu- tions for each demographic group. FaceLLM-8B sho ws the clearest separation between the two distributions on both benchmarks, which is consistent with its lo w EER. Ovis1.5 and Qwen2-VL-2B, on the other hand, ha ve heavily ov er- lapping genuine and impostor distributions, which explains their near -chance accuracy . The d ′ (Eq. ( 6 )), reported in the last column of T ab . 3 , provides a numerical measure of this separation. FaceLLM-8B has the highest mean d ′ on IJB-C (4.50) and on RFW (1.08), while the weakest models fall below d ′ = 1 . 4.2. Bias and F airness Evaluation T able 3 reports four FMR-based fairness metrics ev aluated at the EER threshold and at three fixed operating points (FMR = 10%, 1%, 0.1%), together with the mean decid- ability index d ′ . The metrics are the FMR differential ∆ F (maximum minus minimum per-group FMR), the FMR ra- tio R F (maximum di vided by minimum per-group FMR), the multi-group metric M F (maximum per-group FMR di- vided by the geometric mean), and the Gini coefficient G F (ov erall inequality of per-group FMR values). Figure 4 plots in-group FMR against the global FMR across the full range of decision thresholds for both gender and ethnicity on the IJB-C dataset. Ethnicity fairness in IJB-C. As sho wn in T ab . 2 , the Caucasian group has the highest per-group EER in fi ve of the eight non-degenerate models. This is a notable find- ing, since in many embedding-based face recognition sys- tems, darker -skinned groups tend to be the most disadv an- taged [ 4 , 10 , 12 ]. At the EER threshold, FaceLLM-8B has the lo west differential ( ∆ F = 0 . 020 ), yet its Gini coef fi- cient ( G F = 0 . 092 ) is higher than those of Qwen2-VL-2B ( G F = 0 . 059 ) and Idefics3-8B ( G F = 0 . 064 ). This dif- ference can be explained by the fact that ∆ F is an absolute measure that scales with o verall FMR, whereas G F captures relativ e inequality among the groups. At stricter operating points, R F and M F increase sharply and often become un- defined, because per -group FMR values approach zero at different rates. When this happens, small absolute differ- ences ( ∆ F ) turn into very large ratios, and the ratio-based metrics lose their interpretability for many model-threshold combinations. The Gini coefficient also increases at stricter thresholds, indicating that relative FMR inequality grows ev en when absolute gaps remain small. Ethnicity fairness in RFW . The RFW block of T ab . 3 shows larger ethnicity disparities than IJB-C at the EER 5 T able 2. V erification performance on IJB-C and RFW . EER (%, ↓ ): Equal Error Rate; per-group EER is at each group’ s own operating point. σ : standard deviation of per-ethnicity EER. Gender EER: female and male EER with absolute gap ∆ ( ↓ is more uniform); not av ailable for RFW (marked —). TMR (%, ↑ ): True Match Rate at fixed FMR. RFW uses “ Asian” and “Indian” for the East-Asian and South-Asian groups, respectiv ely . Best per column within each block is bolded . ✗ indicates an unreachable operating point. Ethnicity EER (%, ↓ ) Gender EER (%, ↓ ) TMR (%, ↑ ) Model Global African Cauc. E. As. S. As. σ Female Male ∆ @10% @1% @0.1% IJB-C Idefics3-8B-Llama3 11 . 21 8 . 79 11 . 90 10 . 72 8 . 85 1 . 31 12 . 46 9 . 98 2 . 48 84 . 39 ✗ ✗ Ovis1.5-Llama3-8B 30 . 89 32 . 71 30 . 35 31 . 30 32 . 67 0 . 99 30 . 18 31 . 65 1 . 46 34 . 59 ✗ ✗ Qwen2-VL-2B 33 . 69 29 . 75 35 . 78 34 . 00 29 . 36 2 . 75 35 . 63 31 . 86 3 . 77 40 . 26 8 . 46 1 . 56 Qwen2-VL-7B 8 . 54 6 . 34 9 . 14 7 . 49 5 . 97 1 . 23 8 . 28 8 . 17 0.10 93 . 42 60 . 38 25 . 87 Qwen2.5-VL-3B 22 . 89 23 . 59 22 . 18 22 . 86 23 . 46 0.56 23 . 17 22 . 05 1 . 12 59 . 07 21 . 90 ✗ Qwen2.5-VL-7B 10 . 43 9 . 24 11 . 07 10 . 38 8 . 13 1 . 12 10 . 99 9 . 38 1 . 61 88 . 82 53 . 45 26.39 V alley2 16 . 17 16 . 03 15 . 26 19 . 91 13 . 99 2 . 21 16 . 83 15 . 00 1 . 83 75 . 11 43 . 33 20 . 46 FaceLLM-8B 5.13 4.65 5.53 4.31 3.98 0 . 58 5.37 4.82 0 . 55 98.03 71.75 24 . 04 RFW Idefics3-8B-Llama3 35 . 08 41 . 95 34 . 47 29 . 02 34 . 63 4 . 60 — — — ✗ ✗ ✗ Ovis1.5-Llama3-8B 49 . 18 52 . 83 49 . 17 45 . 13 49 . 58 2 . 73 — — — ✗ ✗ ✗ Qwen2-VL-2B 50 . 35 53 . 32 50 . 15 50 . 02 48 . 43 1.77 — — — 4 . 21 ✗ ✗ Qwen2-VL-7B 34 . 39 39 . 63 34 . 57 24 . 40 34 . 13 5 . 51 — — — 12 . 98 0 . 52 0 . 52 Qwen2.5-VL-3B 43 . 14 48 . 97 41 . 73 38 . 12 42 . 63 3 . 91 — — — ✗ ✗ ✗ Qwen2.5-VL-7B 34 . 98 40 . 85 34 . 45 26 . 30 32 . 58 5 . 19 — — — 11 . 30 ✗ ✗ V alley2 39 . 67 45 . 85 40 . 35 30 . 33 39 . 92 5 . 58 — — — 26 . 99 0 . 08 0 . 08 FaceLLM-8B 29.46 35.25 27.87 21.23 29.13 4 . 98 — — — 38.69 1.42 1.42 T able 3. FMR-based fairness metrics at the global EER threshold and three standard operating points, plus decidability index d ′ . ∆ F : max per-group FMR difference ( ↓ ); R F : ratio of max to min per-group FMR ( ↓ ); M F : ratio of max per-group FMR to the geometric mean ( ↓ ); G F : Gini coefficient of per-group FMR ( ↓ ); d ′ : mean decidability index across groups ( ↑ ). ✗ indicates an unreachable operating point; ∞ marks ratios where at least one group has near-zero FMR. Best per block is bolded . @EER @FMR = 10% @FMR = 1% @FMR = 0.1% Model ∆ F R F M F G F ∆ F R F M F G F ∆ F R F M F G F ∆ F R F M F G F d ′ IJB-C – Ethnicity Idefics3-8B-Llama3 0 . 033 1 . 40 1.12 0 . 064 0.026 1.38 1.15 0 . 070 ✗ ✗ ✗ ✗ ✗ ✗ ✗ ✗ 2 . 86 Ovis1.5-Llama3-8B 0 . 143 1 . 70 1 . 19 0 . 090 0 . 072 2 . 32 1 . 35 0 . 148 ✗ ✗ ✗ ✗ ✗ ✗ ✗ ✗ 0 . 90 Qwen2-VL-2B 0 . 103 1.35 1 . 14 0.059 0 . 035 1 . 41 1 . 22 0.068 0 . 007 3 . 08 1 . 51 0 . 181 0 . 002 ∞ ∞ 0.387 0 . 90 Qwen2-VL-7B 0 . 057 2 . 38 1 . 45 0 . 167 0 . 065 2 . 35 1 . 46 0 . 170 0 . 006 2 . 30 1 . 68 0 . 182 0.001 ∞ ∞ 0 . 750 3 . 59 Qwen2.5-VL-3B 0 . 080 1 . 47 1 . 15 0 . 069 0 . 051 1 . 81 1 . 27 0 . 113 0.005 1.68 1.39 0.108 ✗ ✗ ✗ ✗ 1 . 41 Qwen2.5-VL-7B 0 . 051 1 . 81 1 . 30 0 . 133 0 . 048 1 . 75 1 . 33 0 . 134 0 . 012 3 . 69 1 . 80 0 . 239 0 . 002 ∞ ∞ 0 . 600 2 . 46 V alley2 0 . 102 2 . 07 1 . 28 0 . 130 0 . 085 2 . 92 1 . 46 0 . 172 0 . 012 ∞ ∞ 0 . 466 0 . 001 ∞ ∞ 0 . 750 2 . 03 FaceLLM-8B 0.020 1 . 53 1 . 33 0 . 092 0 . 042 1 . 61 1 . 31 0 . 099 0 . 012 4 . 91 2 . 16 0 . 311 0 . 002 ∞ ∞ 0 . 387 4.50 IJB-C – Gender Idefics3-8B-Llama3 0 . 041 1 . 44 1 . 20 0 . 089 0 . 035 1 . 50 1 . 22 0 . 100 ✗ ✗ ✗ ✗ ✗ ✗ ✗ ✗ 2 . 70 Ovis1.5-Llama3-8B 0 . 062 1 . 22 1 . 11 0 . 051 0.006 1.06 1.03 0.015 ✗ ✗ ✗ ✗ ✗ ✗ ✗ ✗ 0 . 93 Qwen2-VL-2B 0 . 088 1 . 29 1 . 14 0 . 063 0 . 026 1 . 32 1 . 15 0 . 069 0.000 1.05 1.02 0.012 0.000 1.43 1.20 0.089 0 . 82 Qwen2-VL-7B 0 . 018 1 . 25 1 . 12 0 . 055 0 . 025 1 . 31 1 . 14 0 . 067 0 . 005 1 . 86 1 . 36 0 . 151 0 . 001 ∞ ∞ 0 . 500 3 . 39 Qwen2.5-VL-3B 0 . 054 1 . 28 1 . 13 0 . 061 0 . 027 1 . 33 1 . 15 0 . 071 0 . 004 1 . 49 1 . 22 0 . 098 ✗ ✗ ✗ ✗ 1 . 45 Qwen2.5-VL-7B 0 . 046 1 . 60 1 . 27 0 . 116 0 . 047 1 . 65 1 . 29 0 . 123 0 . 002 1 . 29 1 . 14 0 . 063 0 . 001 ∞ ∞ 0 . 500 2 . 38 V alley2 0 . 034 1 . 24 1 . 12 0 . 055 0 . 024 1 . 28 1 . 13 0 . 061 0 . 005 1 . 84 1 . 36 0 . 147 0 . 001 2 . 12 1 . 46 0 . 179 2 . 06 FaceLLM-8B 0.001 1.02 1.01 0.004 0 . 007 1 . 07 1 . 03 0 . 017 0 . 004 1 . 54 1 . 24 0 . 106 0 . 001 2 . 10 1 . 45 0 . 177 4.31 RFW – Ethnicity Idefics3-8B-Llama3 0 . 399 2 . 46 1 . 58 0 . 181 ✗ ✗ ✗ ✗ ✗ ✗ ✗ ✗ ✗ ✗ ✗ ✗ 0 . 74 Ovis1.5-Llama3-8B 0 . 073 1.10 1.04 0.020 ✗ ✗ ✗ ✗ ✗ ✗ ✗ ✗ ✗ ✗ ✗ ✗ 0 . 05 Qwen2-VL-2B 0 . 240 1 . 52 1 . 16 0 . 080 0 . 112 12 . 55 5 . 75 0 . 533 ✗ ✗ ✗ ✗ ✗ ✗ ✗ ✗ 0 . 02 Qwen2-VL-7B 0 . 168 2 . 98 1 . 51 0 . 176 0.023 2 . 41 1 . 79 0 . 191 0 . 001 ∞ ∞ 0 . 625 0 . 001 ∞ ∞ 0 . 625 0 . 93 Qwen2.5-VL-3B 0 . 270 1 . 84 1 . 47 0 . 131 ✗ ✗ ✗ ✗ ✗ ✗ ✗ ✗ ✗ ✗ ✗ ✗ 0 . 40 Qwen2.5-VL-7B 0 . 406 2 . 97 1 . 68 0 . 205 0 . 038 9 . 21 2 . 84 0 . 395 ✗ ✗ ✗ ✗ ✗ ✗ ✗ ✗ 0 . 80 V alley2 0.057 2 . 02 1 . 32 0 . 121 0 . 057 2.02 1.32 0.121 0.000 ∞ ∞ 0.500 0.000 ∞ ∞ 0.500 0 . 63 FaceLLM-8B 0 . 478 4 . 76 2 . 31 0 . 293 0 . 240 9 . 48 4 . 16 0 . 469 0 . 002 ∞ ∞ 0 . 750 0 . 002 ∞ ∞ 0 . 750 1.08 6 Figure 3. Genuine (dark) and impostor (light) score distributions on IJB-C, stratified by ethnicity (top four panels) and gender (bottom two panels). threshold. FaceLLM-8B, which has the best overall accu- racy on RFW , also has the highest differential ( ∆ F = 0 . 478 ) and one of the highest Gini values ( G F = 0 . 293 ) among the eight models. By contrast, Ovis1.5 has the lowest Gini ( G F = 0 . 020 ) but also performs near chance le vel (49.18% EER). This time, the African group is the most disadvan- taged across all eight models. E.g., FaceLLM-8B has a 21.23% EER on the Asian group but 35.25% on the African group, a gap of 14 percentage points. The per-ethnicity EER standard deviations ( σ ) in T ab. 2 confirm this pattern, with values between 1.77 and 5.58 on RFW compared to 0.56– 2.75 on IJB-C. Gender fairness in IJB-C. The gender block of T ab . 3 shows smaller disparities than the corresponding ethnicity block across all four metrics and all operating points. At the EER threshold, FaceLLM-8B has very low gender dis- parity ( ∆ F = 0 . 001 , G F = 0 . 004 ). Even at FMR = 10%, the maximum gender Gini across all models is 0.123 (Qwen2.5- VL-7B), compared to a maximum ethnicity Gini of 0.172 (V alle y2). The per-gender EER differences ( ∆ in T ab . 2 ) support this observation. Qwen2-VL-7B has the smallest absolute gender gap ( ∆ = 0 . 10 pp), while Qwen2-VL-2B has the lar gest ( ∆ = 3 . 77 pp). In the global-vs-ingroup plots of Fig. 4 , the dashed gender curves lie closer to the di- agonal than the solid ethnicity curv es in nearly e very model panel, which indicates that gender has a smaller effect on false match rates than ethnicity . 4.3. Accuracy-F airness T rade-off The results in T abs. 2 and 3 show that the most accurate models are not necessarily the fairest, and that the fairest models are often the least accurate. At FMR = 10% on IJB- C ethnicity , the two lo west Gini values belong to Qwen2- VL-2B ( G F = 0 . 068 ) and Idefics3-8B ( G F = 0 . 070 ), which rank sev enth and fourth in ov erall accuracy , respecti vely . FaceLLM-8B, the most accurate model, ranks only third in terms of fairness ( G F = 0 . 099 ). On RFW , this pattern is more prevalent. Ovis1.5 has the lo west ethnicity Gini 7 Figure 4. Global FMR vs. in-group FMR at ev ery operating threshold for each model on IJB-C. Solid lines show ethnicity groups; dashed lines show gender groups. Points below the diagonal indicate pri vilege for that group as those ones achie ve less-than-a verage error rates. at the EER threshold ( G F = 0 . 020 ) while also having the second-worst EER (49.18%). The reason is that models with poor ability to separate genuine and impostor scores produce similar false match rates across all demographic groups, and therefore appear “f air” despite being practically sub-optimal. On the other hand, FaceLLM-8B combines the best accurac y with the lo west gender disparity on IJB-C ( G F = 0 . 004 at EER, d ′ = 4 . 31 ), which sho ws that ac- curacy and fairness are not necessarily opposed when the score distributions are well separated. 5. Conclusion This paper presented the first demographic fairness ev alu- ation of MLLMs for face verification. W e ev aluated nine MLLMs from six model families, ranging from 2B to 8B parameters, on the RFW and (a sub-sample of) IJB-C 1:1 verification protocols with respect to four ethnicity groups and two gender groups. W e reported four FMR-based fair- ness metrics alongside standard accuracy measures at mul- tiple operating points. The results indicate that current MLLMs still fall short of the accuracy and speed needed for practical face verification. FaceLLM-8B, the only face- specialised model in our study , outperforms all general- purpose models on both benchmarks. The fairness analy- sis produced several findings that differ from common pat- terns in embedding-based face recognition: On IJB-C, the Caucasian group is the most disadvantaged in fiv e of eight models, which is the opposite of what is typically reported for traditional face recognition systems. Gender disparities are consistently smaller than ethnicity disparities across all models and operating points, with FaceLLM-8B showing low gender inequality ( G F = 0 . 004 at the EER threshold). Limitations and future work. Se veral directions are worth exploring. The ev aluation could be extended to ad- ditional benchmarks and intersectional attributes (ethnic- ity × gender) to provide a more complete view of MLLM bias. The sensitivity of verification scores to prompt phras- ing and in-context examples should be studied, since the current results depend on a single prompt template. Eval- uating larger MLLMs ( > 13B parameters) and instruction- tuned variants would help determine whether increasing model scale can close the accuracy gap with embedding- based systems. 6. Acknowledgments This work has recei ved funding from the European Union’ s Horizon Europe research and innov ation programme under grant agreement No. 101189650 (CER T AIN: Certification for Ethical and Regulatory T ranspar ency in Artificial Intel- 8 ligence ). This work was also funded by the European Union project CarMen (Grant Agreement No. 101168325). References [1] V ´ ıtor Albiero, Ke vin W . Bo wyer, and Michael C. King. Face regions impact recognition accuracy differently across de- mographics. In 2022 IEEE International Joint Confer ence on Biometrics (IJCB) , pages 1–9, 2022. 2 [2] Anthropic. Claude 3.5 sonnet model card addendum, 2024. 1 [3] Aman Bhatta, V ´ ıtor Albiero, Ke vin W . Bo wyer , and Michael C. King. The gender gap in face recognition ac- curacy is a hairy problem. In 2023 IEEE/CVF W inter Confer ence on Applications of Computer V ision W orkshops (W ACVW) , pages 1–10, 2023. 2 [4] Joy Buolamwini and Timnit Gebru. Gender shades: Inter- sectional accuracy disparities in commercial gender classifi- cation. In Pr oceedings of the 1st Conference on F airness, Ac- countability and T ranspar ency , pages 77–91. PMLR, 2018. 2 , 5 [5] J. Daugman. Ho w iris recognition works. IEEE T ransactions on Circuits and Systems for V ideo T echnology , 14(1):21–30, 2004. 4 [6] Tiago de Freitas Pereira and S ´ ebastien Marcel. Fairness in biometrics: A figure of merit to assess biometric verification systems. IEEE T ransactions on Biometrics, Behavior , and Identity Science , 4(1):19–29, 2022. 2 [7] Jiankang Deng, Jia Guo, Niannan Xue, and Stefanos Zafeiriou. Arcface: Additiv e angular margin loss for deep face recognition. In Proceedings of the IEEE/CVF Confer- ence on Computer V ision and P attern Recognition (CVPR) , 2019. 1 [8] Pawel Drozdowski, Christian Rathgeb, Antitza Dantchev a, Naser Damer , and Christoph Busch. Demographic bias in biometrics: A survey on an emerging challenge. IEEE T rans- actions on T echnology and Society , 1(2):89–103, 2020. 2 [9] Patrick Grother . Face recognition vendor test (frvt) part 8::summarizing demographic differentials, 2022. 2 [10] Patrick Grother, Mei Ng an, and Kayee Hanaoka. Face recog- nition vendor test part 3::demographic ef fects, 2019. 2 , 5 [11] Ahmad Hassanpour, Y asamin Ko wsari, Hatef Otroshi Shahreza, Bian Y ang, and S ´ ebastien Marcel. Chatgpt and biometrics: an assessment of face recognition, gender de- tection, and age estimation capabilities. In 2024 IEEE In- ternational Confer ence on Image Processing (ICIP) , pages 3224–3229. IEEE, 2024. 3 [12] John J. Howard, Y evgeniy B. Sirotin, and Arun R. V emury . The effect of broad and specific demographic homogeneity on the imposter distributions and false match rates in face recognition algorithm performance. In 2019 IEEE 10th In- ternational Conference on Biometrics Theory , Applications and Systems (BT AS) , pages 1–8, 2019. 2 , 5 [13] John J. Ho ward, Eli J. Laird, Rebecca E. Rubin, Y evgeniy B. Sirotin, Jerry L. Tipton, and Arun R. V emury . Ev aluating proposed fairness models for face recognition algorithms. In P attern Recognition, Computer V ision, and Image Pr ocess- ing. ICPR 2022 International W orkshops and Challenges , pages 431–447, Cham, 2023. Springer Nature Switzerland. 2 [14] Aaron Hurst, Adam Lerer , Adam P Goucher, Adam Perel- man, Aditya Ramesh, Aidan Clark, AJ Ostrow , Akila W eli- hinda, Alan Hayes, Alec Radford, et al. Gpt-4o system card. arXiv pr eprint arXiv:2410.21276 , 2024. 1 , 3 [15] ISO/IEC 19795-10:2024. Information technology — Bio- metric performance testing and reporting — Part 10: Quan- tifying biometric system performance v ariation across demo- graphic groups. Standard ISO/IEC 19795-10:2024, Inter- national Organization for Standardization, Geneva, Switzer- land, 2024. 2 [16] Shan Jia, Reilin L yu, Kangran Zhao, Y ize Chen, Zhiyuan Y an, Y an Ju, Chuanbo Hu, Xin Li, Baoyuan W u, and Siwei L yu. Can chatgpt detect deepfakes? a study of using mul- timodal large language models for media forensics. In Pr o- ceedings of the IEEE/CVF Conference on Computer V ision and P attern Recognition , pages 4324–4333, 2024. 3 [17] Minchul Kim, Anil K. Jain, and Xiaoming Liu. Adaface: Quality adapti ve margin for face recognition. In 2022 IEEE/CVF Conference on Computer V ision and P attern Recognition (CVPR) , pages 18729–18738, 2022. 1 [18] Alain Komaty , Hatef Otroshi Shahreza, Anjith George, and Sebastien Marcel. Exploring chatgpt for face presentation at- tack detection in zero and fe w-shot in-conte xt learning. arXiv pr eprint arXiv:2501.08799 , 2025. 3 [19] Ketan Kotw al and S ´ ebastien Marcel. Fairness index mea- sures to evaluate bias in biometric recognition. In P attern Recognition, Computer V ision, and Image Pr ocessing. ICPR 2022 International W orkshops and Challenges: Montr eal, QC, Canada, A ugust 21–25, 2022, Pr oceedings, P art I , page 479–493, Berlin, Heidelberg, 2022. Springer -V erlag. 2 [20] Ketan K otwal and S ´ ebastien Marcel. Revie w of demographic fairness in face recognition. IEEE T ransactions on Biomet- rics, Behavior , and Identity Science , 8(1):20–45, 2026. 2 [21] Hugo Laurenc ¸ on, Andr ´ es Marafioti, V ictor Sanh, and L ´ eo T ronchon. Building and better understanding vision- language models: insights and future directions., 2024. 1 , 3 , 4 [22] Haotian Liu, Chunyuan Li, Y uheng Li, and Y ong Jae Lee. Improv ed baselines with visual instruction tuning, 2023. 1 [23] Haotian Liu, Chunyuan Li, Qingyang W u, and Y ong Jae Lee. V isual instruction tuning. In Advances in Neur al Information Pr ocessing Systems , pages 34892–34916. Curran Associates, Inc., 2023. 1 , 3 , 4 [24] Shiyin Lu, Y ang Li, Qing-Guo Chen, Zhao Xu, W eihua Luo, Kaifu Zhang, and Han-Jia Y e. Ovis: Structural em- bedding alignment for multimodal large language model. arXiv:2405.20797 , 2024. 3 , 4 [25] Brianna Maze, Jocelyn Adams, James A. Duncan, Nathan Kalka, T im Miller , Charles Otto, Anil K. Jain, W . T yler Niggel, Janet Anderson, Jordan Cheney , and Patrick Grother . Iarpa janus benchmark - c: Face dataset and protocol. In 2018 International Conference on Biometrics (ICB) , pages 158–165, 2018. 3 [26] Qiang Meng, Shichao Zhao, Zhida Huang, and Feng Zhou. Magface: A universal representation for f ace recognition and 9 quality assessment. In 2021 IEEE/CVF Conference on Com- puter V ision and P attern Reco gnition (CVPR) , pages 14220– 14229, 2021. 1 [27] Kartik Narayan, V ibashan VS, and V ishal M Patel. Face xbench: Evaluating multimodal llms on face under- standing. arXiv preprint , 2025. 3 [28] Qwen, :, An Y ang, Baosong Y ang, Beichen Zhang, Binyuan Hui, Bo Zheng, Bo wen Y u, Chengyuan Li, Dayiheng Liu, Fei Huang, Haoran W ei, et al. Qwen2.5 technical report, 2025. 1 , 3 , 4 [29] Ioannis Sarridis, Christos Koutlis, Symeon Papadopoulos, and Christos Diou. T owards fair face verification: An in- depth analysis of demographic biases. In Machine Learn- ing and Principles and Practice of Knowledge Discovery in Databases , pages 194–208, Cham, 2025. Springer Nature Switzerland. 2 [30] Florian Schroff, Dmitry Kalenichenko, and James Philbin. Facenet: A unified embedding for face recognition and clus- tering. In Pr oceedings of the IEEE Confer ence on Computer V ision and P attern Recognition (CVPR) , 2015. 1 [31] Hatef Otroshi Shahreza and S ´ ebastien Marcel. Benchmark- ing multimodal large language models for face recognition. arXiv pr eprint arXiv:2510.14866 , 2025. 3 [32] Hatef Otroshi Shahreza and S ´ ebastien Marcel. Facellm: A multimodal large language model for face understanding. arXiv pr eprint arXiv:2507.10300 , 2025. 3 , 4 [33] Hatef Otroshi Shahreza and S ´ ebastien Marcel. Foundation models and biometrics: A survey and outlook. IEEE T rans- actions on Information F or ensics and Security , 2025. 2 [34] Hatef Otroshi Shahreza, Anjith George, and S ´ ebastien Marcel. Evaluating multimodal large language mod- els for heterogeneous face recognition. arXiv preprint arXiv:2601.15406 , 2026. 3 [35] Y ichen Shi et al. Shield: An ev aluation benchmark for face spoofing and forgery detection with multimodal large lan- guage models. arXiv preprint , 2024. 3 [36] Gemini T eam, Rohan Anil, Sebastian Borgeaud, Jean- Baptiste Alayrac, Jiahui Y u, Radu Soricut, Johan Schalkwyk, Andrew M Dai, Anja Hauth, Katie Millican, et al. Gemini: a family of highly capable multimodal models. arXiv preprint arXiv:2312.11805 , 2023. 1 , 3 [37] Hugo T ouvron, Thibaut Lavril, Gautier Izacard, Xavier Martinet, Marie-Anne Lachaux, Timoth ´ ee Lacroix, Baptiste Rozi ` ere, Naman Goyal, Eric Hambro, Faisal Azhar , Aur ´ elien Rodriguez, Armand Joulin, Edouard Grave, and Guillaume Lample. Llama: Open and ef ficient foundation language models. CoRR , abs/2302.13971, 2023. 1 [38] Hao W ang, Yitong W ang, Zheng Zhou, Xing Ji, Dihong Gong, Jingchao Zhou, Zhifeng Li, and W ei Liu. Cos- face: Large margin cosine loss for deep face recognition. In 2018 IEEE Conference on Computer V ision and P attern Recognition, CVPR 2018, Salt Lak e City , UT , USA, June 18- 22, 2018 , pages 5265–5274. Computer V ision Foundation / IEEE Computer Society , 2018. 1 [39] Mei W ang, W eihong Deng, Jiani Hu, Xunqiang T ao, and Y aohai Huang. Racial faces in the wild: Reducing racial bias by information maximization adaptation network. In 2019 IEEE/CVF International Conference on Computer V i- sion (ICCV) , pages 692–702, 2019. 3 [40] Peng W ang, Shuai Bai, Sinan T an, Shijie W ang, Zhihao Fan, Jinze Bai, Keqin Chen, Xuejing Liu, Jialin W ang, W enbin Ge, Y ang Fan, Kai Dang, Mengfei Du, Xuancheng Ren, Rui Men, Dayiheng Liu, Chang Zhou, Jingren Zhou, and Jun- yang Lin. Qwen2-vl: Enhancing vision-language model’ s perception of the world at any resolution. arXiv pr eprint arXiv:2409.12191 , 2024. 3 , 4 [41] Xiaoqin W ang, Xusen Ma, Xianxu Hou, Meidan Ding, Y udong Li, Junliang Chen, W enting Chen, Xiaoyang Peng, and Linlin Shen. Facebench: A multi-view multi-lev el fa- cial attribute vqa dataset for benchmarking face perception mllms. arXiv preprint , 2025. 3 [42] Ziheng W u, Zhenghao Chen, Ruipu Luo, Can Zhang, Y uan Gao, Zhentao He, Xian W ang, Haoran Lin, and Minghui Qiu. V alley2: Exploring multimodal models with scalable vision- language design. arXiv pr eprint arXiv:2501.05901 , 2025. 3 , 4 [43] Shukang Y in, Chaoyou Fu, Sirui Zhao, K e Li, Xing Sun, T ong Xu, and Enhong Chen. A surve y on multimodal large language models. National Science Re view , 11(12): nwae403, 2024. 1 [44] Barret Zoph, Colin Raf fel, Dale Schuurmans, Dani Y o- gatama, Denny Zhou, Don Metzler , Ed H. Chi, Jason W ei, Jeff Dean, Liam B. Fedus, Maarten Paul Bosma, Oriol V inyals, Percy Liang, Sebastian Borgeaud, T atsunori B. Hashimoto, and Y i T ay . Emergent abilities of large language models. TMLR , 2022. 1 10
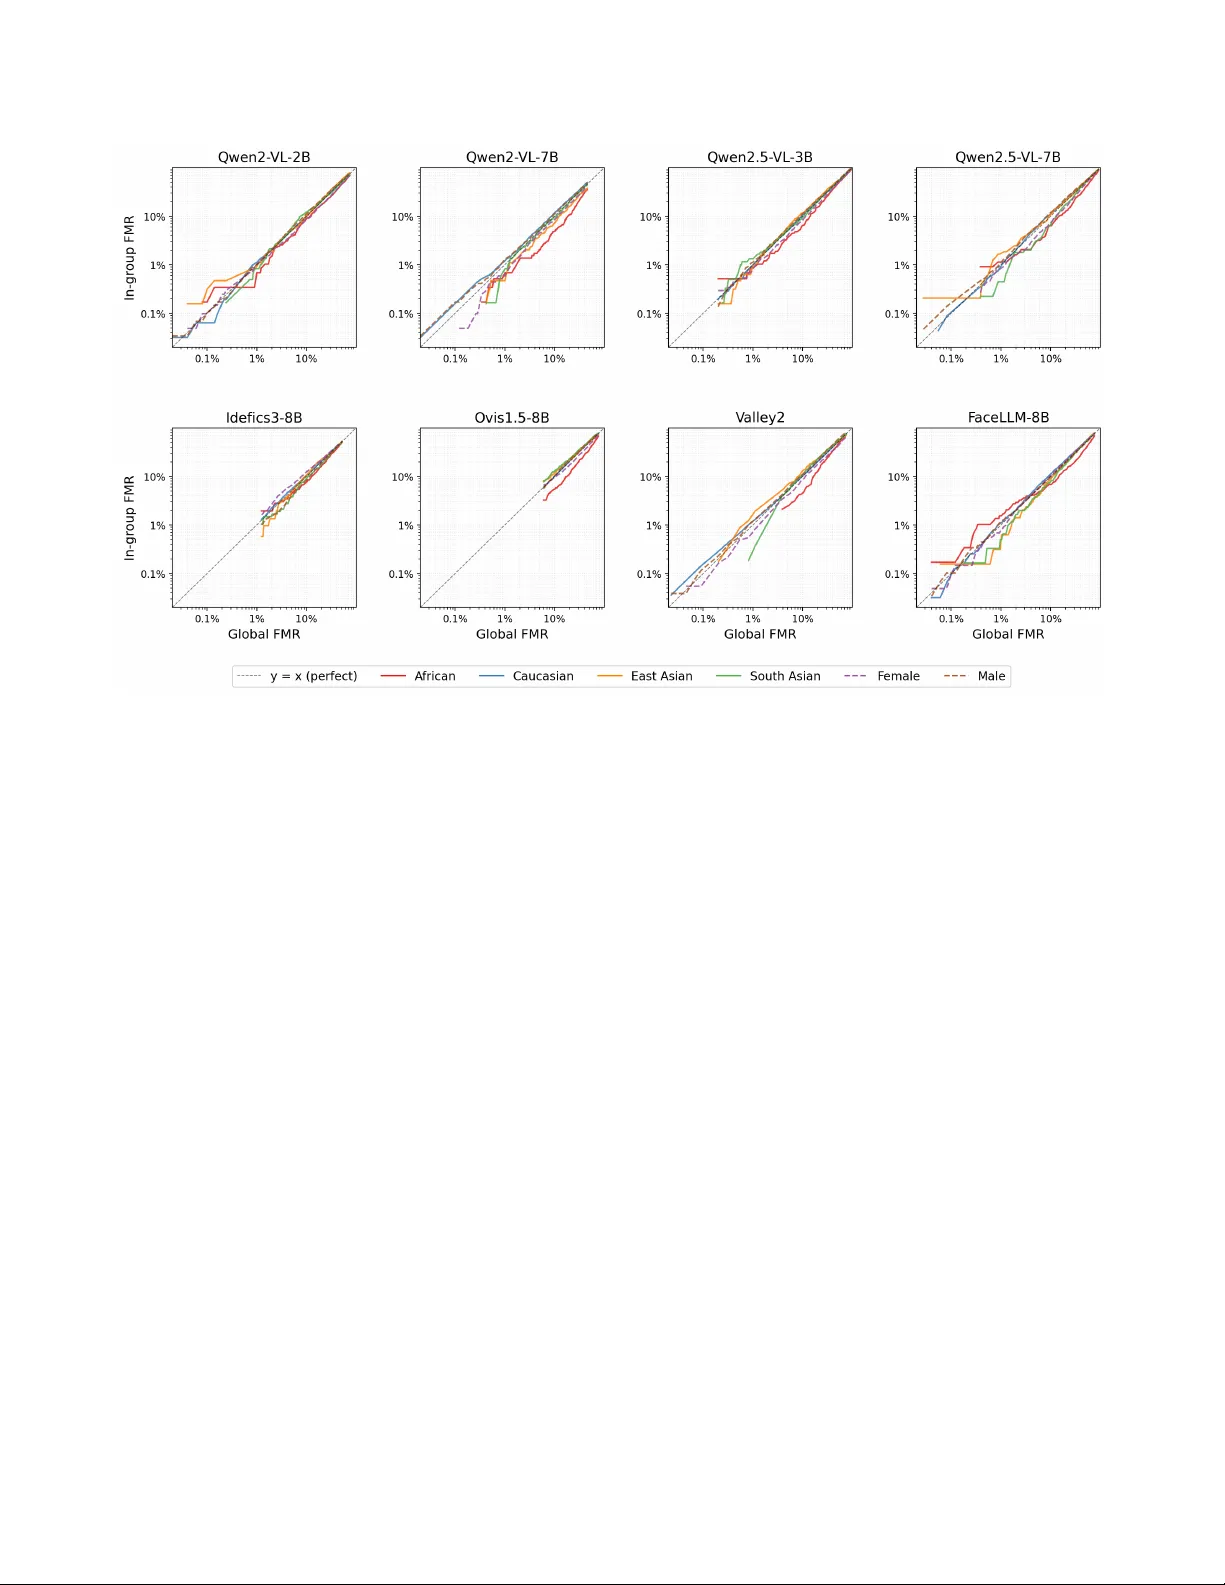
Original Paper
Loading high-quality paper...
Comments & Academic Discussion
Loading comments...
Leave a Comment