DeepFAN, a transformer-based deep learning model for human-artificial intelligence collaborative assessment of incidental pulmonary nodules in CT scans: a multi-reader, multi-case trial
The widespread adoption of CT has notably increased the number of detected lung nodules. However, current deep learning methods for classifying benign and malignant nodules often fail to comprehensively integrate global and local features, and most o…
Authors: Zhenchen Zhu, Ge Hu, Weixiong Tan
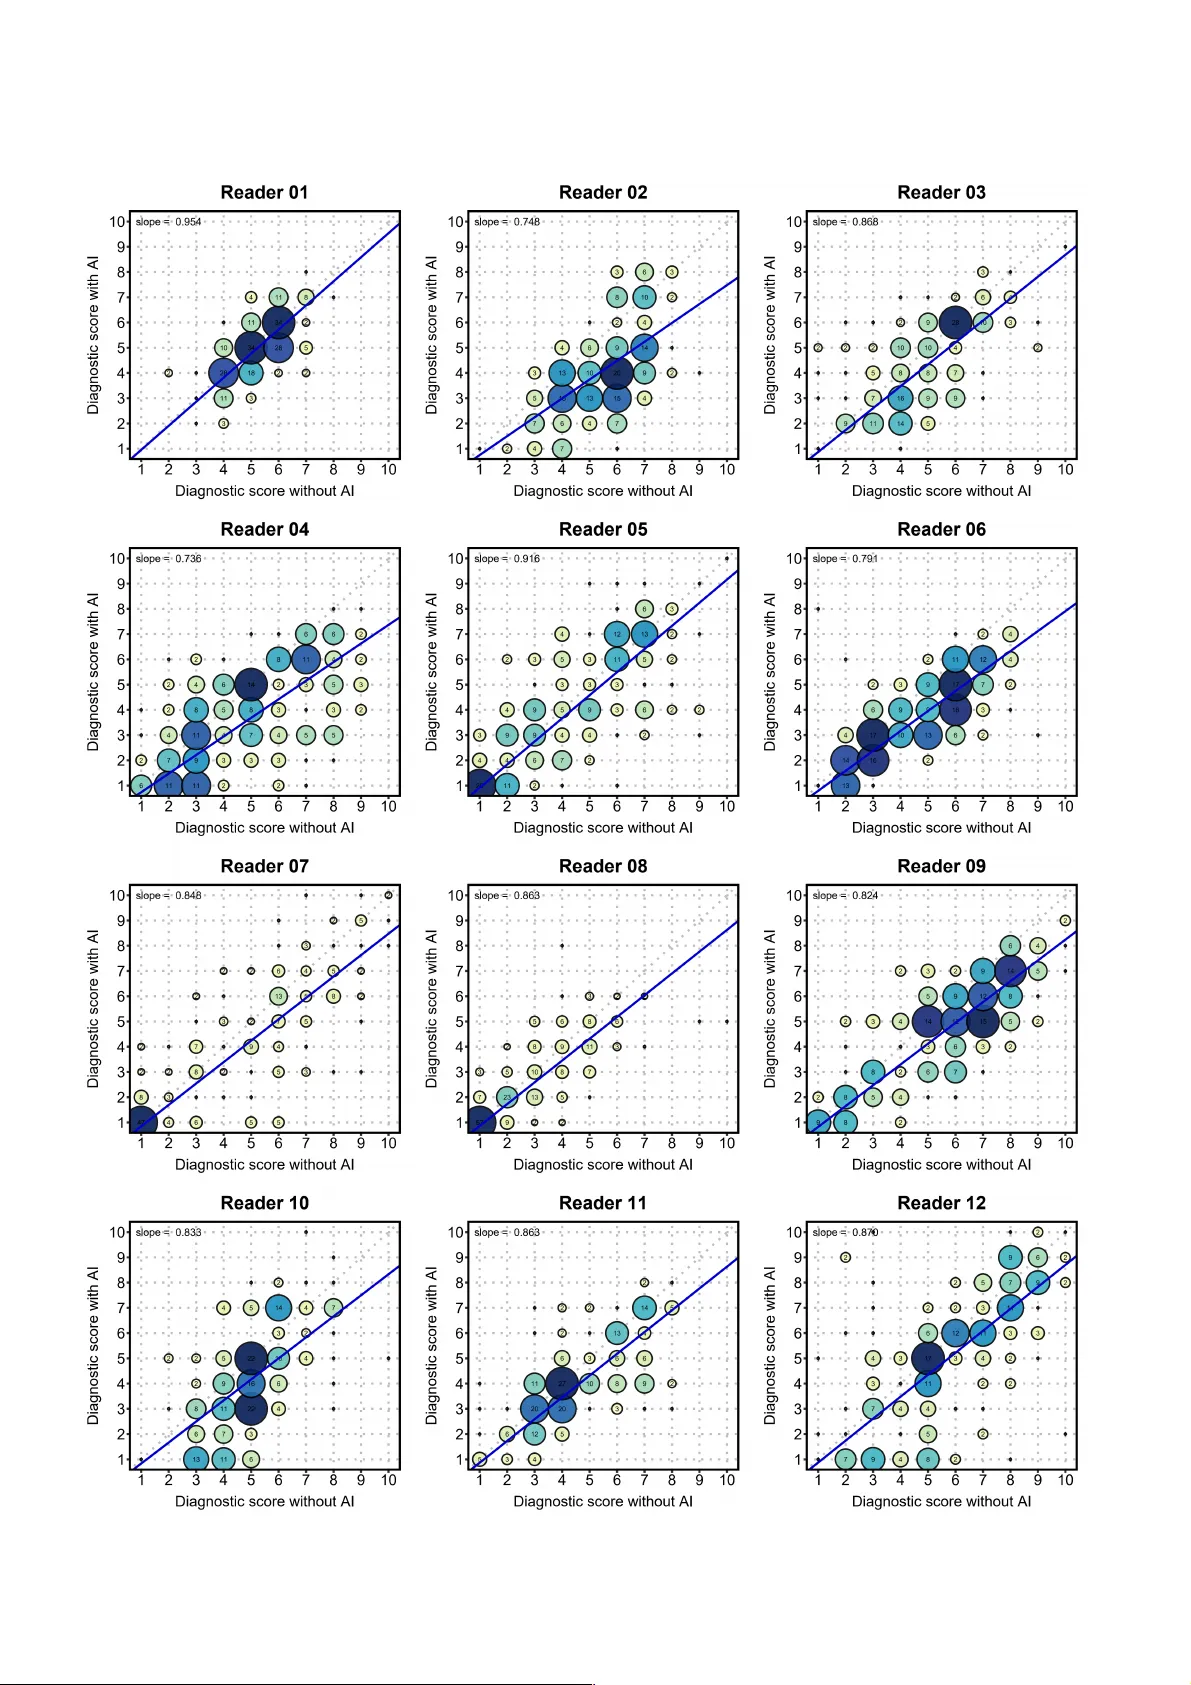
A rev i se d version of this m an uscript has been acc epted by Nat ure Can cer (DOI: 10.1038 /s43018- 026 - 01 147 -w ). 1 DeepF AN , a transformer-based deep learning model for human-artificial intelligence collaborative assessment of incidental pulmonary nodules in CT scans: a multi- reader , multi-case trial Zhenchen Zhu 1# , Ge Hu 2# , We ix io ng T an 3# , Kai Gao 3# , Chao Sun 4# , Zhen Zhou 3# , Kepei Xu 1 , Wei Han 5 , Meixia Shang 6 , Xiaoming Qiu 7,8 , Y iqing T an 9 , Jinhua Wang 1 , Zhoumeng Y ing 1,10 , Li Peng 1,1 1 , Wei Song 1 , Lan Song 1* , Zhengyu Jin 1* , Nan Hong 4* , Y izhou Y u 12* 1 Department of Radiology , State Key Lab oratory of Complex Severe and Rare Diseases, Peking Union Medi cal College Hospital , Chinese Academy of Medical Sc iences and Peking Union Medi cal College, Beijing, China. 2 Theranostics and T ransl ational Research Center , National Infra structures for T ran slational Medicine, Institute of Clinical Medicine, State Key La boratory of Compl ex Se vere and Rare Diseases, Peking Union Medical College Hospital, Chinese Academy of Medica l Sciences an d Peking Union Medical College, Beijing, China. 3 Ar tificial Intelli gence Lab, Deepwise Healthcar e, Beijing, China. 4 Department of Radiol ogy , Peking Universit y People’s Hospital, Beijing, China . 5 Department of Epide miology and Hea lth Statistics, Institute of Basic Medic ine Sciences, Chinese Academy of Medical Sci ences & Peking U nion Medical Co llege, Beijin g, China. 6 Department of Biost atistics, Peking Univers ity First Hospital, Be ijing, China. 7 Department of Radi ology , Huangshi Cent ral Hos pital, Affiliated Hospital of Hubei Polytechnic University , Hubei Province, China. 8 Key Laboratory of Cereb rovascular Disease lmaging and Artificial Intel ligence, Huangshi , Hubei Province, China 9 Department of Radi ology , W uhan Third Hospit al, T ongren Hospit al of Wuhan University , W uhan, Hubei Province, China. 10 4+4 Medical Doctor Program, Chinese Academy of Medical Sciences & Peking Union Medical College, Beijing, China. 11 Department of Medici ne Imaging, School of Cli nical Medicine, Southwest Medical University , Luzhou, China. 12 School of Computing and Data Science, The University of Hong Kong, Hong Kong SAR, China. # These authors contr ibuted equally: Zhenchen Zh u, Ge Hu, Weixiong T an, Kai Gao , Chao Sun and Zhen Zhou . *Corresponding authors: corresponde nce to Lan Song, Zhengyu Jin, Nan Hong and Y izhou Y u. Abstract The widespread adop tion of CT has notably increased t he number of detected l ung nodules. However , curr ent deep learning methods for classifying benign and m alignant nodules often fail to comprehensi vely integrate global and l ocal features , and most of them have not been validated through clinical trials. T o address this, we developed DeepF AN, a transformer - based model trained on over 10 K pathology - confirmed nodules and further conducted a multi - reader , multi - case clinical trial to evaluate its efficacy in a ssisting junior radiologists. DeepF AN achieved diagnostic area under the curve (AUC) of 0.939 (95% CI 0.930 - 0.948) on an internal test set and 0.954 (95% CI 0.934 - 0.973) on the clinical trial dataset involving 400 cases across three independent medical institut ions . Explainability analysis indicated higher co ntributions fro m global th an local f eatures. Tw e l v e readers’ average performance significantly improved by 10.9% (95% CI 8.3% - 13.5%) i n AUC, 10.0% (95% CI 8.9% - 11 . 1 % ) i n accuracy , 7. 6% (95% CI 6.1% - 9.2%) in sensi tivity , and 12.6% (95% CI 10.9% - 14.3%) in specificity ( P <0.001 for all). N odule - level inter - reader diagnostic consistency improved from fair to modera te (overall ! : 0.313 vs. 0.421; P =0.019). In conclusion, DeepF AN effective ly assisted junior radiologists and may help homogenize diagnostic quality and reduce unnecessar y follow - up of indeterminate pu lmonary nodules . Chinese Clinical T rial Registry: ChiCTR2400084624. A rev i se d version of this m an uscript has been acc epted by Nat ure Can cer (DOI: 10.1038 /s43018- 026 - 01 147 -w ). 2 Introduction The 2022 global cancer statistics reveal that lung cancer remains the leadi ng cause of cancer - related deaths worldwide, with an estimated 1.8 million deaths annually 1 . In China, lung cancer is not only the most common (over 1.0 million new cases annually) but also the most fatal cancer , accounting for 28.5% of all cancer - related deaths, far above the global average rate (18.7%) 1,2 . The accumulated economic burden associated with lung cancer was estimated to be 25,069 million USD in China in 2017 (0.121% of Gross Domestic Product) and was expected to increase over the years 3 . This economic burden is further exacerbated for patients in less developed regions due to socio - economic di sparities, leading to delayed diagnoses and poorer prognoses 4 . Therefore, timely identification and early diagnosis o f lung cancer are crucial for mitiga ting this burden. Computed tomography (CT) is the main imagi ng techniqu e for identifying lung cancer at an early st age. As chest CT becomes more affordable and available, the increased use of chest CT led to the detection of millions of incidental pulmonary nodules (IPNs) a nnually , and this number further increases with the implementation of lung cancer screeni ng 5-8 . The vast number of CT images has tremendously increased radiologists’ workload, often forcing them to reduce the time spent on each case, thereby leading to an increase in interpretive errors 9 . Although the majority of nodules are ultimately classified as false positive findings for lung cancer 10 , accurately determining whether a small nodule is malignant at the time of init ial detection remains a significant chall enge. Additionall y , given that image features on CT are often subject to inter - observer inconsistency , which is highly affected by radi ologists’ working experience, the assessment of IPNs in the real world might be imprecise and inconsistent, resulting in heightened patient anxiety that com plicates the clinical process for managing IPNs 11 - 13 . Therefore, an accurate method/tool to help radiologists efficiently and c onsistently assess pulmonary nodules is urgently needed. T he Mayo model and Brock model are well - known risk models for evaluating the malignancy of solitary pulmonary nodules, but the y were developed using Western populations and have shown only moderate performance in the context of IPNs 14,15 . Additionally , patient demographic information and smoking history might be unavailable for IPNs in real - world settings. Recently , artificial intelli gence (AI) - assisted diagnostic tools have shown excellent performance in classifying IPNs as malignant or benign, reaching a level comparable to skilled radiologists 16 - 22 . However , these models were mainly developed on lung cancer screening populations with predominantly low - dose chest CT scans, which did not fully represent non - screening CT scans obtained duri ng physical examinations and other clinical purposes 23 , and most of them were not ve rified in the clinical pra ctices. Besides, curren t AI models for pulmonary nodule assessment predominantly rely on convo lutional neural networks (CNNs) and their derivatives, inherently emphasizing local feature extraction owi ng to the convolution operation 18,19,22,24 . T o address the above challenges, we propose a deep feature a ggregation network (D eepF AN) and test this method in a rigorous clinical setting. This novel framework is built on Vision T r ansformers (ViT) 25 — a self - attention based deep neural architecture for computer vision tasks, to capture global features of nodules by leveraging global attention passes across the entire input image. Additionally , a fine - grained CNN model is integrated into our framework t o extract detailed local features of nodules. Finally , a graph convolution network (GCN) 26 is ad opted to ef fectively am algamate global and local features. This approach fac ilitates relation learning and surpasses traditional feature fusion methods 26 . While the performance metric s of AI - assisted tools as standalone devices are important, their value also lies in how much they enhance radiologists' performance in a human - AI collaborative mode in dail y clinical pr actice. The multireader multicase (MRMC) s tudy design is presently the most recognized method for analyzing the performance of human readers assist ed by AI - based solutions, but MRMC studies have a time - consuming and costly nature 27 - 29 . Kim and his colleagues conducted a simplified MRMC study without a washout period to demonstrate the efficacy of an AI - based computer - aided diagnosis tool in improving both diagnostic performance of indeterminate pulmonary nodules detected in chest CT scans and interobserver agreement for risk stratification 30 . However , a rigorous MRM C study based clinical trial on Asian populations from developing countries for an AI - assisted tool for the diagnosis of pulmonary nodules detected in chest CT scans is still absent. Meanwhile, there is signific ant interest in fact ors (e.g. accuracy of AI system, susceptibility to AI, personality of A rev i se d version of this m an uscript has been acc epted by Nat ure Can cer (DOI: 10.1038 /s43018- 026 - 01 147 -w ). 3 radiologists, and working experience) that can influence radiologists’ diagnostic decisions during AI - assisted reading sessions in order to facilitate the incorporation of AI - assisted tools into clinical practi ce 31 - 33 . Therefore, this study collect ed a large cohort of IPN pati ents, more than 10K pathological confirmed pulmonary nodules from nine medical institution s in China, to train the prop osed DeepF AN model t o differentiate malignant pulmonary nodules from benign o nes, and then conduct the first rigorous clinical MRMC - study based national clinical trial (ChiCTR2400084624) in another three independent medical institutions in China with diverse population sizes (Peking University People's Hospital, 2022PHA1 18 - 001; Wuhan Third Hospital, Wuhan No.3 QX2023 - 002; and Huangshi Central Hospital, Lun Ku ai Shen [2023] No. 2 ). Besides, the generalizati on ability of DeepF AN was tested on the national lung screening trial (NLST) dataset as well as the dataset used in the cli nical trial. Furthermore, to better understand the human - AI col laboration proces s, we explo red the i nfluence of various f actors on the accuracy of human - AI diagnostic outcomes. Finally , we aimed t o provide explanations to divergence within human - AI decisi on - maki ng by visualizing the analytic process of AI individually as well as human - AI coll aboratively . Results Deep feature aggregati on network (DeepF AN) The Deep Feature Aggre gation Network (DeepF AN, version 1.0, owned by Beijing Deepwise & League of PHD Te c h n o l o g y C o . , L t d . ), the AI model tested in the clinical trial, has been app roved by th e National M edical Products Administration (NMP A) of China (Nati onal Medical Device Ap proval No. 2024321 1932) . Its neura l architecture is detailed in Figure 1 . DeepF AN integrate s three component neural networks that enhance hybrid feature learning and character ization for CT images. The first component is a v ision t ransformer (ViT) that effectively extracts global features of pulmonary nodule s and their surrounding ar eas , encod ing the overal l morphology and context of a nodule . The second component is a three - dimensional residual network with counterfactual attention learning and an att ention dropout layer (CAL - ADL 3D ResNe t) 34,35 , which extracts local features representing detailed radiologic characteristics of a nodule (such as densit y , spiculation , and lobulation). Compared to general convolutional neural networks (CNN), thi s network excels in fine - grained machine learning by capturing small - scale characteristics, thereby enhancing the AI model's capability in sensing and differentiating subtle nodule features. In the last component, a graph convolutional network (GCN) is adopted to aggregate and fuse the global features of a nod ul e extracted using the ViT and the local features extracted using the CAL - ADL 3D ResNet, aimi ng to comprehensi vely understand pulmonary nodule characterization. DeepF AN was developed a nd further evaluated using a dataset of 1 1,438 pathologically confirmed pulmonary nodules from 8,172 patients, collected from nine hospital s across seven provinces in China, including prominent medical instit utions such as Peking Union Medical College Hospital. The dataset wa s randomly partitioned in a 7:1:2 rat io into training, validation, and internal test sets. The training set consisted of 5,636 patients with 7,873 nodules (1,718 benign and 6,155 mali gnant), the validation set inc luded 831 patients with 1,216 nodules (254 benign and 962 malignant), and the internal test set comprised 1,705 patients with 2,349 nodules (600 benign and 1,749 malignant ). Additi onally , to further test its generalization ab ility , as an extension to t he clinical trial, DeepF AN was also validated on the National Lung Screening T rial (NLST) dataset , which includes 7,934 patients with 17,892 nodules (16,821 benign vs. 1,071 malignant). The basic characteristics of patients, nodules and parameters of CT scans and reconstr uction in the training, validation , internal test sets and NLST dataset are shown in Supplementary T able 1 -2 . Internal validation and generalization ability of DeepF AN The diagnost ic performance of DeepF AN in differentiating malignant nodules from benign ones is shown in Supplementary T abl e 3 . On the internal test set, DeepF AN achieved an area under t he recei ver operati ng characteristic curve (AUC) of 0.9 39 (95% confidence interval [CI], 0.93 0-0 .9 48 ), along w ith a sensitivity of 0.95 3 (0.94 3- 0.962) and a specificity of 0.73 3 (0. 699 - 0.768 ). To assess the contribution of each module within DeepF AN to its overall performance, ablation experiments A rev i se d version of this m an uscript has been acc epted by Nat ure Can cer (DOI: 10.1038 /s43018- 026 - 01 147 -w ). 4 were conducted on the internal test set using ViT , R es N et 50 , an d CA L - ADL 3D ResNet as t he three component networks. The procedure involved progressively removing, adapt ing, or replacing these components of DeepF AN to evaluate their individual impact on the system efficacy . As illustrated in Supplementary T able 4 , t he combination of ViT , CAL - ADL 3D ResNet, and GCN (model 9=DeepF AN) achieved the highes t AUC in ablation experiments, significantly outperforming related baseline methods (model 9 vs. model 1 to 3 , P <0.001) and other neural architectures (model 9 vs. model 4 - 8, P <0.05). As a suppl ement to the clinical trial, DeepF AN was t ested on the NLST dataset to further eva luate its generalization ability ( Supplement ary T able 3 ). Despite the significant reduction in the proportion of malignant nodules in the NLST dataset (with a benign - to - mali gnant ratio of 15. 71 comp ared to 0.92 in the cli nical trial dataset), the AI model' s performance under other metrics still met expectati on s. Specifi cally , it achieved an AUC of 0.943 (0. 933 - 0.953), sensitivity of 0.889 (0.869 - 0.908), specificity o f 0.897 (0.893 - 0.902), and accuracy of 0.897 (0.892 - 0.901). Our DeepF AN exhibited a negative predictive value (NPV) of 0.992 (0.991 - 0.994) and a positive predictive value (PPV) of 0.356 (0.338 - 0.374). These results indicate that DeepF AN can maintain excellent generalization performance across different clinical scenarios. We h av e al so co mp a re d t he pe r fo rm a nc e o f D ee p F A N w it h t h at of pr ev i ou s m et h od s f or pu l mo na r y n od ul e diagnosis by gathering the performance measures reported in published papers. Except the recently published deep convolutional neural network (DCNN) model 22 , the methods presented in the remaining studies — namely , the l ung c ancer prediction convolutional neural network (LCP - CNN) model, the Mayo model, Brock model, and deep learning (DL) model 14,17,18,36,37 — were rigorously assessed u tilizing the NLST dat aset, a prominent repository within the real m of lung nodule analysis. Suppl ementary T able 5 presents a comparative overview of these approaches. While we endeavored to accurately reproduce the proposed models and dataset handling processes, some discrepancies may remain due to limited available details. Nevertheless, DeepF AN exhibited outstandin g performance in assessing IPNs, achieving high AUC, accuracy , and sensitivity . These results suggest that the model could serve as a valuable tool for the preliminary assessment of IPNs, potentiall y reducing the risk of misdiagnosi ng malignant no dules. Baseline characteris tics of c linical trial The cl inical tri al design followed a strict MRMC protocol 27 and the workf low is presented in Figure 2 and a detailed explanation is illustrated in the Method secti on. The cl inical trial dataset contained 463 pathologically confirmed IPNs (222 benign vs. 241 malignant) from 400 consecutive pati ents (197 benign vs. 203 malignant) enrolled according to predefined inclusion and exclusion criteria ( Extended Data Figure 1 ). Specificall y , 166 patients with 204 IPNs were from clinical trial center I , 46 patients with 46 IPNs from c enter II, and 188 patients with 213 IPNs from c enter III . Basic c haracteristics of patients/nodul es and parameters of CT scan s are shown in Ta b l e 1 and Supplementary T able 6 -7 . The readers participating i n the clinical trial are junior radiologists with 1 - 5 years of working e xperience, incl uding three readers from clinical trial center I , four from center II, and five from c enter III. Detailed informat ion about the readers i s provided in Supplementary T able 8 . Performance of DeepF AN in cli nical trial In the clinical trial, DeepF AN alone obtained an average AUC of 0.954 (0. 934 - 0.973), a sensitivity of 0.950 (0.923 - 0.978), and a specificity of 0.851 (0.805 - 0.898). More speci fically , the AUCs in the thre e cli nical trial centers were 0.947 (0. 915 - 0.978), 0.975 (0.923 - 1.000), and 0.963 (0.937 - 0.988) , respectively ( Figure 3 ). The sensitivities were 0.925 (0.874 - 0.972), 1.000 (1.000 - 1.000), and 0.966 (0.932 - 0.992), while the specifi cities were 0.878 (0.813 - 0.938), 0.815 (0.640 - 0.957), and 0.835 (0.762 - 0.905), respectively ( Supplementary T able 3 ). Performance of readers with and without AI assistance In the control group of the clinical trial, the readers independently evaluated the malignancy of 4 63 nodules from the 400 patients ( Supplementary T able 9 ). The average AUC of the twelve readers was 0.667 (0.616 - 0.719), A rev i se d version of this m an uscript has been acc epted by Nat ure Can cer (DOI: 10.1038 /s43018- 026 - 01 147 -w ). 5 with a sensitivity of 0.693 (0.67 6 - 0.709), a specificity of 0.605 (0.586 - 0.623), an accuracy of 0.65 1 (0.638 - 0.663). The highest AUC, sensiti vity , and spec ificity achieved by the reader s wer e 0 .773 (0.731 - 0.815 ; reader 12 ), 0.954 (0.927 - 0.979 ) , and 0.928 (0.892 - 0.958 ; reader 08 ), whil e the lowest values were 0.533 (0.480 - 0.586 ; reader 06 ), 0.402 (0.339 - 0.466 ; reader 08 ), and 0.423 (0.364 - 0.489 ; reader 09 ), respectively . At t he p atient level, t he average AUC of the independent reading was 0.733 (0.685 - 0.780) , wit h a sensitivity of 0 . 759 (0. 743 - 0.776 ), a specificity of 0. 568 (0.5 48 - 0.588 ), and an accuracy of 0. 665 (0. 652 - 0.679 ). With the as sistance of De epF AN ( Supplementary T abl e 9 ) , the average AUC of the test group was improved to 0.776 (0.733 - 0.819), sensitivity 0. 769 (0.754 - 0.784), specif icity 0.731 (0.714 - 0.747), accuracy 0.751 (0.739 - 0.762), PPV 0.756 (0.740 - 0.772), NPV 0.744 (0.728 - 0.762), and F1 - score 0.762 (0.750 - 0.775). T he highest AUC, sensitivity , and specificity achieved by the AI - assisted readers w ere 0.883 (0.852 - 0.914 ; reader 02 ), 0.934 (0.903 - 0.964 ; reader 12 ), and 0 .959 (0.932 - 0.985 ; reader 08 ), while the lowest values were improved to 0.693 (0.645 - 0.741 ; reader 06 ), 0.531 ( 0.467 - 0.591 ; reader 08 ), a nd 0.518 (0.452 - 0.586 ; reader 12 ), respectively . At the patient level, the average AUC of the AI - assisted reading was 0.840 (0.807 - 0.873), with a sensitivi ty of 0. 833 (0. 818 - 0.848 ), a specificity of 0. 705 (0. 687 - 0.724 ), and an accuracy of 0. 770 (0 . 758 - 0.782 ). Figure 3 illustrates the performance of the twelve readers on each clinical trial center datase t. The arrows in the plot highlight the enhancements in reader performance, which are particularly evident in specificity with an average improvement of 0.126 (0.109 - 0.143). The average improvements in AUC, sensitivity , and accuracy of the twelve readers were 0.109 (0 .083 – 0.135), 0.076 (0.061 – 0.092), and 0.100 (0.089 – 0.1 1 1), respectively ( see Supplementary T able 9 ). Extended Data Figure 2 provides further details of the diagnostic indi cators for each reader , both with and without AI assist ance, and the ir comparison with DeepF AN performance. DeepF AN outperformed readers with one to five years of experience across most metrics (P < 0.001 for all AUC and accuracy comparisons), and reader performance remained signi ficantly below that of DeepF AN even with AI assistance. A subset of readers, however , achi eved sensitivity and specificity comparable to or exceeding those of DeepF AN. This is specifically illustrated in the radar maps ( Figur e 4) , where the areas of AI - assisted diagnostic metrics (depicted in blue ) are larger than those of independent diagnosti c metrics ( depi cted in yellow ) for all readers, which suggests a comprehensive boost in ability to dif ferentiate malignan t IPNs . Notab ly , the most pronounced improvement was observed in reader 02 (the maximum area increment) , while the least was observed in reader 12 (the minimum area increment). Confidence of readers wi th and without AI a ssistance In the clinical trial, each IPN was gra ded by the readers on a scale of 1 - 10, with 1 - 5 being benign and 6 - 10 being malignant. Extended Data Figur e 3 and 4 show the changes in the number and percentage of benign or malignant nodules for each rat ing level before and a fter AI a ssistance. For nodu les rated 1 - 5 by the twelve readers during independent reading, the proportions of true pathologically benign nodules were 84%, 83%, 71%, 67%, and 57%, respectively . For nodul es rated 6 - 10, the proportions of pathologically malignant nodules were 57%, 66%, 74%, 78%, and 85%, respectivel y . With AI - assisted read ing, the prop ortions of path ologically benign nodules among those rated 1 - 5 increased to 86%, 87% , 81%, 77%, and 66% , while the proportions of pathologically malignant nodules among those r ated 6 - 10 were increased to 66%, 75%, 86%, 94%, and 97%, respective ly . These results indicate that the AI model can substantially enhance the diagnostic accuracy of pulmonary nodules across all rating levels, with a pronounced impact on malignant nodule identification. This enhancement suggests that the model can i ncrease diagnostic confidence for malignant cases while reducing false positives, thereby mitigating the risk of unnecessary radiation exposure or invasive interventions of patients. Additionally , a s shown in Figure 5a , the change s in diagnostic scores for each reader indicate that, after AI assistance, most readers assigned lower scores to benign nodules (mean decrease of 0.65 points) and higher scores to malignant nodules (mean increase of 0.2 5 points). When examining score changes at each level of unassisted scori ng, nodules that were initially miscl assified as benign (Score ≤ 5 without AI) showed an increase in mean scores after AI assistance, whereas those misclassified as maligna nt (Score > 5 without AI) demonstrated A rev i se d version of this m an uscript has been acc epted by Nat ure Can cer (DOI: 10.1038 /s43018- 026 - 01 147 -w ). 6 a decrease in mean scores following AI assistance. Similarly , both the Extended Data Fi gures 5 and 6 show that with DeepF AN assi stance, readers te nded to assign lower malignancy scores to benign nodules and higher scores to malignant ones , reflecting incre ased diagnos tic confidence and impr oved dif ferentiation between benign and malignant nodul es. Finally , wit h DeepF AN assistance, t he overall kappa agreement coefficient increased from 0.285 to 0.417 ( P =0.026) at the patient level, and from 0.313 to 0.421 ( P =0.019) at the nodule l evel. The visualized correlation coefficient matrix shows that the agreement between each pair of readers was effectively improved with AI assistance ( Figure 5b&c ). Stratified analysis The diagnostic performance of DeepF AN, unassisted r eaders and AI - assisted readers was further analyzed and compared over subgroups stratified by patient characteristics including age and gender , nodule characteristics including diameter , density , location, and diagnostic dif ficulty , and reader characteristics including hospital affiliation, working experience and education level (high est academic degree) . The diagnostic difficulty of a nodule was defined as low , intermediate, and high when more than two - thirds, between one - third and two - thirds, and less than one - third, respectively , of the unassisted readers correctly classified it. Results from strat ified anal ysis ( Supplementary T able 1 0 and 1 1 ) show that DeepF AN exhibits significantly higher AUC compared to unassisted readers and AI - assisted readers over all subgroups while substantially improving the diagnostic ability of r eaders ( P <0.0 01 for all AUCs). These results were consistent across the entire clinical trial dataset . In particular , over subgroups of nodules with low , intermediate, and high diagnostic diffic ulty , the AUC of DeepF AN reaches 0.994, 0.942, and 0. 644 respectively , and DeepF AN enhances the diagnostic performance of readers in all difficulty l evels (low: 0.913 to 0.956, " =0.043 [0.034 - 0.052]; i ntermediate: 0.447 to 0.642, " = 0.195 [ 0.167 - 0.220]; and high: 0.1 13 to 0.229, " = 0.1 16 [ 0.088 - 0.144]). These findings suggest that DeepF AN is robust to variations in nodule, patient and reader characterist ics, maintaining competent predictive and stable assistive capabilities even for more challenging nodules. From Extended Data Figure 7 , we observe a steady enhancem ent in AUC when readers were assisted with AI. Meanwhile, nodules sized 20 - 30 mm ( P <0. 0 01) , solid nodules ( P <0. 05 ) , readers with Medical Doctor (M.D.) as their highest degree ( P <0. 0 01) , and readers with clinical trial center I (Peking University People's Hospital) as thei r hospital affiliation ( P <0. 0 01) were associated with bett er diagnosti c performance among subgro ups respectiv ely stratified by nodule diameter , nodule density , education level of readers, and hospital affiliation of reader s across all three reading modes. Model visuali zation and inter pretability Figure 6 illustrates how DeepF AN utilizes chest CT to make decisions. Heatmaps wer e generated using the gradient - weighted clas s acti vation mapping (Grad - CAM) method 38 , enhancing model interpretabil ity at both the image and feature levels. Heatmaps help visualize and understand which areas of the feature map contribute most to a network output. Observations indicate that DeepF AN primarily relies on global features from the ViT module while incorporating local features from t he CAL - ADL 3D ResNet, representing malignancy related nodule characteristics. Detailed descriptions of the two approaches used to capture local and global features are illustrate d in the Methods section. B riefly , the ViT branch processes a 128×128×128 mm ³ volume centered on the nodule, covering at least one - quarter of the lung and thereby allowing the capture of hidden nodule l ocal features and contextual relationships (e.g., per inodular textures) and vascular connections. Meanwhile, the local feature branch captures nodule - specific det ails incl uding density, lobulati on, and spiculation. For example, DeepF AN successfully recognizes the smooth m argin, solid density , and partial fat density of hamartoma ( Figure 6a , benign nodule), as well as the irregul ar shape, heter ogeneous density , lobulation, and spiculation associated with invasive adenocarcinoma ( Figure 6b , malignant nodule). These features provide the AI model with a more comprehen sive and clearer perspective for predicting mali gnancy versus benignity . Ultimately , GCN captures the relati onships among these deep features (i.e. graph nodes), facilitating global and local information aggregation that improves A rev i se d version of this m an uscript has been acc epted by Nat ure Can cer (DOI: 10.1038 /s43018- 026 - 01 147 -w ). 7 diagnostic performance. However , some complex nodules were inherently confusing, exhibiting radiologic characteristics shar ed by both benign and malignant nodules. For example, epi thelial hyperplasia ( Figure 6c , benign nodule) shows dispersed morphology , heterogeneous ground - glass densit y , and multiple adjacent vascul ar branches, while invasive adenocarcinoma ( Figure 6d , malignant nodule), that has an irregular shape, relatively high and uniform solid density , lobul ation and long spiculation, can be easily confused with granulomatous inflammation. These shared radiologic characteristics and their combinations can interfere with AI's interpretation of a chest CT , which might ultimately result in a miscl assification. To d e l v e d e e p e r i n t o t h e m e c h a n i s m s o f t h e p r o p o s e d D e e p F A N m o d e l f o r c l a s s i f y i n g I P N s a s b e n i g n o r malignant, logis tic r egression analyses were conducted to expl ore the corre lation between DeepF AN' s predictions and nodule characteristics ( Supplementary T able 12 ). Multivariable analyses indicated significant associations between malignancy predictions and a subset of nodule characteristics, including large diameter (odds ratio [OR]=1.1 1, P <0.001), part - solid and ground - glass nodule density (OR=30.05, P <0.00 1 and OR=18.05, P <0.001), and presence of spiculation (OR=4.67, P <0.001) and lobulation (OR=4.26, P <0.001). Factors influencing Human - AI colla boration Sankey d iagrams ( Extended Data Figure 8 ) were used to demonstrate the flow of changes in diagnostic results from independent reading to AI - assisted reading for the twelve readers, and for reader 2 and reader 12 indivi dually , as they were two special readers benefiting the most and least from the AI assistance according to the radar maps. Using the p athology reports a s the ref erence standard, th e fal se p ositive rate (FPR, defi ned in Method s ection) and false negative rate (FNR, defined in Method sect ion) for DeepF AN were 15% and 5%, respe ctively , and t he overall FPR and FNR for independent reading were 40% and 31%, respectively . With the assistance of the AI model, t he readers corrected 43% o f benign misdiagnose s and 41% of mal ignant misdi agnoses, re ducing th e FPR and FNR to 27% and 23%. Reader 2 had a higher misdiagnosi s rate than reader 12 (34% vs. 27%). With t he assistance of DeepF AN, reader 2 corrected 68% of misdiagnoses, while reader 12 only corrected 21%, leading to a more significant improvement i n diagnostic accuracy for reader 2 compared to reader 12 (88% vs. 73% after DeepF AN assistance). Extended Data Figure 9 presents examples of human - AI collaboration outcomes using Gra d - CAM, showcasing three distinct scenarios: (a) cases where AI correctly classifies nodules initially miscl assified by radiologists, enabling corre ct revisions during collaboration; (b) cases w here AI correctly classifi es nodules misclassif ied by radiologists, but radiologists' predictions remain un changed due to t he nodu les' st rong mi sleading features; and (c) cases where both AI and radiologists, with or without AI assistance, misclassify nodu les due to their highly deceptive imaging characteristics. These findings illustrate the AI’s potential to i mprove diagnostic accuracy while also highlighting the chall enges of human - AI collaboration in complex or ambiguous cases. To further expl ore the factors affecting AI - assisted reading accuracy , 22 factors in five aspects , including diagnostic results, patient characteristics, nodule characteristics, CT image characteristics, and reader characteristics, were included for generalized linear mixed model analyses ( Supplementary T able 13 ). In univariable analysis, malignant nodules, correct AI suggestion s , correct independent reading s , and larger nodule diameter s are associated wi th hi gher AI - assisted reading accuracy ( β>0, P <0.05), while inter action between correct AI suggest ions and correct independent reading s , nodule s wit h ground - glass opacity , lobulation, higher diagnostic difficulty , and hospital af filiation and lower education level of the readers are associated with lower AI - assisted diagnostic accuracy ( β<0, P <0.05). Subsequently , factors with P <0.05 were selected for further multivari able anal ysis. After adju stment for covariance, correct ness of DeepF AN predictio ns ( β=1.72, P <0 .001), diagnostic difficulty of nodules (reference: low; intermediate, β= - 1.65 , P <0.001; high, β= -2. 68 , P <0.001), and education le vel of readers (reference: M.D. ; M.M , β= - 0.5 3 , P =0.0 34 ; B.M. , β= - 0.6 7 , P =0.00 9 ) were correlated with AI - assisted accuracy with sta tistical significance. The results of Gri t score were shown in Supplementary T able 14 and the translated reader questionnaire was provided in the Supplementary Information . A rev i se d version of this m an uscript has been acc epted by Nat ure Can cer (DOI: 10.1038 /s43018- 026 - 01 147 -w ). 8 Web - based AI platform To f a c i l i t a t e t h e p r o m o t i o n a n d a p p l i c a t i o n o f D e e p F A N i n c l i n i c a l p r a c t i c e , i t h a s b e e n i m p l e m e n t e d a s a w e b - based AI plat form ( Figure 7 ). This platform enables user registration, case upload, and result generation. When patients complete a CT examination under the arrangement of clinicians, their information, includi ng chest CT images, will be automatica lly uploaded to picture archiving a nd communication system (P ACS). Radiologists can upload CT images they choose from P ACS to this web - based AI platform. The pl atform will provide diagnost ic advice generated from DeepF AN to radiologists, including the classification of I PNs as benign or malignant ones as wel l as the characteristics of nodules such as lobulation and spiculation. Finally , radiologists make the conclusion about the nature of pul monary nodul es ref er t o thi s i nformation and provide reports to patients and clinicians. Discussion Although numerous studies have emerged on deep lear ning mod els f or pul monary n odule classification, AI diagnostic tools certi fied with rigorous MRMC clinical tr ials for clinical decisi on support remain scarce. In this study , we conducted the first official ly registered multicenter , MRMC clinical trial with a paired study design in China (ChiCTR2400084624) to evaluate the performance of the proposed DeepF AN in assisting radiologists to differentiate malignant IPNs from benign ones in chest CT scans. By integ rating global features and local nodule features, the proposed transformer - based DeepF AN model demonstrated excellent performance in IPN classification across multicenter test datasets r epresenting various clinical scenarios, exhibiting strong robustness a nd general ization abil ity . Additionally , DeepF AN significantly improved the diagnost ic accuracy , confidence and consistency of radiologists, showing its potential to homogenize healthcare services provided by medical practitioners with different educationa l backgrounds and working experience. Furthermore, studies on explainability revealed differences in assessment logics between human and AI, which provides valuable insights on clinical implementation pathways and future invest igations in human - AI interact ion. Previous de ep learning models hav e demonstrated potential in pul monary nodule classificati on, frequently surpassing human experts in diagnostic accuracy 16 - 19,39 - 41 . However , most of them have been developed to operate on specific nodule types 19,40 (e.g., solid or part - solid) or prioritize local feature extraction while negl ecting global contexts 17 - 19 . Only a few of them have been validated through rigorous clinical trials. T o address these limitations, we present DeepF AN, an advanced deep neural architecture including a vision transformer for global context modeling, a CAL - ADL 3D ResNet for local fea t ure extraction, and a graph convolutional network for hybrid feature fusion. DeepF AN was evaluated across four settings: (1) on an internal dataset from nine centers, it achieved high AUC and sensitivi ty , and further validated its core components; (2) on an external dataset (the clinical trial dat aset) from three centers, it demonstrated satisfactory predictive capability by reporting high AUC, sensitivity , and specificity . (3) on the clinical trial dataset representing sur gery - intended population, it o utpe rformed 12 radiologists with 1 – 5 years of experience across various aspects; (4) on the NLST dataset representing western populations undergoing lung cancer scr eening, it demonstrated favorably robustness and generalizat ion abili ty , achieving high AUC and near - perfect NPV . Notably , DeepF AN showed a higher NPV while a lower PPV on the NLST dataset compared to those on the cli nical trial dataset. The discrepancy i s reason able as a larger proportion of benign nodules in the NLST dataset likely gives rise to an increased number of false positives (predicting a benign nodule as malignant), and even a small increase in the number of false positives can lead to a significant drop in P PV as the total num ber of positive predictions (denominator) increases while the number of true positives (numerator) remains small due to a decreased proportion of malignant nodules. Furthermore, DeepF AN offers interpretability because its internal info rmation, such as GCN node we ights and s emantic cha racteristics link ed to nodule malignancy , can be visualized to show the decision - making process. This interpretable framework underscores DeepF AN’s superior diagnostic performance, surpassing both radiologists and previous state - of - the - art models 17,18,22 . To a c c u r a t e l y e v a l u a t e t h e i m p a c t o f A I - assisted diagnostic tools on clinicians’ assessment of the malignancy A rev i se d version of this m an uscript has been acc epted by Nat ure Can cer (DOI: 10.1038 /s43018- 026 - 01 147 -w ). 9 risk of IPNs, we conducted a rigorously designed MRMC clinical tri al to validate DeepF AN in real - world clinical practice. While previ ous studies highlighted considerable variability among radiologists in pulmonary nodule assessment 11 , 1 2 , 4 2 - 44 , our clinical trial demonstrated substantial improvements in readers’ diagnostic performance with inc reased accuracy across rating levels, enhanced confidence in nodule as sessment, and a marked rise in inter - reader diagnostic consistency from fair to moderate. Although previous studies 30 , 45 , 46 also tried to leverage computer - aided tools to improve consistency or accuracy in pulmonary nodul e diagnosi s, l imitations, such as absence of washout periods and absence of Asian popul ations, exist. Our findings pr ovide robust and novel evidence that AI - assisted tools, exemplifi ed by DeepF AN, can deliver consistent and accurate IPN assessments, which h ave the potential to allevi ate patient anxiet y , reduce unwarran ted imaging, and mitigate radiation - related health risks. The stratified analyses showed DeepF AN’s robustness across various CT parameters (including different CT manufacturer s and sca nning/reconstru ction protoc ols), pati ent cohorts and n odule charact eristics. While th e standalone DeepF AN model achieved robust an d balanced diagnosti c performance across most nodule subsets, its effectiveness was lim ited in high - difficulty nodules (AUC = 0.644), underscoring the need for further refi nement, such as integrating multi - modal data or reinfor cing traini ng with high - diffi culty datasets. Comparatively , the model showed greater improvement in int ermediate - dif f iculty nodules (AUC improved from 0.447 to 0.642; # =0.195) than in low - dif ficulty cases (from 0.913 to 0.956; # =0.043). However , it provided limited benefit in high - dif ficulty cases (from 0.1 13 to 0.229; # =0.1 16), highlighting t he need for enhanced assistive st rategies in challenging scenarios, such as improving AI interpretability . Despite these limitations, DeepF AN consistently provided reliable assistance to readers across diverse patient cohorts (encomp assing different ages and genders), nodul e attributes (such as size, density and location), and reader characteristics (including education, experience, and clinical center) within the clinical trial dataset. After thorough correlation analysis, we discovered that AI - assisted reading accuracy was closely associated with the correctness of DeepF AN’s pr edictions, the diagnostic difficulty of nodules, and the education level of readers after ad justment for the cov ariance. Notably , readers holding M.D. degrees demonstrated superior diagnostic performance (P<0.001). And all readers at Peking University People’s Hospit al held M.D. degrees, resulting i n the highest average accuracy in the study (P<0.001). This fact lik ely reflects systematic di sparities i n resource allocation and professional development opportunities as larger cities like Beijing, with larger populations (21.9 million vs. 12.4 million vs. 2.5 million, Beijing vs. W uhan vs. Huangshi according to the nat ional 47 and Hubei province Bureau of Stat istics 47,48 ) and better infrastructure, attract students pursuing advanced degrees and expose junior radiol ogists to richer diagnosti c experi ence 48,49 . Importantly , while DeepF AN allow ed those with B.M. and M.M. degrees to outperform M.D. readers without AI assistance in terms of AUC , sensitivity and specifici ty ( Su pplementary T able 10 ), a notable performance gap remained between M.D. and non - M.D. readers when both groups used DeepF AN. This suggest s that while DeepF AN improves the performance of non - M.D. re aders , it does not eliminate expertise - related disparities . Despi te these, DeepF AN has shown potential to assist a broad spectrum of medical professionals — including those without M.D. degrees — by improving diagnostic accuracy across diverse levels of training. Although DeepF AN demonst rated substanti al improvements in readers’ dia gnostic accuracy during the clinical trial, AI - assisted reader performance did not exceed that of the AI model it self. Further analysis revealed that this limitation was unrelated to a reader ’s e xperience, personality , or attitude toward AI but was instead infl uenced by deceptive nodule characterist ics 32 , such as benign nodules with malignant - looking radiological features. Such cases often lead readers to reject correct AI suggestions due to entrenched diagnostic patterns. DeepF AN’s abil ity to transcend traditional radiological features by incorporating g lob al pat terns u nderscores its advanced diagnostic capabilities while highlighting the need for AI tools to reshape conventional diagnostic approaches 50,51 . Despite these challenges, DeepF AN enabled readers to correct 43% of benign and 41% of malignant misdiagnoses, reducing false positive and negative rates to 27% (vs. 40% without DeepF AN) and 23% (vs. 31% without DeepF AN), respectivel y . Even the least impr oved reader corrected 21% of errors while the most improved reader A rev i se d version of this m an uscript has been acc epted by Nat ure Can cer (DOI: 10.1038 /s43018- 026 - 01 147 -w ). 10 corrected 68%, reflecting DeepF AN’s adaptability across diverse user characteristics. The ratio nale behind our choi ce of ra diologists wit h less th an five ye ars of exp erience is threefold. First, in frontline hospitals in smaller cities, initi al diagnoses are often made by less experienced radiologists due to an imbalanced distribution of medical resourc e. T his presents an opportunity for AI to bridge expertise gaps, advancing the goal of equitabl e healthcare. Second, China’s two - tier reading system, where junior radiologists perform ini tial assessment followed by r eview performed by seni or radiologists, could benefit significantly from improved diagnostic accuracy at the junior level, alleviating senior radiologists’ workload and improving review efficiency . Third, previous breast cancer diagnostic research has demonstrated AI’s potential to replace junior doctors in initial readings, aligning this study with the broader trends of optimizing clinical workflows through AI integration 52 . While DeepF AN has shown promise in reducing diagnostic discrepancies among radiologists with varying educati onal backgrounds (BM vs. MD), it remains unclear whether AI - assisted junior radiologists can match or exceed the di agnostic per formance of experie nced senior radiologists. Further research is needed to evaluate DeepF AN’s applicability and effectiveness in more complex cl inical settings involving senior radiologists. Our DeepF AN mo del has shown pro mising resul ts, but limitations exist. First, all the test da tasets were retrieved retrospectively , and a p rospective clinical study warrants more robust evidence . Nonetheless, the results from our multicenter clinical trial and on the NLST dataset have demonstrated the model’s generalization ability . Second, only pathologically confirmed lung nodules were include d in our clinica l tri al, this criterion may favor the inclusion of mor e suspicious nod ules, which could impact the generalizability of our findings. T o mitigate potential selection bias, we validated the model's performance in a stratified subgroup of lung nodules measuring 4 – 10 mm and in the GGN subgroup, and also conduct ed testing i n the NLST lung cancer screeni ng da taset. Third, the evaluation of DeepF AN's efficacy in AI - assisted reading was limited to inexperienced radiologists, who represent frontline practitioners for reporting potentially malignant pulmonary nodules. Further investigation is needed to assess its utility among experienced radiologist s, such as how senior radiologists interact with AI predictions and whether AI can reduce inter - observer variability in multi - tiered diagnostic system, and its effectiveness across diverse clinical settings, incl uding those in Western healthcare systems. Last, DeepF AN only provi ded binary classification results to human readers during the AI - assisted reading sessions in our clinical trial. It remains to be explored whether providing additional information, such as a ternary classification including an extra category for nodules with uncertain diagnoses or the premalignant category , would increase the acceptance of AI suggestions by radiologists. In conclusion, we have conducted the first MRMC clinical trial in China to evaluate the efficacy of our developed DeepF AN model in assisting radiologist s to assess the malignancy risk of IPNs i n chest CT scans. DeepF AN has not only exhibite d outstanding an d robust diagnostic performance on IPNs across multiple internal and external datasets as well as di verse clinical scenarios, but also consistently enhanced the diagnostic accuracy , confidence and inter - reader consistency of junior radiologists via human -A I collaboration. By facilitating more uniform healthcare services across regions, DeepF AN holds the potential to mitigate IPN - related anxiety and reduce unnecessary imaging surveillance, thereby lowering radiation - related health risks and avoiding excessiv e medical exp enditures. Methods Ethics approval This study incl udes a retrospective, multi - center , multi - reader multi - case (MRMC) clinical trial with a paired design ( Chinese Clini cal T ria l Registry: ChiCTR2 400084624). It was co nducted in accord ance with the Declaration o f Helsinki. The Institution al Review Board s of the primary sponsor (Peking Union Medical College Hospital, JS - 2805) and the three enrollment and research s it e s (Peking University People's Hospital, 2022PHA1 18 - 001; Wuhan Third Hospital, Wuhan No.3 QX2023 - 002; and Huangshi Central Hospital, Lun Kuai Shen [2023] No. 2) approved the trial and waived informed consent for patients . Informed consents for twelve readers were obtained prior to the study . A rev i se d version of this m an uscript has been acc epted by Nat ure Can cer (DOI: 10.1038 /s43018- 026 - 01 147 -w ). 11 Clinical trial da taset The officially registered national clinical trial was designed to not only evaluate the performance of DeepF AN in distinguishing malignant pulmonary nodules from benign ones but also examine its efficacy in assisting junior radiologists under real clinical setting s. The cli nical trial retrospectivel y collected demographic data a nd unenhanced chest CT scan s from 400 consecutive patients across the three clinical trial cent ers: Peking Universit y People's Hospital (center I), from September 202 2 to Decembe r 2022; Wuhan T hird Hospital (center II), from August 2020 to February 2023; and Huangshi Central Hos pital (center III), f rom Septe mber 2020 to November 2022. Among the th ree cen ters, Peking University People's Hospital had a significantl y higher surgi cal volume compared to the other two centers. T o ensure relatively balanced representation and distribution of the 400 cases across centers, we extended the data collection peri od for the lower - volume centers while maintaining overl apping periods (e.g. , including 2022 data f rom all centers). The inclusion criteria are as follows ( Extended Data Figure 1 ): (a) patient age ≥ 18 years; (b) availability of postoperative pathology; (c) nodule diameter ≥ 4mm and ≤ 3cm; (d) i nterval between the latest preoperative CT scan and surgery ≤ one month; (e) CT slice thickness < 2mm and reconstruction slice increment ≤ slice thick ness; and (f ) DICOM - compliant CT images. The exclusion criteria are as follows: (a) nodules reported by pathology could not be accurately located in CT images; (b) incomplete CT scan range, poor CT image quality (metal or breath ing artefacts), or postoperative CT ; (c) m etastatic lesions; and (d) redundant ma lignant cases wer e excluded to ensure a malignant - to - benign ratio close to 1 . Baseline ch aracteristics of the enrol led patients and CT protocol s are shown in Ta b l e 1 and Suppl ementary Ta b l e s 6-7 . All data were de - identified prior to model training, v alidation, testing and clinical trials. Clinical trial de sign The study adopted a f ully crossed MRMC design ( Figure 2 ), which included twelve rea ders from three clinical trial centers: readers 01 – 03 from Peking University People's Hospital, readers 04 – 07 from W uhan Third Hospital, and readers 08 – 12 from Huangshi Central Hospital. All readers had 1 – 5 years of workin g experience in general diagnostic imaging of CT scans , with an a verage of 2.83 years. T o avoid selection bias, all reade rs were random ly selected from the pool of eligible radiologists. Detailed information about the readers can be found in Supplementary T able 8 . The MRMC study comprised two rounds of image reading, separated by a four - week wash out period . In the first round, Group A served as the control group, indepe ndently assessing the benignity and m alignancy of the 400 cases, while Group B served as the test group, using the AI model for assistance (all 400 cases). In the second round, the roles were r eversed, with Group A acting as t he test group and Group B as the control group. The study platform guided readers to outline a nodule in the CT scan of a trial case with a rectangle box. If AI assistance was enabled, the plat form displayed a card with the AI - predicted cl assification of the nodule (benign or malignant); otherwise, the card remained blank. To e n s u r e a c c u r a t e n o d u l e l o c a l i z a t i o n , e a c h r e a d e r w a s p r o v i d e d w i t h a handbook showing the locations of the 463 nodul es defined in the ground truth in the original CT scans. The r eaders were then instructed to annotate the nodules with tight rectangular boxes. For independent reading, the readers assigned a bina ry label (benign or m alignant) and a risk score (1 - 5 for benign; 6 - 10 for malignant) to every located nodule . For AI - assisted reading, the AI model automatically provided di agnostic results for the nodules annotated by the readers, who then referred to these A I - generated results before pr oviding their final labels and scores. No time constraints were imposed on cases reading. Throughout t he clinical trial, all re aders: (a) we re blinded to clini cal and path ological informat ion of the trial cases; (b) were unaware of the benign - to - malignant ratio of pulmonary nodules in the clinical trial dataset; (c) were not informed of the AI model’s di agnostic per formance; (d) did not recall results from the first round during the second round; and (e) received no training beyond that required for using the AI software. A rev i se d version of this m an uscript has been acc epted by Nat ure Can cer (DOI: 10.1038 /s43018- 026 - 01 147 -w ). 12 Ground truth To e n s u r e t h a t t h e i n c l u d e d c a s e s w e r e q u a l i f i e d , a n e x p e r t g r o u p c o m p r i s i n g e x p e r i e n c e d t h o r a c i c s u r g e o n s ( 11 - 30 years of experience), pathologists ( 15 - 23 years of experience), and radiologists ( 20 - 26 years of experience) from the three centers were formed. The expert group was res p onsible for finalizing case selection and providing ground truths for each case . Specifically , thoracic surgeons were responsible fo r s creening cases according t o the inclusion and exclusion criteria, and correlating nodules in sur gical reports with patholog ical findings. Pathologists reviewed the pathology reports while radiologists delineated target nodules in CT images. The malignancy of pulmonar y no dules was determine d acc ording to the ICD - 10 (2015 edition, accessible via https://icd.who.int/browse10/201 5 /en ). Evaluation metrics The primary evaluat ion met rics were ROC - AUC, ac curacy , sensitivity , specificit y at the nodule level. The test group and the cont rol group provide d potential determinations of benign or malignant pulmonary nodules based on the specific characteristics of the nodules, along with a confidence score indicating the likelihood of benign or malignant natu re (ranging from 1 to 10, where 1 - 5 indicates benign and 6 - 10 indicates malignant). Based on the confidence scores at the nodule level, the ROC - AUC for the determ ination of benign or malignant pulmonary nodules was calculated for both the test group and the control group, and a comparison was made between the groups. The secondary eval uation metrics were positive predictive value (PPV), negative predictive value ( NPV), F1 - score, false positi ve rate (FPR) and false negative rate (FNR) at the nodule level. For sensitivity analysis, ROC - AUC, sensitivit y , specificity , and accuracy at the pati ent level were calculated. At the patient level, the confi dence score was defined as the highest scor e among all nodul es for a si ngle patient. A positive result at the patient level was defined as having at least one positive/malignant nodule, while a negative result at the patient level was defined as having no po sitive/malignant nodules. The formul as for the a bove - mentioned metrics we re defined as follows: Sensitivity = TP / (TP + FN) Specificity = TN / (FP + TN) Accuracy = (TP + TN) / (TP + FP + TN + FN) PPV = TP / (TP + FP) NPV = TN / (TN + FN) F1 - score = 2×TP / (2×TP + FP + FN) FPR = FP / (FP + TN) FNR = FN / (TP + FN) FP , TP , FN, and TN stand for false po sitives, true positiv es, false negatives, and true negatives, respecti vely . Model developme nt cohort and generaliz ation test cohort CT i mages of pul monary nodules taken b etween November 201 1 an d October 2 021 wer e retrospectivel y collected from nine hospitals across seven provinces in China, and randomly divided into training, validation, and internal test sets in a ratio of 7:1:2 (no overlap among these sets at the patient level) , resulting in a training set of 5,636 patients with 7,873 nodules, a validation set of 831 patients with 1,216 nodules and an internal test set of 1,705 patients with 2,349 nodules. The benign and malignant nod ules in the above datasets were all pathologically confirmed. Considering th e potential bias in the propor tion of benign and malignant nodules caused b y the inclusion of pathologically confirmed nodules onl y , we further evaluated model performance on the National Lung Screening Tr i a l ( N L S T ) d a t a s e t t h a t i n c l u d e s b e n i gn nodules confirmed through patient follow - up. The incl usion and exclusion criteria for the development, validation and internal test set cohort were as follows: A rev i se d version of this m an uscript has been acc epted by Nat ure Can cer (DOI: 10.1038 /s43018- 026 - 01 147 -w ). 13 (a) patient age ≥ 18 years; (b) lung nodules detected in unenhanced chest CT were pathologically confirmed and could be accurately localized in CT images through pathology reports and/or surgical records; (c) CT examination was performed before sur gery , and slice thickness was less than 2mm; (d) DICOM - compliant CT images; and (e) exclusion of metastatic tumors ; (f) exclusi on of CT images with poor quality affecting doctors' diagnosis or incomplete dep iction of nodules. The inclusion and exclusion criteria for the NLST dataset were as follows: (a) patients had undergone chest CT examination and non - calcified nodule/mass (di ameter , ≥4mm and ≤30mm) was found on any screen; (b) benign and malignant cases confirmed by pathology or follow - up; (c) DICOM - compliant CT images ; and (d)exclusion of CT images with slice thickness greater tha n 2mm. For developmental dataset, e ach pulmonary nodule was manually annotated by radiologists with more than five years of experience in chest CT diagnostic imaging from a t ertiary A- level hospital. The reviewing doctors were radiologists with more than ten years of experience in chest CT diagnostic imaging , who also worked in a tertiary A- level hospital. For the NLST dataset, we followed the methodology from Ve n k a d e s h et al.’s study 17 to locate benign and malignant nodules . Briefly , for p articipants diagnos ed wi th lung cancer , a board - certified radiologist (J.W .) retrospectively reviewed all available imaging data across the screening periods to accurately identify malignant nodules within t he tumor - affected lobe. For non - cancer participants, two trained medical st udents (L.P . & Z.Y .) independent ly reviewed the CT images usi ng the NLST - provided lobar locations and CT section numbers to locate nodules. Inter - reader discrepancies were resolved by a senior radiologist (L.S.) . N odules with an average diameter < 4 mm were excluded in accordance with established size cr iteria . Data preprocessing D ata preprocessing was conducted before model t raining . Due to variations in pixel spacing and CT slice thickness, the CT images were linearly interpolated into 3 - dimentional isotropic images, with voxel spacing set to 0.6 mm × 0.6 mm × 0.6 mm. Image patches enclosing nodules were cropped from the original CT images and used as training samples. T o include rich contextual information around a nodule, the cropped image patch is centered at the nodule, but large enough to cover its surrounding area . In this study , image patches with a size of 128 × 128 × 128 pixels were us ed . Subsequently , conventional data augmentation techniques, such as random cropping and flipping, were applied. The augmented image patches w ere then used fo r model training. Architecture of DeepF AN The neura l architecture of DeepF AN con sist s of thr ee primary modules: a visi on transformer (ViT) module for global nodule feature extraction, a fine - grained module for local feature and attribute feature extraction , and a graph convolutional network ( GCN ) for feature fusion ( Figure 1 ). D etails of the model construction are as fo llows. a) Data preprocessing . The data preprocessin g pipeline involve s resampling CT scans into uniform isotropic voxels ( 0.6 mm × 0.6 mm × 0.6 mm ) , extracting 128 - pixel cubic patches centered at nodules to include contextual information, and applying data au gmentation (such as random cropping and flipping ) before model training. b) ViT module . We further sub divide every 128 × 128 × 128 training sample into eight 64 × 64 × 64 3D patches . Each 3D patch passes through a patch e mbedding block implemented as a stride - 2 convolutional layer followed by a down - sampling layer . Patch embedd ing transform s a 3D patch into a 4096 - dimensional patch token. The V i T module also has a class token — a trainabl e vector prepended to the sequence of patch tokens. Th e cl ass token aggregates global information from all tokens during the learning process, serving as the mo del’s output for classification tasks. Learnable 1D positi onal embeddings are added to every token to enhance positional awareness. Next , one class token and eight patch tokens are fed into twelve transformer blocks, which generate nine corresponding output f eature vectors, including one for the class token and eight for the patch tokens. Then t he class feature vector passe s through a n FC l ayer to predict the probability of malignancy . At the same time, it i s also fed into another FC layer that produce s a 64 - dimensional feature vector ( $ ! " ) . As to the other eight f eature vectors , each of them passe s through a separate FC layer , generating a 64 - dimensional feature vector ( denoted A rev i se d version of this m an uscript has been acc epted by Nat ure Can cer (DOI: 10.1038 /s43018- 026 - 01 147 -w ). 14 as % ! # to % ! $ ) , which captures global characteristics of the input sample . Thus, nine feature vectors are fed into the GCN module as input nodes . Notably , the term "global" in thi s con text carries dual i mplications. First, the self - attention mechanism ingrained within the ViT model inherently computes pairwise attention among the input tokens, thereby capturing comprehensive information f rom the ent ire input. Second, the term also signifies that the input sample is sufficiently expansive to encompass the nodule itself along with its immediate surroundi ngs. c ) Fine - grained m odel. The input has 128 × 128 × 128 pixel s in this module. After passing through three ResNet 53 stages ( each containing 6, 9, 12 blocks), the resulting feature map is denoted as & ' ( %#& × #( × #( × #( , where 51 2 represent s the number of channels and the spatial dimensions of the feature map are 16 × 16 × 16 . Then, we integrate an Attention Dropout Layer (ADL) 54 with counterfactual causal learning (CAL) 55 to further refine feature map & . Specifically , & i s processed with ADL to obtain an attention feature map ) . Meanwhile, randomized attention mechanisms are adopted to generate a counterfactual intervention feature map ) * . Next, feature maps & and ) are fed into a bilinear attention pooling layer (BAP) 56 . The output i s flattened and then passed through three parallel FC layer s, resulting in three 64 - dimensional feature vectors ( % ) " + % ) # , -./ ,% ) & 0 . Feature maps & and ) * are processed similarly to produce another three 64 - dimensional featur e vectors ( % 1 ) " + % 1 ) # , -./ ,% 1 ) & ). Afterwards, feature s % ) " and % 1 ) " are passed t hrough two independent FC layers, and the element - wise difference between the results , is used to predict lobul ation. Features % ) # and % 1 ) # are processed similarly to predict spiculation. Likewise , features % ) & and % 1 ) & are also processed simil arly to classify the nodul e in the input sample into three density categories: ground - glass nodule, solid nodule and part - solid nodul e. Note that lobulation, spi culation and density are three importa nt radiological signs of a lung nodule. T o pass information from the fine - grained module to the GCN , an element - wise su btraction is performed between % ) " and % 1 ) " yielding a feature vector % )" , between % ) # and % 1 ) # yielding a second feat ure vector % )# , and between % ) & and % 1 ) & yielding a third feature vector % )& . % )" , % )# , and % )& respectively represent the lobulation , spiculation and density features of the lung nodule , and serve as th ree additional input node s of the GCN module. d ) GCN m odel. The GCN module lever ages and fuses a comprehensive set of multi - scale featur es. Its core structure follow s the design outlined in the article by Zhao et.al . 26 , which incorporat es three layers of residual graph convolution 57 and dynamically update s the edge weights between node features. The nine feature vectors ( % ! " to % ! $ ) generated by the ViT module and the t hree feature vector s ( % )" , % )# and % )& ) produced by the fine - grained module are placed side by side to form a matrix % *++ ' ( #& × (, . This matrix is then fed into the first layer of the GCN. Here, 12 represents the number of nodes, and 64 indicates the f eature dimension of each node. At the end , w e use an FC layer to obtai n the final probabili ty of malignancy . e ) L oss function . During the training process, we enable deep supervision s within individual module s of our network architecture . Thus, t he final loss function comprise s multi ple terms as follows , 2344 !)- 5 6 " 2 ! " 7 , 6 # 82 ." 7 2 .# 7 2 .& 0 7 6 & 2 *++ 7 , 6 / 2 - where 2 ! " is the loss term for the be nign and malignant binary classification in the V iT module ; 2 ." , 2 .# , 2 .& are the loss term s for predict ing the probabilities of lobulation, spiculation and density in the fine - grained module, respectively ; 2 *++ i s the loss term for the benign and malignant binary classification using the feature matrix % *++ followed by an FC layer ; 2 - i s the loss term for the benign and malignant binary classification in the GCN module. In this study , 6 " was set to 0.2, 6 # to 0.2, 6 & to 0.2 and 6 / to 0.4. All loss term s have a cross - entropy form. f ) Model t raining . All model s w ere trained using the PyT orch 58 deep learning framework. The optimization method use d du ring traini ng was Adaptive Moment Est imation (Adam) . T rai ning was co nducted on f our NVIDIA GeForce RTX 3090 GPU s . During training, we first respectivel y optimized the ViT modul e and the fine - grained module independently until parameters stabilized. Both modules were trained for 1200 epochs wi th initial learning rates of 0.0002 and A rev i se d version of this m an uscript has been acc epted by Nat ure Can cer (DOI: 10.1038 /s43018- 026 - 01 147 -w ). 15 0.01, respectively . The le arning rate was reduced to 10% of its previous rate at the 4 00th and 800th epochs. Next, we opti mize d the GCN module while freezing the parameters of the other two modules. The GCN module was trained for 200 epochs with an initial learning rate of 0.01. and t he learni ng rate was reduced to 10% of its previous rate at the 8 0th and 160t h epochs. Finally , we optimize d the final loss function 2344 !)- by fine - tuning all the parameters of the ViT , f ine - grained, and GCN modules. This phase involved training for 1 400 epochs with an initi al learning r ate of 0.000 01 . The learning rate was reduced to 10% of its previous rate at the 300th, 600th, and 900th epochs. Model parameters were saved every 30 epochs, and t hen all saved checkpoints were tested on the validation set. The model with the highest AUC on the validation set was selected and tested on the testing set. Statistic s and reproducibility The sample size wa s determined with t he superiori ty test of AUR OC via the multi - reader diagnostic test research software developed by Kevin M. Schartz and Stephen L. Hillis 59 as detai led in sample size estimation in the Supplementary Information . This was a single - blind, multi - reader diagnostic study . Readers were blinded to all clinical, pathological, and outcome information as well as t o the AI model’ s diagnostic performance. Data analysis was performed ind ependently by investig ators who were not involved in image interpretation. The diagnostic performance of the AI model or readers was as sessed using AUC, sensitivity , specificity , accuracy , PPV , NPV , and F1 - score, with 95% C I. The 95% CI was calculated through the nonparametric bootstrap method with 1,000 resampling events. The threshol d for DeepF AN to deter mine malignancy was set to the value t hat opt imize s the model’s perf ormance (F1 - score) over the validation set. This threshold was consistently applied across all test sets (internal test set and NLST t est set) and clinical trial dataset. The ROC curves for readers (with and without DeepF AN assistance) were gene rated according t o the malignancy scores they assigned to the n odules , while sensitivity and specificity were calculated using the binary labels provided by the readers. Interobser ver diagnostic agreement was measured with Cohen's kappa. A l ogistic regression model was used to analyze the relationship between nodule characteristics and AI mali gnancy predictions. The generalized linear mixed model was used to explore factors influencing the accuracy of human - AI collaboration, with readers and cases as random effects and other factors as fixed effects. Appropriate statistical tests were use d to anal yze data, as descri bed in eac h figure and table legend. Normality was evaluated by combining statistical tests with graphical methods, accompanied by an a ssessment of homogeneity of variances as appropriate . U nless otherwise specified , a ll tests were two - sided , and P values less than 0.05 were considered statistically significant. The Bonferroni method was applied to adjust for multiple comparisons. Statistical analyses were performed using R (ver sion 4.4.1) an d Python (version 3. 6 .1 3 ). Data preprocessing and model development were conducted using the PyT orch (version 1.10 .0 ) deep learning framework . No rea der - evaluation data were excluded from any analy sis . During the MRMC clinical trial, a ll readers were randomly selected fr om the pool of el igible radiologists and were subsequently randomized in an even manner to e ither the cont rol or test group. Please refer to t he “ C linical t rial d esign ” section for more details. Data availability Proprietary training a nd clinical trial data sets are unavail able due to ethical and research restricti ons. The NLST dataset (Radiology CT Images and Clinical data including data dictionaries) is available at https://www .cancerimagingarchive.net/collection/nlst/ . Additionally , the Patient IDs of the NLST subset analyzed in this study is available on GitHub at https://github.com/zhjtwx/DeepF AN/blob/main/sample_data/Filtered_NLST_Subset.csv . Other supporting data are available from the corresponding authors (Lan Song, songl@pumch.cn; Y izhou Y u, yizhouy@acm.org) upon request, subject to institutional approval and a 6 - week review . Source data are provided with t his paper . Code availability The code for DeepF AN is available on Github ( https://git hub.com/zhjtwx/DeepF AN ). A rev i se d version of this m an uscript has been acc epted by Nat ure Can cer (DOI: 10.1038 /s43018- 026 - 01 147 -w ). 16 Acknowledgements Z.J. is funded by the Scientific and T echnological Innovation 2030 - New Generation Artificial Intelligenc e Project of the National Key Research and Development Program of China (2020AAA0109503) and the Beijing Municipal Science and T echnology Program (Project N o. Z201 100005620008). L.S. is funded by the National Natural Science Fou ndation of China (82171934 ) and Peki ng Union Medical College Hospital T alent Cultivation Program Category C (UBJ10148). Y. Y. is funded b y Hong Kong Research Gra nts Council thro ugh General Resear ch Fund (Grant 17207722). The a uthors thank the Nat ional Cancer Institute for access to NCI' s data co llected by the National Lung Screening T rial . The funders had no role in study desi gn, data collection and analysis, decision to publish or preparation of the manuscript . Additionally , w e thank the radiologists, t he investigators and research coordinators involved in the trial. Author Contributions State ment Y. Y. , L . S . , N . H . , Z . J . , a n d Z . Z h o u c o n t r i b u t e d t o s t u d y d e s i g n a n d s u p e r v i s i o n . Z . Z h u , G . H . , W . T . , K . G , Y. Y. , a n d Z.Zhou contributed to data analysis, model devel opment and writi ng of the manus cript. K.X., X.Q., and Y .T . contributed to data acquisition. L. S., C.S., J .W ., Z.Y ., L.P . and W .S. contributed to d ata analysis and i nterpretation. W. H . a n d M . S . c o n t r i b u t e d t o s t a t i s t i c a l v e r i f i c a t i o n . A l l a u t h o r s c r i t i c a l l y r e v i s e d a n d a p p r o v e d t h e m a n u s c r i p t . Competing Interests Stat ement W. T . , K.G. and Z.Zhou are ful l - time employees of the AI laboratory at Deepwise Healthcare. Z. Zhou participated as a technical consultant, contri buting to the MRMC study design. The DeepF AN system used in this study was developed by Beij ing Deepwise & League of PHD T echnology Co., Ltd. Prior to this publicat ion, DeepF AN had obtained Class III cert ification from the National Medical Products Adm inistration (NMP A) of China ( Approval No. 2024321 1932 ) . These authors did not represent a conflict of i nterest with respect to the execution of this study or the interpretation of data presented in this report. All other co - authors declare no competing interests. A rev i se d version of this m an uscript has been acc epted by Nat ure Can cer (DOI: 10.1038 /s43018- 026 - 01 147 -w ). 17 Ta b l e 1 . Baseline characteristics of patients and pulmonary nodules in datasets from three clinical trial centers Va r i a b l e n a m e Clinical tri al center I Clinical tri al center II Clinical tri al center III P value Patient characteris tics To t a l n o . o f p a t i e n t s 166 46 188 Age ( year )* 5 9 ± 10 60 ± 10 5 9 ± 10 0.582 Sex 0.457 Male 78 (47) 26 (5 7) 97 (5 2) Female 88 (53) 20 (43) 91 (48 ) Nodule type 0.003^ Single 139 (84) 46 (100) 167 (89) Multiple # 27 (16) 0 (0) 21 (1 1) Nodule characteristic s To t a l n o . o f n o d u l e s 204 46 213 Nodule diameter (mm) * 1 1.2 ± 5.6 1 5.6 ± 5.6 14.0 ± 5.6 <0.001 Nodule density <0.001 SN 63 (3 1) 26 (5 7) 103 (48) PSN 76 (37) 13 (28) 79 (37) GGN 65 (3 2) 7 (15) 31 (15) Nodule location 0.699 R UL 52 (25) 16 (3 5) 57 (2 7) R ML 18 (9) 1 (2) 17 (8) R LL 57 (2 8) 10 (2 2) 49 (23) L UL 42 (2 1) 11 (2 4) 46 (2 1) L LL 35 (17) 8 (17) 44 (2 1) Spiculation <0.001 No 125 (61) 15 (3 3) 68 (3 2) Ye s 79 (3 9) 31 (67) 145 (68) Lobulation 0.005 No 43 (21) 3 (7) 24 (1 1) Ye s 161 (7 9) 43 (93) 189 (8 9) Pathology 0.269 Benign 98 (48) 27 (59) 97 (46) Malignant 106 (52) 19 (41) 11 6 (54) Unless otherwise i ndicated, number s here are counts or percentages ( in parentheses ). *Data are mean ± standard deviation . # Number of nodules per case ranges from two to seven. ^ P values were obtained usi ng Fisher ’ s exact test, while all other c ategorical variables were compared with chi - square tests . P values for a ge and nodule diameter were anal yzed using Kruskal - Wa l l i s t e s t s . All statist ical tests were two - sided. Abbreviations: SN = solid nodule, PSN = part - solid nodule, GGN = ground - glass nodule, RUL = right upper lobe, RML = ri ght middle lobe, RLL = right lower lobe, LUL = left upper lobe, LLL = left lower lobe. A rev i se d version of this m an uscript has been acc epted by Nat ure Can cer (DOI: 10.1038 /s43018- 026 - 01 147 -w ). 18 Figure Legends Figure 1 . Neural architecture of DeepF AN. DeepF AN integrates three modul es. The f irst module utilizes a ViT to effectively capture glob al f eatures of pulmonary nodules and their surroundings, representing the overall morphology and distribution characteristics of the nodules. The second module emp loys a fine - grained CAL - ADL 3D ResNet, which extracts features representing detailed radiologic characteristics of the nodules. In the last step, a GCN is introduced to learn the relationships between the global features extracted using V iT and the local f eatures extracted using CAL - ADL 3D Res N et, aiming to comprehensively understand the correlation between pathological classification and pulmonary nodule characterization. DeepF AN was developed using a training set of 5,636 patients and the hyperparameters of the DeepF AN architecture were tuned on a validation set of 831 patients. The performance of DeepF AN was evaluated on an independent internal test set of 1,705 patient s , a multicenter clinical trial test set of 400 patients and the NLST dataset of 7,934 patients. Boldface numbers represent numbers of nodules. Abbreviations: ViT = vis i on tr an sf or me r , CA L = c ou nt er f ac tu al at te nt i on le ar ni ng , A DL = at t en ti on dr op ou t l ay e r , 3D = three - dimensional , Res Net = residual network , GCN = graph convolution network, NLST = national lung screening tr ial, BAP = bilinear attention pooling, FC = fully connected, Dim = dimensions, C = channel, : s ubtract . A. ViT Module B. Fine-grain ed Modul e C. GCN M odule Patch Em bedding 0 C 1 2 3 4 5 6 7 8 C C las s Token Patch Toke n n Position E mb eddi ng 𝐻 𝑇 0 𝑳𝒐𝒔𝒔 𝑳 𝑻 𝟎 Training set 5636 patients with 7873 nodules Benign 1718 (2 2%) Malignant 6155 (7 8%) Validation set 831 patients with 1216 nodules Benign 254 (21 %) Malignant 962 (79 %) Internal test set 1705 patients with 2349 nodules Benign 600 (26 %) Malignant 1749 (7 4%) NLST test set 7934 patien ts w i th 17892 nodules Benign 16821 (94%) Malignant 1071 (6 %) Clinical trial test set 400 patients with 463 nodules Benign 222 (48 %) Malignant 241 (52 %) Develo pment and internal test Clinical trial Generalizability test Transformer Block × 12 𝐻 𝑇 1 𝐻 𝑇 2 𝐻 𝑇 3 𝐻 𝑇 4 𝐻 𝑇 5 𝐻 𝑇 6 𝐻 𝑇 7 𝐻 𝑇 8 Attent ion Maps Counte rfactu al Inte rvention C=512, 16 × 16 × 16 C=512, 16 × 16 × 16 C=512, 16 × 16 × 16 Dim = 4096 64 × 64 × 64 Dim = 4096 Dim = 4096 Deep Supervision Dim = 64 Lobulatio n Density Spiculation 𝐻 𝐶 0 𝐻 𝐶 1 ഥ 𝐻 𝐶 0 𝐻 𝐶 2 ഥ 𝐻 𝐶 1 ഥ 𝐻 𝐶 2 128 × 128 × 128 Residual GCN Layer Residual GCN Layer Residual GCN Layer 𝑳𝒐𝒔𝒔 𝑳 𝑮 𝐻 𝑎𝑙𝑙 𝑳𝒐𝒔𝒔 𝑳 𝑎𝑙𝑙 Deep Supervision Output M align ancy Probability Dim = 12 × 64 ADL 𝐻 𝐶0 𝐻 𝐶1 𝐻 𝐶2 Dim = 64 3D ResNet Block ( × 6, × 9, × 12) 𝑳𝒐𝒔𝒔 𝑳 𝑪𝟎 𝑳𝒐𝒔𝒔 𝑳 𝑪𝟏 𝑳𝒐𝒔𝒔 𝑳 𝑪𝟐 Deep Supervision Dim = 64 Dim = 64 𝐻 𝐶 0 ഥ 𝐻 𝐶 0 𝐻 𝐶 2 ഥ 𝐻 𝐶 2 𝐻 𝐶 1 ഥ 𝐻 𝐶 1 𝑨 ഥ 𝑨 𝑭 FC FC FC FC FC FC FC FC FC FC FC FC FC FC FC FC FC FC FC FC FC FC FC FC BAP BAP Dim = 4096 A rev i se d version of this m an uscript has been acc epted by Nat ure Can cer (DOI: 10.1038 /s43018- 026 - 01 147 -w ). 19 Figure 2. Clinical tria l workflow . The study included three retrospective datasets (400 patients with 463 I PNs) from hospital s with national cli nical trial qualifications. T welve readers selected from the same three institutions were randomly assigned to group A and B for paired CT image as sessment. The MRMC procedure consisted of two reading rounds, separated by a 4- week washout perio d. In the firs t phase, group A ser ved as the control group, assessing the benignit y and malignancy of the cases w ithout AI, whil e Gro up B served as the tes t gr oup, using AI (DeepF AN) to assist assessment. In t he second phase, the roles were reversed, with group A acting as the test group and group B as the control group. Based on a gold standard reference library developed collaboratively by thoracic surgeons, p athologists, and radiologists, the diagnostic performance of the AI model, individual readers, and AI - assisted readers were analyzed and comp ared. Abbreviations: AI = artificial i ntelligence, IPN = inci dental pulmonary nodule, CT = computed tomograp hy , MRMC = multireader multicase. AI Results Cont rol Results Test Results + Gold Standard Diagnostic Performance Output Random Grouping 12 Readers Thoracic Surgeon Radiolog ist Patholog ist Gold Standard Patients Patients screenin g Review the patholo gical results Sketch lesions on CT Gold standard library Clinical Trial Center I 166 pa tients w it h 204 IPNs Benign 98 (48% ) Malignant 106 (52 %) Clinical Trial Center III 188 pa tients w it h 213 IPNs Benign 97 (46%) Malignant 116 (54 %) Clinical Trial Center II 46 patients with 46 IPNs Benign 27 (59%) Malignant 19 (41% ) 12 Readers DeepFAN 4-week washout period MRMC Design ROUND ONE v A - Control Malignant / Ben ign + s core Group A vv B - Test Malignant / Ben ign + s core Group B DeepFAN ROUND TWO v B - Control Malignant / Ben ign + s core Group B vv A - Te st Malignant / Ben ign + s core Group A D eepFAN VS. Group B Group A A rev i se d version of this m an uscript has been acc epted by Nat ure Can cer (DOI: 10.1038 /s43018- 026 - 01 147 -w ). 20 Figure 3 . ROC curves of DeepF AN and performanc e of readers with and without DeepF AN assistance. The four subplots represent the diagnostic performance of De epF AN and the 12 readers on both the overall combined dataset from the three clinical trial centers and each center ’s individual dataset, respectively . The ROC curves r epresent the performance of DeepF AN and the red dots on the curves i ndicate the operating point s corresponding to t he binary cutoffs. The point at the base of each arrow represents the performance of each reader without DeepF AN assistance, while the ar row indic ates the chang e in the reader ’s performance with DeepF AN assistance. The values in the legend are AUCs with 95%CI i n parentheses . Abbreviations: ROC = rec eiver operating characte ristic, AUC = area under c urve , CI = confidence interval. A rev i se d version of this m an uscript has been acc epted by Nat ure Can cer (DOI: 10.1038 /s43018- 026 - 01 147 -w ). 21 Figure 4 . Radar maps of the seven - performance metrics (AUC, sensitivity , specificity , accuracy , PPV , NPV , and F1 - score) for DeepF AN and readers with and without DeepF AN assistance. The bl ue regions denote the performance indices of the AI model, the yellow regio ns represent reader performance without AI assista nce, and the red regions illustrate reader per formance aided by DeepF AN. Abbreviations: AUC = are a under c urve , PPV = positive predictive value, NPV = negative predictive value. AI Rea de r Rea de r+AI AUC Sensitivity PPV Accuracy F1−score NPV Specificity 0.0 0.2 0.4 0.6 0.8 1.0 Reader 01 AUC Sensitivity PPV Accuracy F1−score NPV Specificity 0.0 0.2 0.4 0.6 0.8 1.0 Reader 02 AUC Sensitivity PPV Accuracy F1−score NPV Specificity 0.0 0.2 0.4 0.6 0.8 1.0 Reader 03 AUC Sensitivity PPV Accuracy F1−score NPV Specificity 0.0 0.2 0.4 0.6 0.8 1.0 Reader 04 AUC Sensitivity PPV Accuracy F1−score NPV Specificity 0.0 0.2 0.4 0.6 0.8 1.0 Reader 05 AUC Sensitivity PPV Accuracy F1−score NPV Specificity 0.0 0.2 0.4 0.6 0.8 1.0 Reader 06 AUC Sensitivity PPV Accuracy F1−score NPV Specificity 0.0 0.2 0.4 0.6 0.8 1.0 Reader 07 AUC Sensitivity PPV Accuracy F1−score NPV Specificity 0.0 0.2 0.4 0.6 0.8 1.0 Reader 08 AUC Sensitivity PPV Accuracy F1−score NPV Specificity 0.0 0.2 0.4 0.6 0.8 1.0 Reader 09 AUC Sensitivity PPV Accuracy F1−score NPV Specificity 0.0 0.2 0.4 0.6 0.8 1.0 Reader 10 AUC Sensitivity PPV Accuracy F1−score NPV Specificity 0.0 0.2 0.4 0.6 0.8 1.0 Reader 11 AUC Sensitivity PPV Accuracy F1−score NPV Specificity 0.0 0.2 0.4 0.6 0.8 1.0 Reader 12 A rev i se d version of this m an uscript has been acc epted by Nat ure Can cer (DOI: 10.1038 /s43018- 026 - 01 147 -w ). 22 Figure 5. Diagnostic c hange with AI - assisted reading and diagnostic agreement for the twelve readers. (a) The h orizontal axis indicates different read ers (left panel) a nd diagnostic score o f unassisted reading (right panel), while the vert ical axis indicates the mean di f ferences of diagnostic scores calculated by first subtracting diagnostic scores assigned wi thout DeepF AN assistance from those assigned with DeepF AN assistance and then averaging the score differences. The number of actual data points was illustrated in the tables below . (b, c) The numbers shown in the figure represent kappa values. These kappa values are interpreted as follows: <0.2, poor consistency; 0.21 - 0.4, fair consistency; 0.41 - 0.6, moderate consistency; 0.61 - 0.8, substantial consistency; 0.81 - 1.0, almost perfect consistency . Abbreviations: AI = ar tificial intelli gence (DeepF AN). (a) M ea n differen ce in dia gno stic sc or es with a nd wit hou t AI ass istance (b) Cohen’s ka pp a valu es at patient leve l (c) Cohen’s ka pp a valu es at nodu le level 0. 42 0. 24 -0. 09 -0. 43 -0. 80 -0. 92 -1. 23 -1. 60 -2. 12 -1. 94 1. 73 1. 11 1. 22 0. 94 0. 68 0. 29 -0. 02 -0. 14 -0. 39 -1. 05 -2.50 -2.00 -1.50 -1.00 -0.50 0.00 0.50 1.00 1.50 2.00 1 2 3 4 5 6 7 8 9 10 M ean differ en ce Score (wit hou t AI) Be ni gn M ali g nan t 22 2 19 4 20 1 35 1 40 1 46 4 47 9 31 5 17 3 68 71 71 15 9 22 4 36 4 61 2 59 4 40 8 22 5 Benign Ma li gnan t Benign Ma li gnan t 24 1 22 2 24 1 22 2 24 1 22 2 24 1 22 2 24 1 22 2 24 1 24 1 22 2 24 1 22 2 24 1 22 2 24 1 22 2 24 1 22 2 -0. 20 -1. 37 -0. 50 -1. 03 -0. 16 -0. 85 -0. 53 -0. 22 -0. 88 -0. 84 -0. 50 -0. 67 0. 41 0. 46 -0. 02 -0. 51 0. 82 -0. 08 1. 05 0. 02 -0. 34 0. 81 0. 22 0. 10 -1.50 -1.00 -0.50 0.00 0.50 1.00 1.50 01 02 03 04 05 06 07 08 09 10 11 12 e c n e r e f f i d n a e M Rea de r Be ni gn M ali g nan t 0.26 0.03 0.15 0.14 0.09 0.17 0.09 −0.02 0.19 −0.03 0.08 0.18 0.20 0.32 0.27 0.24 0.30 0.26 0.45 0.26 0.20 0.14 0.18 0.10 0.09 0.10 0.17 0.11 −0.03 0.03 0.19 0.18 0.18 0.20 0.21 0.20 0.19 0.07 −0.21 0.23 0.04 0.12 0.08 0.04 0.18 0.08 0.06 −0.07 −0.02 0.03 0.15 0.14 0.17 0.27 0.07 0.09 0.14 0.07 0.16 0.07 0.07 0.11 0.06 0.11 0.19 0.04 01 02 03 04 05 06 07 08 09 10 11 12 01 02 03 04 05 06 07 08 09 10 11 12 Reader Reader Kappa 0.00 0.05 0.10 0.15 0.20 0.25 0.30 0.35 0.40 0.45 0.50 0.55 0.60 0.65 0.70 0.75 Difference 0.73 0.58 0.60 0.49 0.34 0.68 0.37 0.46 0.41 0.52 0.63 0.58 0.65 0.55 0.32 0.75 0.46 0.51 0.40 0.59 0.57 0.62 0.61 0.40 0.66 0.44 0.59 0.30 0.56 0.42 0.51 0.38 0.64 0.50 0.52 0.38 0.66 0.44 0.37 0.60 0.42 0.56 0.28 0.60 0.33 0.34 0.41 0.36 0.24 0.45 0.20 0.40 0.55 0.31 0.59 0.48 0.39 0.35 0.57 0.25 0.33 0.55 0.34 0.36 0.32 0.40 01 02 03 04 05 06 07 08 09 10 11 12 01 02 03 04 05 06 07 08 09 10 11 12 Reader Reader Kappa 0.00 0.05 0.10 0.15 0.20 0.25 0.30 0.35 0.40 0.45 0.50 0.55 0.60 0.65 0.70 0.75 With AI 0.47 0.55 0.45 0.35 0.25 0.51 0.28 0.47 0.23 0.55 0.54 0.40 0.44 0.23 0.06 0.51 0.16 0.25 −0.05 0.33 0.37 0.49 0.43 0.30 0.57 0.34 0.42 0.19 0.59 0.39 0.32 0.20 0.46 0.30 0.31 0.18 0.47 0.37 0.58 0.36 0.38 0.45 0.20 0.56 0.15 0.26 0.35 0.44 0.26 0.42 0.05 0.26 0.38 0.04 0.52 0.39 0.25 0.28 0.40 0.18 0.26 0.44 0.28 0.25 0.13 0.37 01 02 03 04 05 06 07 08 09 10 11 12 01 02 03 04 05 06 07 08 09 10 11 12 Reader Reader Kappa 0.00 0.05 0.10 0.15 0.20 0.25 0.30 0.35 0.40 0.45 0.50 0.55 0.60 0.65 0.70 0.75 Without AI 0.29 0.07 0.20 0.16 0.13 0.19 0.13 0.04 0.21 0.01 0.07 0.19 0.23 0.34 0.33 0.23 0.35 0.33 0.50 0.30 0.21 0.16 0.21 0.11 0.07 0.10 0.20 0.15 −0.02 0.04 0.23 0.21 0.22 0.21 0.26 0.24 0.22 0.08 −0.20 0.25 0.06 0.10 0.09 0.05 0.19 0.12 0.10 −0.09 0.03 0.08 0.17 0.17 0.21 0.30 0.12 0.11 0.15 0.10 0.18 0.08 0.06 0.13 0.10 0.13 0.20 0.04 01 02 03 04 05 06 07 08 09 10 11 12 01 02 03 04 05 06 07 08 09 10 11 12 Reader Reader Kappa 0.00 0.05 0.10 0.15 0.20 0.25 0.30 0.35 0.40 0.45 0.50 0.55 0.60 0.65 0.70 0.75 Difference 0.72 0.61 0.62 0.49 0.36 0.69 0.40 0.45 0.42 0.56 0.63 0.60 0.69 0.56 0.34 0.74 0.51 0.50 0.41 0.63 0.58 0.60 0.59 0.36 0.67 0.42 0.56 0.28 0.55 0.46 0.49 0.34 0.66 0.49 0.50 0.36 0.65 0.48 0.35 0.60 0.40 0.52 0.23 0.56 0.35 0.33 0.41 0.34 0.24 0.44 0.21 0.41 0.52 0.29 0.62 0.51 0.38 0.35 0.55 0.28 0.28 0.52 0.35 0.33 0.34 0.45 01 02 03 04 05 06 07 08 09 10 11 12 01 02 03 04 05 06 07 08 09 10 11 12 Reader Reader Kappa 0.00 0.05 0.10 0.15 0.20 0.25 0.30 0.35 0.40 0.45 0.50 0.55 0.60 0.65 0.70 0.75 With AI 0.43 0.54 0.42 0.33 0.23 0.50 0.27 0.41 0.21 0.55 0.56 0.41 0.45 0.21 0.00 0.51 0.16 0.17 −0.09 0.33 0.37 0.45 0.38 0.25 0.60 0.31 0.36 0.13 0.57 0.42 0.26 0.13 0.44 0.28 0.24 0.12 0.43 0.41 0.55 0.35 0.34 0.42 0.14 0.51 0.15 0.21 0.31 0.42 0.21 0.36 0.04 0.24 0.31 −0.00 0.50 0.39 0.23 0.26 0.36 0.20 0.22 0.39 0.25 0.20 0.14 0.41 01 02 03 04 05 06 07 08 09 10 11 12 01 02 03 04 05 06 07 08 09 10 11 12 Reader Reader Kappa 0.00 0.05 0.10 0.15 0.20 0.25 0.30 0.35 0.40 0.45 0.50 0.55 0.60 0.65 0.70 0.75 Without AI A rev i se d version of this m an uscript has been acc epted by Nat ure Can cer (DOI: 10.1038 /s43018- 026 - 01 147 -w ). 23 Figure 6 . Visua lization of the mechanism of Deep F AN in differentiating malignant pulmonary nodules from benign ones in clinical trials. (a) A benign nodule (hamartoma) correctly classified by DeepF AN, with a smooth margin and fat density . (b) A (a) A benign nodu le correctly classified by DeepFAN Malignant / be nign ViT (glob al feature) Global Lobulati on Spiculation Density Chest CT Nodule Heatmap High Low DeepF AN Lobulati on Spiculation Density CAL-A DL 3D ResNet (local feature) (b) A m align ant nodule correctly classified by DeepF AN Malignant / be nign ViT (glob al feature) Global Lobulati on Spiculation Density Chest CT Nodule Heatmap High Low DeepF AN Lobulati on Spiculation Density CAL-A DL 3D ResNet (loca l feature) (c) A benign nodu le misclassified by DeepFAN Malignant / be nign ViT (glob al feature) Global Lobulati on Spiculation Density Chest CT Nodule Heatmap High Low DeepF AN Lobulati on Spiculation Density CAL-A DL 3D ResNet (loca l feature) (d) A m align ant nodule misclassified by DeepFAN Malignant / be nign ViT (glob al feature) Global Lobulati on Spiculation Density Lobulati on Spiculation Density CAL-A DL 3D ResNet (loca l feature) Chest CT Nodule Heatmap High Low DeepF AN GCN (feature fusion) Feature weights GCN (feature fusion) Feature weights GCN (feature fusion) Feature weights GCN (feature fusion) Feature weights A rev i se d version of this m an uscript has been acc epted by Nat ure Can cer (DOI: 10.1038 /s43018- 026 - 01 147 -w ). 24 malignant nodule (invasi ve adenocarc inoma) corre ctly classi fied by DeepF AN, characteri zed by i rregular s hape, heterogeneous density , lobulation, and spi culation. (c) A benign nodule (epithel ial hyperplasia) misclassified by DeepF AN, sho wing dispersed morphology , heterogeneous ground - glass density , and adjacent vascul ar branches. (d) A malignant nodule (invasive adenocarcinoma) misclassified by DeepF AN, with irregular shape, lobulation, spiculation, and solid density , making it difficult to di ffer en ti at e fr o m gra nulomatous infl ammation. In each subplot, the top row shows the original chest CT , magnified nodule images, and corresponding class activation maps generated by overlaying colored attention maps on the original image. Darker red regions signify heightened at tention from DeepF AN, while darker blue regions denote reduced attention. The dashed box below shows heat maps of each module in DeepF AN. ViT captures global features of the nodules and their surroundings, CAL - ADL 3D ResNet extracts represent ative loca l features (lobulation, spic ulation, and densi ty), and GCN i s used for feature fusion. Different features (nodes) have different contributions (weights) to the final prediction result, which is calcul ated usi ng the gradient, the feature value and edge weights from the first input lay er of the GCN model. Subseque ntly , averaging and normali zation are performed , yield ing 12 val ues for 12 nod es. Notab ly , t he global weight is determined by summing the feature weights of the 9 nodes associated with the V iT , which is the largest compar ed to the other nodes. Abbreviations: ViT = vis i on tr an sf or me r , CA L = c ou nt er f ac tu al at te nt i on le ar ni ng , A DL = at t en ti on dr op ou t l ay e r , 3D = three - dimensional , ResNet = residual network , GCN = graph convolution network. A rev i se d version of this m an uscript has been acc epted by Nat ure Can cer (DOI: 10.1038 /s43018- 026 - 01 147 -w ). 25 Figure 7 . Web - based AI platform for assi sting the diagnosis of pulmonary nodule s. When patients complet e a CT examinat ion un der th e arra ngement of cl inicians, their infor mation, including chest CT i mages will be aut omatically uploaded to the P ACS. Radiologists can upload corres ponding CT images from PA C S t o t h e w e b - based AI platform. Ba sed on the DeepF AN model, the platform will provi de diagnostic advice to radiologists, including the benign and malignant classification of pulmonary nodules and the characteristics of nodules such as lobulation and spiculation. Finally , radi ologists make the conclusion about the nature of pulmonary nodules after referring to this infor mation and provide the reports to patients and clinicians. Abbreviations: AI = artif icial intelligence , CT = computed tomography , P ACS = picture archiving and communication system. Reports Radiologists Benign Malignant Data Advice PACS Images W eb-based Diagnostic Platform Score Clinicians A rev i se d version of this m an uscript has been acc epted by Nat ure Can cer (DOI: 10.1038 /s43018- 026 - 01 147 -w ). 26 References 1. Bray , F . , et al. Global cancer statistics 2022: GLOBOCAN estimates of incidence and mortality worldwide for 36 cancers in 185 countries. CA Cancer J Clin 74 , 229 - 263 (2024). 2. Han, B. , et al. Cancer inciden ce and mortality in China, 2022. Journal of the National Cancer Center 4 , 47 - 53 (2024). 3. Liu, C. , et al. Population - level economic burden of lung canc er in China : Provisiona l prevalence - based estimations, 2017 - 2030. Chin J Cancer Res 33 , 79 - 92 (2021). 4. Zeng, H. , et al. Dispar ities in st age a t d iagnosis for f ive common cancers in China: a multicentre , h ospital - based, observational study . Lancet Public Health 6 , e877 - e887 (2021). 5. Slatore, C.G. & Wi ener , R.S. Pul monary Nodul es: A Small Probl em for Many , Severe Dist ress fo r Some, and How to Communicate About It. Chest 153 , 1004 - 1015 (2018). 6. Gould, M. , et al. Recent T rends in t he Identif ication o f Incident al Pulmonary Nodul es. Am J Respir Crit Care Med 192 , 1208 - 1214 (2015). 7. Li, N. , et al. One - off low - dose CT for lung cancer screening in China: a multicentre, population - based, prospective cohort study . Lancet Respir Med 10 , 378 - 391 (2022). 8. Edelman Saul , E. , et al. The chall enges of i mplementing low - dose computed tomography for lung cancer screening in low - and middle - income countrie s. Nat Cancer 1 , 1 140 - 11 5 2 ( 2 0 2 0 ) . 9. Alexander , R. , et al. Mandati ng Limits on Workload , Duty , and Speed in Radiolo gy . Radiology 304 , 274 - 282 (2022). 10. Mazzone, P .J. & Lam, L. Evaluati ng the Patien t With a Pulmo nary No dule: A Review . JAMA 327 , 264 - 273 (2022). 11 . van Riel, S.J. , et al. Observer V ariabi lity fo r Classi fication of Pulmo nary Nodul es on Low - Dose CT Images and Its Effe ct on Nodule Manag ement. Radiology 277 , 863 - 871 (2015). 12. Nair , A. , et al. Va r i a b l e r a d i o l o g i c a l l u n g n o d u l e e v a l u a t i o n l e a d s t o d i v e r g e n t m a n a g e m e n t r e c o m m e n d a t i o n s . Eur Respir J 52 (2018). 13. Yu a n , J . , X u , F . , R e n , H . , C h e n , M . & F e n g , S . D i s t r e s s a n d i t s i n f l u e n c i n g f a c t o r s a m o n g C h i n e s e p a t i e n t s w i t h incidental pu lmonary nod ules: a cross - sectional study . Sci Rep 14 , 1 189 (2024). 14. Cui, X. , et al. Compari son of V eter ans Af fai rs, Mayo, Brock cl assification models and radiolog ist diagnosis for classifying the malignancy of pulmonary nodules in Chinese clinical population. Tr a n s l L u n g C a n c e r R e s 8 , 605 - 613 (2019). 15. Va c h a n i , A . , et al. The Probability of Lung Cance r in Pat ients With Incidentall y Detect ed Pulmonary Nodules: Clinical Cha racteristics and Accuracy of Pre diction Models. Chest 161 , 562 - 571 (2022). 16. Lv , W . , et al. Deve lopment and vali dation of a c linically appl icable deep l earning strategy (HONORS) for pulmonary nodule classificati on at CT : A retrospective multicentr e study . Lung Cancer 155 , 78 - 86 (2021). 17. Ve n k a d e s h , K . V . , et al. Deep Learning fo r Malignancy Risk Esti mation of Pulmonary Nodul es Detected at Low - Dose Screening CT . Radiology 300 , 438 - 447 (2021). 18. Massion, P .P . , et al. Asse ssing the Accur acy of a Deep Learning Method to Risk Stratify Indeterminat e Pulmonary Nodules. Am J Respir Crit Car e Med 202 , 241 - 249 (2020). 19. Zhang, R. , et al. Deep learni ng for malignancy risk estimat ion of incidental sub - centimeter pulmonary nodules on CT images. Eur Radiol 34 , 4218 - 4229 (2024). 20. Schreuder , A., Scholten, E.T ., van Ginneken, B. & Jacobs, C. Artifici al intelligence for detection and characterization of pulmonary nodules in lung cancer CT screening: ready for practi ce? Tr a n s l L u n g C a n c e r Res 10 , 2378 - 2388 (2021). 21. Ardila, D. , et al. End - to - end lung cancer screeni ng with three - dimensional deep learni ng on low - dose chest computed tomography . Nat Med 25 , 954 - 961 (2019). 22. Wa n g , C . , et al. Dat a - driven risk stratifi cation and precision management of pulmonary nodules detected on chest computed tomography . Nat Med (2024). A rev i se d version of this m an uscript has been acc epted by Nat ure Can cer (DOI: 10.1038 /s43018- 026 - 01 147 -w ). 27 23. Li, D. , et al. The Perf ormance of Deep Learning Al gorithms on Automat ic Pulmonary Nodu le Detection and Classificat ion T ested on Different Datasets That Ar e Not Derived from LIDC - IDRI: A S ystematic Review . Diagnostics ( Basel) 9 (2019). 24. Chang, T .G., Park, S., Schaffer , A.A., Jiang, P . & Ruppin, E. Hallmarks of artificial intelligence contributi ons to precision oncology . Nat Cancer (2025). 25. Dosovitskiy , A. , et al. An Image is Worth 16x16 W ords: Transformers for Image Recogniti on at Scale. arXiv:2010.1 1929 [cs.CV] (2021). 26. Zhao, G., Feng, Q., Chen, C., Zhou, Z. & Y u, Y . Diagnose Like a Radiologist: Hybri d Neuro - Probabil istic Reasoning for Attr ibute - Based Medical Image Diagn osis. IEEE T rans Pattern Anal Mach Intell 44 , 7400 - 7416 (2022). 27. Obuchowski, N.A. & Bullen, J. Multir eader Diagno stic Accura cy Imaging Studies: Fundamentals of Design and Analysis. Radi ology 303 , 26 - 34 (2022). 28. Brady , A.P . , et al. Developing, Purchasing, Implement ing and Monitor ing AI T ools in Radiology: Practical Considerations . A Multi - Society Statement from the ACR, CAR, ESR, RANZCR and RSNA. Radiol Artif Intell 6 , e230513 (2024). 29. Seah, J.C.Y . , et al. Effect of a comprehensiv e deep - learnin g model on the accuracy of ch est x - ray interpretation by radiologists: a ret rospective, multireader multicase study . Lancet Digit Health 3 , e496 - e506 (2021). 30. Kim, R.Y . , et al. Artificial Intel ligence T ool for Assessment of Indet erminate Pulmonary Nodules Det ected wi th CT . Radiology 304 , 683 - 691 (2022). 31. Lee, J.H., Hong, H. , Nam, G., Hwang, E.J. & Park, C.M. Effect of Human - AI Inter action on Detecti on of Malignant Lung Nodules on Chest Radiographs. Radio logy 307 , e222976 (2023 ). 32. Yu , F . , et al. Heterogeneity and predictor s of the effects of AI assistance on radiologists. Nat Med 30 , 837 - 849 (2024). 33. Gaube, S. , et al. Do as AI say: susceptibili ty in deployment o f c linical decision - aids. NPJ Digit Med 4 , 31 (2021). 34. Choe, J ., Lee, S. & Shim, H. Attention - Based Dropout Layer for Weakly Supervised Sin gle Object Localization and Semantic Segmentation. IEEE T rans Pattern Anal Mach Intell 43 , 4256 - 4271 (2021). 35. Rao, Y ., Chen, G., Lu, J. & Zhou, J. Counte rfactual Attention Learning for Fine - Grai ned V isual Catego rization and Re - identification . arXiv:2108.0 8728 [cs.CV ] (2021). 36. Ta m m e m a g i , M . C . , et al. Select ion criteria f or lung - cancer screening. N Engl J Med 368 , 728 - 736 (2013). 37. Swensen, S., Sil verstein, M., Ilst rup, D., Schleck, C. & Edell, E. The probabi lity of malignancy in solitary pulmonary nodul es. Application to small radiologi cally indeterminat e nodules. Arch Int ern Med. , 157(158):849 - 155. (1997). 38. Selvaraju, R.R. , et al. Gra d - CAM: Visual Explanat ions from Deep Networks via Gr adient - Based L ocalization. Int J Comput V is 128 , 336 - 359 (2020). 39. Wa n g , T . W. , et al. Standalone deep learni ng versus experts for diagnosis lung cancer on ch est computed tomography: a sys tematic review . Eur Radi ol (2024). 40. Pan, Z. , et al. Predicting Invasiveness of Lun g Adeno carcinoma at Chest CT with Deep Learning T ernary Classificat ion Models. Radiol ogy 31 1 , e232057 (2024). 41. Wul a ni ng s ih , W . , et al. Dee p Learning Models for Predicting Malignanc y Risk in CT - Detected Pulmonary Nodules: A Sys tematic Review and Meta - analysis. Lung (2024). 42. Ridge, C.A. , et al. Di fferentiating between Subsolid and Solid Pulmonar y Nodules at CT : Inter - and Intraobserver Agreement between Ex perienced Thoracic Radiologists. Radiology 278 , 888 - 896 (2016). 43. Wiener , R. S. , et al. Resource use and guidel ine concordance i n eva luation of pul monary nodules for cancer: too much and too little c are. JAMA Intern Med 174 , 871 - 880 (2014). 44. Rosenkrantz, A.B., Xue, X., Gyftopoulos , S., Kim, D.C. & Nic ola, G.N. Downstream Costs Associ ated with Incidental Pulmonary Nodules Detected o n CT . Acad Radiol 26 , 798 - 802 (2019). A rev i se d version of this m an uscript has been acc epted by Nat ure Can cer (DOI: 10.1038 /s43018- 026 - 01 147 -w ). 28 45. Gierada, D.S., Rydz ak, C.E., Zei, M. & Rhea, L . Improved Interobserv er Ag reement on L ung - RADS Classificat ion of Solid Nodul es Using Semiautomated CT V olumetry . Radi ology 297 , 675 - 684 (2020). 46. Shu, J. , et al. Improved interobserver agreement on nodule type and Lung - RADS cl assification of subsolid nodules using computer - aided solid component measurement. Eur J Radiol 152 , 1 10339 (2022). 47. Office of the Leading Group for the Seventh National Popula tion Census of the State Council. Major Figures on 2020 Population Census of China. https://www .stats.gov .cn/sj/pcsj/rkpc/d7c/202303/P020230301403217959330.pdf (in Chinese ) (China Statistics Press, 2021). 48. Wa n g , Z . , Y a n g , G . & G u o , Y . H a r n e s s i n g t h e o p p o r t u n i t y t o a c h i e v e h e a l t h e q u i t y i n C h i n a . The Lancet Public Health 6 , e867 - e868 (2021). 49. Alcaraz, K.I. , et al. Understandi ng and addr essing social determinants to advance c ancer health equity in the United States: A b lueprint for prac tice, research, and policy . CA Cancer J Clin 70 , 31 - 46 (2020). 50. Jabbour , S. , et al. Measuring the Impac t of AI in the Di agnosis of Hospital ized Pati ents: A Randomized Clinical Vig ne t te S ur ve y St ud y . JAMA 330 , 2275 - 2284 (2023). 51. Prinster , D. , et al. Care to Expl ain? AI Explan ation T yp es Differentiall y Impact Chest Radiograph Diagnosti c Performance and Phy sician T rust in AI . Radiology 313 , e233261 (2024). 52. Lang, K. , et al. Artifi cial i ntelligence - supported screen reading versus standard double reading in t he Mammography Screeni ng with Arti ficial Intelli gence tr ial (MASAI ): a clinic al safet y analysi s of a r andomised, controlled, non - inferiority , single - blinded, screening accuracy study . Lancet Oncol 24 , 936 - 944 (2023). 53. He, K., Zhang, X. , Ren, S. & Sun, J. Deep Residual Learning f or Image Rec ognition. IEEE Conference on Computer Vision and Patter n Recognition (CVPR) , Las V egas, NV , USA, 2016, pp. 2770 - 2778 (2016). 54. Choe, J . & Sh im, H. Attenti on - Based Dropout Layer for Weakly Supervised Object Localization. 2019 I EEE/CVF Conference on Computer Vision and Pattern Rec ognition (CVPR) , Long Beach, CA, USA, 2019, pp. 2214 - 2223. 55. Rao, Y ., Chen, G., Lu, J. & Zhou, J. Counterfa ctual Attention Lear ning for Fine - Grained Visual Ca tegorization and Re - identification. IEEE/CV F Internationa l Conference on Computer V ision (ICCV) , Montreal, QC, Canada, 2021, pp. 1005 - 1014 (2021). 56. Hu, T ., Qi, H., Huang, Q. & Lu, Y . See Better Before L ooking Closer: Weakly Supervised Da ta Augmentation Network for Fi ne - Grained Visual Clas sification. arXiv:1901.09 891 [cs.CV] ( 2019). 57. Li, G., Müller , M., Thabet, A. & Ghanem, B. DeepGCNs: Can GCNs Go as Deep as CNNs? , [cs.CV] (2019). 58. Paszke, A. , et al. PyT orch: An Imperat ive St yle, Hi gh - Performance Deep Learnin g Libra ry . arXiv:1912. 01703 [cs.LG] (2019). 59. Hillis, S.L. & Schartz, K.M. Multireader sample s ize program f or diagnosti c studies: demonstration and methodology . J Med Imaging (Bel lingham) 5 , 0455 03 (2018). A rev i se d version of this m an uscript has been acc epted by Nat ure Can cer (DOI: 10.1038 /s43018- 026 - 01 147 -w ). 1 Supplementary Information (DeepF AN Clinical T rial Study ) Contents Supplementary Table 1 . Baseline charact eristics of patients an d pulmonary nodules in training, validation, internal test and NLST test set s ..................................................................................................................................................... 3 Supplementary Table 2. Parameters of CT image series in training, validation, internal test and NLST test set s ................................................................................................................................................................................................................. 4 Supplementary Table 3. Diagnostic performance of DeepFAN on the internal test set, clinical trial and NLST test sets ................................................................................................................................................................................................ . 5 Supplementary Table 4. Diagnostic performance of DeepFAN in ablation experiments on the internal test set ................................................................................................................................................................................................................. 6 Supplementary Table 5. P erformance comparison between DeepFAN and models re ported in previous studies on pulmonary nodule diagnosis .................................................................................................................................... 7 Supplementary Table 6. Baseline characteristics of benign and malignant patients and nodules in datasets from three clinical t rial centers ...................................................................................................................................................... 9 Supplementary Table 7. Characteristics of chest CT images in datasets from three clinical trial centers .......... 10 Supplementary Table 8. Baseline characteristics of twelve readers ............................................................................... 11 Supplementary Table 9. Comparison of diagnostic performance of the twelve readers in the clinical trial ..... 12 Supplementary Table 10. Stratified analysis of diagnostic performance among DeepFAN, unassisted readers, and AI - assisted readers ................................................................ ................................................................................................ 14 Supplementary Table 11. Diagnostic performance improvement across stratified subgroups: unassisted vs. AI - assisted readers. ........................................................................................................................................................................ 17 Supplementary Table 12. Logistic regression analysis of nodule features and AI pred icted malignancy in the clinical trial ........................................................................................................................................................................................ 19 Supplementary Table 13. Univariable and multivariable generalized linear mixed analyses for factors influencing the accuracy of AI - assisted reading ................................................................................................................... 20 Supplementary Table 14. Reader’s personal characteristics, experience with medical imaging AI, attitude of trust toward AI and Grit score .................................................................................................................................................... 22 Reader Questionnaire .................................................................................................................................................................... 23 Extended Data Figure 1 ................................................................................................................................................................ 29 Extended Data Figure 2 ................................................................................................................................................................ 30 Extended Data Figure 3 ................................................................................................................................................................ 31 Extended Data Figure 4 ................................................................................................................................................................ 32 Extended Data Figure 5 ................................................................................................................................................................ 33 A rev i se d version of this m an uscript has been acc epted by Nat ure Can cer (DOI: 10.1038 /s43018- 026 - 01 147 -w ). 2 Extended Data Figure 6 ................................................................................................................................................................ 34 Extended Data Figure 7 ................................................................................................................................................................ 35 Extended Data Figure 8 ................................................................................................................................................................ 36 Extended Data Figure 9 ................................................................................................................................................................ 37 A rev i se d version of this m an uscript has been acc epted by Nat ure Can cer (DOI: 10.1038 /s43018- 026 - 01 147 -w ). 3 Supplementary T able 1 . Baseline characteristics of patients and pulmonary nodules in training, validation , internal t est and NLST test set s Va r i a b l e name Tr a i n i n g s e t Va l i d a t i o n s e t Internal test set NLST test set Patient characteris tics To t a l N o. of patient s 5636 831 1705 7934 Age ( year )* 5 7 ± 11 5 7 ± 12 5 7 ± 11 62 ± 5 Sex Male 2314 (4 1. 06 ) 333 ( 40.07 ) 681 (39. 94 ) 4756 (59.94) Female 3319 (5 8.89 ) 498 ( 59.93 ) 1023 (60. 00 ) 3178 (40.06) Unknown 3 (0.0 5) 0 (0.00) 1 (0.0 6) 0 (0.00) Nodule type Single 5041 (89. 44 ) 744 ( 89.53 ) 1 526 (89. 50 ) 6446 (81.25) Multiple # 595 (10. 56 ) 87 ( 10.47 ) 179 (10. 50 ) 1488 (18.75) Nodule characteristic s To t a l n o . o f n o d u l e s 7873 1216 2349 17892 Nodule diameter (mm) * 13.78 ± 6.75 13.55 ± 6.60 13.72 ± 6.70 6.58 ± 3.98 Nodule density SN 29 4 2 (37.37 ) 4 43 (36. 43 ) 937 (39.89) 13256 (74.09) PSN 2554 (32.44) 358 (29.44) 712 (30.31) 684 (3.82) GGN 2377 (30.19) 415 (34.13) 700 (29.80) 3952 (22.09) Nodule location R UL 2805 (35.63) 408 (33.55) 810 (34.48) 4542 (25.39) R ML 431 (5.47) 74 (6.09) 122 (5.19) 1787 (9.99) R LL 1467 (18.63) 212 (17.43) 417 (17.75) 3688 (20.61) L UL 1957 (24.86) 328 (26.97) 589 (25.07) 3971 (22.19) L LL 11 7 3 ( 1 4 . 9 0 ) 187 (15.38) 397 (16.90) 3587 (20.05) Peri - fissure 40 (0.51) 7 (0.58) 14 (0.60) 317 (1.77) Pathology Benign 1718 (21.82) 254 (20.89) 600 ( 25.54 ) 16821 (94.01) Malignant 6155 (78.18) 962 (79.1 1) 1749 ( 74.46 ) 1071 (5.99) Unless otherwise i ndicated, number s here are counts or percentage s ( in parentheses ). * Data are mean ± standard deviation . # Number of nodules pe r case ranges from two to e leven. A bbreviation s: NLST = national lung screening t rial , SN = solid nodule, PSN = part - solid nodule, GGN = ground - glass nodule , R UL = r ight upper lobe , RML = r ight middle lobe , RLL = r ight lower lobe , LUL = l eft upper lobe , LLL = l eft lower lobe . A rev i se d version of this m an uscript has been acc epted by Nat ure Can cer (DOI: 10.1038 /s43018- 026 - 01 147 -w ). 4 Supplementary T able 2 . P arameters of CT image series in training, validation , internal t est and NLST test set s Parameter Tr a i n i n g s e t Va l i d a t i o n s e t Internal test set NLST test set T otal no. of image series* 6931 1053 2073 16016 CT manufacture Canon 38 (0.55) 4 (0.38) 1 (0.05) 0 (0.00) GE 1029 (14.85) 137 (13.01) 262 (12.64) 2161 (13.49) NMS 1 (0.01) 1 (0.09) 0 (0 .00 ) 0 (0.00) Philips 1980 (28.57) 280 (26.59) 591 (28.51) 474 (2.96) SIEMENS 3379 (48.75) 544 (51.66) 1030 (49.69) 11 7 2 4 ( 7 3 . 2 0 ) SinoVision 101 (1.46) 16 (1.52) 26 (1.25) 0 (0.00) TOS HI BA 244 (3.52) 34 (3.23) 88 (4.25) 1657 (10.35) UIH 154 (2.22) 37 (3.51) 70 (3.38) 0 (0.00) Unknown 5 (0.07) 0 (0 .00 ) 5 (0.24) 0 (0.00) Slice thickness (mm) ≥0. 5 to < 1 11 6 4 ( 1 6 . 7 9 ) 154 (14.62) 298 (14.38) 12 (0.07) 1 5222 (75.34) 816 (77.49) 1630 (78.63) 369 (2.30) >1 to ≤2 545 (7.86) 83 (7.88) 145 (6.99) 15635 (97.62) Reconstruction ker nel Lung 3590 (51.8 0) 539 (51.19) 1015 (48.96) 712 (4.45) Mediastinum 1310 (18.9 0) 203 (19.28) 429 (20.69) 9136 (57.04) Bone 1835 (26.48) 287 (27.26) 573 (27.64) 5204 (32.49) Other 196 (2.83) 24 (2.28) 56 (2.7 0) 964 (6.02) Image matrix 512 × 512 5250 (75.75) 803 (76.26) 1544 (74.48) 16016 (100.00) 768 × 768 13 (0.19) 2 (0.19) 12 (0.58) 0 (0.00) 1024 × 1024 1668 (24.07) 248 (23.55) 517 (24.94) 0 (0.00) Tu b e v o l t a g e (kVp) 80 0 (0 .00 ) 2 (0.19) 2 (0.1 0) 1 (0.01) 90 15 (0.22) 3 (0.28) 2 (0.1 0) 0 (0.00) 100 146 (2.1 1) 32 (3.04) 67 (3.23) 2 (0.01) 11 0 232 (3.35) 31 (2.94) 65 (3.14) 2 (0.01) 120 5876 (84.78) 877 (83.29) 1751 (84.47) 15598 (97.39) 130 540 (7.79) 85 (8.07) 137 (6.61) 15 (0.09) 140 96 (1.39) 17 (1.61) 40 (1.93) 398 (2.49) 150 21 (0.3 0) 6 (0.57) 4 (0.19) 0 (0.00) Unknown 5 (0.07) 0 (0 .00 ) 5 (0.24) 0 (0.00) N umber s here are counts or percentage s ( in parenthe ses ). * A patient may have multiple image series with differe nt slice thicknesses or reconstruction kernels. A bbreviation s: NLST = national lung screening tria l , Canon = Canon Medical Systems, GE = General Electric Healthcare, NMS = Neusoft Medi cal Systems, Philip s = Philips Healt hcare, Siemens = Si emens Healthineers, SinoVision = SinoVision T echnology , UIH = United Imaging Healthc are. A rev i se d version of this m an uscript has been acc epted by Nat ure Can cer (DOI: 10.1038 /s43018- 026 - 01 147 -w ). 5 Supplementary T able 3 . Diagnostic p erformance of DeepF AN on the internal test set, clinical trial and NLST test sets Dataset AUC Sensitivity Specificity Accuracy PPV NPV F1 - score Internal test set 0.939 (0.93 0, 0.948 ) 0.95 3 (0.94 3, 0.962) 0.73 3 (0. 699 , 0.768 ) 0.89 7 (0.88 4 , 0.90 9) 0.91 2 (0.89 9 , 0.92 6) 0.84 1 (0.813, 0.87 1) 0.93 2 (0.92 3 , 0.940 ) Clinical tri al dataset* 0.954 (0.934, 0.973) 0.950 (0.92 3 , 0.97 8) 0.851 (0.80 5 , 0.898) 0.903 (0.87 6 , 0.930 ) 0.874 (0.834, 0.913) 0.940 (0.905, 0.970) 0.91 1 (0.883, 0.935) C enter I 0.947 (0.915, 0.978) 0.925 (0.874, 0.972) 0.878 (0.813, 0.938) 0.902 (0.863, 0.941) 0.891 (0.833, 0.944) 0.915 (0.856, 0.969) 0.908 (0.860, 0.943) C enter II 0.975 (0.923, 1.000) 1.000 (1.000, 1.000) 0.815 (0.640, 0.957) 0.891 (0.783, 0.978) 0.792 (0.600, 0.955) 1.000 (1.000, 1.000) 0.884 (0.735, 0.962) C enter III 0.963 (0.937, 0.988) 0.966 (0.932, 0.992) 0.835 (0.762, 0.905) 0.906 (0.864, 0.944) 0.875 (0.816, 0.928) 0.953 (0.905, 0.989) 0.918 (0.876, 0.951) NLST test set 0.943 (0.933, 0.953) 0.889 (0.869, 0.908) 0.897 (0.893, 0.902) 0.897(0.892, 0.901) 0.356 (0.338, 0.374) 0.992 (0.991, 0.994) 0.508 (0.489, 0.528) Numbers here are diagnostic performance measures with 95% confidence interval in parentheses . *Clinical trial dataset contains data from all three clinical trial centers. Abbreviation s: AUC = a rea u nder c urve , PPV = positive predictive value, NPV = negative predi ctive value, NLST = national lung screening tr ial . A rev i se d version of this m an uscript has been acc epted by Nat ure Can cer (DOI: 10.1038 /s43018- 026 - 01 147 -w ). 6 Supplementary T able 4 . Diagnostic p erformance of DeepF AN in ablation experiments on the internal test set Model* Ablation experimen ts † Diagnostic perfor mance Global feature Local feature Feature fusion AUC Sensitivity Specificity Accuracy PPV NPV F1 - score Model 1 ViT … … 0.879 (0.866, 0.893) 0.881 (0.866, 0.896) 0.65 0 (0.61 1, 0.687) 0.822 (0.806, 0.837) 0.880 (0.864, 0.896) 0.652 (0.618, 0.690) 0.881 (0.869, 0.892) Model 2 ResNet50 … … 0.86 1 (0.846, 0.875) 0.87 2 (0.856, 0.888) 0.628 (0.591, 0.666) 0.810 (0.792, 0.825) 0.87 2 (0.855, 0.889) 0.627 (0.588, 0.666) 0.87 2 (0.859, 0.884) Model 3 CAL - ADL … … 0.86 3 (0.848, 0.877) 0.86 3 (0.846, 0.878) 0.64 7 (0.609, 0.683) 0.80 8 (0.791, 0.823) 0.87 7 (0.861, 0.892) 0.619 (0.581, 0.656) 0.870 (0.858, 0.882) Model 4 ViT CAL - ADL Concat 0.90 4 (0.892, 0.916) 0.92 3 (0.91 1, 0.935) 0.66 8 (0.631, 0.705) 0.85 8 (0.843, 0.872), 0.890 (0.874, 0.905) 0.748 (0.713, 0.784) 0.90 6 (0.895, 0.916) Model 5 ViT ViT GCN 0.927 (0.917, 0.937) 0.952 (0.942, 0.961) 0.668 (0.631, 0.705) 0.880 (0.865, 0.892) 0.89 3 (0.878, 0.907) 0.827 (0.796, 0.859) 0.922 (0.912, 0.931) Model 6 ViT ResNet50 GCN 0.92 0 (0.909, 0.930) 0.947 (0.937, 0.958) 0.66 8 (0.632, 0.704) 0.87 6 (0.862, 0.889) 0.89 3 (0.877, 0.907) 0.81 3 (0.781, 0.847) 0.91 9 (0.909, 0.928) Model 7 CAL - ADL CAL - ADL GCN 0.91 3 (0.902, 0.924) 0.94 1 (0.930, 0.951) 0.668 (0.631, 0.705) 0.871 (0.857, 0.885) 0.892 (0.877, 0.906) 0.794 (0.762, 0.827) 0.916 (0.905, 0.925) Model 8 ResNet50 CAL - ADL GCN 0.901 (0.889, 0.913) 0.91 3 (0.900, 0.926) 0.66 7 (0.629, 0.703) 0.850 (0.834, 0.863) 0.88 9 (0.872, 0.903) 0.72 3 (0.686, 0.760) 0.900 (0.889, 0.910) Model 9 (DeepF AN) ViT CAL - ADL GCN 0.939 (0.93 0, 0.948 ) 0.95 3 (0.94 3, 0.962) 0.73 3 (0. 699 , 0.768 ) 0.89 7 (0.88 4 , 0.90 9) 0.91 2 (0.89 9 , 0.92 6) 0.84 1 (0.813, 0.87 1) 0.93 2 (0.92 3 , 0.940 ) Numbers here are diagnostic performance measures wit h 95% confidence interval in parentheses . * The cut - of f val ue for all models in ablation experim ents is 0.5 0. † To a s s e s s t h e c o n t r i b u t i o n o f e a c h m o d u l e w i t h i n D e e p F A N to its overall performance, ablation experiments were con ducted on the internal test set using ViT , ResNet50 , and CAL - ADL 3D ResNet as c omponent networks. Th e procedure involved progress ively removing, adapting, a nd substituting key components of DeepF AN to evaluate their individual impact on the system ef ficacy . Abbreviation s: AUC = a rea u nder c urve , PPV = positive pr edictive value, NPV = negative predictive value, Vi T = v is io n t ra ns f or me r , Re sNet = resi dual network, CAL - ADL = three - dimensional residual network based on counterfa ctual attention learning and attention dropout layer , Concat = concatenate , GCN = gra ph convolution n etwork . A rev i se d version of this m an uscript has been acc epted by Nat ure Can cer (DOI: 10.1038 /s43018- 026 - 01 147 -w ). 7 Supplementary T able 5 . P erformance c omparison bet ween DeepF AN and models reported in previ ous studies on pulmonary nodule diagnosis Models or d ataset s AUC Sensitivity Specificity Accuracy PPV NPV F1 - score DeepF AN model (this study) NLST dataset 0.943 (0.933, 0.953) 0.889 (0.869, 0.908) 0.897 (0.893, 0.902) 0.897(0.892, 0.901) 0.356 (0.338, 0.374) 0.992 (0.991, 0.994) 0.508 (0.489, 0.528) NLST dataset (without GG N) † 0.949 (0.939, 0.959) 0.889 (0.871, 0.907) 0.916 (0.91 1, 0.921) 0.914 (0.931, 0.951) 0.474 (0.453, 0.494) 0.990 (0.988, 0.992) 0.618 (0.597, 0.637) LCP - CNN model (Am J Resp ir Crit Care Med , 2020) 8 NLST dataset (without GGN) ‡ 0.921 (0.912, 0.929) 0.956 (0.942, 0.969) 0.629 (0.621, 0.637) 0.648* 0.140* 0.995* 0.244* Mayo model (Ar ch Intern Med, 19 97) 37 NLST dataset (without GG N) † used in this study 0.852 (0.837, 0.866) 0.665 (0.646, 0.683) 0.871 (0.866, 0.877) 0.855 ( 0.842, 0.867) 0.304 ( 0.283, 0.324) 0.968 ( 0.965, 0.970) 0.418 (0.398, 0.437) NLST dataset (without GG N) ‡ used in the LCP - CNN study 0.852 (0.841, 0.862) NA NA NA NA NA NA Brock model (N Engl J Med, 2013) 36 NLST dataset (without GG N) † used in this study 0.856 (0.840, 0.871) 0.865 (0.843, 0.886) 0.646 (0.638, 0.654) 0.661 ( 0.654, 0.669) 0.153 ( 0.143, 0.163) 0.985 ( 0.982, 0.987) 0.260 (0.245, 0.274) NLST dataset (without GG N) ‡ used in the LCP - CNN study 0.856 (0.843, 0.868) 0.865 (0.841, 0.886) 0.665 (0.658, 0.672) NA NA NA NA DL model (Radiology , 2021) 17 NLST dataset || 0.910 (0.900, 0.920) 0.710 (0.700, 0.720) 0.900 (0.890, 0.910) 0.885* 0.374* 0.974* 0.489* DCNN model (Nat Med, 2024) 22 MCC dataset a 0.918 (0.918, 0.919) 0.851 (0.850, 0.853) 0.828 (0.828, 0.829) 0.830* 0.473* 0.967* 0.607* MSC dataset b 0.927 (0.926, 0.928) 0.856 (0.851, 0.861) 0.877 (0.876, 0.877) 0.874* 0.434* 0.981* 0.574* The performance of DeepF AN was compared with previous met hods for pulmonary nodule diagnosis by gathering performance me tric s reported in published papers . It is A rev i se d version of this m an uscript has been acc epted by Nat ure Can cer (DOI: 10.1038 /s43018- 026 - 01 147 -w ). 8 important to note that in this comparison, the NLST datasets used by dif ferent models wer e not identical . T esting a ll considered models on t he same data set was infeasible due to the unavailability of trained models or training data from those studi es. * These performance measures we re not directly available from previous studies but we re derived from other metrics reported in the literature. † To f a c i l i t a t e a m o r e d i r e c t c o m p a r i s o n w i t h t h e L C P - CNN study (Am J Respir Crit Care Med, 2020), the GGNs were exclu ded from the NLST dat aset used in this s tudy , creating a new test set. The new NLST dat aset included 12978 benign nodules and 957 malignant nodules , with nodule sizes ranging from 5 to 30 mm. ‡ Th e NLST dataset used i n the L CP - CNN study (Am J Res pir Cri t Care Med, 2020) incl uded 1476 1 benign nodules (5972 patients) and 9 32 malig nant nodu les (57 5 patients). These nodules did not include GGNs and ranged in size from 5 to 30 mm. || The NLST datas et used in the DL model study (Radi ology , 2021) includ ed 1 4828 benign nodules and 1249 malignant nodul es , with nodule sizes > 4mm. a An internal testing d ataset u sed in the DCNN study (Nat Med, 2024). The dataset was obtained from the medical checkup cohort (MCC) at the health manageme nt center in W est China Hosp ital of Sichuan U niversity and inclu ded 1 142 benign nodules and 209 malignant nodules . b An external testing dat aset i n the DCNN stud y (Nat Med, 2 024). The dataset was obtained from a mobile screening cohort (MSC) across multiple communities in Western China and include d 1812 benign nodules and 139 malignant nod ules . Abbreviation s: AUC = a rea u nder c urve , PPV = positive predictive value, NPV = negat ive pr edictive value, NLST = national lung screening trial , GGN = ground - glass nodule , LCP - CNN = l ung c ancer prediction convolutional neural network , DL = deep learning, DCNN = deep convolutional ne ural network, NA = not available . A rev i se d version of this m an uscript has been acc epted by Nat ure Can cer (DOI: 10.1038 /s43018- 026 - 01 147 -w ). 9 Supplementary T able 6 . B aseline characteristics of benign and malignant patients and nodules in datasets from three clinical trial centers Va r i a b l e name Benign Malignant P value Patient characteris tics To t a l n o . o f p a t i e n t s 197 203 Age ( year )* 58 ± 10 6 1 ± 10 0.005 Sex 0.563 Male 11 2 (5 7) 89 (44) Female 85 (43) 11 4 (56) Nodule type 0.041 Single 176 (89) 176 (87) Multiple # 21 (1 1) 27 (13) Nodule characteristic s To t a l n o . o f n o d u l e s 222 241 Nodule diameter (mm) * 11 . 5 5 ± 5.44 15.19 ± 5.87 <.001 Nodule density <.001 SN 133 (60) 59 (24) PSN 36 (16) 132 (55) GGN 53 (24) 50 (21) Nodule location 0.427 R UL 58 (26) 67 (28) R ML 17 (8) 19 (8) R LL 58 (26) 58 (24) L UL 41 (18) 58 (24) L LL 48 (22) 39 (16) Spiculation <.001 No 139 (63) 69 (29) Ye s 83 (37) 172 (71) Lobulation <.001 No 56 (25) 14 (6) Ye s 166 (75) 227 (94) Unless otherwise i ndicated, number s here are counts or percentage s ( in parentheses ). * Data are mean ± standard deviation . # Number of nodules pe r case ranges from two to s even. A bbreviation s: SN = so lid nodule, PSN = part - solid nodule, GGN = ground - glass nodule , R UL = r ight upper lobe , RML = r ight middle lobe , RLL = r ight lower lobe , LUL = l eft upper lobe , LLL = l eft lower lobe . A rev i se d version of this m an uscript has been acc epted by Nat ure Can cer (DOI: 10.1038 /s43018- 026 - 01 147 -w ). 10 Supplementary T able 7 . Charac teristics of chest CT images in datasets from three clinical trial centers Parameter Clinical tri al center I (n=166) Clinical tri al center II (n=46) Clinical tri al center III (n=188) CT manufacture Siemens 128 (77) 3 (7) 16 (9) GE 37 (22) 12 (26) 168 (89) UIH 0 (0) 31 ( 88 ) 4 (1 2) Others 1 (100) 0 (0) 0 (0) Detectors 2*96 128 (77) 0 (0) 0 (0) 64 0 (0) 19 (41) 47 (25) 80 1 (1) 15 (33) 0 (0) 128 0 (0) 9 (20) 0 (0) 256 37 (22) 3 (7) 137 (73) 16 0 (0) 0 (0) 3 (2) 40 0 (0) 0 (0) 1 (1) Slice thickness (mm) ≥0.625 to < 1 0 (0) 10 (22) 183 (97) 1 129 (78) 33 (72) 2 (1) >1 to ≤ 1.25 37 (22) 3 (7) 3 (2) Reconstruction ker nel Br40d -3 128 (77) 0 (0) 0 (0) ST ANDARD 37 (22) 11 (24) 32 (17) B- SOFT -B 1 (1) 5 (1 1) 3 (2) B- SHARP -C 0 (0) 22 (48) 1 (1) I70f.3 0 (0) 2 (4) 0 (0) LUNG 0 (0) 1 (2) 136 (72) B- SOFT -C 0 (0) 4 (9) 0 (0) 13'f'3 0 (0) 1 (2) 0 (0) B31s 0 (0) 0 (0) 16 (9) N umbers here are counts or percentage s ( in parentheses ) . n in the parentheses refers to the total number of patients at each center . A bbreviation s: Siemens = Siemens Healthi neers, GE = General Electric Healthcare, UIH = United Imaging Healthcare. A rev i se d version of this m an uscript has been acc epted by Nat ure Can cer (DOI: 10.1038 /s43018- 026 - 01 147 -w ). 11 Supplementary T able 8 . Basel ine c haracteristics of twelve reader s Number Gender Age (years old) Center name Internship # (months) Wor k in g e xp er i en ce Education Major Group* Reader 01 Female 31 Clinical tri al center I 12 2 years MD Medical ima ging B Reader 02 Female 29 Clinical tri al center I 12 1 year MD Medical ima ging B Reader 03 Female 29 Clinical tri al center I 6 1 year MD Medical ima ging A Reader 04 Female 31 Clinical tri al center II 18 5 years MM Medical ima ging A Reader 05 Male 28 Clinical tri al center II 24 2 years BM Medical ima ging A Reader 06 Male 30 Clinical tri al center II 12 3 years MM Medical ima ging B Reader 07 Male 31 Clinical tri al center II 12 4 years MM Medical ima ging B Reader 08 Female 31 Clinical tri al center III 26 1 year MM Clinical medici ne A Reader 09 Male 29 Clinical tri al center III 12 2 years MM Medical ima ging A Reader 10 Female 30 Clinical tri al center III 12 4 years BM Medical ima ging B Reader 1 1 Female 30 Clinical tri al center III 9 4 years BM Medical ima ging B Reader 12 Female 30 Clinical tri al center III 12 5 years BM Medical ima ging A Clinical trial cent er s I , II, and III represe nt Peking University People's Hospital, Wu ha n Third Hospital, and Huangshi Central Hospital , respectively . # Internship refers to any clinical practice experience prior to China ’ s standardized residency training and is not li mited to the radiology department; it may also include rotations in internal medicine, gene ral surgery , and othe r departments. *Group denotes the randomly assigned group nu mber in the multireader multicase study design (d etailed under the subtitle of C linical trial design in Meth ods section). More details regarding the characteristics of the tw elve re aders a nd the quest ionnaires re lated to these responses are illustrated in Supplementar y T able 14 and reader questionnaire in the S upplementary Informa tion . A bbreviation s: BM = bachelor of medicine, MM = master of medici ne, MD = doctor of medici ne A rev i se d version of this m an uscript has been acc epted by Nat ure Can cer (DOI: 10.1038 /s43018- 026 - 01 147 -w ). 12 Supplementary T able 9 . Comparis on of d iagnostic performan ce of the twelve readers in the clinical trial Reader AUC Accuracy Sensitivi ty Specifici ty PPV NPV F1 - score Tw e l v e r e a d e r s Without DeepF AN 0.667 (0.616, 0.719) 0.65 1 (0.638, 0.66 3) 0.693 (0.676, 0.709 ) 0.605 (0.58 6 , 0.62 3) 0.655 (0.638, 0.673) 0.644 (0.625, 0.663) 0.674 (0.659, 0.689) With Dee pF AN 0.776 (0.733, 0.819) 0.751 (0.739 , 0.762) 0.769 (0.75 4 , 0.78 4) 0.731 (0.71 4, 0.747 ) 0.756 (0.740, 0.772) 0.744 (0.728, 0.762) 0.762 (0.750, 0.775) Diff erence 0.109 (0.083, 0.135) 0.10 0 (0.089, 0.1 1 1) 0.076 (0.061, 0.092) 0.126 (0.109, 0.143) 0.101 (0.089, 0.1 12) 0.100 (0.087, 0.1 13) 0.089 (0.078, 0.100) P- value <0.001 <0.001 <0.001 <0.001 <0.001 <0.001 <0.001 Reader 01 Without DeepF AN 0.733 (0.688 , 0.778) 0.715 (0.672, 0.756) 0.842 (0.797, 0.887) 0.577 (0.51 1, 0.641) 0.684 (0.632, 0.734) 0.771 (0.707, 0.831) 0.755 (0.712, 0.793) With Dee pF AN 0.833 (0.796 , 0.870) 0.799 (0.762, 0.834) 0.917 (0.878, 0.95 0) 0.671 (0.607, 0.73 0) 0.752 (0.701, 0.799) 0.882 (0.825, 0.926) 0.826 (0.791, 0.862) Diff erence 0.100 (0.059, 0.141) 0.084 (0.045, 0.125) 0.075 (0.032, 0.122) 0.095 (0.028, 0.159) 0.068 (0.032, 0.108) 0.1 1 1 (0.055, 0.171) 0.072 (0.040, 0.106) P- value <0.001 <0.001 0.005 0.006 <0.001 <0.001 <0.001 Reader 02 Without DeepF AN 0.715 (0.669 , 0.761) 0.657 (0.616, 0.700) 0.842 (0.795, 0.888) 0.455 (0.39 0 , 0.522) 0.627 (0.579, 0.678) 0.727 (0.653, 0.805) 0.719 (0.673, 0.757) With Dee pF AN 0.883 (0.852 , 0.914) 0.877 (0.844, 0.907) 0.925 (0.892, 0.957) 0.824 (0.778, 0.87 0) 0.851 (0.807, 0.890) 0.910 (0.867, 0.947) 0.887 (0.857, 0.915) Diff erence 0.168 (0.126, 0.210) 0.220 (0.177, 0.263) 0.083 (0.041, 0.127) 0.369 (0.304, 0.436) 0.225 (0.180, 0.269) 0.184 (0.1 17, 0.250) 0.168 (0.131, 0.204) P- value <0.001 <0.001 0.001 <0.001 <0.001 <0.001 <0.001 Reader 03 Without DeepF AN 0.723 (0.677 , 0.769) 0.689 (0.648, 0.730) 0.747 (0.693, 0.799) 0.626 (0.564, 0.689) 0.684 (0.629, 0.737) 0.695 (0.626, 0.755) 0.714 (0.668, 0.760) With Dee pF AN 0.787 (0.746 , 0.828) 0.743 (0.702, 0.784) 0.813 (0.761, 0.863) 0.667 (0.604, 0.728) 0.726 (0.675, 0.779) 0.767 (0.705, 0.821) 0.767 (0.724, 0.804) Diff erence 0.064 (0.028, 0.100) 0.054 (0.017, 0.093) 0.066 (0.020, 0.1 16) 0.041 ( - 0.017, 0.097) 0.042 (0.006, 0.081) 0.072 (0.027, 0.120) 0.053 (0.020, 0.088) P- value <0.001 0.006 0.015 0.2 0.02 0.004 0.002 Reader 04 Without DeepF AN 0.678 (0.630 , 0.726) 0.674 (0.633, 0.717) 0.73 0 (0.675, 0.784) 0.613 (0.551, 0.676) 0.672 (0.618, 0.727) 0.677 (0.609, 0.739) 0.700 (0.653, 0.749) With Dee pF AN 0.781 (0.739 , 0.823) 0.765 (0.724, 0.799) 0.743 (0.689, 0.793) 0.788 (0.728, 0.839) 0.792 (0.738, 0.842) 0.738 (0.680, 0.790) 0.767 (0.720, 0.805) Diff erence 0.103 (0.063, 0.144) 0.091 (0.054, 0.127) 0.012 ( - 0.034, 0.057) 0.176 (0.120, 0.236) 0.120 (0.079, 0.162) 0.062 (0.021, 0.101) 0.067 (0.033, 0.101) P- value <0.001 <0.001 0.728 <0.001 <0.001 0.006 <0.001 Reader 05 Without DeepF AN 0.601 (0.550 , 0.652) 0.594 (0.549, 0.639) 0.564 (0.496, 0.627) 0.626 (0.561, 0.687) 0.621 (0.555, 0.683) 0.570 (0.504, 0.627) 0.591 (0.536, 0.645) With Dee pF AN 0.727 (0.681 , 0.773) 0.715 (0.674, 0.756) 0.780 (0.725, 0.832) 0.644 (0.582, 0.706) 0.704 (0.650, 0.760) 0.730 (0.667, 0.789) 0.740 (0.694, 0.781) Diff erence 0.126 (0.085, 0.167) 0.121 (0.080, 0.160) 0.216 (0.161, 0.272) 0.018 ( - 0.038, 0.077) 0.083 (0.041, 0.125) 0.160 (0.1 15, 0.204) 0.149 (0.107, 0.191) P- value <0.001 <0.001 <0.001 0.643 <0.001 <0.001 <0.001 Reader 06 Without DeepF AN 0.533 (0.480 , 0.586) 0.546 (0.501, 0.592) 0.498 (0.436, 0.559) 0.599 (0.535, 0.661) 0.574 (0.507, 0.643) 0.524 (0.460, 0.581) 0.533 (0.478, 0.590) With Dee pF AN 0.693 (0.645 , 0.741) 0.678 (0.635, 0.719) 0.539 (0.474, 0.602) 0.829 (0.778, 0.876) 0.774 (0.709, 0.834) 0.624 (0.567, 0.677) 0.636 (0.578, 0.689) Diff erence 0.160 (0.108, 0.213) 0.132 (0.080, 0.181) 0.041 ( - 0.038, 0.1 19) 0.230 (0.171, 0.291) 0.200 (0.143, 0.258) 0.100 (0.053, 0.148) 0.102 (0.034, 0.166) A rev i se d version of this m an uscript has been acc epted by Nat ure Can cer (DOI: 10.1038 /s43018- 026 - 01 147 -w ). 13 P- value <0.001 <0.001 0.343 <0.001 <0.001 <0.001 <0.001 Reader 07 Without DeepF AN 0.695 (0.648 , 0.742) 0.680 (0.635, 0.721) 0.793 (0.743, 0.841) 0.559 (0.491, 0.623) 0.661 (0.608, 0.712) 0.713 (0.642, 0.778) 0.721 (0.673, 0.766) With Dee pF AN 0.836 (0.799 , 0.873) 0.797 (0.760, 0.832) 0.909 (0.871, 0.942) 0.676 (0.612, 0.734) 0.753 (0.703, 0.800) 0.872 (0.819, 0.918) 0.823 (0.785, 0.857) Diff erence 0.141 (0.105, 0.177) 0.1 17 (0.084, 0.156) 0.1 16 (0.074, 0.160) 0.1 17 (0.064, 0.169) 0.092 (0.061, 0.128) 0.159 (0.107, 0.213) 0.103 (0.074, 0.136) P- value <0.001 <0.001 <0.001 <0.001 <0.001 <0.001 <0.001 Reader 08 Without DeepF AN 0.668 (0.619 , 0.717) 0.654 (0.61 1, 0.695) 0.402 (0.339, 0.466) 0.928 (0.892, 0.958) 0.858 (0.791, 0.919) 0.589 (0.532, 0.636) 0.548 (0.486, 0.608) With Dee pF AN 0.749 (0.705 , 0.793) 0.737 (0.695, 0.775) 0.531 (0.467, 0.591) 0.959 (0.932, 0.985) 0.934 (0.892, 0.975) 0.653 (0.599, 0.701) 0.677 (0.614, 0.731) Diff erence 0.080 (0.046, 0.1 15) 0.082 (0.050, 0.1 15) 0.129 (0.071, 0.183) 0.032 ( - 0.005, 0.071) 0.076 (0.015, 0.142) 0.065 (0.039, 0.091) 0.129 (0.077, 0.184) P- value 0.004 <0.001 <0.001 0.146 0.014 <0.001 <0.001 Reader 09 Without DeepF AN 0.636 (0.586 , 0.686) 0.613 (0.570, 0.659) 0.788 (0.735, 0.839) 0.423 (0.364, 0.489) 0.597 (0.548, 0.651) 0.648 (0.568, 0.726) 0.680 (0.632, 0.721) With Dee pF AN 0.743 (0.699 , 0.787) 0.715 (0.674, 0.756) 0.801 (0.750, 0.850) 0.622 (0.56 0 , 0.685) 0.697 (0.643, 0.750) 0.742 (0.676, 0.801) 0.745 (0.703, 0.786) Diff erence 0.106 (0.070, 0.143) 0.102 (0.060, 0.140) 0.012 ( - 0.031, 0.058) 0.198 (0.134, 0.267) 0.099 (0.064, 0.136) 0.094 (0.037, 0.150) 0.065 (0.033, 0.099) P- value <0.001 <0.001 0.71 0 <0.001 <0.001 0.002 <0.001 Reader 10 Without DeepF AN 0.573 (0.521 , 0.625) 0.583 (0.538, 0.633) 0.469 (0.405, 0.537) 0.707 (0.649, 0.765) 0.635 (0.561, 0.705) 0.551 (0.495, 0.607) 0.539 (0.486, 0.601) With Dee pF AN 0.707 (0.660, 0.754) 0.706 (0.667, 0.745) 0.631 (0.567, 0.688) 0.788 (0.738, 0.843) 0.764 (0.704, 0.827) 0.663 (0.61 1, 0.713) 0.691 (0.636, 0.735) Diff erence 0.134 (0.086, 0.183) 0.123 (0.078, 0.166) 0.162 (0.094, 0.225) 0.081 (0.029, 0.136) 0.129 (0.077, 0.182) 0.1 12 (0.073, 0.152) 0.152 (0.097, 0.206) P- value <0.001 <0.001 <0.001 0.006 <0.001 <0.001 <0.001 Reader 1 1 Without DeepF AN 0.681 (0.633 , 0.729) 0.670 (0.631, 0.713) 0.68 0 (0.622, 0.738) 0.658 (0.596, 0.714) 0.683 (0.628, 0.738) 0.655 (0.591, 0.712) 0.682 (0.633, 0.732) With Dee pF AN 0.758 (0.715 , 0.801) 0.741 (0.706, 0.784) 0.705 (0.651, 0.762) 0.779 (0.724, 0.833) 0.776 (0.722, 0.830) 0.709 (0.650, 0.764) 0.739 (0.691, 0.783) Diff erence 0.077 (0.040, 0.1 13) 0.071 (0.035, 0.1 12) 0.025 ( - 0.022, 0.071) 0.122 (0.064, 0.183) 0.093 (0.049, 0.138) 0.054 (0.015, 0.093) 0.057 (0.020, 0.095) P- value <0.001 <0.001 0.377 <0.001 <0.001 0.002 0.004 Reader 12 Without DeepF AN 0.773 (0.731 , 0.815) 0.730 (0.689, 0.771) 0.954 (0.927, 0.979) 0.486 (0.421, 0.555) 0.669 (0.617, 0.720) 0.908 (0.852, 0.957) 0.786 (0.750, 0.819) With Dee pF AN 0.820 (0.782 , 0.858) 0.734 (0.695, 0.775) 0.934 (0.903, 0.964) 0.518 (0.452, 0.586) 0.678 (0.628, 0.728) 0.878 (0.819, 0.931) 0.785 (0.749, 0.824) Diff erence 0.047 (0.013, 0.082) 0.004 ( - 0.028, 0.035) - 0.021 ( - 0.050, 0.008) 0.032 ( - 0.024, 0.085) 0.009 ( - 0.016, 0.035) - 0.030 ( - 0.082, 0.019) - 0.001( - 0.024, 0.020) P- value 0.008 0.888 0.267 0.324 0.444 0.274 0.918 Numbers ar e values of diagnostic performance measures with 95% confidence interval s in parentheses . P v al u es w er e ca l cu la te d u si ng t he D eL on g t es t fo r AU C, McNemar ’s test for sensitivity , specifi city and accur acy , and nonpa rametric bootst rapping (1,000 iterations) for NPV , PPV and F1 - score. Abbreviation s: AUC = a rea u nder c urve , PPV = positive predictive value, NPV = negative predi ctive value. A rev i se d version of this m an uscript has been acc epted by Nat ure Can cer (DOI: 10.1038 /s43018- 026 - 01 147 -w ). 14 Supplementary T able 10. Stratified anal ysis of diagnostic performance among Dee pF AN, unassist ed reader s , and AI - assisted reader s Stratification AUC Sensitivity Specificity DeepF AN Unassisted reader AI - assisted reader DeepF AN Unassisted reader AI - assisted reader DeepF AN Unassisted reader AI - assisted reader Patient cha racteristics ^ Age ( year ) ≥ 18 to ≤ 45 (n=32) 0.976 (0.933, 1.000) 0.660 (0.605, 0.716) 0.801 (0.755, 0.846) 0.929 (0.685, 0.996) 0.654 (0.579, 0.729) 0.788 (0.724, 0.853) 0.842 (0.624, 0.945) 0.601 (0.537, 0.664) 0.728 (0.670, 0.786) >45 to ≤ 60 (n=196) 0.960 (0.935, 0.984) 0.688 (0.667, 0.709) 0.812 (0.795, 0.829) 0.989 (0.941, 0.999) 0.721 (0.695, 0.747) 0.820 (0.797, 0.842) 0.827 (0.743, 0.888) 0.571 (0.544, 0.599) 0.703 (0.677, 0.728) >60 (n=172) 0.964 (0.940, 0.988) 0.755 (0.734, 0.776) 0.842 (0.824, 0.859) 0.969 (0.914, 0.990) 0.810 (0.788, 0.833) 0.851 (0.831, 0.872) 0.851 (0.753, 0.915) 0.555 (0.522, 0.588) 0.703 (0.673, 0.733) Gender Male (n=201) 0.973 (0.954, 0.991) 0.724 (0.704, 0.744) 0.832 (0.816, 0.848) 0.966 (0.906, 0.988) 0.793 (0.769, 0.817) 0.838 (0.816, 0.860) 0.902 (0.833, 0.944) 0.537 (0.51 1, 0.564) 0.705 (0.681, 0.730) Female (n=199) 0.951 (0.923, 0.979) 0.732 (0.712, 0.752) 0.827 (0.810, 0.844) 0.991 (0.952, 1.000) 0.734 (0.71 1, 0.757) 0.829 (0.809, 0.849) 0.753 (0.652, 0.832) 0.609 (0.579, 0.639) 0.705 (0.677, 0.733) Nodule chara cteristics Nodule di ameter (mm) ≥ 4 to ≤10 (n=170) 0.933 (0.890, 0.976) 0.630 (0.605, 0.655) 0.745 (0.723, 0.768) 0.897 (0.815, 0.962) 0.429 (0.397, 0.464) 0.576 (0.542, 0.609) 0.873 (0.806, 0.935) 0.746 (0.721, 0.770) 0.831 (0.809, 0.851) > 10 to ≤20 (n=219) 0.946 (0.918, 0.974) 0.656 (0.635, 0.677) 0.769 (0.750, 0.787) 0.960 (0.909, 0.983) 0.766 (0.745, 0.788) 0.81 1 ( 0.791, 0.831) 0.800 (0.709, 0.868) 0.478 (0.449, 0.507) 0.632 (0.604, 0.660) > 20 to ≤30 (n=74) 0.998 (0.994, 1.000) 0.764 (0.731, 0.798) 0.889 (0.865, 0.912) 1.000 (0.927, 1.000) 0.872 (0.845, 0.899) 0.930 (0.910, 0.951) 0.960 (0.804, 0.997) 0.510 (0.453, 0.567) 0.697 (0.645, 0.749) Nodule dens ity SN (n=192) 0.977 (0.949, 1.000) 0.725 (0.701, 0.748) 0.816 (0.795, 0.837) 0.881 (0.800, 0.962) 0.725 (0.691, 0.757) a 0.751 (0.719, 0.782) a 0.962 (0.926, 0.992) 0.626 (0.602, 0.649) 0.783 (0.763, 0.802) PSN (n=168) 0.919 (0.878, 0.646 (0.619, 0.729 (0.705, 0.992 (0.975, 0.770 (0.748, 0.847 (0.829, 0.528 (0.357, 0.398 (0.352, 0.477 (0.431, A rev i se d version of this m an uscript has been acc epted by Nat ure Can cer (DOI: 10.1038 /s43018- 026 - 01 147 -w ). 15 0.960) 0.674) 0.753) 1.000) 0.791) 0.864) 0.705) b 0.446) c 0.522) b&c GGN (n=103 ) 0.905 (0.844, 0.966) 0.622 (0.590, 0.653) 0.729 (0.701, 0.757) 0.920 (0.841, 0.982) 0.452 (0.412, 0.492) 0.585 (0.546, 0.628) 0.792 (0.678, 0.900) d 0.692 (0.654, 0.727) 0.770 (0.735, 0.802) d Nodule l ocation R UL ( n=125) 0.962 (0.929, 0.996) 0.662 (0.635, 0.689) 0.772 (0.749, 0.795) 0.970 (0.928, 1.000) 0.682 (0.649, 0.714) 0.767 (0.739, 0.796) 0.810 (0.698, 0.904) 0.575 (0.537, 0.61 1) 0.695 (0.663, 0.728) R ML ( n=36) 0.935 (0.851, 1.000) 0.678 (0.629, 0.728) 0.777 (0.734, 0.821) 0.842 (0.682, 1.000) 0.623 (0.557, 0.682) 0.728 (0.670, 0.783) 0.882 (0.706, 1.000) e 0.667 (0.595, 0.728) 0.794 (0.731, 0.847) e R LL (n=1 16) 0.947 (0.905, 0.990) 0.719 (0.692, 0.746) 0.796 (0.772, 0.819) 0.948 (0.887, 1.000) 0.713 (0.679, 0.747) 0.769 (0.735, 0.801) 0.810 (0.704, 0.909) 0.602 (0.565, 0.636) 0.698 (0.663, 0.729) L UL ( n=99) 0.928 (0.877, 0.979) 0.725 (0.696, 0.753) 0.819 (0.796, 0.842) 0.948 (0.881, 1.000) 0.741 (0.710, 0.775) 0.792 (0.760, 0.823) 0.854 (0.739, 0.955) 0.612 (0.569, 0.658) 0.752 (0.715, 0.790) L LL (n=87) 0.981 (0.950, 1.000) 0.665 (0.632, 0.699) 0.81 1 ( 0.784, 0.838) 0.974 (0.909, 1.000) 0.643 (0.599, 0.687) 0.759 (0.718, 0.795) 0.938 (0.857, 1.000) 0.616 (0.576, 0.654) 0.771 (0.739, 0.804) Diagnosti c difficulty * Low (n=267) 0.994 (0.988, 1.000) 0.913 (0.903, 0.923) 0.956 (0.949, 0.963) 0.987 (0.954, 0.996) 0.868 (0.852, 0.883) 0.908 (0.894, 0.921) 0.964 (0.912, 0.986) 0.838 (0.818, 0.858) 0.910 (0.895, 0.925) Intermediate (n =133) 0.942 (0.907, 0.977) 0.447 (0.419, 0.457) 0.642 (0.615, 0.669) 0.966 (0.883, 0.99) 0.467 (0.430, 0.504) 0.631 (0.595, 0.667) 0.813 (0.71 1, 0.885) 0.461 (0.429, 0.494) 0.643 (0.612, 0.675) High (n=6 3) 0.644 (0.506, 0.781) 0.1 13 ( 0.090, 0.136) 0.229 (0.196, 0.262) 0.714 (0.529, 0.847) 0.190 (0.148, 0.232) f 0.289 (0.240, 0.337) f 0.571 (0.409, 0.720) 0.167 (0.131, 0.202) 0.343 (0.297, 0.388) Reader chara cteristics Clinica l trial center † Center I (n=3) NA 0.751 (0.727, 0.776) 0.861 (0.842, 0.880) NA 0.81 1 ( 0.782, 0.839) 0.885 (0.862, 0.908) NA 0.553 (0.515, 0.590) 0.721 (0.687, 0.755) Center II (n=4) NA 0.669 (0.644, 0.693) 0.781 (0.760, 0.802) NA 0.646 (0.616, 0.676) 0.743 (0.715, 0.770) NA 0.599 (0.567, 0.631) 0.734 (0.705, 0.763) Center III (n=5) NA 0.692 (0.671, 0.714) 0.779 (0.760, 0.798) NA 0.659 (0.632, 0.686) 0.720 (0.695, 0.746) NA 0.641 (0.612, 0.669) 0.733 (0.707, 0.759) A rev i se d version of this m an uscript has been acc epted by Nat ure Can cer (DOI: 10.1038 /s43018- 026 - 01 147 -w ). 16 Experience (year) 1- 2 (n=6) NA 0.720 (0.702, 0.741) 0.777 (0.761, 0.799) NA 0.698 (0.674, 0.723) 0.795 (0.774, 0.815) NA 0.601 (0.580, 0.632) 0.731 (0.707, 0.754) 3- 5 (n=6) NA 0.690 (0.676, 0.716) 0.831 (0.795, 0.848) NA 0.687 (0.664, 0.710) 0.743 (0.721, 0.766) NA 0.604 (0.578, 0.628) 0.730 (0.664, 0.710) Education BM (n=4) NA 0.679 (0.655, 0.703) 0.784 (0.763, 0.804) NA 0.667 (0.637, 0.697) 0.762 (0.736, 0.789) NA 0.619 (0.587, 0.651) 0.682 (0.652, 0.713) MM (n=5) NA 0.683 (0.662, 0.704) 0.780 (0.761, 0.799) NA 0.642 (0.615, 0.669) 0.705 (0.679, 0.730) NA 0.624 (0.596, 0.653) 0.775 (0.750, 0.799) MD (n=3) NA 0.751 (0.727, 0.776) 0.861 (0.842, 0.880) NA 0.81 1 ( 0.782, 0.839) 0.885 (0.862, 0.908) NA 0.553 (0.515, 0.590) 0.721 (0.687, 0.755) Numbers are values of diagnostic performance measures with 95% confidence i nterval s in parentheses . Unless otherwise, p airwise comparisons among AI predict ions, unassisted predictions, and AI - assisted predictions over each subgroup showed a P - value of less t han 0.0 1 for all performance mea sures . The DeLong test was used to compare AUCs bet ween paired gr oups, while McNemar's test was employed to assess differences in sensitivity and specificity . F or comparisons involving more than two groups, Bonferroni correction was applied to adjust for multiple testing. ^ The patient - lev el analysis results were reported in group s stratified by patient character istics . All other results were reported using nodule - leve l results. * The diagnosti c d if ficulty of a pulmonary nodule was defined as l ow , intermediate, and high when more than two - thirds, between one - third and two - thirds, and less than one - third, respectively , of unassisted readers correctly classified the nodule as benign or malignant. † Clinical trial center I , II, and III represent Peking University People's Hospital , Wuh an Third Hospit al, and Huangshi Central Hospital , respectively . a P value for sensitivity comparison over the SN subgroup between unassisted readers and AI - assisted readers is 0.333 . b P value for s pecificity comparison over the PSN subgroup between DeepF AN and AI - assisted readers is 0.212 . c P value for s pecificity comparison over the PSN subgroup between unassisted readers and AI - assisted readers is 0.016 . d P value for s pecificity comparison over the GGN subgroup between DeepF AN and AI - assisted readers is 0.619 . e P value for s pecificity comparison over the RML subgroup between DeepF AN and AI - assisted readers is 0. 023 . f P value for sensitivity comparison over the high diagnostic difficulty subgroup between unassisted readers and AI - assisted readers is 0.016 . Abbreviation s: AUC = a rea u nder c urve , SN = solid nodule, PSN = part - solid nodule, GGN = ground - glass nodule, RUL = right upper lobe, RML = right middle lobe, RLL = right lower lobe, LUL = left upper lobe, LLL = left lower lobe , NA = not applicable, BM = bachelor of m edicine, MM = master of medicine, M D = doctor of medicine. A rev i se d version of this m an uscript has been acc epted by Nat ure Can cer (DOI: 10.1038 /s43018- 026 - 01 147 -w ). 17 Supplementary T able 1 1 . Diagnostic perfor mance improvement across stratifi ed subgroups: unassisted vs. AI - assisted readers. Stratification ∆ AUC P value ∆ Sensitivity P value ∆ Specificity P value Patient characteristics ^ Age ( year ) ≥ 18 to ≤ 45 (n=32) 0.14 0 (0.099, 0.186) <0.001 0.135 (0.073, 0.201) 0.002 0.127 (0.074, 0.186) 0.001 >45 to ≤ 60 (n=196) 0.124 (0.108, 0.141) <0.001 0.099 (0.073, 0.124) <0.001 0.131 (0.106, 0.156) <0.001 >60 (n=172) 0.087 (0.07 0 , 0.105) <0.001 0.041 (0.018, 0.062) 0.002 0.148 (0.1 17, 0.179) <0.001 Gender Male (n=201) 0.108 (0.093, 0.124) <0.001 0.045 (0.023, 0.068) 0.001 0.168 (0.142, 0.193) <0.001 Female (n=199) 0.095 (0.079, 0.1 12) <0.001 0.095 (0.073, 0.1 18) <0.001 0.096 (0.069, 0.123) <0.001 Nodule characteristics Nodule diameter (mm) ≥ 4 to ≤10 (n=170) 0.1 15 (0.097, 0.134) <0.001 0.147 (0.1 14, 0.177) <0.001 0.085 (0.062, 0.106) <0.001 > 10 to ≤20 (n=219) 0.1 13 (0.096, 0.129) <0.001 0.045 (0.024, 0.064) <0.001 0.154 (0.125, 0.182) <0.001 > 20 to ≤30 (n=74) 0.125 (0.098, 0.152) <0.001 0.058 (0.033, 0.085) <0.001 0.187 (0.132, 0.243) <0.001 Nodule density SN (n=192) 0.091 (0.075, 0.107) <0.001 0.027 ( - 0.003, 0.058) 0.333 0.157 (0.136, 0.181) <0.001 PSN (n=168) 0.083 (0.061, 0.104) <0.001 0.077 (0.056, 0.097) <0.001 0.079 (0.033, 0.126) 0.016 GGN (n=103) 0.108 (0.086, 0.129) <0.001 0.133 (0.099, 0.166) <0.001 0.079 (0.048, 0.107) <0.001 Nodule location R UL (n=125) 0.1 1 0 (0.089, 0.131) <0.001 0.086 (0.058, 0.1 16) <0.001 0.121 (0.088, 0.157) <0.001 R ML (n=36) 0.099 (0.063, 0.133) <0.001 0.105 (0.048, 0.167) 0.002 0.127 (0.072, 0.181) <0.001 R LL (n=1 16) 0.077 (0.057, 0.095) <0.001 0.056 (0.027, 0.085) 0.007 0.096 (0.067, 0.129) <0.001 L UL (n=99) 0.094 (0.073, 0.1 13) <0.001 0.05 0 (0.022, 0.077) 0.006 0.14 0 (0.102, 0.177) <0.001 L LL (n=87) 0.146 (0.12 0 , 0.171) <0.001 0.1 15 (0.074, 0.156) <0.001 0.155 (0.1 16, 0.191) <0.001 Diagnostic difficulty * Low (n=267) 0.043 (0.034, 0.052) <0.001 0.04 0 (0.024, 0.056) <0.001 0.072 (0.053, 0.092) <0.001 Intermediate (n=133) 0.195 (0.167, 0.22 0 ) <0.001 0.164 (0.122, 0.201) <0.001 0.182 (0.149, 0.217) <0.001 High (n=63) 0.1 16 (0.088, 0.144) <0.001 0.098 (0.052, 0.146) 0.016 0.176 (0.133, 0.223) <0.001 A rev i se d version of this m an uscript has been acc epted by Nat ure Can cer (DOI: 10.1038 /s43018- 026 - 01 147 -w ). 18 Reader characteristics Clinical trial cen ter † Center I (n=3) 0.1 1 0 (0.089, 0.129) <0.001 0.075 (0.047, 0.101) <0.001 0.168 (0.133, 0.204) <0.001 Center II (n=4) 0.1 12 (0.093, 0.13 0 ) <0.001 0.096 (0.069, 0.124) <0.001 0.135 (0.107, 0.163) <0.001 Center III (n=5) 0.087 (0.072, 0.101) <0.001 0.061 (0.041, 0.084) <0.001 0.093 (0.066, 0.1 15) <0.001 Experience (year) 1- 2 (n=6) 0.102 (0.087, 0.1 15) <0.001 0.097 (0.076, 0.1 17) <0.001 0.125 (0.100 , 0.148) <0.001 3- 5 (n=6) 0.105 (0.089, 0.12 0 ) <0.001 0.056 (0.033, 0.079) <0.001 0.126 (0.103, 0.15 0 ) <0.001 Education BM (n=4) 0.105 (0.089, 0.122) <0.001 0.095 (0.073, 0.121) <0.001 0.063 (0.036, 0.09 0 ) <0.001 MM (n=5) 0.097 (0.082, 0.1 14) <0.001 0.062 (0.037, 0.088) <0.001 0.15 0 (0.124, 0.177) <0.001 MD (n=3) 0.1 1 0 (0.09 0 , 0.13 0 ) <0.001 0.075 (0.048, 0.102) <0.001 0.168 (0.131, 0.21 0 ) <0.001 Numbers are values of improvement in diagnostic performance measures wi th 95% confidence interval s in parentheses . Confid ence i ntervals were estimate d usin g nonparametric bootstrap with 1,000 iterations. P values were calculated using either DeLong test or McNemar's test as specified in Supplementary T able 1 0 . † Clinical trial center I , II, and III represent Peking University People's Hospital , Wuh an Third Hospit al, and Huangshi Central Hospital , respectively . ^ Patient - level analysis results w ere presented s tratified by patien t characteristics, while all other find ings were report ed at the no dule level. * The diagnostic dif fic ulty of a pulmonary nodule was def ined as low , intermediate, and high when more than two - thirds, between one - third and two - thirds, and less than one - third, respectively , of unassisted readers correctly classified the nodule as benign or malignant. Abbreviation s: AUC = a rea u nder c urve , SN = solid nodule, PSN = part - solid nodul e, GGN = ground - glass nodul e, RUL = right upper lobe, RML = right middle lobe, RLL = right lower lobe , LUL = left upper lobe, LLL = left lower lobe , NA = not applicable, BM = bachelor of medicine, MM = master of m edicine, MD = doctor of medicine. A rev i se d version of this m an uscript has been acc epted by Nat ure Can cer (DOI: 10.1038 /s43018- 026 - 01 147 -w ). 19 Supplementary T able 12 . Logistic regression analysis of nodule features and AI pred icted malignancy in the clinical trial Va r i a b l e Univariable Multivari able OR (95% CI) P value OR (95% CI) P value Nodule diameter (unit: mm) 1.09 (1.05,1.13) <0.001 1.11 (1.06,1.17) <0.001 Nodule density ( reference: solid nodule) P art - solid nodule 17.53 (10.0 1 ,30.69) <0.001 30.05 (14.9 6 ,60.3 8) <0.001 G round - glass nodule 2.94 (1.7 8 ,4.82) <0.001 18.05 (8.23,39.5 7) <0.001 L ocation (reference: right upper lobe) Right middle lob e 0.65 (0.3 1 ,1.3 6) 0.249 0.97 (0.36,2.6 2) 0.959 Right lower lobe 0.85 (0.5 1 ,1.42) 0.538 1.34 (0.68,2.6 3) 0.401 Left upper lobe 1.04 (0.60,1.7 8) 0.901 1.21 (0. 60 ,2.4 6) 0.597 Left lower lobe 0.58 (0.33, 1. 00 ) 0.05 0 0.70 (0.33,1.46) 0.339 Spiculation (reference: no) 3.69 (2.50,5.43) <0.001 4.67 (2.5 1 ,8.7 1) <0.001 Lobulation (reference: no) 6.84 (3.6 8 ,12.72) <0.001 4.26 (1.95,9.2 8) <0.001 Abbreviation s: OR = o dds r atio , CI = confidence interval . A rev i se d version of this m an uscript has been acc epted by Nat ure Can cer (DOI: 10.1038 /s43018- 026 - 01 147 -w ). 20 Supplementary T able 13 . Univaria ble and multivar iable gene ralized linear mixed analyses for factors influencing the accuracy o f AI - assisted readin g Va r i a b l e Univariable Multivari able β value P value β value P value Diagnostic r elated results Patholog y (reference: benign) 0.56 0.002 NA NA Correct AI suggesti ons (reference: incorrec t) 3.01 < 0.00 1 1.72 < 0.00 1 Correct reading a t first session (refer ence: incorrect) * 2.88 < 0.00 1 NA NA Interaction between correct AI suggestions and correct reading # - 0.71 0.036 NA NA Patient characteris tics Clinical tri al center (reference: ce nter I) Center II - 0.39 0.189 Center III - 0.35 0.065 Patient age (uni t: year) 0.01 0.134 Patient sex (ref erence: female) 0.04 0.802 Nodule characteristic s Nodule d iameter (unit: mm) 0.04 0.010 0.00 0.631 Nodule de nsity (reference: solid nodule) P art - solid nodule 0.07 0.718 0.10 0.378 G round - glass nodule - 0.62 0.008 - 0.1 1 0.416 Nodule l ocation (reference: left lung) - 0.28 0.128 S piculation (reference: no) 0.18 0.334 L obulation (reference: no) - 0.70 0.010 - 0.20 0.197 Diagnostic difficulty (re ference: l ow) $ Intermediate - 1.86 < 0.00 1 - 1.65 < 0.00 1 High - 3.32 < 0.00 1 - 2.68 < 0.00 1 CT image characteristi cs Slice thickness ≥ 1 mm (reference: <1 mm) 0.30 0.091 Reader characteristics Clinical tri al center (reference: ce nter I) Center II - 0.54 0.031 NA NA Center III - 0.62 0.010 NA NA Reading e xperience of 3 - 5 (references: 1 - 2 [unit: year]) - 0.07 0.778 E ducation (reference: doctor of medicine) Master of me dicine - 0.52 0.028 - 0.53 0.034 Bachelor of medici ne - 0.66 0.007 - 0.67 0.009 Annual chest CT diagnoses ≥ 10,000 (reference:<10,000[unit: case]) - 0.22 0.374 Research experience in medical imaging AI (reference: no) - 0.02 0.924 Familiar with ba ckground knowledge of AI (re ference: unfamiliar)^ - 0.02 0.924 Attitude of trust toward AI (ref erence: n eutral ) + - 0.09 0.719 To t a l g ri t score % 0.03 0.080 *Correct reading at first session denotes the situation where the assessment from the first reading session (without AI) is the same as the gr ound truth. # A v a r i a b l e c o m b i n a t i o n a p p r o a c h w h e r e t h e categorical variable of AI suggestion is multiplied by that of the correct reading at first sessi on. $ The diagno stic difficulty of a pul monary A rev i se d version of this m an uscript has been acc epted by Nat ure Can cer (DOI: 10.1038 /s43018- 026 - 01 147 -w ). 21 nodule was defined as low , i ntermediate, and high when more than two - thirds, between one - third and two - thirds, and less than one - third, respectively , of the unassisted readers correctly classified the nodule as benign or malignant. ^ The data were cat egorized into binary groups: "unfami liar" (a rating score ≤ 3 for Question 8 in the questionnaire) and "familiar" (a rating score > 3). + The data automatically fell into b inary groups : " neutral " (a rating score of 3 for Question 9 in the questionnaire) and " mo stly beli eve " (a rating score of 4 ). % To t a l g r i t s c o r e for personality traits related to stability of interest and persistence of effort ( Supplement ary T able 14 and read er questionnaire ). Abbreviations : AI = arti ficial intelligen ce, NA = not applicable. A rev i se d version of this m an uscript has been acc epted by Nat ure Can cer (DOI: 10.1038 /s43018- 026 - 01 147 -w ). 22 Supplementary T able 14 . Re ader ’ s personal characteristics , experience with medical imaging AI, attitude of trust toward AI and G rit score Reader number Wor k pl ac e W ork ing experience Education Whether number of a nnual chest CT diagnoses exceeding 10,000 cases or not? Do you have prior experience using AI tools for chest CT diagnosis? Do you have research experience in medical imaging AI? Rate your level of knowledge regarding medical imaging AI technology * Rate your attitude of trust toward AI - based computer - assisted diagnosis systems # To t a l G rit s core & (points) 01 C enter I 2 years MD N o Ye s Ye s 4 4 50 02 C enter I 1 year MD No Ye s No 3 3 46 03 C enter I 1 year MD No Ye s Ye s 4 4 37 04 C enter II 5 years MM No Ye s No 3 4 39 05 C enter II 2 years BM No Ye s No 3 3 44 06 C enter II 3 years MM No Ye s No 3 3 46 07 C enter II 4 years MM No Ye s Ye s 4 4 51 08 C enter III 1 year MM Ye s Ye s No 3 4 48 09 C enter III 2 years MM Ye s Ye s No 3 4 34 10 C enter III 4 years BM Ye s Ye s Ye s 4 4 36 11 C enter III 4 years BM Ye s Ye s Ye s 5 3 36 12 C enter III 5 years BM Ye s Ye s Ye s 4 4 43 Clinical trial center s I , II, and III represent Peking Unive rsity People's Hospital, W uhan Third Hospital, and Huangshi Centra l Hospital, respectively . * L evel of knowledge regarding medical i maging AI technology was r ated on a five - point scale from 1 (" Never he ard o f ") to 5 (" Master ski ll of AI "), with higher scores reflecting greater expertise . # A ttitude of trust toward AI - based computer - assisted di agnosis systems w as rated on a five - point scale from 1 (" Not believe at all") to 5 (" C ompletely believe "), where higher scores indicate greater perceived belief. & To t a l G rit score reflects personality traits related to stability of interest and persistence of effort. Please refer to reader questionnaire for details. A bbreviation s: BM = bachelor of medicine, MM = master of medici ne, MD = doctor of medici ne. A rev i se d version of this m an uscript has been acc epted by Nat ure Can cer (DOI: 10.1038 /s43018- 026 - 01 147 -w ). 23 Reader Questionnai re Electronic questionnaires were administered to junior radiologists right before the multi - reader multi - case clinical trial. Question 1 to 13 characteriz e reader ’ s personal characteristics, experience with medical imaging AI, and at titude of trust toward AI. Question 1 4 and 1 5 are components of G rit score , each consist ing of six questions that individually describe interest stability and effort persistence. T he t otal G rit score wa s calculated by summing the scores for the 12 questions. The questionnaires were or iginally p resented in Chinese. For the reader ’s convenience, we have translated the Chinese text in to English. The count and propor tion for each question are also provided . Personal characteristi cs 1. Please fill in the blank with your name ____ 2. Please fill in the blank with your age ____ (years old) 3. Please select your gender [single choi ce] Options Counts (percentage%) 1. Male 4( 33.33 ) 2. Female 8( 66 . 67 ) 4. Please fill in the blank with your major for the B achelor ’ s degree ____ 5. How many months have you participated in clinical practice experience (not limited to the radiology department ) prior to the start of China ’ s standardized residency training ? ____ (months) 6. Please select your workplace [single choice] Options Counts (percentage%) 1. Peking Universit y People's Hospital 3 (25) 2. Wuh a n T h ir d H os pi t al 4 (33.33) 3. Huangshi Central Hospital 5(41.67) 7. How many years have you been working in diag nostic imaging at your wor k place ? [single choice] A rev i se d version of this m an uscript has been acc epted by Nat ure Can cer (DOI: 10.1038 /s43018- 026 - 01 147 -w ). 24 Options Counts (percentage%) 1. 1 year 3 (25) 2. 2 years 3 (25) 3. 3 years 1 (8.33) 4. 4 years 3 (25) 5. 5 years 2 (16.67) 8. Please select your highest education level [single choice] Options Counts (percentage%) 1. Doctor of M edicine 3 (25) 2. Master of Medicine 5 (41.67) 3. Bachelor of M edicine 4 (33.33) 9. What is your esti mated number of annual chest CT diagnoses [ Single Choice ] Options Counts (percentage%) 1. <10000 cases per year 7(58.33) 2. ≥ 10000 cases per year 5(41.67) Experience with medi cal imaging AI 10. Do you have prior experience using AI tool s for chest CT diagnosis? [single choice] A rev i se d version of this m an uscript has been acc epted by Nat ure Can cer (DOI: 10.1038 /s43018- 026 - 01 147 -w ). 25 Options Counts (percentage%) 1. Ye s 1 2(100) 2. No 0 (0) 11. Do you have research experience in medical imaging AI? [single choice] Options Counts (percentage%) 1. Ye s 6(50) 2. No 6(50) 12. Rate your level of knowledge regarding medical imaging AI technology Options Counts (percentage%) 1. Never heard of 0 (0) 2. Have heard but k new little 0 (0) 3. Have read relat ed information from jour nals or books 6 (50) 4. Familiar with AI 5 (41.67) 5. Master ski ll of AI 1 (8.33) 13. Rate your at titude of trust toward AI - based computer - assisted diagnosis systems Options Counts (percentage%) 1. Not believe at all 0 (0) 2. Not much believe 0 (0) A rev i se d version of this m an uscript has been acc epted by Nat ure Can cer (DOI: 10.1038 /s43018- 026 - 01 147 -w ). 26 3. Neutral 4 (33.33) 4. Mostly be lieve 8(66.67) 5. Completely beli eve 0 (0) A rev i se d version of this m an uscript has been acc epted by Nat ure Can cer (DOI: 10.1038 /s43018- 026 - 01 147 -w ). 27 Grit score 14. To b e t t e r u n d e r s t a n d y o u r i n t e r e s t stability , please choose the best option that best fit you for the following question s Questions Not like me at all (1 point) Not much like me (2 points) Somewhat like me (3 points) Mostly li ke me (4 points) Ve r y m u c h like me (5 points) 1. I often set a goal but later choose to pursue a different one. 0(0 %) 8 (6 6. 67 %) 4(3 3. 33 %) 0(0%) 0(0%) 2. New ideas and proj ects sometimes distract me from previous ones. 0(0%) 5 (4 1. 67 %) 5 (4 1. 67 %) 2(16 . 67 %) 0(0%) 3. Every few months, I become interested in something new . 1( 8. 33 %) 6(50 %) 5 (4 1. 67 %) 0(0%) 0(0%) 4. My interests change every year . 3( 25 %) 8 (6 6. 67 %) 1( 8. 33 %) 0(0%) 0(0%) 5. I was once fascinated by a certain idea or project for a while, but eventually lost interest. 1( 8. 33 %) 5 (4 1. 67 %) 4(3 3. 33 %) 2(16 . 67 %) 0(0%) 6. I find it dif ficult to stay focused on projects that take more than a few months to complete. 1( 8. 33 %) 9 (7 5 %) 2(16 . 67 %) 0(0%) 0(0%) A rev i se d version of this m an uscript has been acc epted by Nat ure Can cer (DOI: 10.1038 /s43018- 026 - 01 147 -w ). 28 15. To b e t t e r u n d e r s t a n d y o u r e f f o r t persistence , please choose the best option that best fit you for following question Questions Not like me at all (1 point) Not much like me (2 points) Somewhat like me (3 points) Mostly li ke me (4 points) Ve r y m u c h l i k e me (5 points) 1. I have accomplished a goal that required years of effort to achieve. 0(0%) 4 (3 3. 33 %) 3(2 5 %) 2(16 . 67 %) 3(2 5 %) 2. I have overcome setbacks t o complete an important challe nge. 1( 8. 33 %) 3( 25 %) 4(3 3. 33 %) 2(16 . 67 %) 2(16 . 67 %) 3. Wh atever I start , I will s ee it t hrough to the end. 0(0%) 2( 16 . 67 %) 5(41 . 67 %) 5 (4 1. 67 %) 0(0%) 4. Setba cks do not discourage me. 0(0%) 0(0%) 8 (6 6. 67 %) 4(3 3. 33 %) 0(0%) 5. I am a hard - working person 0(0%) 1( 8. 33 %) 4(3 3. 33 %) 3( 25 %) 4(3 3. 33 %) 6. I am a diligent person 0(0%) 2(16 . 67 %) 3(2 5 %) 5 (4 1. 67 %) 2(16 . 67 %) A rev i se d version of this m an uscript has been acc epted by Nat ure Can cer (DOI: 10.1038 /s43018- 026 - 01 147 -w ). 29 Extended Data Figure 1 A rev i se d version of this m an uscript has been acc epted by Nat ure Can cer (DOI: 10.1038 /s43018- 026 - 01 147 -w ). 30 Extended Data Figure 2 A rev i se d version of this m an uscript has been acc epted by Nat ure Can cer (DOI: 10.1038 /s43018- 026 - 01 147 -w ). 31 Extended Data Figure 3 A rev i se d version of this m an uscript has been acc epted by Nat ure Can cer (DOI: 10.1038 /s43018- 026 - 01 147 -w ). 32 Extended Data Figure 4 A rev i se d version of this m an uscript has been acc epted by Nat ure Can cer (DOI: 10.1038 /s43018- 026 - 01 147 -w ). 33 Extended Data Figure 5 A rev i se d version of this m an uscript has been acc epted by Nat ure Can cer (DOI: 10.1038 /s43018- 026 - 01 147 -w ). 34 Extended Data Figure 6 A rev i se d version of this m an uscript has been acc epted by Nat ure Can cer (DOI: 10.1038 /s43018- 026 - 01 147 -w ). 35 Extended Data Figure 7 A rev i se d version of this m an uscript has been acc epted by Nat ure Can cer (DOI: 10.1038 /s43018- 026 - 01 147 -w ). 36 Extended Data Figure 8 A rev i se d version of this m an uscript has been acc epted by Nat ure Can cer (DOI: 10.1038 /s43018- 026 - 01 147 -w ). 37 Extended Data Figure 9
Original Paper
Loading high-quality paper...
Comments & Academic Discussion
Loading comments...
Leave a Comment