A Causal Framework for Evaluating ICU Discharge Strategies
In this applied paper, we address the difficult open problem of when to discharge patients from the Intensive Care Unit. This can be conceived as an optimal stopping scenario with three added challenges: 1) the evaluation of a stopping strategy from …
Authors: Sagar Nagaraj Simha, Juliette Orthol, Dave Dongelmans
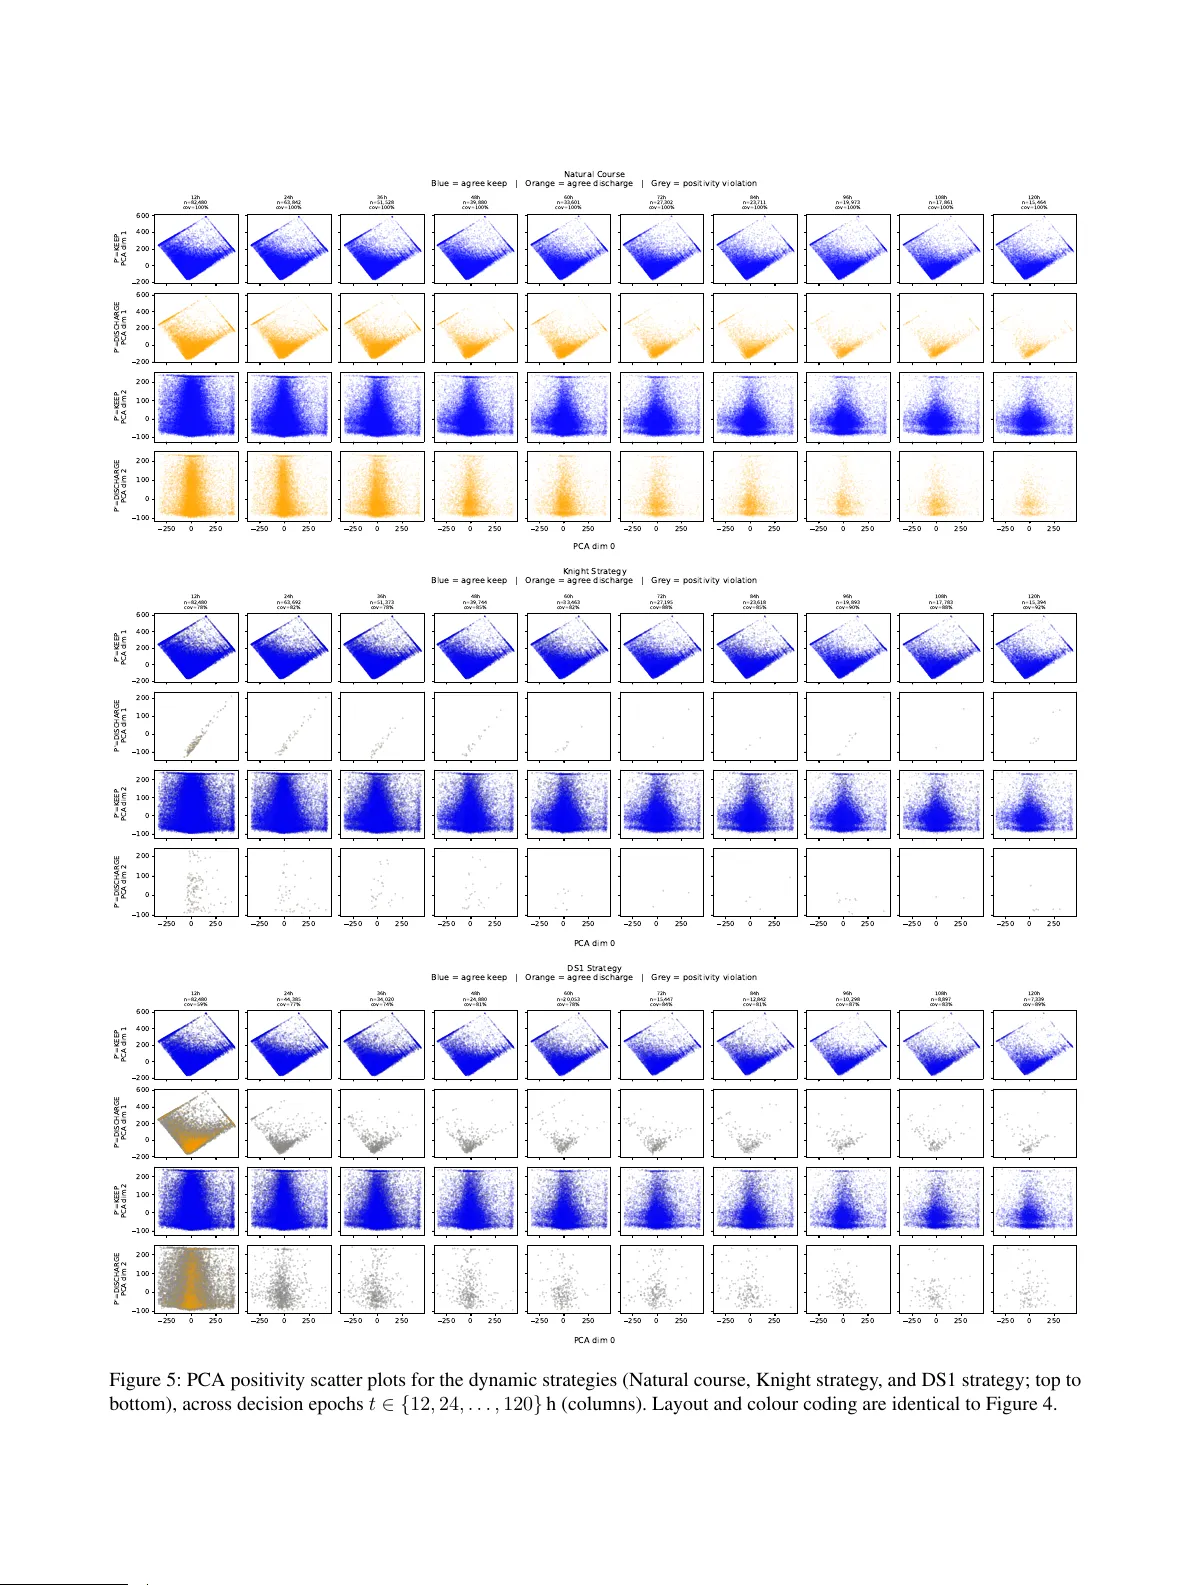
A Causal Framework f or Evaluating ICU Dischar ge Strategies Sagar Nagaraj Simha 1 Juliette Ortholand 1 Dav e Dongelmans 2 Jessica D . W orkum 3,4 Olivier W .M. Thijssens 6 Ameen Abu-Hanna 1 , Giovanni Cinà 1,5 1 Department of Medical Informatics, Amsterdam UMC, Univ ersity of Amsterdam, NL 2 Department of Intensiv e Care Medicine, Amsterdam UMC, Univ ersity of Amsterdam, NL 3 Department of Intensiv e Care, Elisabeth-T weeSteden Hospital, T ilbur g, NL 4 Department of Intensiv e Care, Erasmus MC, Rotterdam, NL 5 Institute of Logic, Language and Computation, Univ ersity of Amsterdam, NL 6 Pacmed, Amsterdam, NL Abstract In this applied paper , we address the difficult open problem of when to discharge patients from the Intensiv e Care Unit. This can be conceived as an optimal stopping scenario with three added chal- lenges: 1) the ev aluation of a stopping strategy from observ ational data is itself a complex causal inference problem, 2) the composite objecti ve is to minimize the length of intervention and maximize the outcome, but the two cannot be collapsed to a single dimension, and 3) the recording of vari- ables stops when the intervention is discontinued. Our contributions are two-fold. First, we general- ize the implementation of the g-formula Python package, providing a frame work to ev aluate stop- ping strate gies for problems with the aforemen- tioned structure, including positivity and cov erage checks. Second, with a fully open-source pipeline, we apply this approach to MIMIC-IV , a public ICU dataset, demonstrating the potential for strategies that improv e upon current care. 1 INTR ODUCTION Determining when to stop an ongoing intervention is a fun- damental problem in a variety of fields. Examples are the optimal duration of a therapy in healthcare [Daneman et al., 2016], the secretary problem in mathematical economics [Ferguson, 1989], monitoring/maintenance problems in op- erations research [Rust, 1987], among others. Stopping strategies arise as a special class of dynamic treatment regimes (DTRs) [Chakraborty and Moodie, 2013] , where the decision variable is not the choice of intervention but whether to discontinue. Unlike static or fixed-duration strate- gies, dynamic stopping strategies depend on the temporal ev olution of continuously monitored cov ariates, increasing the complexity of their e valuation. The Intensi ve Care Unit (ICU), the hospital ward were the most se vere patients are treated, requires clinicians to con- tinuously take optimal stopping decisions. The decision of when to stop ICU care–and send a patient to a step-down ward– is one of them, and can be concei ved as an optimal stopping problem. While a longer ICU stay may benefit surviv al, an e xtra ICU day is very e xpensiv e and, in case of congestion of ICU beds, may prevent the admission of another patient [Long and Mathews, 2018]. Optimising ICU discharge requires balancing length of stay and probability of surviv al. Current guidelines on ICU discharge outline gen- eral best practices; howe ver , they do not specify a concrete operational protocol and are supported by limited empirical e vidence [Nates et al., 2016]. A recent surv ey including ICU clinicians from 40 countries found out that only about half of the ICUs had discharge protocols in place [Hiller et al., 2024], and a surv ey on Reinforcement Learning applications to the ICU highlighted the ev aluation procedure as one of the weak points in this body of literature [Otten et al., 2024]. This moti vates the need for a methodologically rob ust way to ev aluate candidate discharge strate gies. Figure 1 can be used as an aid to conceptualize our work. Giv en a fixed dataset, each strate gy’ s potential outcome is a point in the 2-dimensional space spanning the two out- comes of interest: 90-day mortality and length of ICU stay (both av eraged across the data). W e are interested in finding strategies constituting an improvement o ver current care, i.e. in the red area. Ho wever , our data may not allo w for the ev aluation of ev ery strategy . The e valuation of ICU dischar ge strategies is complicated by (at least) three additional challenges. First, giv en the diffi- culty of testing new potential strate gies directly on patients, the e valuation of strategies often requires causal inference approaches to estimate effects from observational data. Sec- ond, when the outcome of interest is e.g. mortality , it is often not straightforward to collapse the cost of the outcome and the cost of continuing the intervention to a single dimen- sion of ‘utility’. Finally , since the ICU entails a high lev el of monitoring, stopping the interv ention and discharging means terminating the measurement of certain variables. Contributions. When it comes to handling these chal- lenges, many existing computational approaches are limited (see Related W orks below). In this applied paper , we address these limitations as follo ws: (i) we formulate a causal esti- mand for the comparativ e ev aluation of dynamic, cov ariate- dependent stopping strategies; (ii) we implement this es- timand by extending the pygformula [McGrath et al., 2020] package to e valuate optimal stopping rules when v ari- ables are censored at stopping; (iii) we provide a series of diagnostics to understand whether the strategy of interest can be e valuated on the a vailable data, and (i v) we apply the framew ork in a target trial emulation e valuating h ypotheti- cal ICU discharge strategies using a public ICU dataset, the MIMIC-IV database [Johnson et al., 2024]. In our application, ICU discharge decisions are modelled as a sequential stopping process in which, at each decision time, a strategy g determines whether ICU care is continued or terminated based on patient history . Dischar ge is treated as a censoring intervention: once the stopping criterion is met, the patient exits the ICU, variables are not measured any more and post-discharge outcomes are ev aluated at each time point. F or each candidate discharge strate gy , as- suming all assumptions are met and a dataset is fixed, our implementation returns both an a verage outcome and an av erage length of the intervention, as well as an assessment on whether the data supports the ev aluation. All our code is av ailable open-source 1 . 2 RELA TED W ORK Evaluating clinical guidelines to optimise outcomes follo w- ing ICU dischar ge [Nates et al., 2016, Knight, 2003], re- quires taking into account time-varying confounding while av oiding conditioning on post-treatment variables, using a causal inference approach. Unfortunately , when attempting to optimise ICU decisions, such causal methods are not al- ways fully adhered to [K omorowski et al., 2018, Lejarza et al., 2023, Thoral et al., 2021, Otten et al., 2024]. For this reason, guidelines for the use of Reinforcement Learning in ICU hav e raised awareness re garding data av ailability (posi- tivity assumption) and v ariables measured (no unmeasured confounders assumption) [Gottesman et al., 2019]. Mindful of this warning, rather than searching for an optimal strat- egy as Causal Reinforcement Learning generally aims to do [Clifton and Laber, 2020], we aim in this paper to properly ev aluate candidate strategies against current care. T o contrast strategies for treatment stopping, sev eral causal approaches have been used: in verse probability weight- ing [Keogh et al., 2023] that reweights the trajectories, g- estimation [Moodie et al., 2009] that directly model treat- 1 Our code is av ailable in the Supplementary files. Figure 1: The ICU dischar ge trade-of f represented in the space of potential outcomes for our multi-objective stopping problem. Gi ven a fixed dataset, each strategy returns an av erage 90-day mortality on the y-axis as well as an av erage length of ICU stay on the x-axis. The red box defines the set of strategies that constitute an improvement ov er current clinical practice, i.e. strategies leading to lower mortality and lo wer utilization of ICU beds. The blue dashed area defines the set of strategies we are actually able to e valuate giv en the av ailable data. ment effect and g-computation with g-formula that focus on modelling the conditional mean outcome [Robins, 1986, 1987, T aubman et al., 2009, Y oung et al., 2011, Smith et al., 2022, W anis et al., 2023]. Analysis are then designed using emulation of tar get trial on observational data [Hansford et al., 2023, Smith et al., 2022, Garcia-Albeniz et al., 2015]. G-computation of fer the most natural way to simulate v ar- ious strategies, and has been implemented on open source packages such as pygformula [McGrath et al., 2020]. More recently , the G-computation approach has been ex- tended to more fle xible modelling with deep learning ap- proaches [Xiong et al., 2024, Su et al., 2024, Deng et al., 2024]. Y et, modelling structured data using deep learning approaches has been shown to offer a small improvement at the cost of interpretability , need for data and, compu- tation time [V aroquaux et al., 2025, Maheux et al., 2023, Christodoulou et al., 2019]. T o our knowledge, none of these approaches have consid- ered dif ferent models for the outcome with and without treatment, which offer model flexibility and is arguably a requirement to e valuate ICU discharge. Indeed, deaths in and outside of the ICU are dif ferent outcomes and many vital signs monitored in ICU are not recorded outsi de of it (or recorded at a different granularity) due to the lo wer lev el of monitoring. 3 METHODS W e introduce here the notation, the mathematical frame- work and the experimental design. W e further use the DTR terminology as described in Deliu and Chakraborty [2022]. 3.1 NO T A TION W e employ a discrete representation of time t = 0 , 1 , . . . , T , with T the end of follow-up time. Each patient i is associated with the outcome of interest (90-day all-cause mortality in our case), a binary variable noted y i,t ∈ Y t such that y i,t = 1 ⇒ y i,t ′ = 1 for all t ′ > t . W e define the time when the outcome is determined as t d = ar gmin { t, if ∃ t, y i,t = 1 or T if ∀ t, y i,t = 0 } , using survi val analysis formalism. A set of baseline and longitudinal cov ariates, ℓ i,t ∈ L t , is also associated with each patient i at each decision time t . In our setup the cov ariates are only defined if y i,t = 0 . If y i,t = 0 , we consider a binary treatment a i,t ∈ { 0 , 1 } in- dicating whether treatment is continued ( 1 ) or stopped ( 0 ) at time t for patient i and denote with ¯ a i,t = ( a i, 0 , ..., a i,t ) ∈ ¯ A t the choices made since baseline up to time t . A treatment strategy , g = ( g 0 , . . . , g T ) , is associated with it such that: a g i, 0 = g 0 ( ℓ g i, 0 ) , a g i,t = g t ( ¯ ℓ g i,t , ¯ a g i,t − 1 ) , t = 1 , . . . , T a g i,t = 0 ⇒ a g i,t ′ = 0 for all t ′ > t assuming that once treatment stops, it remains stopped. W e will further refer to such treatment strategy as a DTR fol- lowing Murph y et al. [2001] definition. Static strategies are a subset of dynamic strate gies incorporating only baseline cov ariates. Follo wing standard terminology we refer to the strategy observed in the data as the “natural course” strat- egy and denote it with g N . W e consider a finite-horizon dynamic treatment strategy ending at time T . W e denote with τ g i = argmax t { t such that a g i,t = 1 } the length of treat- ment for patient i ; this v alue can at max be T − 1 since at T we only ev aluate the outcome. 3.2 ESTIMAND (T ASK) Using the potential outcome notation, we are looking for the set of DTRs g that maximise E Y g N T ( ¯ A g N T − 1 ) − Y g T ( ¯ A g T − 1 ) while minimising E [ τ g − τ g N ] across the population. That is, the ob- jectiv e is to maximize improv ement in the outcome with respect to natural course, while also reducing length of treatment. Such strategies ha ve a potential outcome within the red area in Figure 1. 3.3 ASSUMPTIONS Standard causal inference assumptions are stable unit treat- ment v alue, no unmeasured confounders and positivity [Deliu and Chakraborty, 2022] (see A.1 for further details). If the two first assumptions come from the study design and can hardly be tested, positi vity is a major issue that should be assessed from the data. Classic approaches define the set of history-compatible tra- jectories at epoch t , D g t ; a subgroup of those are trajectories for which the decision at time t coincide with strategy g , we call such subset M g t . Metrics build on these sets can be defined such as the Match Count |M g t | or the Cover age rate , the fraction of observ ations at time t for which the clinician’ s action coincides with the target strategy’ s pre- scription ρ g t = |M g t | |D g t | . V alues of ρ g t close to one indicate that the target strategy lar gely agrees with observed clinical practice at that epoch, a necessary (though not sufficient) condition for positivity . It should be read alongside with the match count because the apparent agreement may be an artifact of selection rather than genuine ov erlap. The metrics above are summed ov er trajectories, thus might fail to spot an under-represented type of patient. As dynamic strategies are triggered by patient characteristics, this might pose a problem if the set of patient triggering a strategy is not well-represented. If for e xample a discharge strat- egy is ov erly conservati ve compared to natural course, all patient will be discharged before they can trigger the con- servati ve strategy , and we won’t be able to really ev aluate such strategy . T o uncover such cases, we have computed the abov e metrics separately depending on treatment decision at time t for dynamic strategies. In Appendix B we perform additional checks e.g. on Effecti ve Sample Size ratio and visualisation of positivity violations. 3.4 MODELLING Longitudinal observ ational data may contain treatment- confounder feedback, i.e, when past treatment af fects sub- sequent confounders, which then influence later treatment decisions. The Parametric G-formula is a causal inference method designed to tackle this problem, allowing for the estimation of the ef fects of time-varying treatment strategies using such observ ational datasets. The method is based on Robins’ g-formula [Robins, 1986, 1987], which character- izes the distribution of outcomes under a specified treatment strategy in terms of the full set of conditional densities of the observed data. Under the identification assumptions men- tioned abov e, we identify E [ Y t d ( ¯ A g t d − 1 )] by ψ ( g ) = X ¯ ℓ t d − 1 ∈ ¯ L X ¯ a t d − 1 ∈ ¯ A E h Y g t d | ¯ ℓ g t d − 1 , ¯ a g t d − 1 , ¯ y g t d − 1 = ¯ 0 i × f ( ¯ ℓ g t d − 1 , ¯ a g t d − 1 , ¯ y g t d − 1 = ¯ 0) where ¯ 0 is short-hand for a history of surviv al up to that point, and f the probability density . Let us shorten said density as f ( ... ) . In the classic set-up, this joint distribution can be factorised assuming that at each draw , death is first sampled, then in case of surviv al covari- ates are sampled next and finally the treatment is chosen with a deterministic dynamic treatment strategy g , yet all that, almost instantaneously . Y et in our setup, due to the difference in terms of outcome occurrence when under or not under treatment, we posit two outcome models: one for in-ICU death that has access to all the cov ariates and one for post-ICU death that only has access to cov ariates observed until discharge at τ g . W e assume that conditioning on co- variates observed during treatment and current treatment history is enough to get the independence at further steps. W e can then rewrite the joint distribution as: f ( ... ) = h τ g Y t =0 f ℓ g t | ¯ ℓ g t − 1 , ¯ a g t = ¯ 1 , ¯ y g t = ¯ 0 i × h τ g Y t =0 f ¯ y g t = ¯ 0 | ¯ ℓ g t − 1 , ¯ a g t − 1 = ¯ 1 , ¯ y g t − 1 = ¯ 0 i × h t d Y t = τ g +1 f ¯ y g t = ¯ 0 | ¯ ℓ g τ g , ¯ a g t − 1 , ¯ y g t − 1 = ¯ 0 i As often done in g-formula computation, we assume a sta- ble Marko v process, i.e. we take the causal mechanisms to be stable across time points. W e specify a model for each f L g | ¯ ℓ g , ¯ a g = ¯ 1 , ¯ y g = ¯ 0 , f Y g | ¯ ℓ g , ¯ a g = ¯ 1 , ¯ y g = ¯ 0 and f Y g | ¯ ℓ g τ g i , ¯ a, ¯ y g = ¯ 0 , using a generalised lin- ear model estimated with the package statsmodels [Seabold and Perktold, 2010]. Distributional families are further specified in Appendix A.2 along with the summari- sation of the history . 3.5 NON-ITERA TIVE CONDITIONAL EXPECT A TION ESTIMA TOR (NICE) W e use the Non-Iterativ e Conditional Expectation (NICE) estimator [Robins, 1986, 1987] as implemented in the pygformula package [McGrath et al., 2020]. It is com- posed of three steps: (i) estimating the density models from the observed data, (ii) simulating patients trajectory under strategy g with forward Monte Carlo sampling, (iii) comput- ing ˆ ψ ( g ) using the simulated final outcomes. The current implementation does not allo w for different models for the outcome with and without treatment. T o accommodate that, we updated the simulation algorithm. 3.5.1 Monte Carlo Simulation The Monte Carlo simulation under the intervention strat- egy g takes place for each subject i = 1 , . . . , N ov er t = 0 , . . . , T and noted ℓ g , ∗ i,t : Initialization ( t = 0 ): draw ℓ ∗ 0 ,i from the empirical distri- bution of L 0 in the observed data and e valuate a g , ∗ 0 ,i . Recurrence ( T ≥ t ≥ 1 ): • Sample the outcome: – if a g , ∗ i,t − 1 = 1 : y g , ∗ i,t ∼ f Y g | ¯ ℓ g , ∗ t − 1 , ¯ a g , ∗ t − 1 = ¯ 1 , ¯ y g , ∗ t − 1 = ¯ 0 – if a g , ∗ i,t − 1 = 0 : y g , ∗ i,t ∼ f Y g | ¯ ℓ g τ g, ∗ i , ¯ a g , ∗ t − 1 , ¯ y g , ∗ t − 1 = ¯ 0 • If y g , ∗ i,t = 1 : – set y g , ∗ i,T = 1 and stop the simulation, • If y g , ∗ i,t = 0 : – If a g , ∗ i,t − 1 = 1 : sample the cov ariates ℓ g , ∗ i,t ∼ f L g | ¯ ℓ g , ∗ t − 1 , ¯ a g , ∗ t = ¯ 1 , ¯ y g , ∗ t = ¯ 0 and determine the new treatment: a g , ∗ i,t = g t ¯ ℓ g , ∗ i,t , ¯ a g , ∗ i,t − 1 . – Incrementation: * If t = T : stop the simulation, * If t < T increment t ← t + 1 . 3.5.2 Mean Outcome Estimator The causal mean outcome of 90-day mortality is approxi- mated via simulation ov er the N synthetic subjects: ˆ ψ ( g ) = 1 N N X i =1 y g , ∗ i,T = 1 N N X i =1 y g , ∗ i,t d The av erage length of stay in ICU is obtained similarly via the simulation. 3.6 EXPERIMENT AL DESIGN 3.6.1 Data and Pre-pr ocessing: MIMIC-IV Data for this study were deriv ed from the Medical Infor- mation Mart for Intensiv e Care (MIMIC-IV , v4.1) database [Johnson et al., 2024] that comprises adult ICU admissions recorded at Beth Israel Deaconess Medical Center (Boston, MA) between 2008 and 2019. W e used the BlendedICU pipeline [Oli ver et al., 2023] to further standardize patient- lev el variables and ensure consistent representation of de- mographics, drug exposures, laboratory measurements, and physiological time-series data. Each admission preserves its full, v ariable-length ICU trajectory , allo wing patient-specific follow-up durations. 3.6.2 T arget T rial Emulation W e frame the ev aluation of ICU discharge strategies as a target trial emulation, in which candidate strategies are e val- uated against the clinical practice implicitly observed in the data. The target trial is defined by the following components [Cashin et al., 2025]. Inclusion and exclusion criteria W e e xclude stays shorter than 12 hours and stays which hav e baseline charac- teristics missing - age, sex, and admission origin. Outcome of interest The binary outcome of interest Y is 90-day all-cause mortality defined as death occurring either inside the ICU or after discharge within follow-up time T = 90 days [Schoenfeld, 2005]. W e estimate the total effect of ICU discharge strategy from 12 hours after ICU admission thus we thus only study patients aliv e after 12 hours. The associated causal question can be formulated as If the patient survives the first 12 hours, what is the average effect of a dischar ge strate gy on 90 days all-cause mortality (in-ICU death or post-dischar ge death)? Covariates The set of covariates { L } , which are con- founders for the decisions and outcomes, was defined to in- clude variables that plausibly influence both ICU dischar ge decision-making and the outcome of interest, using clini- cian expertise and pre vious literature [Knight, 2003]. Three baseline cov ariates were included: age, sex, and admission origin. These variables were treated as fixed throughout the ICU stay and were included to account for baseline patient characteristics and structural dif ferences in care pathways. In ICU workflow , the patient status is re viewed regularly and discharge readiness is reassessed approximately twice daily . T o align the temporal resolution of the data with clinical practice, each ICU admission was discretized into consec- utiv e, non-overlapping windo ws of 12 hours. W ithin each windo w , we have considered 18 time-v arying cov ariates that capture e volving physiological status, laboratory measure- ments, and respiratory support. Covariates were summarised within each window using either the mean value ov er the recent past or the most recently observed v alue, depending on the clinical con vention by which the variable is typically interpreted during dischar ge decision-making. The time- varying co variates are summarised in T able 3 in appendix A.3, along with their aggregation method, the distribution they follo w and more details on cov ariates processing. Strategies W e consider both static discharge strate gies ap- ply equally to all patients, and dynamic discharge strategies that recommend discharge conditional on patient history ev- ery 12 hours. Under these strategies, ICU discharge is mod- elled as an absorbing intervention: once discharge occurs, the patient exits the ICU cohort and no further ICU-level interventions are applied. 3.6.3 Assumption Sanity Checks Here we discuss and ev aluate the plausibility of the assump- tions needed by the parametric g-formula. Stable Unit T r eatment V alue (SUTV A) This assumption requires (i) well-defined interventions and (ii) no interfer- ence between units. Regarding (ii), we hav e assumed that the number of beds in the Beth Israel Deaconess Medical Centre was enough to limit interference (77 according to their web- site). W e have included all the stays of patients, yet 18.9% of the whole discharged population in the MIMIC data are readmitted in the first 90 days, making the admissions not entirely independent. A large part of those readmissions, about 12.24% of the discharged patients, are readmitted within a day after discharge. This makes the treatment defi- nition less sharp since some patients actually recei ve “extra” care in a second admission and are not allo wed to take the full risk of discharge until the end of follow-up after the first admission. Apart from that, intervention w as explicitly de- fined in section 3.6.2, and discharge strate gies are defined as deterministic rules mapping patient history on the 12-hour grid, constituting a well-defined intervention. No unmeasured confounders (NUC) Assumptions re- garding cov ariate selection, causal structure, and the speci- fication of discharge strategies were formulated in consul- tation with ICU clinicians. It is formally impossible to test for unmeasured confounders Schulz et al. [2023]. The use of instrumental v ariables could help [Guo et al., 2014], but we did not have access to one and had to rely on clinician expertise. The impact of NUC violation is most important when the unmeasured confounders and the measured ones are uncorrelated [Schulz et al., 2023], which, in our case, giv en the variables included, is ar guably unlikely . Positi vity and Coverage There is certainly not enough variability in the data for all the possible strategies to be properly e valuated; indeed, in current care very sick patients are usually kept, and very healthy patients are discharged. Focusing on the strategies listed at the end of this section, we applied the positivity checks described in section 3.3. 3.6.4 Model Specification Sanity Checks T o assess the internal validity and plausibility of the esti- mated effects, we conducted the follo wing diagnostic and sanity checks. Covariates specification Distributional assumptions were informed by empirical inspection of variable distrib utions and selected from the predefined families supported by the pygformula framew ork, supplemented by exploratory fitting using the Fitter package [Cokelaer, 2016–]. W e checked the congruence of the simulation of natural course with the distribution observed in the historical data, by checking Standardized Mean Distance (SMD) variable-wise ov er time (see figure 6 in Appendix C and comparisons of empirical distributions in Figures 7 and 8). Outcomes specification W e ev aluated whether the g- formula could recover observ ed outcomes under the natural course strate gy . Agreement between estimated and observed post-discharge mortality provides evidence against major model misspecification. Statistically significant de viations may indicate violations of modelling assumptions, unmea- sured confounding, or data sparsity at longer ICU stays. T o do so, we assumed a Markov-Process where the treat- ment attribution only depend on current cov ariates ( f ¯ a g i,t | ¯ ℓ g t , ¯ a g t = ¯ 1 , ¯ y g t = ¯ 0 = f ¯ a g i,t | ℓ g t , ¯ a g t = ¯ 1 , ¯ y g t = ¯ 0 ). Static discharge strategies As a proof of concept, we ev aluate simple static dischar ge strategies under which all patients are discharged after a fixed mount of ICU stay (e.g. after 3 days), irrespective of their clinical status. These strategies are not intended to be clinically meaningful or safe; rather , they serve as a transparent and easily inter- pretable benchmark. By comparing outcomes under these deterministic time-based rules, which do not consider pa- tient physiology , to those observed under usual care and alternativ e dynamic strategies, we illustrate that the pro- posed framew ork produces sensible estimates. 3.6.5 Dynamic strategies evaluation W e ev aluate two dynamic strategies. The first, inspired by Knight [2003], requires sustained physiological stability across respiratory , cardiov ascular, neurological, and bio- chemical domains before ICU transfer . Patients are deemed ready for discharge only when predefined thresholds for oxygenation, haemodynamics, neurological status, and key laboratory parameters are met. The complete definition of this strategy is provided in Appendix A.4. The second is inspired by the recommendation of the guidelines ([Nates et al., 2016], T able 2 p.1559). Such strategy continues ICU care only when ICU-specific treatments are needed, and otherwise discharges, assuming the patient can be cared for in other wards. More precisely , patients are dischar ged unless predefined physiological red flags indicate se vere res- piratory , hemodynamic, neurologic or metabolic instability . This strategy–referred to as DS1–is detailed in T able 1. 4 RESUL TS 4.1 D A T A DESCRIPTION The study cohort comprised 82,480 ICU admissions from 60,616 unique patients in MIMIC-IV . ICU length of stay (ad- ministrativ ely truncated at 90 days to align with the follow- up window) had a median of 2.14 days (IQR 1.27-4.11) with a mean of 3.93 days, showing a right-ske wed distribution. The distribution of stays were 13% exceeded 7 days, 4.5% exceeded 14 days, and 0.8% exceeded 30 days. Overall, 7.38% of admissions resulted in in-ICU death, while 12.7% died follo wing ICU discharge within the 90-day follow-up, yielding a composite 90-day all-cause mortality of 20.08%. Consequently , 92.6% of admissions were discharged ali ve from the ICU. 4.2 POSITIVITY AND CO VERA GE The results of such checks are reported in Figure 2 and Ap- pendix B. In such plots, natural course is the upper bound for match count and coverage rate. The static strategy of discharging at day 3 has a match count o ver 20,000 and co v- erage around 0.8 until the time where it discharges patients. At discharge time, metrics deteriorates (cov erage around 0.2, match count of 3,321 for discharge at 72h) (Figures 3 and 4). Both dynamic strategies seem to have good results for these two metrics: over 10,000 match count and 0.6 cov erage (Figure 3). Y et, when splitting depending on the decision at time t , we observe that no patients are discharged under Knight strategy (match count of 0) and only few with the DS1 strategy (match count of 3,476 the first 12 hours then less than 10) (Figure 2). This was missed by the first metrics due to the f act that match count and co verage were dro wned by the kept patients, for which Knight and DS1 strategy are close to natural course (match count over 10 3 and cov erage around 0.8). This amount of data hides the support issue. V isualizations after application of PCA further support this conclusion (Figure 5). 4.3 CHECKS ON THE SIMULA TION Sanity check on covariate distribution Across both clini- cal endpoints discharge and in-ICU death, the natural course simulation closely reproduces the empiricial covariate distri- butions observed in MIMIC-IV , as shown in Figures 8 and 7. At discharge, physiologic v ariables reflecting clinical stabil- ity (heart rate, mean arterial pressure, respiratory rate, tem- perature, hemoglobin, bicarbonate, and arterial blood gases) exhibit almost complete o verlap of distributions. Oxygena- tion measures (SpO2, PaO2, O2 flow), renal markers (creati- nine, ureum, urine output), and lactate similarly show highly right-ske wed distrib utions. At in-ICU death, where the phys- iology deranges severely (e.g., elev ated lactate and crea- tinine, broader respiratory distributions, lower GCS), the simulated natural course preserv es both the hea vier tails and distributional shifts seen in the observed data. The categori- cal distribution of v entilation model is also well aligned at both end points. The consistency of these high-dimensional distributional matches across both states providing empiri- Component Clinical decision rule (12-hour grid) Respiratory failure In vasi ve controlled ventilation; OR SpO 2 < 85% ; OR O 2 flow > 85 ; OR (ventilation mode unknown AND [SpO 2 < 85% OR O 2 flow > 85 OR PaCO 2 > 80 OR respiratory rate > 45 /min]). Hemodynamic instability Mean arterial pressure < 50 mmHg; OR lactate > 6 mmol/L; OR heart rate > 160 /min. Neurologic failure Glasgow Coma Scale < 6 . Sev ere metabolic derangement Arterial bicarbonate < 10 mmol/L. T able 1: Dynamic discharge strategy (DS1) based on physiologic need for organ support: ICU care is continued if any of the red flags abov e are present, otherwise patients are discharged. All-cause mortality (%) Difference to Mortality split (%) Length of ICU stay (days) Intervention Observed G-formula estimate natural course (%) In ICU After dischar ge Median (IQR) Mean Natural course 20.08 19.1 (18.4, 21.5) – – 6.2 12.9 2.00 (1.00–4.00) 3.44 Discharge 3rd day – 17.4 (16.7, 20.1) -1.8 (-3.3, 0.5) 5.2 12.2 3 (3–3) 3 Strategy DS1 – 18.0 (15.8, 18.9) -1.2 (-4.4, -0.6) 3.6 14.4 0.5 (0.5–1.0) 1.76 Strategy [Knight, 2003] – 86.0 (83.4, 89.4) +66.9 (63.5, 69.5) 85.5 0.5 35.0 (15.5–62.5) 40.56 T able 2: Estimated 90-day all-cause mortality (in-ICU or post-dischar ge death) under dynamic and static dischar ge strategies using the parametric g-formula (NICE estimator). Mean and 95% confidence intervals are sho wn. Follo w-up corresponds to 180 half-day intervals (90 days). cal evidence that the natural course model has successfully replicated the implicit strategy in the MIMIC-IV data. Natural Course V alidation Under the natural course (observed dischar ge strategy in MIMIC-IV), the observed or true 90-day mortality was 20.08%. The parametric g- formula estimate under the natural course was 19.1% with a 95% CI 18.4%-21.5%. The observed value lying within the confidence interv al indicates good internal calibration of the models for time-varying cov ariates, discharge decisions, in-ICU death, and post-discharge mortality . This supports the adequacy of model specification. Under the observed natural course, 7.38% of patients died in the ICU and 12.9% died after discharge, corresponding to approximately 38.6% and 61.4% of all deaths, respectiv ely . Static strategy (Discharge on 3rd day in the ICU) W e ev aluated a static intervention that discharges all patients on ICU day 3 (12-hour grid). Under this strategy , the esti- mated 90-day mortality was 17.4% (95% CI: 16.7%-20.1%). Compared with natural course, this corresponds to a risk reduction of 1.8 percentage points (95% CI: -3.3 to 0.5) as reported in T able 2. The reduced in-icu mortality of 5.2% is in accordance to an early discharge. The post-discharge mor- tality only marginally decreases by 0.7 percentage points. Although the point estimate suggests lower mortality under day-3 discharge, the confidence interval for the mean dif- ference includes the null, indicating statistical uncertainty regarding the presence and direction of ef fect. Dynamic strategy Knight Under the Knight discharge strategy , the estimated 90-day mortality was 86.0% (95% CI: 83.4%–89.4%), corresponding to an absolute risk increase of 66.9 percentage points relative to the natural course (95% CI: 63.5 to 69.5). The confidence interval excludes the null, indicating a statistically significant and substantial increase in mortality under this strategy . Decomposition of mortality shows that 85.5% of patients died in the ICU and only 0.5% after discharge, indicating that nearly all deaths occurred inside the ICU. The strategy is highly conservati ve, as dischar ge requires all physiological criteria to be simultaneously satisfied, resulting in markedly prolonged ICU stays (median 35.0 days [IQR 15.5–62.5]; mean 40.56 days). This extended exposure to ICU-level sev erity is reflected in the extreme concentration of deaths within the ICU and e xplains the increase in ov erall mortality under this strategy . Dynamic strategy DS1 The dynamic strategy DS1 yielded an estimated 90-day mortality of 18.0% (95% CI: 15.8%-18.9%). Relative to the natural course, this corre- sponds to an absolute risk reduction of 1.2 percentage points (95% CI: -4.4 to -0.6). The point estimate suggests lower ov erall mortality under the DS1 discharge strate gy that bal- ances physiological stability with conditions manageable outside the ICU. The confidence interv al for the mean dif- ference excludes zero, indicating a statistically significant reduction in mortality compared with the natural course. Mortality decomposition shows that in-ICU deaths de- creased to 3.6% (from 6.2% under natural course), whereas post-discharge mortality increased slightly to 14.4% (from 12.9%). This pattern indicates partial redistrib ution of deaths from the ICU to the post-dischar ge period. The strategy w as also associated with substantially shorter ICU stays (median 0.5 days [IQR 0.5–1.0]; mean 1.76 days), as expected from a more “aggressiv e” discharge strategy . 0 1 0 0 1 0 1 1 0 2 1 0 3 1 0 4 1 0 5 Match count P ositivity And Coverage Diagnostics Over T ime 20 40 60 80 100 120 0.0 0.5 Coverage rate Natural Course (k ept at time t) Natural Course (discharged at time t) Knight Strategy (k ept at time t) Knight Strategy (discharged at time t) DS1 Strategy (k ept at time t) DS1 Strategy (discharged at time t) Figure 2: Positivi ty and coverage diagnostics ov er time for all ev aluated dynamic strategies separated between patients kept and dischar ged. T op: coverage rate (fraction of history- compatible observations at epoch t for which the clinician’ s action matches the tar get strategy’ s prescription). Bottom: absolute match count (fraction of history-compatible obser- vations at epoch t for which the clinician’ s action matches the target strate gy’ s prescription and the decision at time t ). 5 DISCUSSION In this paper we proposed a framework to ev aluate strate- gies to discharge patients from the ICU, pooling together clinical expertise with techniques from Causal Inference and Reinforcement Learning. Our implementation modi- fied the existing pygformula package to allo w handling of scenarios where stopping the intervention pre vents us from observing covariate ev olution. W e then suggested a way to appraise the estimate of potential outcome by running positivity and co verage checks. Finally , we sho wcased this methodology by applying it to real-world ICU data and tested a few clinically-motiv ated dynamic strategies. Our results chart a way forward in solving this problem but also underscore the complexity of off-policy ev aluation in the ICU en vironment. Strengths. The code used in this paper is fully open source, as is the dataset, hence our results are fully replica- ble and can function as a useful starting point for further studies. Both our workflow and our results are vetted by clinicians, ensuring the plausibility of modelling decisions, e.g. discharge strategies to consider . Furthermore, while our use case is clinical, the math and the code are easily generalizable to any other scenario with a similar structure. Limitations. Our results are also subject to some lim- itations. On the side of the estimation, the identification of effects via the g-formula requires the standard assump- tions of SUTV A, positi vity and no unmeasured confounders. The NICE estimator we employed requires causal mecha- nisms to be stable across time steps; we also assumed all models used within NICE to be generalized linear . Finally , our landmarking approach for estimating post-stopping out- comes assumes that we can obtain unbiased estimates of said outcome with only covariates at the time of stopping and information concerning time itself. The last assumption in particular is what needs to be added when employing our approach to handle missing cov ariates after the stopping decision is taken. In the case of ICU discharge, this assumption may not hold if for instance there are unmeasured confounders influencing the quality of care patients receive post discharge. When inspecting the outcome models, we find the post-discharge estimates a tad too flat across strategies and the in-ICU estimates too extreme for long stays (as seen for the Knight strategy), which suggest that more work on the modelling might be needed. W e also made some simplifications on the data processing side. While our representations of ICU patient are quite rich, they still did not contain information e.g. on diagnoses or medications–although they did contain information about settings of mechanical ventilation. Patients were also not ‘allo wed’ to be readmitted in the ICU once discharged. More- ov er, our discrete-time vie w on the data generation process and related simulation assumes a sequential flow (first check if patient is alive at this time step, then generate covari- ates, then make stopping decision) which may ov er-simplify reality . In light of these assumptions, despite having found a strat- egy with statistically significant improvement o ver natural course, we stress that the results require more thorough clini- cal in vestigation before being used to influence clinical care. In particular , clinicians need to be in volved when assessing the desired trade-off between mortality outcome and length of stay in the ICU. This disclaimer notwithstanding, there are some checks reassuring us that there are no gross vio- lations in the capturing of the causal mechanisms. One of them is the verification that the simulation of natural course is able to “reconstruct” the observed data. Concerning the larger goal of finding an optimal stopping strategy for the scenarios we are interested in, our work provides a first b uilding block for algorithmic search of op- timal strategy , insofar as this process can be conceiv ed as an “oracle” returning the potential outcome giv en a strategy g (keeping fix ed the observational dataset). Future work in this direction will in vestigate how such search can be per- formed in presence of obstacles such as non-dif ferentiable threshold-based strategies and discrete v ariables in the sim- ulations. References Aidan G. Cashin, Harrison J. Hansford, Miguel A. Hernán, Sonja A. Swanson, Hopin Lee, Matthe w D. Jones, Issa J. Dahabreh, Barbra A. Dickerman, Matthias Egger , Xa- bier Garcia-Albeniz, Robert M. Golub, Nazrul Islam, Sara Lodi, Margarita Moreno-Betancur, Sallie-Anne Pear- son, Sebastian Schneeweiss, Melissa K. Sharp, Jonathan A. C. Sterne, Elizabeth A. Stuart, and James H. McAuley . T ransparent Reporting of Observational Studies Emulat- ing a T ar get Trial—The T ARGET Statement. J AMA , 334 (12):1084–1093, 2025. doi: 10.1001/jama.2025.13350. Bibhas Chakraborty and Erica EM Moodie. Statistical meth- ods for dynamic tr eatment r e gimes , volume 2. Springer , 2013. Ev angelia Christodoulou, Jie Ma, Gary S. Collins, Ewout W . Steyerber g, Jan Y . V erbakel, and Ben V an Calster . A sys- tematic revie w shows no performance benefit of machine learning ov er logistic regression for clinical prediction models. J ournal of Clinical Epidemiology , 110:12–22, 2019. doi: 10.1016/j.jclinepi.2019.02.004. Jesse Clifton and Eric Laber . Q-Learning: Theory and Ap- plications. Annual Review of Statistics and Its Applica- tion , 7(V olume 7, 2020):279–301, 2020. doi: 10.1146/ annurev-statistics- 031219- 041220. Thomas Cokelaer . fitter: A python package for fitting probability distributions. https://github.com/ cokelaer/fitter , 2016–. V ersion 1.7.1, accessed 25 February 2026. Nick Daneman, Asgar H Rishu, W ei Xiong, Sean M Bagshaw , Peter Dodek, Richard Hall, Anand Kumar , Fran- cois Lamontagne, Francois Lauzier , John Marshall, et al. Duration of antimicrobial treatment for bacteremia in canadian critically ill patients. Critical car e medicine , 44 (2):256–264, 2016. Nina Deliu and Bibhas Chakraborty . Dynamic T reatment Regimes for Optimizing Healthcare. In Xi Chen, Stef anus Jasin, and Cong Shi, editors, The Elements of Joint Learn- ing and Optimization in Operations Management , vol- ume 18, pages 391–444. Springer International Publish- ing, Cham, 2022. doi: 10.1007/978- 3- 031- 01926- 5_15. Leon Deng, Hong Xiong, Feng W u, Sanyam Kapoor , Soumya Ghosh, Zach Shahn, and Li-wei H Lehman. Un- certainty Quantification for Conditional Treatment Ef fect Estimation under Dynamic Treatment Re gimes. Pr oceed- ings of machine learning r esear ch , 259:248–266, 2024. Thomas S Ferguson. Who solved the secretary problem? Statistical science , 4(3):282–289, 1989. X. Garcia-Albeniz, J.M. Chan, A. Paciorek, R.W . Lo- gan, S.A. K enfield, M.R. Cooperberg, P .R. Carroll, and M.A Hernán. Immediate versus deferred initiation of androgen depriv ation therapy in prostate cancer pa- tients with PSA-only relapse. An observational follow- up study . Eur opean Journal of Cancer , 51(7):817–824, May 2015. ISSN 09598049. doi: 10.1016/j.ejca.2015. 03.003. URL https://linkinghub.elsevier. com/retrieve/pii/S0959804915002191 . Omer Gottesman, Fredrik Johansson, Matthieu K o- morowski, Aldo Faisal, David Sontag, Finale Doshi- V elez, and Leo Anthony Celi. Guidelines for reinforce- ment learning in healthcare. Natur e Medicine , 25(1): 16–18, January 2019. ISSN 1546-170X. doi: 10.1038/ s41591- 018- 0310- 5. URL https://www.nature. com/articles/s41591- 018- 0310- 5 . Zijian Guo, Jing Cheng, Scott A. Lorch, and Dylan S. Small. Using an instrumental variable to test for unmeasured confounding. Statistics in medicine , 33(20):3528–3546, 2014. doi: 10.1002/sim.6227. Harrison J. Hansford, Aidan G. Cashin, Matthew D. Jones, Sonja A. Swanson, Nazrul Islam, Susan R. G. Douglas, Rodrigo R. N. Rizzo, Jack J. Dev onshire, Sam A. W illiams, Issa J. Dahabreh, Barbra A. Dicker- man, Matthias Egger , Xabier Garcia-Albeniz, Robert M. Golub, Sara Lodi, Margarita Moreno-Betancur , Sallie- Anne Pearson, Sebastian Schneeweiss, Jonathan A. C. Sterne, Melissa K. Sharp, Elizabeth A. Stuart, Miguel A. Hernán, Hopin Lee, and James H. McAuley . Report- ing of Observational Studies Explicitly Aiming to Em- ulate Randomized T rials: A Systematic Revie w . J AMA Network Open , 6(9):e2336023, September 2023. ISSN 2574-3805. doi: 10.1001/jamanetworkopen.2023.36023. URL https://jamanetwork.com/journals/ jamanetworkopen/fullarticle/2809945 . Maike Hiller , Christian Burisch, Maria W ittmann, Hendrik Bracht, Arnold Kaltwasser , and Jan Bakker . The current state of intensi ve care unit discharge practices-results of an international surve y study . F r ontiers in Medicine , 11: 1377902, 2024. Alistair Johnson, Lucas Bulgarelli, T om Pollard, Brian Go w , Benjamin Moody , Ste ven Horng, Leo Anthony Celi, and Roger Mark. MIMIC-IV. PhysioNet , October 2024. doi: 10.13026/kpb9- mt58. URL https://doi.org/10. 13026/kpb9- mt58 . V ersion 3.1. Ruth H. K eogh, Jon Michael Gran, Shaun R. Seaman, Gwyneth Davies, and Stijn V ansteelandt. Causal in- ference in surviv al analysis using longitudinal obser- vational data: Sequential trials and marginal structural models. Statistics in Medicine , 42(13):2191–2225, June 2023. ISSN 0277-6715, 1097-0258. doi: 10.1002/sim. 9718. URL https://onlinelibrary.wiley. com/doi/10.1002/sim.9718 . Gillian Knight. Nurse-led discharge from high dependency unit. Nursing in Critical Car e , 8(2):56–61, 2003. doi: 10.1046/j.1478- 5153.2003.00009.x. Matthieu Komoro wski, Leo A. Celi, Omar Badawi, An- thony C. Gordon, and A. Aldo F aisal. The Artificial Intel- ligence Clinician learns optimal treatment strategies for sepsis in intensi ve care. Natur e Medicine , 24(11):1716– 1720, Nov ember 2018. ISSN 1546-170X. doi: 10.1038/ s41591- 018- 0213- 5. URL https://www.nature. com/articles/s41591- 018- 0213- 5 . Fernando Lejarza, Jacob Calvert, Misty M. Attwood, Daniel Evans, and Qingqing Mao. Optimal discharge of pa- tients from intensi ve care via a data-dri ven policy learn- ing framework. Operations Researc h for Health Car e , 38:100400, 2023. doi: 10.1016/j.orhc.2023.100400. Elisa F Long and Kusum S Mathews. The boarding patient: effects of icu and hospital occupancy surges on patient flow . Pr oduction and operations management , 27(12): 2122–2143, 2018. Etienne Maheux, Igor Ko val, Juliette Ortholand, Colin Birkenbihl, Damiano Archetti, V incent Bouteloup, Stéphane Epelbaum, Carole Dufouil, Martin Hofmann- Apitius, and Stanley Durrleman. Forecasting individ- ual progression trajectories in Alzheimer’ s disease. Na- tur e Communications , 14(1):761, 2023. doi: 10.1038/ s41467- 022- 35712- 5. Sean McGrath, V ictoria Lin, Zilu Zhang, Lucia C. Pe- tito, Roger W . Logan, Miguel A. Hernán, and Jessica G. Y oung. gfoRmula: An R Package for Estimating the Effects of Sustained Treatment Strategies via the Para- metric g-formula. P atterns , 1(3):100008, 2020. doi: 10.1016/j.patter .2020.100008. Erica E. M. Moodie, Robert W . Platt, and Michael S. Kramer . Estimating Response-Maximized Decision Rules With Applications to Breastfeeding. Journal of the Ameri- can Statistical Association , 104(485):155–165, March 2009. ISSN 0162-1459, 1537-274X. doi: 10.1198/ jasa.2009.0011. URL http://www.tandfonline. com/doi/abs/10.1198/jasa.2009.0011 . S. A. Murphy , M. J. van der Laan, and J. M. Robins. Marginal Mean Models for Dynamic Re gimes. Journal of the American Statistical Association , 96(456):1410–1423, 2001. doi: 10.1198/016214501753382327. Joseph L Nates, Mark Nunnally , Ruth Kleinpell, San- dralee Blosser, Jonathan Goldner , Barbara Birriel, Clara S Fo wler , Diane Byrum, William Scherer Miles, Heather- lee Bailey , et al. Icu admission, discharge, and triage guidelines: a framework to enhance clinical operations, de velopment of institutional policies, and further research. Critical car e medicine , 44(8):1553–1602, 2016. Matthieu Oli ver , Jérôme Allyn, Rémi Carencotte, Nicolas Allou, and Cyril Ferdynus. Introducing the BlendedICU dataset, the first harmonized, international intensiv e care dataset. Journal of Biomedical Informatics , 146:104502, 2023. doi: 10.1016/j.jbi.2023.104502. Martijn Otten, Ameet R Jagesar , T ariq A Dam, Laurens A Biesheuvel, Floris den Hengst, Kirsten A Ziesemer, Patrick J Thoral, Harm-Jan de Grooth, Armand RJ Girbes, V incent François-La vet, et al. Does reinforcement learn- ing improv e outcomes for critically ill patients? a system- atic revie w and lev el-of-readiness assessment. Critical car e medicine , 52(2):e79–e88, 2024. J. M. Robins. Errata to “a new approach to causal intefence in mortality studies with a sustained exposure period— application to control of the healthy worker survi vor ef- fect” Mathl Modelling 7(9–12), 1393–1512 (1986). Com- puters & Mathematics with Applications , 14(9):917–921, 1987. doi: 10.1016/0898- 1221(87)90237- 9. James Robins. A new approach to causal inference in mortal- ity studies with a sustained exposure period—application to control of the healthy worker surviv or effect. Math- ematical Modelling , 7(9-12):1393–1512, 1986. doi: 10.1016/0270- 0255(86)90088- 6. John Rust. Optimal replacement of gmc bus engines: An em- pirical model of harold zurcher . Econometrica: Journal of the Econometric Society , pages 999–1033, 1987. David Schoenfeld. Survi val methods, including those using competing risk analysis, are not appropriate for intensiv e care unit outcome studies. Critical Car e , 10(1):103, 2005. doi: 10.1186/cc3949. Juliana Schulz, Erica E M Moodie, and Susan M Shortreed. NO UNMEASURED CONFOUNDING: KNO WN UN- KNO WNS OR. . . NO T? American Journal of Epidemiol- ogy , 192(9):1604–1605, June 2023. ISSN 0002-9262. doi: 10.1093/aje/kwad133. URL https://pmc.ncbi. nlm.nih.gov/articles/PMC10666970/ . Skipper Seabold and Josef Perktold. Statsmodels: Econo- metric and statistical modeling with python. SciPy 2010 , 2010. doi: 10.25080/Majora- 92bf1922- 011. URL https://doi.org/10.25080/ Majora- 92bf1922- 011 . Louisa H. Smith, Xabier García-Albéniz, June M. Chan, Shoujun Zhao, Janet E. Cowan, Jeanette M. Broer- ing, Matthew R. Cooperberg, Peter R. Carroll, and Miguel A. Hernán. Emulation of a target trial with sus- tained treatment strategies: an application to prostate cancer using both inv erse probability weighting and the g-formula. Eur opean J ournal of Epidemiology , 37(12):1205–1213, December 2022. ISSN 0393- 2990, 1573-7284. doi: 10.1007/s10654- 022- 00929- 7. URL https://link.springer.com/10.1007/ s10654- 022- 00929- 7 . Megan Su, Stephanie Hu, Hong Xiong, Elias Baedorf Kassis, and Li-wei H Lehman. Counterfactual Sepsis Outcome Prediction Under Dynamic and T ime-V arying T reatment Regimes. AMIA Summits on T ranslational Science Pr o- ceedings , 2024:285–294, 2024. Sarah L T aubman, James M Robins, Murray A Mittleman, and Miguel A Hernán. Intervening on risk factors for coronary heart disease: an application of the parametric g-formula. International Journal of Epidemiology , 38 (6):1599–1611, December 2009. ISSN 1464-3685, 0300-5771. doi: 10.1093/ije/dyp192. URL https:// academic.oup.com/ije/article- lookup/ doi/10.1093/ije/dyp192 . Patrick J. Thoral, Mattia Fornasa, Daan P . de Bruin, Michele T onutti, Hidde Hov enkamp, Ronald H. Driessen, Armand R. J. Girbes, Mark Hoogendoorn, and Paul W . G. Elbers. Explainable Machine Learning on AmsterdamUMCdb for ICU Dischar ge Decision Support: Uniting Intensivists and Data Scientists. Critical Car e Explorations , 3(9): e0529, 2021. doi: 10.1097/CCE.0000000000000529. Gael V aroquaux, Sasha Luccioni, and Meredith Whittaker . Hype, Sustainability , and the Price of the Bigger-is-Better Paradigm in AI. In Pr oceedings of the 2025 ACM Con- fer ence on F airness, Accountability , and T ranspar ency , F AccT ’25, pages 61–75, New Y ork, NY , USA, 2025. Association for Computing Machinery . doi: 10.1145/ 3715275.3732006. Kerollos Nashat W anis, Arin L. Madenci, Sicheng Hao, Mira Moukheiber , Lama Moukheiber, Dana Moukheiber , Sulaiman Moukheiber , Jessica G. Y oung, and Leo An- thony Celi. Emulating T arget T rials Comparing Early and Delayed Intubation Strategies. CHEST , 164(4):885–891, October 2023. ISSN 00123692. doi: 10.1016/j.chest.2023. 04.048. URL https://linkinghub.elsevier. com/retrieve/pii/S0012369223006505 . Hong Xiong, Feng W u, Leon Deng, Megan Su, and Li- wei H. Lehman. G-Transformer: Counterfactual Outcome Prediction under Dynamic and T ime-varying Treatment Regimes, 2024. Jessica G. Y oung, Lauren E. Cain, James M. Robins, Eilis J. O’Reilly , and Miguel A. Hernán. Comparative Effec- tiv eness of Dynamic Treatment Regimes: An Applica- tion of the Parametric G-F ormula. Statistics in Bio- sciences , 3(1):119–143, September 2011. ISSN 1867- 1764, 1867-1772. doi: 10.1007/s12561- 011- 9040- 7. URL http://link.springer.com/10.1007/ s12561- 011- 9040- 7 . A Causal Framework f or Evaluating ICU Dischar ge Strategies (Supplementary Material) Sagar Nagaraj Simha 1 Juliette Ortholand 1 Dav e Dongelmans 2 Jessica D . W orkum 3,4 Olivier W .M. Thijssens 6 Ameen Abu-Hanna 1 , Giovanni Cinà 1,5 1 Department of Medical Informatics, Amsterdam UMC, Univ ersity of Amsterdam, NL 2 Department of Intensiv e Care Medicine, Amsterdam UMC, Univ ersity of Amsterdam, NL 3 Department of Intensiv e Care, Elisabeth-T weeSteden Hospital, T ilbur g, NL 4 Department of Intensiv e Care, Erasmus MC, Rotterdam, NL 5 Institute of Logic, Language and Computation, Univ ersity of Amsterdam, NL 6 Pacmed, Amsterdam, NL A METHOD APPENDIX A.1 MA THEMA TICAL FORMULA TION OF CA USAL ASSUMPTIONS The assumptions below correspond to the one of Deliu and Chakraborty [2022] for DTR: • Stable Unit T reatment V alue (SUTV A): Y obs i,t = P ¯ a i,t Y i,t (¯ a i,t ) I { ¯ a obs i,t = ¯ a i,t } implying no interference between units and a well-defined version of each treatment, • No Unmeasured Confounders (NUC): Y t ( ¯ A t ) ⊥ ¯ A obs t | X, ¯ H t implying that we have measure all the necessary variables to recov er the unknown strategy of the data, and to guaranty the idependence between treatment allocation and the potential outcomes, • General positivity: 0 < f ¯ a t | ¯ ℓ t , ¯ a t = ¯ 1 , ¯ y g t = ¯ 0 , ∀ t, ¯ a t ∈ ¯ A t , ¯ ℓ t ∈ ¯ L t meaning that there are enougth variability in the unknown strate gy so that any possible history has a positi ve probability of receiving either treatment, • Positi vity for the strategy g : 0 < f a g t | ¯ ℓ g t , ¯ a g t = ¯ 1 , ¯ y g t = ¯ 0 , ∀ t, ¯ ℓ g t ∈ ¯ L g t meaning that there are enougth v ariability in the data so that for any possible history under strategy g at time t there are some patient with that history that follow the decision at time t . A.2 HISTOR Y MODELING As we assume a stable Markov process, we need to summarise in a constant way the time-gro wing history for each density modelled, making the following assumptions: • for the cov ariates density: f L g | ¯ ℓ g t , ¯ a g t = ¯ 1 , ¯ y g t = ¯ 0 = f L g | ℓ g t , t, ¯ y g t = ¯ 0 • for the in-ICU outcome density: f Y g | ¯ ℓ g t , ¯ a g t = ¯ 1 , ¯ y g t = ¯ 0 = f Y g | ℓ g t − 1 , ℓ g t − 2 , t, ¯ y g t = ¯ 0 if t = 1 and thus ℓ g t − 2 is not defined, we put NaNs. • for the discharged outcome density: f Y g | ¯ ℓ g τ g i , ¯ a t , ¯ y g t = ¯ 0 = f Y g | 1 τ g i + 1 τ g i X j =0 ℓ g j , τ g i , t − τ g i , ¯ y g = ¯ 0 • Natural course treatment probability: f ¯ a g i,t | ¯ ℓ g t , ¯ a g t = ¯ 1 , ¯ y g t = ¯ 0 = f ¯ a g i,t | ℓ g t , ¯ a g t = ¯ 1 , ¯ y g t = ¯ 0 A.3 CO V ARIA TES DESCRIPTION A.3.1 Baseline covariates Baseline cov ariates were defined using measurements recorded within the first 5 hours of ICU admission, reflecting the patient’ s initial physiological state prior to discharge decision-making. These included demographics (age, se x), admission origin. Other baseline cov ariates such as height, weight and ICU unit type were omitted due to significant missingness. A.3.2 Time-v arying covariates T o align the temporal resolution of the data with clinical practice, each ICU admission was discretised into consecutive, non- ov erlapping windows of 12 hours. W ithin each 12-hour window , time-varying confounders capture e volving physiological status, laboratory measurements, and respiratory support. The time-v arying confounder set comprised arterial bicarbonate, activ ated partial thromboplastin time, mean temperature, haemoglobin, mean heart rate, mean arterial blood pressure, creatinine, urea, mean urine output, lactate, Glasgow Coma Scale total score, mean arterial pCO 2 , mean respiratory rate, mean oxygen saturation, oxygen flow rate, mean arterial pO 2 , ventilator mode, and time since last ventilator mode recorded. V entilation mode, originally recorded using 42 granular categories in the source data, was mapped to four clinically meaningful groups: unknown , in vasive_contr olled , in vasive_assisted , and cancelled based on expert input from ICU clinicians. This consolidation reflects how ventilatory support is operationally assessed in practice and reduces sparsity while preserving clinically relev ant distinctions for modelling discharge decisions and outcome. The method used to summarise the variables over 12-hour windows and the distribution used for each variable in the simulations are summarised in T able 3. V ariable name Summary over last 12h Distribution V entilation mode last status categorical Hours since last recorded vent mode last v alue zero-inflated normal Arterial pco2 mean truncated normal Arterial po2 mean bounded normal Oxygen flow last value bounded normal O2 saturation mean bounded normal Respiratory rate mean bounded normal Glasgow coma scale last value bounded normal Lactate last value truncated normal Fluid out urine mean zero-inflated normal Ureum last value truncated normal Creatinine last value truncated normal Mean Arterial blood pressure mean bounded normal Heart rate mean bounded normal Hemoglobin last value bounded normal Mean T emperature mean normal Activ ated partial thromboplastin time last v alue truncated normal Arterial bicarbonate last value bounded normal T able 3: Clinical variables with their 12-hour aggregation type and distrib ution A.4 DESCRIPTION OF STRA TEGIES The Knight discharge strategy [Knight, 2003] operationalizes 15 physiological and laboratory stability criteria across respiratory , cardio vascular , neurological, and biochemical categories, each required to be within predefined thresholds. ICU discharge is recommended only when all criteria are satisfied, indicating sustained clinical stability . T est name V ariable T est condition Respiratory: airway airway airway patent Respiratory: FiO 2 fio2 fio2 ≤ 0.6 Respiratory: blood oxygen spo2 spo2 ≥ 95 (%) Respiratory: bicarbonate hco3 hco3 ≥ 19 (mmol/L) Respiratory: rate resp (rate) 10 ≤ resp ≤ 30 (bpm) Cardiov ascular: blood pressure bp (systolic) bp ≥ 100 (mm Hg) Cardiov ascular: heart rate hr 60 < hr ≤ 100 (bpm) Pain pain 0 ≤ pain ≤ 1 Central nervous system gcs gcs ≥ 14 T emperature temp 36 ≤ temp ≤ 37.5 ( ◦ C) Blood: haemoglobin haemoglobin haemoglobin ≥ 90 (g/L) Blood: potassium k 3.5 ≤ k ≤ 6.0 (mmol/L) Blood: sodium na 130 ≤ na ≤ 150 (mmol/L) Blood: creatinine creatinine 59 ≤ creatinine ≤ 104 ( µ mol/L) Blood: urea bun 2.5 ≤ bun ≤ 7.8 (mmol/L) T able 4: Codified discharge criteria applied to electronic health record data. All criteria must be satisfied prior to ICU discharge. B POSITIVITY AND CO VERA GE SANITY CHECK B.1 ADDITIONAL METHOD B.1.1 Importance-sampling and Effective Sample Size Ratio W e define the set of history-compatible trajectories at epoch t , D g t , from which can be extracted a set of trajectories for which the decision at time t coincide with strategy g , M g t . W e denote ¯ h g t − 1 = ( ¯ ℓ g t , ¯ a g t = ¯ 1 , ¯ y g t = ¯ 0) the history at time t . Importance-sampling (IS) weights were design to identify when ov erlap assumption is not fullfilled: w ( g , a, ¯ h t − 1 ) = f a g t = a | ¯ h g t − 1 = ¯ h t − 1 f a N C t = a | ¯ h N C t − 1 = ¯ h t − 1 Indeed, they are undefined when the probability of taking a certain action in natural course is null. Deterministic target strategies. The strategies e valuated here—both the static and the dynamic ones—are deterministic : at each decision epoch t and for each patient trajectory , the strate gy prescribes exactly one action (keep or discharge) with probability one. Positi vity therefore reduces to a binary feasibility check: ev ery state in which g prescribes discharge must hav e been observed with at least one clinician-initiated discharge, and vice v ersa for keep: w ( g , a, ¯ h t − 1 ) = I { a g t = a } f a N C t = a | ¯ h N C t − 1 = ¯ h t − 1 where I is the indicator function. A positivity violation at ( ¯ h t − 1 , a ) means that the strategy dictates action a in a region of state space where clinicians never took that action, making any estimate for trajectories passing through that region unreliable. Coefficient of variation The coefficient of v ariation, further noted CV correspond to the variance of the weights normalised by the mean, assuming this mean is different from zero: CV i ∈M t ( ˆ w ( g , a N C i,t , ¯ h N C i,t − 1 )) = V i ∈M t ( ˆ w ( g , a N C i,t , ¯ h N C i,t − 1 )) E i ∈M t ( ˆ w ( g , a N C i,t , ¯ h N C i,t − 1 )) 2 When used with the importance sampling weights, a coefficient of variation near zero means that all the action giv en histories have the same importance sampling, whereas when the CV is high, some might be overrepresented and others underrepresented. Y et, this measure gives a sense of the variability of the weights but cannot be interpreted in terms of sample size power . Effective sample size ratio A usefull metric to giv e a sense of the sample size reduction linked to the emballenced sampling in the effecti ve sample size : ESS t = P i ∈M t ˆ w ( g , a N C i,t , ¯ h N C i,t − 1 ) 2 P i ∈M t ˆ w ( g , a N C i,t , ¯ h N C i,t − 1 ) 2 = |M t | 1 + CV 2 i ∈M t ( ˆ w ( g , a N C i,t , ¯ h N C i,t − 1 )) It corresponds to the number of balanced sampled observations that would be needed, so that the variance of the mean weighted by the importance sampling weights is equal to the variance of the unweighted mean. V ( 1 |M t | X i ∈M t Y i ) = V ( X i ∈M t ˆ w ( g , a N C i,t , ¯ h N C i,t − 1 ) Y i ) A value close to |M t | means that the action giv en the history was homogenously sampled, whereas a value close to 0 means that only one type of action giv en history was over sampled compare to the rest of them. This metric thus enable to identify an underbalanced sampling, which could lead to near positi vity violation. The ratio enables a sense of what proportion of the data contains actual non-redundant information. B.1.2 PCA visualization Finally , to ground our intuition, we also visualize the areas of the feature space in which the two strate gies disagree. After reducing the dimensionality of the dataset to 3 via PCA, we colour -code the areas in which the decision of the strategy g agreed with the natural course (orange for dischar ge, blue for keep) while we mark in grey points where the is complete disagreement, i.e. positivity violations. B.2 ADDITIONAL RESUL TS 0 20000 40000 60000 80000 Match count (# obs agr eeing with P') P ositivity diagnostics over time Natural Course Static 3 days Knight Strategy DS1 Strategy 0.0 0.2 0.4 0.6 0.8 1.0 Coverage rate (fraction of obs matching P') Natural Course Static 3 days Knight Strategy DS1 Strategy Thr eshold 0.3 20 40 60 80 100 120 Hour 0.0 0.2 0.4 0.6 0.8 1.0 ESS / N (IS weight evenness among matching obs) Static 3 days Knight Strategy DS1 Strategy Thr eshold 0.3 Thr eshold 0.1 Figure 3: Positivity diagnostics o ver time for all e valuated strategies. T op: coverage rate ρ t (fraction of history-compatible observations at epoch t for which the clinician’ s action matches the target strategy’ s prescription). Middle: ef fectiv e sample size ratio ESS t / N t among matching observ ations (IS weight evenness; 1 = uniform, 1 / N t = fully concentrated). Bottom: absolute match count N t . The red dashed line in the top and middle panels marks the 0.3 warning threshold. 200 0 200 400 600 P'=KEEP PCA dim 1 12h n=82,480 cov=78% 24h n=63,842 cov=82% 36h n=51,528 cov=78% 48h n=39,880 cov=85% 60h n=33,601 cov=82% 72h n=27,302 cov=12% 84h n=0 cov=0% 96h n=0 cov=0% 108h n=0 cov=0% 120h n=0 cov=0% 200 0 200 400 600 P'=DISCHARGE PCA dim 1 100 0 100 200 P'=KEEP PCA dim 2 250 0 250 100 0 100 200 P'=DISCHARGE PCA dim 2 250 0 250 250 0 250 250 0 250 250 0 250 250 0 250 250 0 250 250 0 250 250 0 250 250 0 250 PCA dim 0 Static 3 days Blue = agr ee k eep | Orange = agr ee dischar ge | Gr ey = positivity violation Figure 4: PCA positivity scatter plots for the three static threshold strategy at 3 days, across decision epochs t ∈ { 12 , 24 , . . . , 120 } h (columns). Each panel projects the first two PCA components of the covariate space. Rows 1 & 3 : blue dots indicate patients for whom the strate gy prescribes keep and the clinician kept; grey dots indicate patients for whom the strategy prescribes keep but the clinician discharged (positivity violation). Rows 2 & 4 : orange dots indicate agreement on discharge; gre y dots indicate patients the strategy would dischar ge but clinicians retained (positivity violation). Panel titles report cohort size n and coverage rate ρ t . 200 0 200 400 600 P'=KEEP PCA dim 1 12h n=82,480 cov=100% 24h n=63,842 cov=100% 36h n=51,528 cov=100% 48h n=39,880 cov=100% 60h n=33,601 cov=100% 72h n=27,302 cov=100% 84h n=23,711 cov=100% 96h n=19,973 cov=100% 108h n=17,861 cov=100% 120h n=15,464 cov=100% 200 0 200 400 600 P'=DISCHARGE PCA dim 1 100 0 100 200 P'=KEEP PCA dim 2 250 0 250 100 0 100 200 P'=DISCHARGE PCA dim 2 250 0 250 250 0 250 250 0 250 250 0 250 250 0 250 250 0 250 250 0 250 250 0 250 250 0 250 PCA dim 0 Natural Course Blue = agr ee k eep | Orange = agr ee dischar ge | Gr ey = positivity violation 200 0 200 400 600 P'=KEEP PCA dim 1 12h n=82,480 cov=78% 24h n=63,692 cov=82% 36h n=51,373 cov=78% 48h n=39,744 cov=85% 60h n=33,463 cov=82% 72h n=27,195 cov=88% 84h n=23,618 cov=85% 96h n=19,893 cov=90% 108h n=17,783 cov=88% 120h n=15,394 cov=92% 100 0 100 200 P'=DISCHARGE PCA dim 1 100 0 100 200 P'=KEEP PCA dim 2 250 0 250 100 0 100 200 P'=DISCHARGE PCA dim 2 250 0 250 250 0 250 250 0 250 250 0 250 250 0 250 250 0 250 250 0 250 250 0 250 250 0 250 PCA dim 0 Knight Strategy Blue = agr ee k eep | Orange = agr ee dischar ge | Gr ey = positivity violation 200 0 200 400 600 P'=KEEP PCA dim 1 12h n=82,480 cov=59% 24h n=44,385 cov=77% 36h n=34,020 cov=74% 48h n=24,880 cov=81% 60h n=20,053 cov=78% 72h n=15,447 cov=84% 84h n=12,842 cov=81% 96h n=10,298 cov=87% 108h n=8,897 cov=83% 120h n=7,339 cov=89% 200 0 200 400 600 P'=DISCHARGE PCA dim 1 100 0 100 200 P'=KEEP PCA dim 2 250 0 250 100 0 100 200 P'=DISCHARGE PCA dim 2 250 0 250 250 0 250 250 0 250 250 0 250 250 0 250 250 0 250 250 0 250 250 0 250 250 0 250 PCA dim 0 DS1 Strategy Blue = agr ee k eep | Orange = agr ee dischar ge | Gr ey = positivity violation Figure 5: PCA positi vity scatter plots for the dynamic strategies (Natural course, Knight strategy , and DS1 strategy; top to bottom), across decision epochs t ∈ { 12 , 24 , . . . , 120 } h (columns). Layout and colour coding are identical to Figure 4. Figure 6: T ime-indexed standardized mean differences comparing observ ed and simulated cov ariate ev olution under the natural course. C MODEL SPECIFICA TION SANITY CHECKS C.1 NA TURAL COURSE CALIBRA TION VIA ST AND ARDIZED MEAN DIFFERENCES As a primary internal validation step, we ev aluated whether simulated cov ariate trajectories under the natural course reproduced the joint distrib ution observed in the historical data. Figure 6 presents time-indexed standardized mean differences (SMDs) for each cov ariate, comparing observed and simulated v alues over the follo w-up. Small SMDs ov er time indicate adequate calibration of the longitudinal cov ariate models. Larger SMDs point to potential model misspecifications. C.2 EMPIRICAL DISTRIBUTION DIA GNOSTICS T o assess the satisfaction of distrib utional assumptions, we visually inspected empirical density plots of all time-varying confounders across the 12-hour grid. Figures 7 and 8 display the observed marginal distrib utions over time and were used to verify consistenc y with the parametric families specified in the pygformula implementation. Particular attention was paid to ske wness, heavy tails, boundary inflation, and temporal drift, ensuring that selected functional forms captured clinically meaningful variability without inducing e xtrapolation . Figure 7: Covariate distribution comparison under the natural course and MIMIC-IV data for In-ICU death. The close ov erlap across physiologic variables demonstrates that the natural course simulation reproduces the empirical cov ariate distributions at In-ICU death. Figure 8: Cov ariate distribution comparison under the natural course and MIMIC-IV data. The close ov erlap across physiologic v ariables demonstrates that the natural course simulation reproduces the empirical covariate distrib utions at discharge.
Original Paper
Loading high-quality paper...
Comments & Academic Discussion
Loading comments...
Leave a Comment