Shopping with a Platform AI Assistant: Who Adopts, When in the Journey, and What For
This paper provides some of the first large-scale descriptive evidence on how consumers adopt and use platform-embedded shopping AI in e-commerce. Using data on 31 million users of Ctrip, China's largest online travel platform, we study "Wendao," an …
Authors: Se Yan, Han Zhong, Zemin
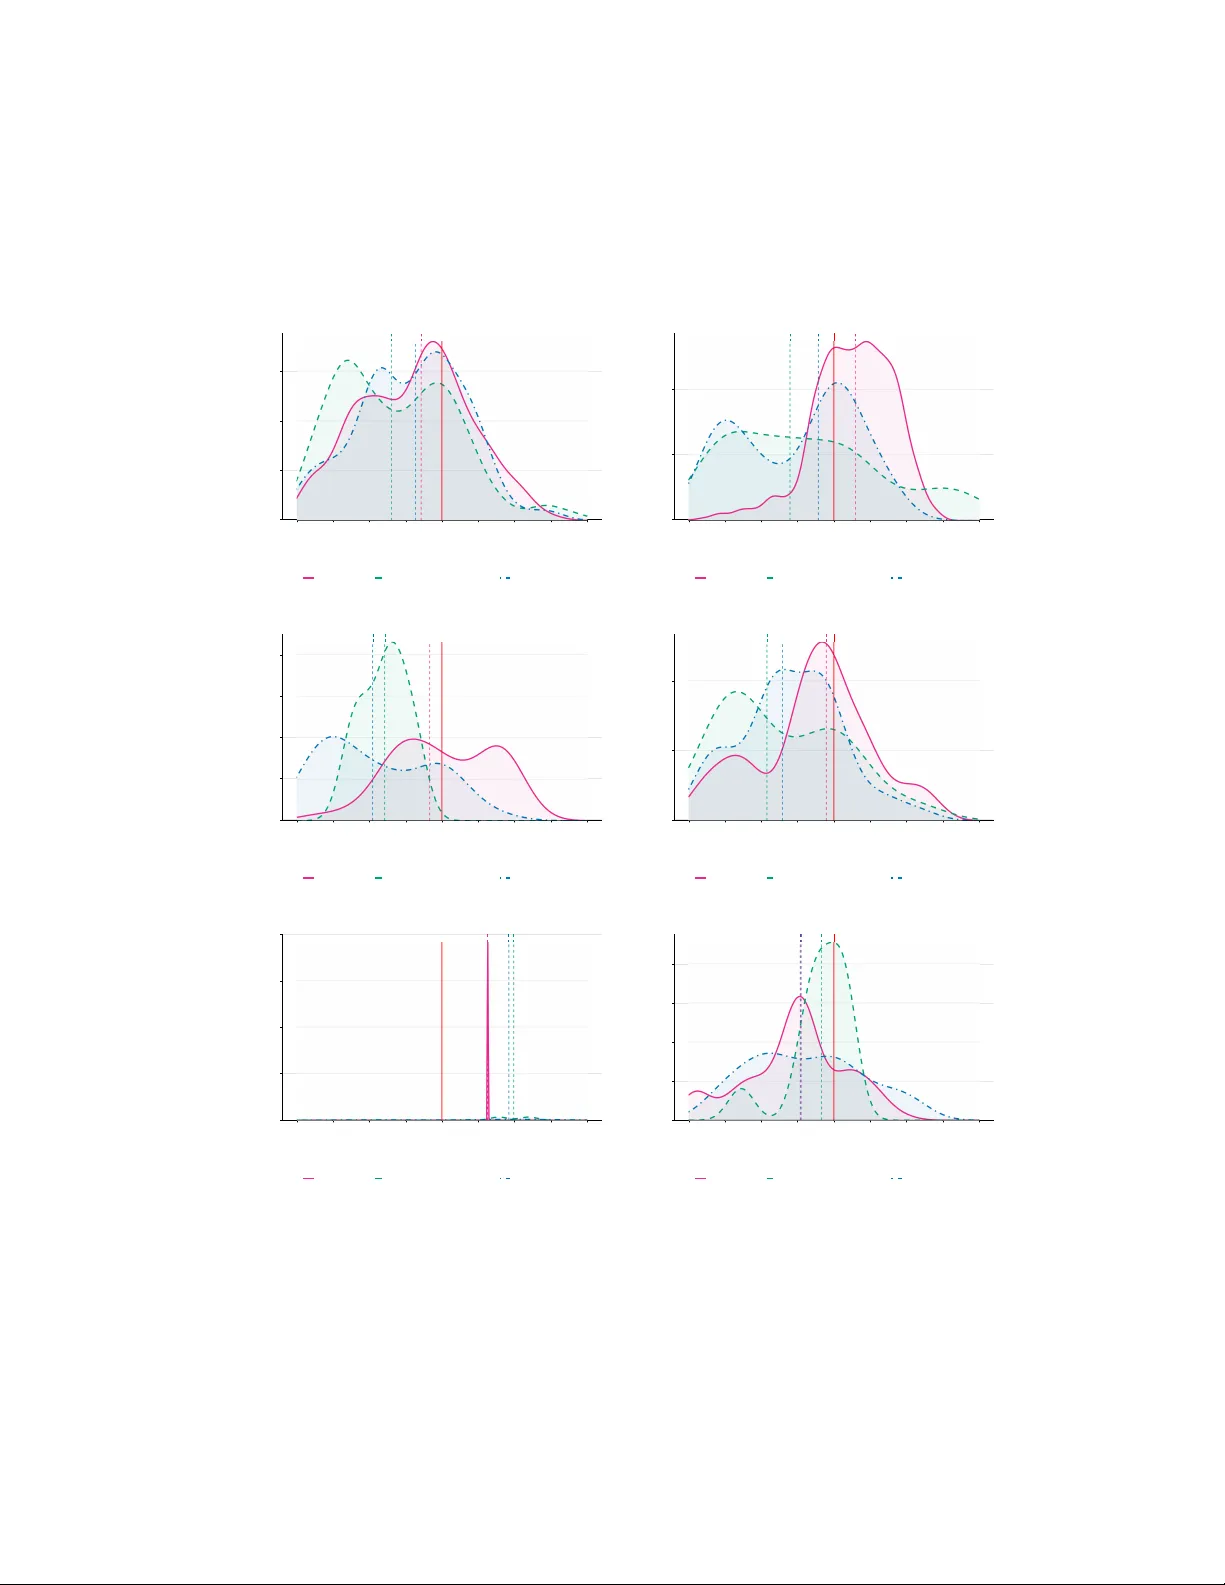
Shopping with a Platform AI Assistan t: Who Adopts, When in the Journey , and What F or Se Y an ∗ Han Zhong † Zemin (Zac hary) Zhong ‡ W en yu Zhou § Marc h 27, 2026 Abstract This pap er pro vides some of the fi rst large-scale d escriptiv e evidence on h o w con- sumers adopt and use p latform-em b ed ded shopp ing AI in e-co mmerce. Using data on 31 million users of Ctrip, Ch ina’s largest online trav e l platform, w e study “W endao,” an LLM-based AI assistan t integrate d i n to the platform. W e do cument three empirical regularities. First, adoption i s highest among o lder consumers, female users, and highly engaged existing users, r ev ersing the younger, male-dominated p rofile commonly d o cu- men ted for general-purp ose AI tools. Second, AI c hat app ears in the same broad phase of the p u rc hase journ ey as traditional searc h and well b efore order placemen t; among journeys con taining b oth chat and searc h, the most common p attern is in terlea ving, with users mo ving b ac k and forth b et ween the tw o m o dalities. T h ird, consumers dis- prop ortionately use the assistant for exploratory , hard-to-k eyw ord tasks: attractio n queries accoun t for 42% of observed c hat r equests, and chat inte n t v aries s ystemati- cally with b oth the timing of c hat r elativ e to searc h and the category of pr o ducts later purchased within the same journ ey . These findin gs suggest that emb ed ded s h opping AI functions less as a s ubstitute for con v entional searc h than as a complemen tary in- terface for exp loratory pro du ct disco v ery in e-commerce. Keyw ords: AI assistan t, Large Language Mo d el, Adoption, Platform ∗ Guanghua School of Management, Peking Univ ersity , Beijing 100 86, China. Email: seyan@ gsm.pk u.edu.cn . † Rotman Schoo l of Ma nagement, Universit y of T o ronto, T oronto, Ontario M5S 3E6 , Canada . Email: han.zh ong@ro tman.utoronto.ca . ‡ Rotman Schoo l of Ma nagement, Universit y of T o ronto, T oronto, Ontario M5S 3E6 , Canada . Email: zachar y.zhon g@rotman.utoronto.ca . § Int ernational Business School, Zhejiang Universit y , Haining, Zhejiang 31 4400, China. Email: wenyuz hou@zj u.edu.cn . 1 In tro duc tion The landscap e of e-commerc e is c hanging rapidly as ma j o r platforms embed LLM-pow ered assistan ts in to the consumer shopping exp erience. Companies including Amazon, Alibaba, and Shopify hav e integrated generativ e AI into their core in terfaces, a nd a recen t Adob e sur- v ey rep orts that 38% of U.S. consumers hav e used generative AI f or online shopping. 1 Y et w e still kno w remark ably little ab out how shopping-sp ecific AI is adopted and used at scale. Existing evidence on generativ e AI adoption comes primarily f r om general-purp ose to ols and suggests that early adopters are disprop ortionately y ounger, male, and mo r e techni- cally sophisticated (Draxler et al., 2023; Otis et al., 2024; Chatterji et al., 2025; Y ang et al., 2025; Bic k et al., 20 2 6). Whether the same pattern holds for pla t form-em b edded shopping AI, where con v ersationa l assistance may reduce searc h and disco v ery frictions ra ther than rew ard tec hnical sophistication, remains unclear. This lea v es three basic questions unan- sw ered: who adopts shopping-sp ecific AI, where it fits in the purchase journey relativ e to traditional searc h, and what kinds o f requests consumers delegate to it. W e study these questions using “ W endao,” an LLM-based shopping a ssistan t em b edded in Ctrip, Ch ina’s largest o nline trav el platform. Our base sample consists of 31 million unique users who logged in to the platform during a tw o-w eek p erio d from July 10 to July 24, 2025. W e define AI adopters as users who had initiated at least one c ha t with the assistan t b y July 10 , 2025; under this definition, approximately 1.9 million users (6%) a re adopters. This setting pro vides t w o ke y empirical adv antages . First, w e observ e AI con vers ations alongside ric h purc hase-journey data, including login a ctivity , searc h queries, clic ks, and transactions, allo wing us to lo cate AI interactions relativ e to t raditional searc h and b o oking ev ents . Second, w e observ e rich user characteristic s, including demographics, ten ure, and lo y alty status, which allo w us to examine ho w the a doption of embedded shopping AI v aries across consumer segmen ts and prior platfo r m relationships. Our a nalysis establishes three empirical regularities. First, adoption is significan tly higher 1 https: //busi ness.adobe.com/blog/generative- ai- powered- shopping- rises- with- traffic- to- retail- sites 1 among consumer segmen t s that are often view ed as later ado pters of new tec hnolo g ies, in- cluding older consumers (10.7% for a g es 50+ vs. 4.6% for under 24) and female users. Adoption is also substan tially hig her among highly engaged existing users, indicating that tak e-up is concen trated among consumers with stronger prior ties to the platform. These patterns rev erse the y ounger, male-dominated pro file commonly do cumen ted for general- purp ose AI t o ols and sho w that adoption of em b edded shopping AI is strongest among users with established platform relatio nships. Second, AI chat app ears in the same broad phase of the purc hase journey as traditional pro duct searc h and w ell b efore order pla cemen t. Among journeys con taining b oth c hat and searc h, t he most common pattern is in terlea ving (53%), with users mo ving bac k and f o rth b etw een the tw o mo dalities. Third, att r a ction queries accoun t for the la r g est share of observ ed user in ten t (42%), and c hat inten t is closely aligned with downs tream transaction categories: hotel c ha ts are disprop ortio nately follow ed b y hotel orders, attraction c ha t s by v acation orders, and so o n. These pa t t erns suggest that users rely on the assistan t disprop ortionately for exploratory , harder-to-k eyw ord tasks, and that observ ed c hat activit y is meaningfully connected to subseq uen t purc hase needs. These findings con tribute to the emerging literature on generativ e AI in digital mar- k eting. F or theory , the reve rsal of standa r d adoptio n gradien ts suggests that platform- em b edded AI ma y create v alue not primarily as a pro ductivit y to ol for tec hnically sophisti- cated users, but b y reducing in terfa ce frictions for consumers less comfortable with k eyw ord- based searc h—helping them articulate needs, refine preferences, and na vigate the platform. F or empirical researc h, the strong asso ciation b et w een prio r platf orm engag ement and adop- tion hig hligh t s t he need for causal designs that distinguish selection in to use from the effects of AI access itself, while t he in terleav ing of c ha t and search implies that experimen ts ra n- domizing AI access may also shift t r a ditional search b ehavior. F o r practitioners, our results suggest that adoption is like ly to b e strongest among users with establishe d platform rela- tionships and that AI assistan ts should b e optimized for exploratory disco v ery rather than transactional automatio n, while b eing designed to complemen t rather t ha n simply replace 2 con ven tional searc h. W e discuss these implications further in Section 6. Our pap er relates to three literatures. The first studies tec hnology adoption and its de- mographic correlat es (Rogers, 1 9 62; Goldfarb and Prince, 2008), including recen t w o rk on generativ e AI adoption (Draxler et al., 20 23; Ot is et a l., 2 024; Handa et al., 2025; Li et al., 2025; T omlinson et al., 20 2 5; Bick et al., 2 026; Sc h ub ert et al., 20 2 6). The second exam- ines the role of AI in mark eting, spanning b oth firm-side pro ductivit y applications (e.g. Brynjolfsson et al., 2025) and consumer-facing assistan ts (e.g. Lin et al., 202 5; Sun et al., 2025). A closely related study in t he same trav el-platfor m setting examines, using a field exp eriment, ho w access to a reasoning v ersus non- reasoning AI assistan t affects brow sing a nd purc hase o utcomes (Y an et al., 2025). Recen t w ork has also begun to study ho w the adoption of general-purp ose LLM reshap es online b ehav ior more broadly (P adilla et al., 2025). The third concerns consumer searc h and purc hase decisions (e.g. Honk a et al., 2019; Ursu et al., 2025). W e con tribute to these literatures b y pro viding large-scale descriptiv e evidence on how platform-em b edded shopping AI is adopted and used within a specific e-commerce setting, do cumen ting patterns that differ in imp ortant wa ys fro m those rep orted for general-purp o se AI to ols. 2 Con text and Data W e collab orate with Ctrip, China’s lar g est online tra v el platform. The platform allows consumers to searc h for and b o ok hotels, fligh ts, a nd ground transp ortatio n, as well as purc hase attra ctio n tic kets and other trip-related pro ducts. Consumers t ypically interact with the platfo rm through a standard e-commerce funnel inv olving k eyw ord-based searc h, algorithmic ranking, filtering and sorting, pro duct-detail bro wsing, and che c k out. Ctrip has also deplo y ed an LLM-p o w ered conv ersational assistan t, Wendao , which is accessible through a p ersisten t floating icon in the mobile app and through en try p oints on the w eb in terface, allo wing users to inv ok e the assistan t while bro wsing searc h results. Users can op en the 3 assistan t, submit t r av el-related questions, receiv e AI-generated resp onses, and na vigate fro m the conv ersation to pro ducts on the plat f orm. Relativ e to general-purp ose AI to ols, Wendao has access to ric h platform-sp ecific information o n trav el pro ducts, including structured attributes, platf orm la b els, user reviews , and other user-generated con ten t . In addition, b ecause it is built for t his setting, t he assistan t is designed to b etter supp ort tr av el-related disco ve ry and comparison on the platfo rm. Our base sample consists o f 31,142,3 5 3 users who logged in to the app during a t w o- w eek windo w from July 10 to July 24, 2025. T o study b eha vior a round this fo cal sample, w e observ e user activit y ov er a broader windo w from June 10 to August 15, 2025. W e use t his wider windo w b ecause consumer a ctivit y in online tra v el is relative ly sparse and episo dic, so many users do not generate observ able chat, searc h, o r b o o king activit y within an y giv en t w o- week p erio d. The broader windo w therefore provide s a ric her set of platform activities for tracing purc hase journeys and relating c hat b ehavior to do wnstream outcomes. Within this setting, w e define an AI c hat ado pt er a s a user who had initiat ed at least one c hat with Wen dao by July 10, 20 2 5. Under this definition, 1,904,368 users (6.1%) a r e adopters. Because Wendao w as launched b efo r e our observ a tion windo w, man y adopters first used the assistan t prior to t he p erio d w e o bserv e. Moreo v er, b ecause Ctrip is not a high-frequency- use platform for man y consumers, many adopters do not generate observ able c hat activit y during that windo w. Consequen t ly , only a subset of adopters can b e link ed to observ ed c hat transcripts: 188,647 adopters sen t at least one c hat request with an observ able transcript. W e use four linke d datasets, joined b y an a non ymized user iden tifier, to trace us er activit y on the platform. At the user lev el, w e observ e demographic a nd accoun t attributes, including gender, age group, cit y , device t yp e, platform ten ure, and VIP status. At the hotel-searc h lev el, w e observ e timestamp ed searc h and brow sing actions, including hotel searc h queries and clic ks on hotel detail pages. A t the c hat lev el, w e observ e in teractions with t he AI assistan t, including the full text of user requests and AI replies. The platf orm’s in ternal algorithm also classifies eac h request in to an in ten t category (e.g., hot el b o oking, trav el 4 planning, attractions, or customer service). F ina lly , we observ e all b o okings made on the platform, including order time and pro duct category . T ogether, these link ed da t asets allo w us to relate user c haracteristics to AI adoption and to situate c hat in teractions within broa der searc h and purc hase journeys on the platfor m. 3 Who Ad opts AI In our data, 6.1% of users had adopted the AI assistan t b y July 10, 2025. Although this rate is not directly comparable to self-rep o rted surv ey estimates o f generativ e AI use for online shopping (e.g., 38% in a recen t Adob e surv ey), it suggests that adoption of a sp ecific platform-em b edded shopping assistan t remains far from univ ersal, ev en as broader f amiliarit y with AI shopping to ols app ears m uc h higher. W e examine these adoption patterns first through unconditional comparisons (Fig ure 1 ) and then through regression models estimating conditional asso ciations (Figure A1). Figure 1 presen ts unconditional adoption rates. Three patterns stand out. F ir st, adop- tion increases monotonically with ag e (10.7 % for ages 50+ vs. 4.6% fo r users under 24), rev ersing the younger, ma le- dominated profile commonly do cumen ted for general-purp ose AI to ols (Dra xler et a l., 2 0 23; Otis et al., 2024; Bic k et al., 202 6). Second, female users adopt at a modestly higher rate than male users (7.1% vs. 6.0%) 2 , again con trasting with the male-sk ew ed pattern often found in bro a der AI adoption (Draxler et al., 2023). Third, adoption rises sharply with loy alt y tier (12.8% for Black Diamond VIP users vs. 4.7% for Silv er users). Longer- ten ure users also exhibit higher adoption r ates. In terestingly , adop- tion is also higher among Android users than iOS users. T o the exten t that iOS is oft en asso ciated with more exp ensiv e devices, this pattern runs against a simple premium-user or tec hnical-sophistication accoun t of early AI adoption, though o p erating system is an imp erfect proxy fo r income and ma y also capture broa der difference s in user comp osition. 2 The female and male adoption rates a re computed among users with observed gender, so they need not av er age to the full-sample a doption ra te. In the ge nder -known subsample, the po oled adoption ra te is 6.58 %; the full-sample rate is low e r b ecause user s with missing gender have a low er adoptio n ra te (3 .43%). 5 Comparing adopters and non-adopters directly (App endix T able A1 ) confirms these demo- graphic gradien ts and shows that adopters are substan tially mo r e engaged on the platform: they record more than double the log in minu tes (797 vs. 3 5 5) and nearly t wice t he num- b er o f searc h queries (15 0 vs. 67 ). T ogether, these patterns indicate that AI adoptio n on the platform is concen trated among older, female, and mo r e strongly attached users, and is closely asso ciated with ov erall platform engagemen t. T o assess which f actors a r e asso ciated with adoption, we regress an indicator for AI c hat adoption on demographic, accoun t, and engagemen t v ar iables using a linear probabil- it y mo del, a log it model, and a probit mo del. Appendix Figure A1 plots the estimated marginal effects, whic h are consisten t across all three specifications. Sev eral patterns fro m the unconditional comparisons surviv e aft er con trolling for b ehavioral v a r ia bles. Age remains the strongest demographic predictor: relativ e to the under-24 baseline, users aged 50+ are roughly 4–5 p ercen tage p oin ts more lik ely to adopt, a large effect against the 6.1 % base rate. Being female is asso ciated with an increase o f a ppro ximately 1.5 p ercentage p oin ts. The iOS device indicator en ters negat ively (ab out − 1.5 pp). VIP status and star rating retain mo dest p ositiv e effects af ter con trolling for engagemen t , suggesting that lo y alty captures something b ey o nd mere usage in tensit y . Among b eha vioral v ariables, login sessions and av erage session duration sho w the la r g est p ositiv e effects, while total orders con tributes little incremen tal predictiv e p o w er once en- gagemen t in tensity is con trolled, suggesting that the depth of se a r ch b ehav ior, rather t ha n purc hasing p er se, distinguishes ado pt ers. 3 A random forest classifi er reinforces these findings (App endix Figure A2): engagemen t v ariables (log in minutes , sessions, session duration) dominate predictive imp o rtance, fol- lo w ed by age. Adding engag emen t to demographics raises the random for est A UC (a rea 3 The ne g ative co efficient on to tal lo gin min utes in Figure A1 is an artifact of collinea rity: b eca use total login minut es is a pproximately the pro duct o f login sessions and a verage min utes p er sess ion, including all three sim ultaneously produces unstable individual coefficients. The v ariable - impo rtance ranking in Appe ndix Figure A2, which is imm une to collinearity , confir ms that all three engagement mea sures are individually informative. 6 under the ROC curv e, where 0.5 is c hance and 1.0 is p erfect discrimination) from 0.635 to 0.962 (App endix T able A2), confirming that engagemen t con ta ins ric h nonlinear signals that demographics alone miss. One imp ortan t ca veat: the strong predictiv e p ow er of engagemen t should not b e read causally . Hea vy users mec hanically encoun ter the AI en try p oint more often, so the asso cia- tion can reflect greater exposure ra ther than greater prop ensit y . Disen ta ngling the t w o w ould require exogenous v ariation in feature visibilit y , which is b ey ond this descriptiv e analysis. The par ametric and nonpara metric r esults tell a consisten t story . The adoption profile is strikingly different from that do cumen ted for general-purp ose AI to ols: adoption rises with age, is higher among female users, and is conce n trated among users with stronger prior ties to the platform. At the same time, the single strongest predictor o f ado ption is the in tensit y of existing platform engag ement, although, as noted ab o ve, this asso ciation may partly reflect greater exp osure to the AI en try p oin t rather than a higher underlying prop ensity to adopt. 4 When C onsumers Use AI Ha ving established wh o adopts the AI a ssistan t, w e no w turn to w hen it is used within the purc hase jo urney . In particular, how do es AI c ha t relate to traditional searc h in the path to purc hase? Do es it tend to app ear early as a disco very to ol, or do es it arise later in journeys that are already underw a y? W e address t his in t w o steps: first, w e establish where AI c hat o ccurs relative to other journey ev en ts on av erage; then, we examine whether it o ccurs b efore, aft er, o r alongside traditional searc h. W e define a customer journey from login sessions in t w o steps. First, w e construct sessions from lo gin and logo ut timestamps and stitc h adjacen t sessions in to a provisional journey unless t he gap b etw een one session’s logout and the next session’s login is at least 48 hours. Second, within each provisional journey , if multiple sessions con tain orders, we split the j o urney b et wee n tw o adjacen t order-containing sessions whenev er the inactivity gap 7 Figure 1: AI c hat ado ption rates b y demographic and a ccount characteristics 7.1 % 6.0 % 0% 2% 5% 8% 10% 12% Male Female Gender Ado ption Rate 4.6 % 10. 7% 7.6 % 4.5 % 0% 4% 8% 12% 16% 24- 25-34 35-49 50+ Age Group Ado ption Rate 6.1 % 7.7 % 5.5 % 6.1 % 5.9 % 0% 5% 10% Muni. Prov . Pref. County Others City Leve l Ado ption Rate 5.2 % 7.1 % 0% 2% 5% 8% 10% 12% New User Existing User T enure Ado ption Rate 12. 8% 12. 1% 4.7 % 9.1 % 1 1 .0% 6.6 % 0% 5% 10% 15% Silver Gold Plat. Diamond Gold Diamond Black Diamond VIP L eve l Ado ption Rate 7.4 % 4.8 % 0% 2% 5% 8% 10% 12% iOS Android Dev i ce T ype Ado ption Rate Notes : AI c hat ado ption is defined as initiating a t least one chat session by July 10, 202 5. Each panel r e po r ts adoptio n r a tes by user subgro up. 8 b et w een the earlier session’s logo ut and the later session’s login excee ds 4 hours. 4 In the online app endix, w e show tha t the main qualitativ e patterns are similar under alternative definitions: an inactivit y-only definition tha t omits the second step and more p ermissiv e order-gap thresholds. Under our baseline definition, w e iden tify o v er 253 million journeys during the observ ation windo w (App endix T able A3). The median journey lasts 7 hours, spans 2 login sessions , and in v olve s 11 min utes of total login time. Most journeys are brief: the median con tains zero c hat sessions, zero clic ks, and zero orders. A t the same time, the distributions are strongly right-sk ew ed, reflecting a long tail of more in v olve d tr av el-planning episo des. 5 T o understand whe re chat fits in the purc hase funnel, w e normalize eac h ev en t’s t imes- tamp to a [0% , 100%] scale represen ting its relative p osition within the journey a nd plot k ernel densit y estimates for each ev en t t yp e. Figure 2 displa ys the results. The median AI c hat ev en t o ccurs at 47% of jo urney progress, closer to the median for hotel searc hes (55%) and clic ks (56%) than to orders, whose median falls at 88%. The c hat densit y fol- lo ws a broadly similar distributional shape to searc h and clic ks, with spik es near b oth the b eginning and end of the jo urney and a relatively smo o t h distribution in b et w een, though it is shifted somewhat earlier o v erall. Order densit y , b y con trast, is concen trated near the journey’s end. Recen tering the timeline on the c hat ev en t itself confirms that searc hes and clic ks are tightly cen tered around c hat, while orders are displaced w ell to the rig h t (Ap- p endix F igure A4). This pat t ern indicates that AI c hat is primarily a pre-purch ase activit y , o ccurring in a similar phase o f the journey as active searc h and browsing rather than as p ost-b o oking support. Recen tering t he t imeline on the or der ev en t yields the same qualita- tiv e conclusion: chat, search , and click s generally o ccur b efore order placemen t (App endix Figures A5 and A6). App endix Figures A7, A8 and A9 show v ery similar patterns under 4 This second step is intended to capture the idea that a purchase-oriented shopping episo de often ends after an order follow ed by a meaningful pause. W e therefore view the resulting journey as an op e rational approximation to a latent shopping episo de. 5 Appendix Figure A3 illustrates journey hetero geneity by plotting the timelines of ten randomly selected users ov er a 3 0-day windo w. 9 alternativ e journey definitions, including an ina ctivit y-only definition that omits the order- based splitting step and definitions using more p ermissiv e order-gap thresholds of 8 and 12 hours. The av erage timing result masks imp ortan t heterogeneity in ho w c hat is p ositioned rela- tiv e to tr a ditional search . W e classify journeys containing at least one c hat session in to four m utua lly exclusiv e groups: chat-b efor e-se ar ch journeys (all c hat ev en ts precede all searc h ev ents ), chat-after-se ar ch journey s (all c hat ev ents fo llo w all searc h even ts), chat-b etwe en- se ar ch journeys (chat a nd searc h ev en ts are inters p ersed), and chat-only journeys (no ho t el searc h o ccurs). These patterns ma y reflect distinct functional roles for AI: in chat-b efor e- se ar ch journeys, the assistan t ma y serv e as a n en try p oint for exploration; in chat-after-se ar ch journeys, it may serv e as a refinemen t to ol inv ok ed after key w ord searc h; and in ch at-only journeys, it ma y substitute for hotel search within the journey . T able 1 rep orts the results. Chat- o nly journeys accoun t for the largest share ( 42%), indicating that a substantial fraction of c hat use o ccurs without an y accompan ying hotel searc h. Among all chat journeys, chat-betw een-searc h accoun ts for 31%, follow ed b y c hat- b efore-searc h (15%) and c hat- after-searc h (12%). Conditional on a journey con ta ining b oth c hat and searc h, ho wev er, the c hat-b etw een-searc h pattern dominates, accoun ting for 5 3% of suc h journeys, compared with 2 6% for c hat-b efore-searc h a nd 21% fo r c hat- after-searc h. In terleav ed j ourneys are substan tially longer (median 9 5 hours vs. roughly 52 for the other t w o c hat - and-searc h groups), inv olv e far more hotel searche s (150 vs. 2 1–24), a nd exhibit the highest con v ersion rate ( 43% vs. 39% for c hat-b efore-search and 31% for c hat-after-search). Chat-only journeys, b y con tra st, are the shortest (median 19 hours) and ha v e the lo w est con version rate (18%), consisten t with a more ligh t weigh t or exploratory usage patt ern. T ak en together, the data su ggest that chat can serv e as a n entry p o in t for se arc h (c hat-b efore- searc h), as a refinem en t to ol follo wing search (c hat - after-searc h), or as a standalone disco v ery c hannel (chat-only), but when b oth mo dalities a re presen t it is most often interlea v ed with searc h, consisten t with users going back and f o rth b et wee n the t w o mo dalities. 10 One cav eat is that longer journeys with more actions mec hanically create more o pp ortu- nities f or in terlea ving: a short journey with one c hat a nd one searc h can only b e classified a s c hat - b efore-searc h or c hat- after-searc h, nev er c hat-b et wee n-searc h. The higher in terleav ing share among journeys con taining b oth mo dalities may therefore partly reflect the dominance of lo ng er, more engaged jo ur neys in that subsample. T o assess whether this is the case, Ap- p endix T able A4 rep eats the analysis at the session lev el, where the scop e for mec hanical in t erlea ving is more limited. Chat-b et wee n-searc h remains the most prev alen t pattern among sessions con ta ining b oth c hat a nd searc h, though its share is not a bly smaller t ha n at the journey lev el, consisten t with ba ck-and-forth use of c hat and searc h often unfo lding across m ultiple sessions ra ther than within a single login. The gap in conv ersion ra tes across groups is ev en more pronounced at the sess ion lev el, suggesting that the asso ciation b et w een in ter- lea ving and purc ha se is unlik ely to b e driv en solely b y journey length. A particularly rev ealing dimension is Panel C of T able 1, which rep o rts the distribu- tion of chat topics across the four groups. (The platform’s in ternal algorithm classifies eac h c hat session by topic; we describ e the full inten t ta xonomy in Section 5.) Relativ e to the other g roups, c hat-b efore-search journeys are somewhat more likely to inv olv e trav el planning queries (9.8%), consisten t with users turning to the a ssistan t earlier in the jour- ney for broader exploratio n. Chat-b et ween -searc h journeys hav e the highest hotel inte n t share (30.4%), consisten t with users to ggling b et w een key w o rd searc h a nd conv ersational AI to refine hotel-specific decisions. Chat-after-search journeys are the most attra ction-hea vy (48.6%), suggesting that users who ha v e already searc hed for hotels turn to AI for comple- men tar y information ab o ut destinations and activities. Chat-only journeys, b y con trast, are the least hotel- orien ted and relativ ely more concen trated in other transp ortation, customer service, and residual topics, suggesting that standalone c hat use is o f ten less tightly linke d to hotel searc h. These patterns are r o bust to alternative journey definitions, including a 48- hour inactivit y- o nly definition and more p ermissiv e order- gap thresholds of 8 and 12 hours (App endix T ables A5, A6 and A7), and the same to pic ordering app ears at the session lev el 11 (App endix T able A4, Pane l C). Figure 2: Densit y of ev ent t yp es o v er the course of the customer journey Cl i ck Order Ch a t Sea rch 0 % 2 0 % 4 0 % 6 0 % 8 0 % 1 0 0 % 0 % 2 0 % 4 0 % 6 0 % 8 0 % 1 0 0 % 0 .0 0 0 .0 2 0 .0 4 0 .0 6 0 .0 0 0 .0 2 0 .0 4 0 .0 6 0 .0 0 0 0 .0 2 5 0 .0 5 0 0 .0 7 5 0 .0 0 0 .0 2 0 .0 4 0 .0 6 Jou rn e y Pro gre ss De n si ty Notes: Each pa nel shows the kernel dens it y of an even t type over no rmalized journey prog r ess (0%–100% of total jour ney duration). The dashed line mar ks the media n even t p osition. 5 Ho w Consumers Use AI W e next examine how consumers use the AI assistan t in practice. The platf orm assigns eac h c hat session to one of sev en inten t cat ego ries using it s in ternal classifier: A ttraction, Hotel, T rav el Planning, Consumer Supp or t , Flight, Other T ranspo r t ation, and Other. Ap- p endix T able A8 presen ts illustrativ e con versations for each category , t ranslated from Chi- nese. Before turning to inten t comp osition, we briefly c haracterize the in t ensiv e marg in of AI engagemen t. Among t he 188 ,647 ado pters with observ able c hat tra nscripts, the median 12 T able 1: Journey Characteristics by R elativ e Timing of Chat and Searc h Chat-Before- Search Chat-Betw e e n-Search Chat-After-Sear c h Chat-Only Panel A: Pr evalenc e Share of journeys (%) 15.076 30.916 12.411 41.596 Panel B: Jour ney char acteristics Median journey length (hour s) 51.809 94.837 51.970 18.405 Mean login sessio ns 11.313 28.625 10.538 5.582 Mean chat sessions 1.377 1.566 1.358 1.411 Mean hotel sea rches 24.365 150 .029 21.433 0.000 Mean clicks 11.504 68.371 9.532 0.000 Mean orders 0.562 0.666 0.463 0.223 Conv er sion rate (%) 39.382 43.166 31.130 18.040 Panel C: Chat intent distribution (%) A ttraction 44.210 41.881 48.481 39.873 Hotel 17.927 30.388 17.681 7.062 T ravel Planning 9.837 6.075 5.390 8.031 Customer Service 4.871 3.763 5.541 6.930 Flight 1.369 0.589 0.919 3.243 Other T r ansp ortation 6.233 4.870 5.615 12.69 2 Other 15.552 12.434 16.373 22.169 Notes: Journey s ar e classified int o four groups containing at least one AI chat session: Chat-Befor e-Se ar ch (all chat even ts precede all hotel search even ts), Chat-After-Se ar ch (all chat ev en ts follow all hotel search e vents), Chat-Betwe en-Se ar ch (chat and sea rch e ven ts ar e interlea ved), a nd Chat-Only (c hat but no hotel s earch). Panel A rep orts gro up s hares, Panel B journey-le vel characteris tics, and Panel C c hat inten t distributions. Inten t shares sum to 100 % within e a ch column, up to r o unding. 13 user initiates a c hat in less than 4% of login sessions (App endix T able A9). Sessions are brief and ty pically concen trated on a single query: the median session con t a ins one request, the median user message is 8 c ha r acters long, and t he median AI reply is 1,145 c haracters. Roughly 79% of sess ions use the assistan t ’s reasoning mode, an extended-inference feature enabled b y default. Conditional o n a do ption, the num b er of sessions p er user a nd requests p er session v ary little across gender, age, cit y t ier, VIP lev el, and device ty p e, although session duration differs somewhat, with o lder users and Android users engag ing in longer sessions (App endix Figures A10, A11, and A12). This relativ e homogeneit y on the in tensiv e margin con trasts with the pronounced demographic differences in adoption do cumente d in Section 3. The contrast suggests that the main marg in of differen tiation is whether consumers try the assistan t at all, rather than how intensiv ely they use it once they adopt. Section 4 sho we d that chat in ten t v ar ies with how users com bine con v ersational AI and traditional searc h within a journey . W e now step bac k and summarize the ov erall distribution of request t yp es a cro ss all chat in teractions. Attraction queries dominate ov erall, accoun ting for 42% of all requests , follow ed by hotels (18%), other (17 %), and trav el planning (7%). Customer supp ort and transp ortation queries are relativ ely rare (5% and 8%, respective ly). In tent v aries meaningfully by age: y ounger users (under 24) are far more lik ely to seek customer supp or t (11 % vs. 3% for ag es 50+), while older users disprop ortionately ask ab out hotels (21% vs. 15%). Across other dimensions, including gender, city tier, VIP lev el, device t yp e, and ten ure, the in ten t distribution is fairly stable (App endix T able A10). As sho wn in Section 4, the in tent mix differs systematically across c hat–search seque nce patterns (T able 1 , P anel C). Here we emphasize a broa der implication of those results: attraction-related c hat is no t confined to the earliest, purely exploratory stage of the jour ney . Its share remains broadly stable across journey progress quin tiles (App endix Figure A13), and Figure 3 (panel a ) sho ws that orders o ccur b oth b efore and after attraction-related c hats. The prominence of att r action queries is notable giv en that Ctrip is primarily kno wn as a hotel and flig ht b o oking platfor m. These patterns suggest that users rely on con v ersationa l 14 AI for o p en-ended destination and activity questions that are difficult to express as k eyw ords, not o nly fo r initial inspiration but also fo r ongo ing destination disco v ery alongside searc h and b o oking. Figure 3 examines whether c hat inten t aligns with subsequen t purc hasing b eha vior b y plotting the k ernel densit y of orders relativ e to the chat even t ( T = 0), separately b y in tent category and order t yp e. A clear alignmen t emerges. When users ask a b out hotels (panel b), hotel o rders cluster sharply just after the c hat ; when users ask ab o ut attractions (panel a), v acatio n and attraction orders b ecome relat ively more prominen t. T rav el planning chats (panel c) are follo w ed b y a mix of order t yp es, consisten t with their broad, exploratory nature. Consumer supp ort chats (panel d) show orders concen trated b efo re the chat, suggesting that these in teractions often follow rather than precede a transaction. Flight and transp ortation panels (e, f ) sho w corresponding spik es in transp o rt orders. These patterns indicate that AI c hat in ten t is not idle brows ing but is correlated with the t yp e of pro ducts users ultimately purc hase. 6 Conclus ion Using data o n 31 million users of Ctrip, China’s largest online trav el plat f orm, w e do c- umen t three sets of st ylized facts ab out the ado ptio n and usage of an LLM-based shopping assistan t. First, adoption is highest among older consumers, female users, and existing rather than new plat f orm users, rev ersing the y ounger, male-sk ew ed profile often do cumen ted for general-purp ose AI to ols. At the same time, the single stro ng est predictor of adoption is the in t ensit y of prior platform engagemen t. Second, AI c hat o ccurs in t he same bro ad phase of the purc hase j ourney as traditional searc h and generally b efore order placemen t. A substan tial share of c hat use o ccurs without a n y a ccompan ying hotel searc h, but when b oth mo dalities are presen t, the most common pattern is in terlea ving, consisten t with users mo ving bac k and forth b et w een c hat a nd searc h within the same journey . Third, users disprop or t io nately turn 15 Figure 3: T emp o ral distribution of orders relativ e to ch at sessions by c hat in ten t 0.0 0.3 0.6 0.9 -1.00 -0 .75 -0.50 -0.25 0 .00 0 .25 0.50 0.75 1 .00 Norm alized Dista nce fr om Chat ( T =0) Density o f Ord ers Or der: Hotel Or der: Vacatio n/Attraction Or der: Transport Attra ction (a) 0.0 0.5 1.0 -1.00 -0 .75 -0.50 -0.25 0 .00 0 .25 0.50 0.75 1 .00 Norm alized Dista nce fr om Chat ( T =0) Density o f Ord ers Or der: Hotel Or der: Vacatio n/Attraction Or der: Transport Hote l (b) 0.0 0.5 1.0 1.5 2.0 -1.00 -0 .75 -0.50 -0.25 0 .00 0 .25 0.50 0.75 1 .00 Norm alized Dista nce fr om Chat ( T =0) Density o f Ord ers Or der: Hotel Or der: Vacatio n/Attraction Or der: Transport Travel Pla nn ing (c) 0.0 0.5 1.0 -1.00 -0 .75 -0.50 -0.25 0 .00 0 .25 0.50 0.75 1 .00 Norm alized Dista nce fr om Chat ( T =0) Density o f Ord ers Or der: Hotel Or der: Vacatio n/Attraction Or der: Transport Custom er Se rvic e (d) 0 50 10 0 15 0 20 0 -1.00 -0 .75 -0.50 -0.25 0 .00 0 .25 0.50 0.75 1 .00 Norm alized Dista nce fr om Chat ( T =0) Density o f Ord ers Or der: Hotel Or der: Vacatio n/Attraction Or der: Transport Fli gh t (e) 0.0 0.5 1.0 1.5 2.0 -1.00 -0 .75 -0.50 -0.25 0 .00 0 .25 0.50 0.75 1 .00 Norm alized Dista nce fr om Chat ( T =0) Density o f Ord ers Or der: Hotel Or der: Vacatio n/Attraction Or der: Transport Other Tran sporta tio n (f) Notes: Eac h panel shows the k ernel densit y of orders relative to the chat ev ent ( T = 0) for a given chat int ent ca tegory . The hor iz ontal axis r epo rts nor malized dis tance fr o m the chat even t; ne g ative v alues indicate order s placed b efore the chat a nd p ositive v alues indicate o r ders placed after . Within each panel, densities ar e s hown separ ately by or der type. The dashed line mar ks the median rela tive order timing. 16 to the assistan t fo r exploratory , har d-to-k eyw ord tasks: a ttraction queries accoun t for 42 % of all c ha t requests, and c hat in tent v aries syste matically with b oth c hat– search sequence patterns and the category of pro ducts subse quen tly purc hased. These findings o ff er sev eral implications for academic researche rs. F or theory , our results suggest that existing framew orks of technology adoption, whic h emphasize tec hnical literacy and inno v ativ eness as driv ers of early adoption, may not apply when AI is embedded within a domain-sp ecific commercial in terface. The rev ersal of the standar d age and gender g radien ts p oin ts tow ard a search-cost-reduc tion mec hanism: users who face higher costs na vigating traditional k eyw ord in terfaces ma y b enefit most f rom conv ersational AI, making t hem more lik ely to adopt rather than less. F ormalizing this mec hanism is a promising direction f o r theoretical w o rk. F or empirical researc h, our descriptiv e findings can inform the design and in t erpretation o f causal studies. The strong asso ciatio n b etw een engagemen t and adoption highligh ts the need for identification strategies tha t separate exp osure from preference, suc h as randomized v aria t ion in the visibilit y or placemen t of AI features. The in terleaving of c hat and searc h suggests tha t experiments randomizing AI access may a ff ect not only direct outcomes but also traditio nal searc h b eha vior, an imp or tan t consideration fo r exp erimen- tal design. The in ten t- to-purc hase correlation do cumen ted in Figure 3 provide s a natural starting p oint for studying whether AI c hat causally shifts purc hase comp osition or simply reflects pre-existing in ten t. F or platform mana gers, our results highligh t t wo design priorities. First, since an im- p ortant margin a pp ears to b e initia l trial rather than con tin ued engagemen t, strategies that encourage first-t ime in teractions, suc h as contextual prompts during activ e searc h, ma y b e more effectiv e than features aimed at deep ening usage among existing a dopters. Second, the dominance of exploratory , op en-ended queries (attractio ns, tra v el pla nning) suggests that AI assistan ts should b e optimized for disco v ery a nd inspiration ra ther t ha n na rro wly for trans- actional automat ion. F or p olicymak ers concerned with equitable access to AI-enhanced services , the finding that older consume rs and users not t ypically view ed as early adopters 17 of general-purp ose AI are the most activ e adopters in this setting pro vides a counterpoint to concerns that generativ e AI will primarily b enefit y ounger, digitally fluen t p opulations, though this pattern ma y b e sp ecific to platform-embedded con texts where AI reduces rather than increases complexit y . F unding and Comp e ting In terests All authors certify that they hav e no affilia t ions with or inv olv emen t in an y or g anization or en tit y with any financial intere st or non-financial intere st in t he sub ject matter or mat eria ls discusse d in this man uscript. The authors hav e no funding to rep or t . References Bic k, A., Blandin, A., Deming, D. J. 2026. The rapid adoption of generativ e AI. Management Science. Brynjolfsson, E., Li, D ., Raymond, L. 2025. Generative AI at w ork. The Quarterly Journal of Economics. 140 (2), 889–94 2 . Chatterji, A., Cunningham, T., Deming, D. J., Hitzig, Z., Ong, C., Shan, C. Y., W adman, K. 2025. Ho w p eople use ChatGPT. National Bureau of Economic R esearch . Draxler, F., Busc hek, D., T a v ast, M., H¨ am¨ al¨ ainen, P ., Sc hmidt, A., Kulshrestha, J., W elsc h, R. 2023. Gender, age, and tec hnology education influence the adoption and appropriatio n of LLMs. arXiv preprin t arXiv:2310.0 6556. Goldfarb, A., Prince, J. 2 008. In ternet adoption and usage patterns are differen t: Implica- tions for the digital divide. Information Economics and P olicy . 20 (1), 2–15. Handa, K., T amkin, A., McCain, M. et a l. 2025. Which economic tasks a r e p erformed with AI? Evidence from millions of Claude conv ersations. a rXiv preprin t arXiv:2503.0 4 761. 18 Honk a, E., Horta¸ csu, A., Wilden b eest, M. 2019. Empirical searc h and consideration sets. In Handb o ok of the Economics of Mark eting, V ol. 1 , 193–257, Elsevie r. Li, B., La i, E. Y., W ang, X. S. 2025. F rom to ols to agents: Meta-analytic insigh ts into h uman acceptance of AI. Journal of Mark eting. 0 (0) , 002 224292513 55266. Lin, S., Shi, Z . J., Sun, X. 2025. T o wards intelligen t shopping assistan t: Can LLM c ha tb ot emp o w er consumer decision making? Av ailable at SSRN 5088 975. Otis, N. G., Haas, B., Cranney , K., Delecourt, S., Koning, R. 2024. Glo bal evidence on gender gaps and generativ e AI. P a dilla , N., Lam, H. T., La mbrec h t, A., Hollen b ec k, B. 2025. The impact of LLM adopt io n on online user b eha vior. Av ailable at SSRN 5393 256. Rogers, E. 1962. Diffusion of Inno v ations. F ree Press o f Glenco e. Sc hubert, G ., Zhang, M. B., Blank, M. 2026. The household impact of generativ e AI: Evi- dence from in ternet bro wsing b eha vior. Av ailable at SSRN. Sun, C., Shi, Z., Liu, X., Ghose, A. 202 5. The effect of v oice AI o n digital commerce. Information Systems Researc h. T omlinson, K., Jaffe, S., W ang, W., Counts, S., Suri, S. 2025. W o r king with AI: Measuring the o ccupational implications of generative AI. arXiv preprin t arXiv:2507.0 7 935. Ursu, R., Seiler, S., Honk a, E. 20 2 5. The sequen tial searc h mo del: A fra mework for empirical researc h. Quan titativ e Mark eting and Economics. 23 (1), 1 65–213. Y an, S., Zhong, H., Zhong, Z., Zhou, W., Meh ta , N. 2025. The impact of reasoning AI on consumer purchas es: Evidence from an o nline platfo rm field exp erimen t. Av aila ble at SSRN 5631050. 19 Y ang, J., Y onac k, N., Zysk owsk i, K., Y arats, D., Ho, J., Ma, J. 2 025. The adoption and usage of AI agen ts: Early evidence from P erplexit y. arXiv preprin t arXiv:2512.0 7828. 20 Online App endix to Shoppin g w ith a Platform AI Assis tan t: Who Adopt s, When in the Journey , and What F or Marc h 2026 1 A1 Additio nal T ables and Figures T able A1: Summary statistics by AI chat a do ption status AI chat adopters AI chat non-adopters Difference V ariable N Mean S.D. N Mean S.D. Diff. t -stat Panel A: Demo gr aphics and ac c ount status F emale 1,904,3 68 0.516 0.500 29,237 ,985 0.440 0.496 0.0 76 204.492 Age group 1,904,3 68 2.616 1.096 29,237 ,985 2.186 1.180 0.4 30 521.849 New u ser indicator 1,904,3 68 0.430 0.495 29,237 ,985 0.516 0.500 − 0.085 − 230.466 iOS d evice indicator 1,904,368 0.379 0.485 29,237,985 0.490 0.500 − 0.112 − 306.670 VIP status (leve ls 4–6) 1,90 4,368 0.123 0.328 29,237,985 0.062 0.242 0.060 249.793 High s tar rating (4–5) 1,904,3 68 0.305 0.460 29,237 ,985 0.249 0.433 0.0 56 163.219 Cit y level 1,904,3 68 2.167 0.892 29,237 ,985 2.172 0.939 − 0.005 − 7.814 Panel B: Pl atform engagement T otal clic ks 1,904,3 68 66.507 184.51 2 29,237,9 85 28.17 4 89.014 38.333 284 .546 T otal search queries 1,904,3 68 150.486 619.324 29,237,985 66.772 347 .792 83.714 184.6 46 T otal login minutes 1,904,3 68 796.904 1,335.4 74 29,237,985 354.714 660.67 3 442.191 453.331 Number of login sessions 1,904,368 59.653 68.5 15 29,237, 985 32.7 88 44.218 26.864 53 3.890 Av erage minutes p er session 1,904,3 68 11.798 8.724 29,237,985 9.290 11.614 2.508 375.627 Panel C: P ur chasing activity T otal orders (any t yp e) 1,904,368 4.015 10.159 29,237, 985 2.484 5.588 1.5 30 205.858 Hotel ord ers 1,904,3 68 1.588 6.615 29,237 ,985 0.900 2.948 0.6 89 142.716 Fligh t orders 1,904,3 68 0.689 2.240 29,237 ,985 0.484 2.150 0.2 05 122.708 T rain orders 1,904,368 1.237 3.429 29,237,985 0.956 2.938 0.281 110.498 V acation pack age orders 1,904,3 68 0.048 0.389 29,237 ,985 0.017 0.153 0.0 31 110.669 A ttraction/a ctivit y orders 1,904,368 0.043 0.923 29,237,985 0.013 0.372 0.030 44.694 Tic k et orders 1,904,3 68 0.410 5.288 29,237 ,985 0.115 1.597 0.2 94 76.577 Notes : This table rep orts means and standard deviations f or AI c hat adop ters and non-adopters. Diff. is the difference in means b etw een adopters and non-adopters. Th e rep orted t -statistic tests equality of group means. 2 Figure A1: Estimated marginal effects on AI c hat adoption from linear proba bility , logit, and probit mo dels log (1+ T otal or ders) log (1+ Sea rch queries) log (1+ Cl i cks) log (1+ A vg m in /session) log (1+ Logi n session s) log (1+ Logi n minutes) Age 50+ Age 35-49 Age 25-34 New user Female Prefect ure Ci ty Provin cia l Capi tal Munici pal i ty Int l/SAR /O ther Star 4+ VIP 4+ iOS Devi ce -5. 00 0.00 5.00 Effect on AI Chat Adoption (Percentage Points) Li ne ar Prob ab il ity M od el Lo gi t M odel Prob it Mo del Notes : This figure rep or ts e s timated margina l effects on AI chat adoption fro m the linear pr obability , logit, a nd probit mo dels, expre s sed in p ercentage po int s. The cov ariates are listed on the vertical axis. The vertical dashed line mark s zer o, and the horizontal a xis shows the estimated effect in perce ntage po in ts. 3 Figure A2: Perm utation-based v a riable imp orta nce fro m a random forest mo del of AI c hat adoption Intl/SAR/Other VIP 4+ Prefect ur e City Provincial Cap ital Mun icipality Star 4 + Fe ma le New user iOS Device log( 1+T otal o rde rs) age gro up_ facto r log( 1+Search qu erie s) log( 1+Clicks) log( 1+Avg min/ session) log( 1+Log in sessio ns) log( 1+Log in m inute s) 0.0 0 0.0 5 0.1 0 V a riab le Impo rt an c e Im po rtan c e 0.0 50 0.1 00 Notes : This fig ure rep or ts p er m utation-based v aria ble-impo rtance scor es from a r andom fore st mo del of AI chat adoption. Ea c h bar shows the decrease in mo del acc uracy when the corre s po nding feature is r andomly per mu ted, with lar ger v alues indicating grea ter predictive imp or tance. F eatures ar e listed on the vertical axis. 4 T able A2: Predictiv e P erformance of Adoption Mo dels Sp ecification LPM R 2 RF A UC Demographics only 0.014 0.635 Demographics + Engagemen t 0.036 0.962 Notes: This table rep orts the predictive p erformance of AI c hat adoption mo dels un der t wo sets of co v ariates. LPM R 2 is the coefficien t o f determination from a linear probabilit y mo del, and RF A UC is the area und er th e ROC curve from a random forest cla ssifier. The demographics-only s p ecification in cludes female, age group, new user, iOS device, VIP status, high star rating, and cit y lev el. Th e demographics-plus-engagemen t s p ecification additionally in clud es total login minutes, n umber of login sessions, av erage min utes p er session, total clicks, total searc h q u eries, and total orders. 5 Figure A3: Illustrativ e customer journey timelines for ten randomly selected users Use r 1 Use r 2 Use r 3 Use r 4 Use r 5 Use r 6 Use r 7 Use r 8 Use r 9 Use r 10 0 2 4 6 8 10 12 14 16 18 20 22 24 26 28 30 Da ys Si nce Fi rst Logi n Journe y Ho tel Search Ch at Orde r log( 1 + Clic ks ) 0.5 1 .0 1.5 Notes : This fig ur e illustr a tes the jo ur ney patterns o f ten randomly selected users dur ing the fir st 30 days after their initial lo gin. Each panel corresp onds to one use r . The hor izontal axis shows the num be r of days since the user’s first log in. Key journey even ts, including hotel sear ches, chat sessions, or ders, and journey endpo in ts, ar e marked a long ea ch user’s timeline. 6 T able A3: Summary statistics of customer j o urneys V ariable N Mean S.D. P5 P25 Median P75 P95 Panel A: Al l journeys Journey length (hours) 253,20 9,391 34.110 79.577 0.000 0.000 7.000 43.000 138.000 Num b er of login sessions 253,209 ,391 4.235 10.717 1.000 1.000 2.000 4.000 14.000 T otal login time (minutes) 253,209,391 46.951 171.683 0.000 2.00 0 11.00 0 45.000 193.000 Num b er of c hat sessions 253,20 9,391 0.001 0.059 0.000 0.00 0 0.000 0.000 0.000 Num b er of orders 253,20 9,391 0.315 0.831 0.000 0.00 0 0.000 0.000 2.000 Num b er of clic ks 253 ,209,39 1 3.747 26.450 0.000 0.0 00 0.000 1.000 17.000 Num b er of queries 253,209,391 1.88 5 8.748 0.00 0 0.000 0.00 0 1.000 9.000 Num b er of ke ywo rd clicks 253,2 09,391 1.085 10.133 0.000 0.000 0.000 0.000 5.000 Num b er of hotel searc hes 253,209,39 1 8.814 101.664 0.000 0.000 0.000 2.000 34.000 Panel B: Journeys with chat vs. journeys w ithout chat With Chat Without Chat N Mean S.D. N Mean S.D. t -stat p -v alue Journey length (hours) 192,40 2 104.104 205.604 253,016 ,990 34.057 79.381 149.430 < 0.001 Num b er of login sessions 192,402 14.212 40.454 253,016, 990 4.227 10.6 59 108.26 6 < 0.001 T otal login time (minutes) 192 ,402 252.631 940.980 253,016,990 46.795 169.682 95.94 9 < 0.001 Num b er of c hat sessions 192,402 1.447 1.582 253,016,990 0.000 0.000 401.2 75 < 0.001 Num b er of orders 192,40 2 0.50 8 6.099 253,016,990 0.315 0.814 13.904 < 0.001 Num b er of clic ks 192,40 2 24.141 136.916 253,016,990 3.732 26.184 65.382 < 0.001 Num b er of queries 192,40 2 6.57 5 33.440 253,016 ,990 1.881 8.701 61.561 < 0.001 Num b er of ke ywo rd clicks 192,402 6.625 43.227 253,016 ,990 1.081 10.066 56.256 < 0.001 Num b er of hotel searc hes 192,402 52.89 7 456.480 253,016, 990 8.780 100.913 42.391 < 0.001 Notes : Th is table rep orts journ ey-level su mmary statistics. Panel A rep orts the num b er of observ ations, mean, standard deviation, and selected p ercent iles for all journeys. P anel B compares journeys with at least one AI c hat session to journeys without c hat. The rep orted t -statistics and p -v alues are from tests of equ al means across the tw o groups. All statistics are rounded to three decimal places. 7 Figure A4: Normalized temp oral distribution of ev en ts relativ e t o c hat sessions 0 .0 0 .3 0 .6 0 .9 -1.0 0 -0.7 5 -0.5 0 -0.2 5 0 .0 0 0 .2 5 0 .5 0 0. 7 5 1. 0 0 No rma l ize d Distan ce f rom Ch a t (T=0) De n si ty Notes : This fig ure shows the kernel densit y estimates of the normaliz e d tempo r al dista nce b etw ee n each event type (hotel s earches, clicks, a nd o r ders) and the chat s e ssion, wher e the ch at even t is set a s the time or igin ( T = 0 ). F or each jo ur ney , the median timesta mp of each ev ent type is computed, a nd the normalized distance is calcula ted as (median even t time − median chat time) / journey duration, so that nega tive v alues indicate event s o ccurring b efore the chat and p ositive v alues indicate e vents o ccurring after. Ea ch jour ney co nt ributes exa ctly one obser v ation p er even t type. The sa mple is res tricted to order-jour neys containing all fo ur a ctivit y t yp es (orders, chats, hotel sea rches, and clicks). The vertical da shed lines indicate the median of the normalized distance for each even t type . The vertical so lid red line ma r ks T = 0 (the chat even t). 8 Figure A5 : Normalized temporal distribution of ev en ts relativ e to order placemen t (with-c hat journeys) 0 .0 0 .3 0 .6 0 .9 -1.0 0 -0.7 5 -0.5 0 -0.2 5 0 .0 0 0 .2 5 0 .5 0 0. 7 5 1. 0 0 No rma l ize d Distan ce f rom O rde r (T =0) De n si ty Notes : This fig ure shows the kernel densit y estimates of the normaliz e d tempo r al dista nce b etw ee n each ev en t type (chat sessions , hotel searches, and clicks) and the or der placement, where the o rder even t is set as the time orig in ( T = 0). F or eac h journey , the median timestamp of each even t t yp e is co mputed, a nd the normalized dista nce is calculated as (median even t time − median o rder time) / journey duration, so that nega tive v alues indicate e ven ts o ccurring b efore the order and po sitive v a lues indica te even ts o ccur ring after. Each journey contributes exac tly o ne o bserv ation per even t type. The sample is r estricted to order- journeys containing all four a ctivity type s (orders, chats, hotel searches, and clicks). The vertical das he d lines indicate the median of the normalized distance for each even t type. The v er tical solid red line marks T = 0 (the order even t). 9 Figure A6: Normalized temp oral distribution of ev ents relativ e to order placemen t (no- c hat journeys) 0 .0 0 .5 1 .0 1 .5 2 .0 -1.0 0 -0.7 5 -0.5 0 -0.2 5 0 .0 0 0 .2 5 0 .5 0 0. 7 5 1. 0 0 No rma l ize d Distan ce f rom O rde r (T =0) De n si ty Notes : This fig ure shows the kernel densit y estimates of the normaliz e d tempo r al dista nce b etw ee n each even t type (hotel sea rches and clicks) and the o r der pla cement , where the or der even t is set as the time origin ( T = 0). F or each journey , the median timestamp of each event type is computed, and the no rmalized distance is calculated as (median even t time − median order time) / jour ney duration, so that nega tiv e v alues indicate even ts o ccur ring b efore the or der a nd p os itiv e v alues indicate even ts o ccurr ing after. E ach journey con tributes exa ctly one obs erv ation p er even t type. The sample is restricted to order - journeys that con tain hotel searches and clicks but no chat sessions. The vertical dashed lines indica te the median of the normalized distance for each even t t yp e. The vertical solid red line marks T = 0 (the o rder event) . 10 T able A4: Session Characteristics b y Relativ e Timing of Chat a nd Search Chat-Before- Search Chat-Between-Searc h Chat-After-Se a rch Chat-Only Panel A: Pr evalenc e Share of sessio ns (%) 10.6 12.0 10.2 67.2 Panel B: Session char acteristics Mean session length (hours ) 0.8 1.2 0.8 0.4 Mean chat sessions 1.3 1.4 1.3 1.4 Mean hotel sea rches 11.3 35.8 11.2 0.0 Mean clicks 5.1 14.6 4.8 0.0 Mean orders 0.02 0.06 0.02 0.01 Conv er sion rate (%) 1.1 1.9 1 .1 0.4 Panel C: Chat intent distribution (%) A ttraction 38.6 37.3 43.3 43.4 Hotel 33.2 43.1 29.9 8.8 T ravel Planning 6 .4 3.3 4.4 8.6 Customer Service 4.1 3.1 4.1 6.3 Flight 0.6 0.2 0.5 2.5 Other T r ansp ortation 4.2 3.5 4.6 10.4 Other 12.9 9.6 13.2 20.0 Notes : This ta ble summarizes sessions co n taining at least one AI chat even t. Chat-Befor e-Se ar ch , Cha t-Betwe en- Se ar ch , and Chat-After-Se ar ch sessions each contain at least o ne hotel sea r ch, with the classification ba s ed on the relative ordering of chat and sear ch event s within the session. Cha t-Befor e-Se ar ch sessions hav e chat even ts o ccurring be fore s earch even ts , Chat-After-Se ar ch sessio ns have chat events o ccurring after s earch even ts, and Chat-Betwe en-Se ar ch sessions hav e chat and search events int erleav ed. Chat-On ly sess ions contain at least o ne chat even t but no ho tel search. Panel A repo rts the share of sessions in each group. Panel B r epo rts mea n session-level characteristics. Conversion rate is the p ercentage of sess ions with a t lea st one o rder. Panel C rep orts the distribution of c hat inten t categories within each g r oup; int ent shares sum to 100% within ea ch column, up to r o unding. The s ample contains 206 ,245 sessions. 11 T able A5: Journey Characteristics b y Relative Timing of Chat and Search (48- Hour Inac- tivit y Definition) Chat-Before- Search Chat-Betw e e n-Search Chat-After-Sear c h Chat-Only Panel A: Pr evalenc e Share of journeys (%) 15.049 30.804 12.411 41.736 Panel B: Jour ney char acteristics Median journey length (hour s) 51.727 94.904 51.889 18.160 Mean login sessio ns 11.282 28.639 10.521 5.562 Mean chat sessions 1.377 1.565 1.357 1.411 Mean hotel sea rches 24.196 149 .860 21.350 0.000 Mean clicks 11.423 68.307 9.468 0.000 Mean orders 0.549 0.646 0.451 0.222 Conv er sion rate (%) 39.292 42.977 31.153 18.343 Panel C: Chat intent distribution (%) A ttraction 44.208 41.818 48.406 39.955 Hotel 17.965 30.469 17.690 7.056 T ravel Planning 9.832 6.081 5.399 8.021 Customer Service 4.874 3.746 5.566 6.926 Flight 1.372 0.587 0.925 3.233 Other T r ansp ortation 6.231 4.854 5.649 12.66 8 Other 15.518 12.445 16.364 22.141 Notes : This table rep orts a ro bustness version of T able 1 using an alterna tive journey definition based only on a 48- hour inactivity rule. Consecutive log in sessions are gro up ed into the same jour ney unless the ga p be tw een one s ession’s log out and the next sess ion’s login is a t least 48 hour s; unlike the baseline definition, no additional order-ba sed splitting rule is applied. The table compares four groups of jo ur neys containing a t least one AI chat even t. The first three groups a lso co n tain at least one hotel search and are classified b y the re la tive o r dering of chat and search within the jour ney: Chat-Befor e-Se ar ch , Chat-Betwe en-Se ar ch , a nd Chat-After-Se ar ch . Chat- Only journeys contain c hat but no hotel s earch. Panel A rep orts the share of journeys in ea ch gr oup. Panel B rep orts journey-level ch aracter istics; conv ersion rate denotes the share of journeys with a t least o ne order . Panel C rep or ts the distribution of chat in ten t ca tegories within each group; shar es sum to 100% within e a ch co lumn, up to rounding. Differences across the three chat-and-search groups are statistically significa n t a t the 0.1% level, and the chat-in ten t distr ibution also differs sig nificantly across these gr oups ( χ 2 = 4 , 419 . 1, p < 0 . 00 1). 12 T able A6: Journey Characteristics b y Relative Timing of Chat and Search (48- Hour Inac- tivit y , 8-Hour Order-G a p Definition) Chat-Before- Search Chat-Betw e e n-Search Chat-After-Sear c h Chat-Only Panel A: Pr evalenc e Share of journeys (%) 15.089 30.940 12.414 41.557 Panel B: Jour ney char acteristics Median journey length (hour s) 51.878 94.874 52.037 18.472 Mean login sessio ns 11.319 28.620 10.548 5.586 Mean chat sessions 1.377 1.566 1.358 1.411 Mean hotel sea rches 24.397 150 .109 21.415 0.000 Mean clicks 11.524 68.420 9.528 0.000 Mean orders 0.571 0.705 0.473 0.225 Conv er sion rate (%) 39.430 43.206 31.137 17.957 Panel C: Chat intent distribution (%) A ttraction 44.217 41.884 48.492 39.861 Hotel 17.902 30.374 17.681 7.063 T ravel Planning 9.840 6.071 5.387 8.035 Customer Service 4.879 3.770 5.532 6.928 Flight 1.370 0.589 0.922 3.244 Other T r ansp ortation 6.239 4.881 5.600 12.69 3 Other 15.553 12.430 16.386 22.177 Notes : This table rep or ts a robustness version of T able 1 using an alternative jour ne y definition that combines adjacent log in sessio ns into the same journey unless the inactivity g ap is at least 48 hour s, and additionally splits journeys b etw een adjac en t o rder-co ntaining sessions when the inactivity gap exceeds 8 ho urs. The table compares four groups of journey s containing at least one AI chat ev ent. The firs t three groups also co n tain at least one hotel search and a r e classified by the r elative ordering of chat and s earch within the journey: Chat-Befor e-Se ar ch , Chat- Betwe en-Se ar ch , and Chat-After-Se ar ch . Chat-Only journeys cont ain c ha t but no hotel search. Panel A r epo rts the share of journeys in each group. Panel B rep orts journey-level characteristics; conv ersion r ate deno tes the share of journeys with at least one order. Panel C rep orts the distribution of c hat inten t categ o ries within each gr oup; shares sum to 100 % within each column, up to rounding. Differences acro ss the three chat-and-search groups are s tatistically sig nificant at the 0.1% level, and the chat-in tent distribution also differs sig nificantly acr oss these groups ( χ 2 = 4 , 4 1 1 . 5, p < 0 . 0 01). 13 T able A7: Journey Characteristics b y Relative Timing of Chat and Search (48- Hour Inac- tivit y , 12-Hour Order-Gap Definition) Chat-Before- Search Chat-Betw e e n-Search Chat-After-Sear c h Chat-Only Panel A: Pr evalenc e Share of journeys (%) 15.091 30.957 12.420 41.531 Panel B: Jour ney char acteristics Median journey length (hour s) 51.938 94.876 52.049 18.526 Mean login sessio ns 11.324 28.617 10.553 5.590 Mean chat sessions 1.377 1.566 1.358 1.411 Mean hotel sea rches 24.428 150 .159 21.437 0.000 Mean clicks 11.537 68.441 9.534 0.000 Mean orders 0.578 0.716 0.481 0.226 Conv er sion rate (%) 39.432 43.232 31.170 17.898 Panel C: Chat intent distribution (%) A ttraction 44.230 41.881 48.515 39.849 Hotel 17.878 30.367 17.664 7.066 T ravel Planning 9.847 6.069 5.386 8.036 Customer Service 4.888 3.772 5.531 6.925 Flight 1.370 0.591 0.915 3.247 Other T r ansp ortation 6.241 4.888 5.571 12.70 0 Other 15.545 12.431 16.419 22.176 Notes : This table rep or ts a robustness version of T able 1 using an alternative jour ne y definition that combines adjacent log in sessio ns into the same journey unless the inactivity g ap is at least 48 hour s, and additionally splits journeys be t ween adjacent order-containing sessions when the inactivit y gap exceeds 1 2 hours. T he ta ble compares four groups of journey s containing at least one AI chat ev ent. The firs t three groups also co n tain at least one hotel search and a r e classified by the r elative ordering of chat and s earch within the journey: Chat-Befor e-Se ar ch , Chat- Betwe en-Se ar ch , and Chat-After-Se ar ch . Chat-Only journeys cont ain c ha t but no hotel search. Panel A r epo rts the share of journeys in each group. Panel B rep orts journey-level characteristics; conv ersion r ate deno tes the share of journeys with at least one order. Panel C rep orts the distribution of c hat inten t categ o ries within each gr oup; shares sum to 100 % within each column, up to rounding. Differences acro ss the three chat-and-search groups are s tatistically sig nificant at the 0.1% level, and the chat-in tent distribution also differs sig nificantly acr oss these groups ( χ 2 = 4 , 4 2 5 . 3, p < 0 . 0 01). 14 Figure A7: Densit y of Ev en t T yp es o ve r the Course of the Customer Journey (48-Hour Inactivit y Definition) Cl i ck Order Ch a t Sea rch 0 % 2 0 % 4 0 % 6 0 % 8 0 % 1 0 0 % 0 % 2 0 % 4 0 % 6 0 % 8 0 % 1 0 0 % 0 .0 0 0 .0 2 0 .0 4 0 .0 6 0 .0 0 0 .0 2 0 .0 4 0 .0 6 0 .0 0 0 0 .0 2 5 0 .0 5 0 0 .0 7 5 0 .0 0 0 .0 2 0 .0 4 0 .0 6 Jou rn e y Pro gre ss De n si ty Notes : This figure r ep o rts a robustness chec k of Figure 2 using an alternative jour ney definitio n that combines adjace n t lo gin sessions into a sing le jo urney unless the inactivity gap b etw een one session’s log out a nd the next sessio n’s lo gin is at le ast 48 ho ur s, without applying the additional order-ba sed splitting r ule used in the baseline definition. Each panel displays the kernel density estimate of one of four even t types—clicks, orders, c hats , and hotel sea rches—o ver the normalized progre s sion of the customer journey fro m 0% to 100%. The horizontal axis r epresents journey progre s s a s a p er c e n tage of total journey duration, a nd the vertical ax is r epresents dens it y . The vertical dashed line in each panel indicates the media n journey prog ress at which the corresp onding even t o ccurs . 15 Figure A8: Densit y of Ev en t T yp es o ve r the Course of the Customer Journey (48-Hour Inactivit y , 8-Hour Order-Ga p Definition) Cl i ck Order Ch a t Sea rch 0 % 2 0 % 4 0 % 6 0 % 8 0 % 1 0 0 % 0 % 2 0 % 4 0 % 6 0 % 8 0 % 1 0 0 % 0 .0 0 0 .0 2 0 .0 4 0 .0 6 0 .0 0 0 .0 2 0 .0 4 0 .0 6 0 .0 0 0 0 .0 2 5 0 .0 5 0 0 .0 7 5 0 .0 0 0 .0 2 0 .0 4 0 .0 6 Jou rn e y Pro gre ss De n si ty Notes : This figure r ep o rts a robustness chec k of Figure 2 using an alternative jour ney definitio n that combines adjacent login s essions into a single journey unless the inactivity gap is at lea st 48 hours, and splits journeys b etw een adjacent o r der-containing sess io ns whenever the inac tiv ity gap exceeds 8 hours ra ther tha n the 4-ho ur thre shold used in the base line definition. Each panel displays the kernel density estimate of one of four e vent types—clicks, o rders, chats, and hotel s earches—ov er the nor malized prog ression of the custo mer journey from 0% to 1 00%. The horizontal axis r epresents journey progres s as a percentage of total journey duration, and the vertical axis re presents density . The vertical dashed line in each panel indicates the media n journey prog r ess at which the corresp onding even t o ccur s. 16 Figure A9: Densit y of Ev en t T yp es o ve r the Course of the Customer Journey (48-Hour Inactivit y , 12-Hour Order-G a p Definition) Cl i ck Order Ch a t Sea rch 0 % 2 0 % 4 0 % 6 0 % 8 0 % 1 0 0 % 0 % 2 0 % 4 0 % 6 0 % 8 0 % 1 0 0 % 0 .0 0 0 .0 2 0 .0 4 0 .0 6 0 .0 0 0 .0 1 0 .0 2 0 .0 3 0 .0 4 0 .0 5 0 .0 6 0 .0 0 0 0 .0 2 5 0 .0 5 0 0 .0 7 5 0 .0 0 0 .0 2 0 .0 4 0 .0 6 Jou rn e y Pro gre ss De n si ty Notes : This figure r ep o rts a robustness chec k of Figure 2 using an alternative jour ney definitio n that combines adjacent login s essions into a single journey unless the inactivity gap is at lea st 48 hours, and splits journeys b etw een adjacent o r der-containing sess io ns whenever the inac tiv ity gap exceeds 12 hour s rather than the 4 -hour threshold used in the baseline definition. Each panel displays the kernel density estimate of one of four e vent types—clicks, o rders, chats, and hotel s earches—ov er the nor malized prog ression of the custo mer journey from 0% to 1 00%. The horizontal axis r epresents journey progres s as a percentage of total journey duration, and the vertical axis re presents density . The vertical dashed line in each panel indicates the media n journey prog r ess at which the corresp onding even t o ccur s. 17 T able A8: Illustrativ e AI Chat Con v ersations by Inte n t Category In ten t User Query (T ranslated) AI Response (Exc erpt, T ranslated) At traction What are the must-visit attrac- tions in Qingdao? Highlights i nclude Zhanqiao Pier, Badaguan Scenic Area, and Laoshan Scenic A r ea (trails fr om ¥ 120). Hotel Goo d-v alue hotels or guesthouses near a subw ay stat ion in Beij ing? Six metro-adjacent options are compared, i nclud- ing a historic s iheyuan courty ard hote l (255m from station, ¥ 394/nigh t) and a loft apartmen t ( ¥ 381/nigh t, 4.7 rating). T ra v el Planning What is the best one -day itinerary for Macau? Start at Macau T ow er, con tinue to the V enetian and Parisian resorts, and end with the figure-eight F erris wheel at night. Consumer Support How do I register f or Pho enix membership through the T rip. com app? Please con tact T rip.com customer servi ce via in- app live c hat or phone supp ort using the li nk be- low. Flight Whic h economy -class fligh ts de- parting Dali hav e av ai l able seats today? Whic h dest ination cit y are you flying to? Other T ransp ortation What is the driving route from Heihe to W udalianc hi? The drive is appro ximately 247 km and takes around 3 hours; see the link b elow for the full route. Other Can y ou share some financial fraud prev en tion tips? This assistan t co ve rs trav el topics only; please con- sult a dedicated resource f or financial que ries. Notes : This table presents one illustrative AI c hat conv er sation for each in ten t category . User queries and AI r espo nses ar e tra ns lated fro m Chinese. The r e po r ted re s po nses a re brief excer pts rather than full transcripts and are shown fo r illustration only . 18 T able A9: Summary statistics for AI assistan t engagemen t and usage patterns V ariable N Mean S.D. P5 P25 Median P75 P95 Panel A: User-level A I assistant engagement T otal num ber of log ins 31,129,6 29 34.339 46.403 2.000 7.000 19.000 44.000 114.000 Av erage chat sessions p er login among AI adop ters 188,647 0.09 2 0.171 0.006 0.016 0.03 5 0.087 0.33 3 Panel B: Session-level summar y statistics Number of requests in session 213,460 1 .313 0.936 1.000 1.000 1.000 1.000 3.000 Characters p er minute 213,460 1,456.520 3,710.211 18.000 458.000 1,168.079 1,656.000 2,598.000 Deep-thinking mo de used 213 ,460 0.787 0.409 0.000 1.000 1.000 1.000 1.000 Panel C: R e quest-level summary sta tistics User message length (chars) 280,350 10.519 13.670 2.0 00 5.000 8.000 12. 000 25.000 Assistan t r ep ly length (chars) 280,350 1,089.13 0 717.437 22.000 459.000 1,145.000 1,596.000 2,187.000 User message information en tropy 280,350 1 .049 0.654 0.000 1.000 1.000 1.000 2.000 Assistan t r ep ly information ent ropy 280,350 3.041 1.793 0.000 2.000 4.000 4.00 0 5.000 Reply flagged as incomplete 280,350 0 .089 0.285 0.000 0.000 0.000 0.000 1.000 Notes : This table rep orts su mmary statistics for AI assistant engagemen t and u sage patterns at three levels of observat ion. P anel A rep orts user-lev el measures, including ov erall platform login activit y and AI assistant usage among adopters. Panel B rep orts session-level statistics for AI assistan t sessions. Panel C rep orts request-leve l charact eristics for in dividual u ser requests and assistant replies. N denotes the num ber of observ ations, S.D. denotes the stand ard deviation, and P5, P25, P75, and P95 denote the 5th, 25th, 75th, and 95th p ercen tiles, respectively . F or ind icator v ariables, th e mean can b e in terpreted as a p r op ortion. Sample sizes differ across pan els b ecause the unit of observat ion v aries. All stati stics are round ed to three decimal places. 19 T able A10: User in ten t distribution of AI assistant requests User Inten t User group A ttr. Hotel Plan. C.S. Fligh t T rans. Other Panel A: F ul l sample All u s ers 0.421 0.177 0.073 0.054 0.018 0.083 0.173 Panel B: Gender F emale 0.450 0.175 0.068 0.053 0.015 0.076 0.163 Male 0.408 0.171 0.083 0.056 0.020 0.079 0.183 Panel C: A ge gr oup Age 24 and b elow 0.352 0.148 0.057 0.113 0.021 0.099 0.209 Age 25–34 0.41 2 0.175 0.079 0.079 0.01 8 0.052 0.184 Age 35–49 0.47 8 0.162 0.082 0.044 0.01 3 0.069 0.152 Age 50+ 0.377 0.21 1 0.059 0.026 0.022 0.117 0.18 8 Panel D: City level Municipalit y (highest) 0.443 0.182 0.079 0.051 0.01 5 0.055 0.174 Pro vincial capital 0.425 0.181 0.075 0.05 7 0.017 0.073 0.172 Prefecture cit y 0.412 0.171 0.071 0.053 0.020 0.102 0.172 Count y-lev el city (lo west) 0.413 0.175 0.062 0.052 0.020 0.10 8 0.171 Int l/SAR/Other 0. 352 0.166 0.056 0.072 0.041 0.065 0.249 Panel E: VIP level Silv er VIP 0.377 0.159 0.067 0.060 0.021 0.12 6 0.190 Gold VIP 0.445 0.188 0.077 0.048 0.015 0.066 0.161 Platin um VIP 0.481 0.173 0.078 0.053 0.013 0.046 0.156 Diamond VIP 0.479 0.166 0.063 0.065 0.013 0.048 0.165 Golden Diamond VIP 0.459 0.154 0.059 0.074 0.01 2 0.033 0.208 Blac k Diamond VIP 0.469 0.149 0.030 0.100 0.010 0.033 0.209 Panel F: Devic e iOS 0.447 0.178 0.060 0.068 0.016 0.053 0.178 Android 0.408 0.176 0.080 0.047 0.019 0.099 0.171 Panel G: New vs. existing users New u ser 0.40 0 0.174 0.072 0.061 0.01 9 0.092 0.181 Existing u ser 0.445 0.179 0.075 0.046 0.017 0.073 0.165 Notes : This table rep orts the distribution of AI assistan t request inten ts across user grou p s. Each entry is the share of requests in the corresp onding user group classified into a giv en inten t category . Shares sum to one within each r o w , up to r ounding. Colum n lab els are abbreviated as follows: Att r. = At traction, Plan. = T ra vel Planning, C.S . = Customer Service, and T rans. = Other T ransp ortation. 20 Figure A10: Av era g e n umber of AI c hat sessions p er user by demographic and accoun t c har a cteristics 1.1 3 1.1 3 0.00 0.25 0.50 0.75 1.00 1.25 Male Female Gender Avg Sessi ons pe r User 1.1 4 1.1 4 1.1 1 1.1 3 0.0 0.5 1.0 24- 25-34 35-49 50+ Age Group Avg Sessi ons pe r User 1.1 2 1.1 3 1.1 3 1.1 4 1.1 4 0.0 0.5 1.0 Muni. Prov . Pref. County Others City Leve l Avg Sessi ons pe r User 1.1 2 1.1 4 0.0 0.5 1.0 New User Existing User T enure Avg Sessi ons pe r User 1.1 4 1.0 9 1.1 5 1.1 2 1.1 6 1.1 4 0.0 0.5 1.0 Silver Gold Plat. Diamond Gold Diamond Black Diamond VIP L eve l Avg Sessi ons pe r User 1.1 0 1.1 5 0.0 0.5 1.0 iOS Android Dev i ce T ype Avg Sessi ons pe r User Notes : This figure shows the av e rage num ber o f AI chat sessio ns per use r acro s s six user characteristics: gender, age gr o up, city level, tenure (new versus e xisting use rs), VIP level (Silver, Gold, Platinum, Diamond, Gold Diamond, and Black Diamo nd), and device type (Android versus iOS). Each panel rep orts the mean num ber of chat sessions for the categories within the cor resp onding characteristic. The averages are computed among users with at least one AI chat ses sion during the sample p erio d. 21 Figure A11: Average AI c hat session duration b y demographic and accoun t characteristics 1.8 4 1.6 0 0.0 0.5 1.0 1.5 2.0 Male Female Gender Avg Sessi on Du ratio n 1.7 5 2.3 2 1.1 7 1.4 0 0 1 2 24- 25-34 35-49 50+ Age Group Avg Sessi on Du ratio n 1.8 8 1.9 8 1.7 6 1.5 2 1.7 3 0.0 0.5 1.0 1.5 2.0 Muni. Prov . Pref. County Others City Leve l Avg Sessi on Du ratio n 1.4 9 2.0 9 0.0 0.5 1.0 1.5 2.0 New User Existing User T enure Avg Sessi on Du ratio n 1.8 4 1.7 7 1.9 0 1.2 4 1.7 4 1.4 1 0.0 0.5 1.0 1.5 2.0 Silver Gold Plat. Diamond Gold Diamond Black Diamond VIP L eve l Avg Sessi on Du ratio n 1.0 9 2.2 1 0.0 0.5 1.0 1.5 2.0 2.5 iOS Android Dev i ce T ype Avg Sessi on Du ratio n Notes : This figure shows the average AI chat sessio n dura tion, measur ed in minutes, across six user characteristics : gender, age g roup, cit y level, tenure (new v ersus ex- isting users), VIP level (Silv er, Gold, Pla tinum, Diamond, Gold Diamond, and Black Diamond), and device t yp e (Android versus iOS). Each pane l rep or ts the mean s ession duration for the ca tegories within the co rresp onding characteristic. The av er ages a re computed among users with at least one AI c hat session during the sample p erio d. 22 Figure A12: Av erage num b er of reques ts p er AI c hat session b y demographic a nd accoun t c har a cteristics 1.3 0 1.3 2 0.0 0.5 1.0 1.5 Male Female Gender Avg Re que st per Sessio n 1.3 1 1.3 1 1.3 1 1.3 0 0.0 0.5 1.0 1.5 24- 25-34 35-49 50+ Age Group Avg Re que st per Sessio n 1.3 1 1.3 2 1.3 6 1.3 1 1.3 1 0.0 0.4 0.8 1.2 1.6 Muni. Prov . Pref. County Others City Leve l Avg Re que st per Sessio n 1.3 0 1.3 2 0.0 0.5 1.0 1.5 New User Existing User T enure Avg Re que st per Sessio n 1.2 6 1.3 1 1.3 0 1.2 6 1.3 1 1.3 1 0.0 0.5 1.0 1.5 Silver Gold Plat. Diamond Gold Diamond Black Diamond VIP L eve l Avg Re que st per Sessio n 1.2 8 1.3 3 0.0 0.4 0.8 1.2 iOS Android Dev i ce T ype Avg Re que st per Sessio n Notes : This figur e shows the av erage num b er of user requests p er AI chat session across six use r characteristics: gender, age g r oup, city level, tenure (new versus existing us ers), VIP level (Silver, Gold, Platinum, Diamond, Gold Diamond, and Black Diamo nd), and device type (Android versus iOS). Each panel rep orts the mean n um b er of user r equests per session for the catego ries within the co rresp onding c ha racteristic. The a v erage s are computed among users with at least one AI c hat session during the sample p erio d. 23 Figure A13: Distribution of Chat Requests by Journey Prog ress Quin tiles and Chat Inte n t 86, 789 38, 900 38, 432 36, 066 78, 296 0% 30% 60% 90% 0 2 5 , 0 0 0 5 0 , 0 0 0 7 5 , 0 0 0 0-20% 20-40% 40-60% 60-80% 80- 100 % J ou rn ey P ro gr es s (Qu intil e) Shar e of Ch at Re qu est s N umbe r of Re que s t s At trac tio n Hotel T r av el Pl anni ng Cus tome r Serv ice Fli ght O ther T r ans portati on O ther Notes : This figure s hows the volume and inten t comp ositio n of AI chat requests acros s q uintiles of journey progr ess. The left axis and sta cked bars rep ort the within-quintile s hare of c hat requests by inten t categor y: A ttraction, Hotel, T ravel Planning, Consumer Supp or t, Flight , O ther T ra nspo rtation, and Other. The rig ht a xis and o verlaid line rep or t the to tal num be r of chat requests in ea ch quin tile. 24
Original Paper
Loading high-quality paper...
Comments & Academic Discussion
Loading comments...
Leave a Comment