Calibrating Resident Surveys with Operational Data in Community Planning
Community associations rely heavily on resident surveys to guide decisions about amenities, infrastructure, and services. However, survey responses reflect perceptions that may not directly correspond to underlying operational conditions. This study …
Authors: Irene S. Gabashvili
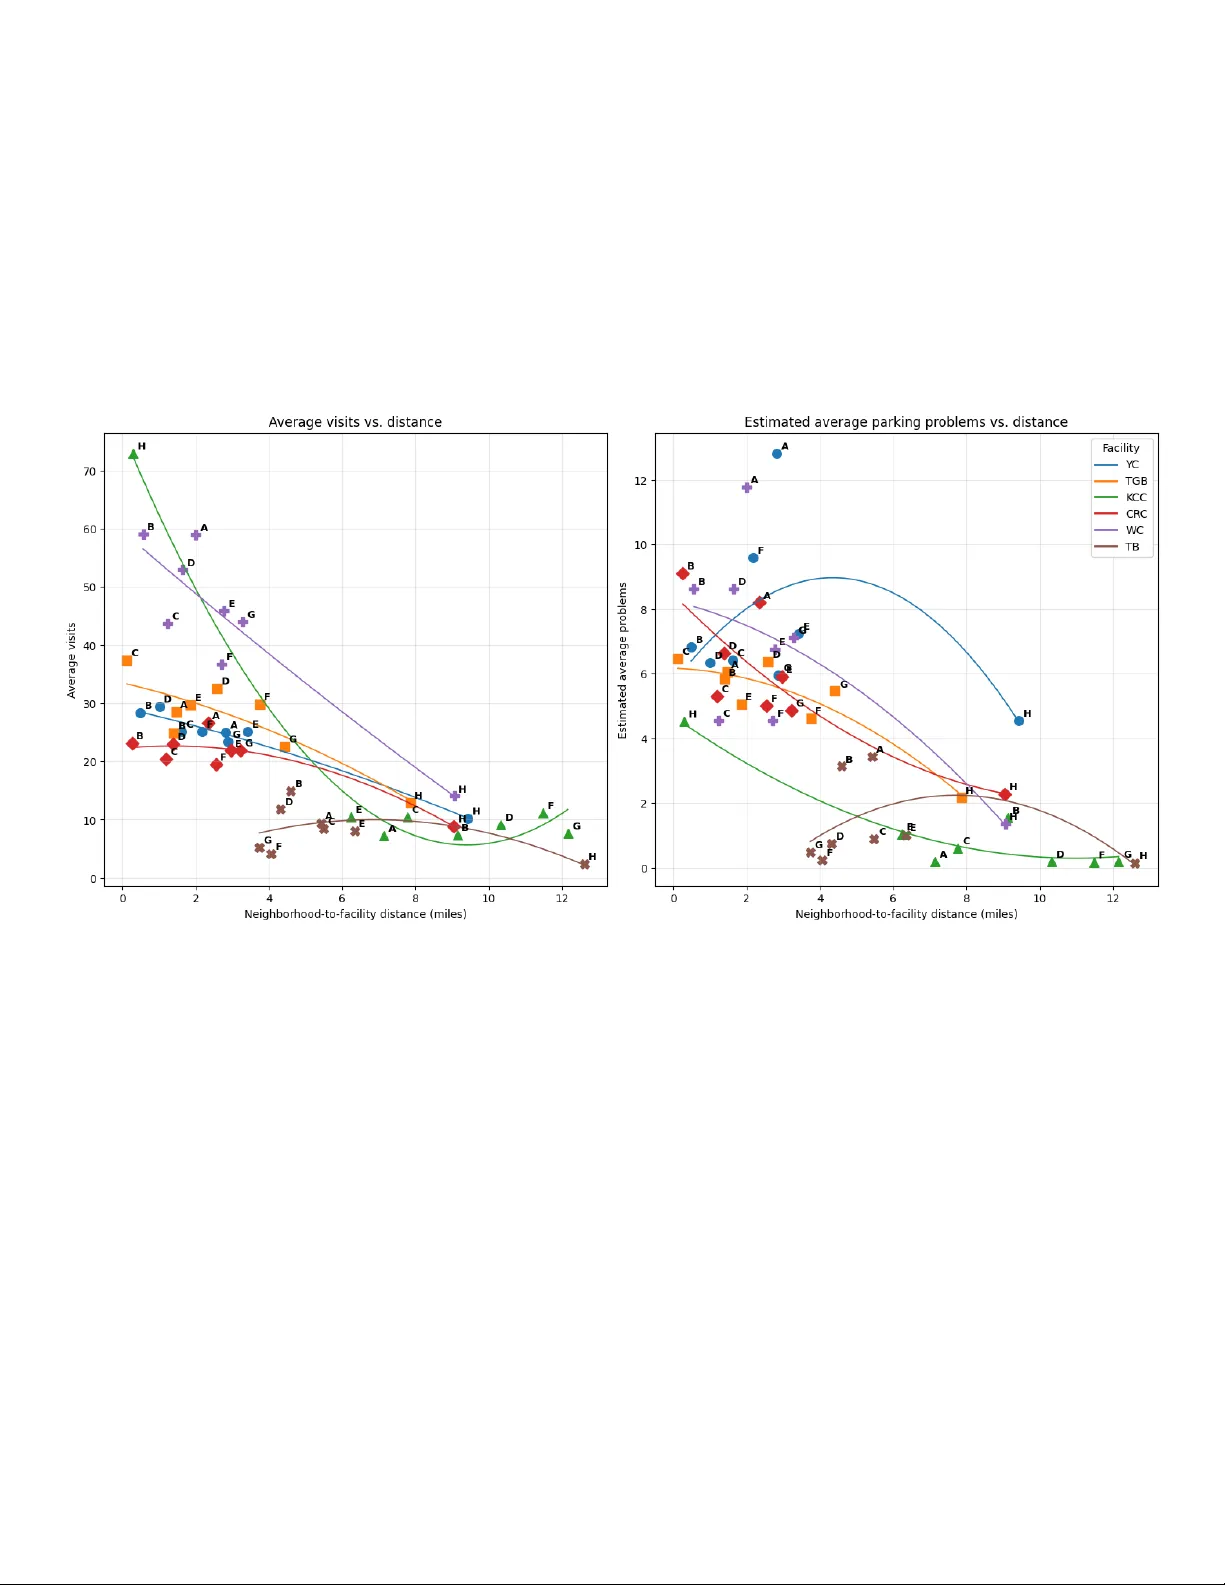
Irene S. Gabash vili Aurametrix, US A https://aurame trix.com Calibrating Res ident Surv eys with Opera tional Data in Commun ity Planning Abstract Community associations rely heavily on resident surveys to guide decisions about amenities, infrastructure, and services. However, s urvey responses reflect perceptions that may not directly correspond to underlying operational conditions. This study bridge s that gap by calib rating survey-based satisfac tion measures against objective utilization data. Using parking and facility data from Tellico Villag e, we map pe rceived problem rates to utilization exceedance probabilities to estimate beh avioral congestion thresholds. Results show that dissatisfac tion emerges near ef fective ca pacity - once spatial, temporal, and informational constraints are considered - r ather than at nominal capacity limits. Perceived difficulty is concentrated among active users and is shaped by operational frictions and incomplete system knowledge. These findings demonstrate that perceived congestion reflects constraints on acces s and reliability, not simply physical shortages. By distin guishing between effective and nominal capacity, the proposed framework enables more accurate diagnosis of sys tem conditions. We propose incorporating behavioral metrics into communit y performance frameworks to support better decision-making, reduce unnece ssary capital expansion, and target operational improvements more effectively. Introduction Community associations and master-planned devel opments rely extensively on resident surveys to guide decisions regarding amenities, infrastructure, and se rvice delivery. These surveys play a central role in governance, informing capital investment, operational changes, and long -term planning. In ac tive lifestyle communities such as Tellico Village, where shared facilities are integral to daily experience, survey -bas ed satisfac tion measures often serve as primar y indicators of perceived se rvice quality and reliability and community wellbeing . However, surveys capture perceptions, not direct mea sures of operational conditions. A persistent challenge is the disconnect between reported experience and actual system performance. Satisfaction is shaped by expectation s and perceived discrepancies rather than objective conditions, leading to systematic bias es in self-reported data [3] . Users also misperceive conditions, overemphasizing visible issues and relying on heuristics such as acce ssibility and order [4 ]. As a result, survey respons es can misrepresent underlying system performance when interpreted i n isolation. Evidence from parking systems illustrates this gap. Behavior is strongly influenced by perceived convenience, including preferences for l ocations that minimize walking distance and uncertainty [ 5], while spa tial imbalances - high demand near entrances alongside underused capac ity elsewhere - dr ive dissatisfac tion even when supply is sufficient [ 6]. Thes e findings suggest that users respond to effective, usable capac ity rather than nominal supply, and that interventions aligning sys tem design with user perception are often more effective than purely inf ormational approaches [3]. At the same time, advances in measurement technologies have made it possible to observe infrastructure utilization continuously and at high re solution. Parking occupancy, facility usage, and scheduling activity can now be tracked over time, enabling direct comparison between perceived and observed system performance [3 ]. Yet these objective data streams are typically analyzed separately from sur vey responses , leaving decision-makers with two incomplete perspectives: what people experience and what systems actually do. Bridging this gap is ess ential for accurate diagnosi s of perf o rmance issues and to avoid misallocation of resources. This paper links survey responses to objective operational data, t reating them as complementary signals of an underlying behavioral process . Survey respons es are interpreted probabilistically, where reported proble ms reflect the likelihood that system conditions exceed a behavioral tolerance threshold. Using Tellico Village as a case study, we combine parking surveys with continuous utilization measurements and facility -us e data [7]. We introduce a calibration framework that maps perceived problem rates to utilization exc eedance probabilities, yielding behavioral tolerance thresholds. This approach builds on prior work that modeled resident satisfac tion as a f unction of service quality and cost using a utility-based formulation [8] , extending it to incorporate observed system performanc e and behavioral response s to service reliability. This paper contribut es a quantit ative calibration framework that maps survey-based perceived problem rates to empirical utilization distributions, enabling direct estimation of behavioral congestion thresholds and eff ective capacity. Methods We develop a unified framework in which survey res ponses are interpr eted as probabilistic measures of perceived congestion (PP R), while ope rational data characterize the distribution o f actual system utilization. Calibration links these components through behavioral tolerance thresholds, enabling a direct mapping between perceived and observed conditions. This integrated approach allows us to estimate effective capacity and to identif y cons traints driven by spatial, tempo ral, and informational factors, rath er than by physical supply alone. Portions of the survey data have been reported in prior work [3,7] (e.g., parking , restaurants, and comprehensive surveys), while ad ditional datasets are introduced here for the fir st time (e .g., meetings). Similarly, some opera tional measurements - such as parking utilization - were previously publ ished [3], whereas others are newly analyzed in this study. Data Sourc es We combine resident survey data with continuous ope rational measurements from shared facilities in T ell ico Village. Facilities are abbreviated as follows: YC (Yacht Cl ub), WC (We llness Center), CRC (Chota Recreation Center), TGB (Toqua Golf Clubhouse /Bar & Gr ill), KCC (Kahite Clubhouse) and TB (Tugaloo Beach) [3]. Neighbo rhoods are designated by letters A – H [7]. Survey responses provide, for each facility f and neighborhood n , the number of visits and the number of v isits during which residents re ported access or parking problems. Operational data consist of time-resolved measurements of f acility utilization: for parking, utiliza tion is derived from continuous vehicle counts ; for meeting space s, it is constructed from time-stamped booking records. Perceived Problem Rate (PPR) For each f acility-neighborhood pair, the Perceived Problem Rate (PPR) is defined as: Problems Visits PPR represents the empirical probability that a resident experience s a problem conditional on visiting a facility. Utilization and Survival Function Let utilization at facility at time be: Observed Occupanc y Capacity To characterize utilization dynamics, we construct the empirical survival function: This represents the fraction of time that utilization exceeds level . The key calibration equation in this study is: were • : utilization at facility at time • : survival function • : behavioral tol e rance threshold • : perceived problem rate Behavioral Tolerance Threshold We interpret survey responses probabilistically by linking perceived pr ob lems to utilization exceedance. The behavioral tolerance threshold is defined implicitly as: Equivalently, This for mulation t reats reported problems as the probability that system conditions exceed a resident-s pecific tolerance level. It provides a direct mapping between subjective perception and observed system performance . Stat istical Testing To evaluate whether pe rceived problems vary systema tically across neighborhoods, we perform chi-squa re tests of independence using counts of problems and non-problems (Visits - Problems). Probl ems a re ind ependent o f neighborh ood Probl ems depend on neighbo rhoo d Meeting Space Utilizat ion To maintain consistency with parking, meeting-space utilization is defined as the proportion of sche dulable time in use: Booke d Time Total Schedulab le Time For f acilit ies with multiple rooms: Booke d Time Availa ble Time This time-based formulation allows direct comparis on with parking occupancy and enables es timation of utilization distributions and corresponding behavioral thres h olds. Distance and Fac ility Choice All Tellico Village addresses , pr eviously compiled as described in [ 9], were geocoded using Geocode by Awesome . Each address was class ified as either a developed residence or an undeveloped lot based on the property database . F or each neighborhood, average geographic coordinates were computed across all r esidential address es to obtain a representative centroid. These neighborhood centroids were then used to calculate average distances to each facility. This approach provides a consistent meas ure of spatial separation between neighborhoods and facilities while smoothing parcel-level variation and enabling comparison with neighborhood -leve l survey response s. To analyze spatial effects, we model visit frequenc y as a function of d istance between neighborhoods and facilities. For each neighborhood – facility pair: • : average visit fre quency • : distance b etween neighbo rhoo d centroid and facili ty We assume an exponential d istance -decay re lations hip: This mo del is esti m ated sep arately for each facility t o al l o w hetero geneou s decay rates. Central Acces s Index To c apt ure o verall integration in to the faci lit y network , we define a Central Ac cess measure: where: • : average visit fre quency across neighborh oods ( faci lity import ance) • : distance se nsitivity Total neighbo rhoo d engag eme nt is then: This distinguishe s fa ci lity-specific proximity effec ts from bro ader network accessibil ity . Utility-Based Sa tisfaction Framework Prior work [8 ] mode led resident satisfaction a s a function of q uality an d cost using a util ity - based formul ati on: where: • represents utili ty derived from se rvice qu ality • represents disutility associa ted with cost • and are weighting par ameters reflec ting relative im portance This framework c aptures tr ade -offs betwee n service improve ments and financi al burden but does not ex pli c itly accou nt for behaviora l respo nses to servi ce re lia b ility or unce rtainty . Prospect Theory Extension To incorpo rate behavioral e ffects, we ex tend the utility framework usi ng refere nce - dependent prefere nces from Prospect Th eory. Let denote the resident’s expect ation (reference point) and t he re ali zed service outco me. The value function is defined as: if if where: • represents loss aversio n (losses wei gh more he avil y than gains ) • represent dimini shing sensi tivity Under this formu lation, negative devi ations from e xpectations (e.g., inabilit y to find parkin g or sec ure a meeting room) h ave a dispropo rtionatel y large impac t on perceive d satisfaction. This provides a behavioral exp lanation for why diss atisfaction eme rges sharply ne ar capacity threshol ds, where the risk of se rvice failure incre ases, even if avera ge availability remains acce ptable. Results Figure 1 shows that both visits a nd parking problem s vary system atically with dist ance, but not uniformly across facilities. Ce ntral destinations (e .g., YC and WC) exhibit s trong attraction effec ts, while m ore loc al facilities fo llow clearer dist ance decay. Resul ts are consistent acros s indepen dent surveys, wi th strong alignmen t in visit fre que ncies (e.g., corre lat ions up to r≈ 1.0), indicating tha t patterns re flect real behavior rather than survey noise. Restaurant survey r esults reinfo rce the se patterns. For the thre e o verla pping ve nues ( YC, TGB, KCC), re ported visit frequ encies align c losely with the parking surv ey, indicating consistent beh avioral sign al s acro ss inde pendent instrume nts. Correl ati on s are high (r ≈0.87 for YC and T GB ; r≈1.00 for K CC ), wi th the latter larg ely reflecting stron g local-capture effec ts in Neighbo rhoo d H. Central and more accessible neighbo rhoo ds are consistently h igher-frequency users in both datasets, whi le the mo st isolated neighbo rhoo d shows limited enga gement ou tside its local facility. This cro ss-survey agreem ent further su pports th at observed diffe rences re flect actual usage pattern s rather than perce pti on bi as. Figure 2 presen ts calibration c urves fo r the fo ur major facilities, linking perc eived problem rates to utiliza tion excee dan ce prob abilities. Acro ss all facili ties, the intersect ion of surv ey - based PPR with th e em pirical survival functio n defines a beh avior al thresho ld that closely aligns with e ffective capacity. Figure 1 Esti mate d ave rage visits an d pa rkin g prob lems vs . dis tan ce . Neig h borhoods a re desi gnate d by letters A – H [ 7], a nd faci lities are c olor-c oded. Figure 2 Su rvey-Cal ibrate d U tilizati on T hres holds Ac ross F acili ties . Solid ste p c urve: E mpir ical su rviv al functio n, . Horiz ontal das hed line : Su r vey-bas ed pe rceived problem ra te (PPR ) . Vert ical dashe d line : Implie d behavi oral thres hold, . Orange poi nt: Cali bration point w her e PPR Table 1 shows tha t perceived co n gestion a ligns with e ffective capa ci ty, not nominal capacity. Diss at isf a ction eme rges at close to no mina l capacity for mo s t facilities, for all flat and small p arking lots, but mu ch e arl ier whe re access is constrained (hilly, less vis ibl e lot extensions) Facility/System Survey PPR Implied threshold (% full) Full-capac ity condition YC Parking 28.54% 82.7% When far-side/ low-visibility space s are excluded ( marina side) WC Parking 14.49% 93.5% When far-side/ low-visibility space s are excluded ( behind clinic) CRC Parking 28.08% 98.9% ≈ Nominal TGB Parking 18.94% 98.8% ≈ Nominal Meeting Rooms 9.3% ≈100% ≈ Nominal Meeting Schedulers 40.9% 25-50% When required r oo m types and time slots are considered Across all faci lities, neighbo rhoo d differences in per ceived problem s are highly significant (al l p ≪ 0.001 ), confirming that parking ex perience is structura lly unev en, not random. Table 1: Surve y-Implied Capacity T hresho lds an d F u ll-Capa c ity C ondit ions Discussion The results show that perceived congestion is drive n by effec tive capacity, not nominal supply. Dissatisfaction emerges when acce ptable opt ions are exhausted - spaces that are visible, proximate, and convenient - not when total capa city is fully utilized. This distinction explains why facilities with spatial or in formational frictions (e.g., less visible parking areas or constrained room types) reach perce ived “full” conditions earli er than more unif o rm systems. A central findi n g is that congestion is best underst ood as a risk -of-failure perception rather than a response to average conditions. Res idents respond not to mean availability, but to the probability of failure - the li kelihood that a visit results in an inability to find parking or secure a desired resource. As utilization approaches the behavioral threshold, the variance and uncertainty of outcomes increase , and small changes in conditions lead to disproportionat ely large increases in perceived difficulty. This response is cons istent with loss-ave rse behavior: unsuccessful experiences weigh more heavily than succes sful ones, leading to sharp declines in satisfaction near c apacity thresholds even when average availability remains adequate. This interpr etation provides a unifying explanation across systems. In parking, failure corresponds to not finding an acceptable spa ce (e.g. , close or visible), while in meeting space s it corr esponds to the unavailability of specif ic room types or time slo ts. In both case s, nominal capacity overstates functional availability, because users operate within a constrained choice set shape d by spatial, temporal, and inf o rmational factors. The analysis also highlights that perceived congest ion is heterogeneous and exposure - dependent. Residents who visit facilities more frequently - or at peak times - experience higher probabilities of failure and therefore report higher problem rates. More importantly, these effects vary systematically acros s neighbor hoods, tenure gr oups, and usage patterns. Differences in perceived problem r ates are statistically signif icant, indicating that congestion is not uniformly experience d across the community. This heterogeneity has important implications for measurement. Pulse surveys are effective for tracking overall sentiment and detecti ng short -term changes, but they primarily captu r e averages, which can obscure meaningful variation across subgroups. A stable village-wide average may mask high dissatis faction among specific neighborhoods, newer residents, or high-frequency users. Comprehensive surveys are therefore necessary to collect the explanatory variables - such as location, tenure, age, and usage patterns - needed to segment respondents, identify statistically significant differences, and determine which groups are drivin g observed outcomes. Without this structure, survey data risk misrepresenting system performance and leading to overly generalized interventions. The combined calibration framework makes it poss ible to li nk thes e heterogeneous perceptions to observed system behavior. By mapp ing perceived problem rates to utilization exceedance probabilities, the analys is recovers behavioral thresholds that differ across facilities and implicitly reflect user ex pectations, constraints, and exposure. These thresholds provide a measurable definition of effective capa city and r eveal where operational frictions - rather than physical shortages - are binding. The practical implication is that many perceived sh ortages are not structural but operational and inf o rmational. Interventions such as demand smoothing, improved visibility of available capacity, better communicati on, and coo rdination across facilities can r educe the probability of failure and imp rove user experience without requiring physical expans ion. In systems operating near behavioral thresholds, even small reductions in uncertainty can have disproportionately large effects on perceived service quality. These findings are consistent with broader evidenc e that master -planned communities undergo nonlinear changes as they approach build out [9], where constraints become more binding and system dynamics shift. In such regime s, the pr obabili ty of failure becomes a more impor tant driver of satisfaction than average utilization, reinforcing the need for measurement frameworks that capture reliabilit y ra ther than mean condit ions alone. Conclusion This study demonstrates that resident surveys, when calibrated with operational data, provide measurable insights into system performan ce by linking pe rception to observed behavior. P erceived problems correspond closely to behavioral congestion thresholds, which reflect effective capacity rather than nominal supply. Across parking and meeting space s, dissatisfaction arises when acceptable options become unreliable - when the probability of failure increases - not when systems are physically full. Framing congestion as a risk-of-failure perception provides a coherent explanation for observed patterns. T his interpretation extends prior utility -bas ed planning f rameworks that model r esident satis faction as a trade-off between service quality and cost [8]. While those models capture average conditions, they do not explicitly account for variability and reliability. By incor po rating behavioral respon ses to uncertainty, the present framework aligns more closely with Prospect Theory, in which outcomes are evaluated relative to expectations and losses are weighted more heavily than gains. In this context, service failures - such as the inability to find parking or secure a desired time slot - have a disproportionate impact on perceived satisfaction. This provides a theoretical foundation for why dissatisfaction increase s sharply near behavioral capacity thr esholds , even when average availability remains acceptable. Residents respond to uncertainty and variability in outcomes, not to average availability. As utilization approaches the behavioral threshold, the li kelihood of unsucces sful experiences increases, and loss-avers e responses a mplify their impact on satisfaction. This explains why perceived congestion can emerge well before nominal capacity is reached and why small operational improvements ca n yield large gains in perceived service quality. The integration of survey and operational data is e ssential for capturing this dynamic. Pulse surveys provide timely indicators of overall se ntiment, but comprehens ive surveys are required to identify statistically significant diffe rences across neighborho ods, demographic groups, and usage patterns [7]. These diff erences reveal how exposure, expectations, and acces s constraints shape perceived outcomes [3] and enable segmentation of residents into groups with distinct needs. This segmentation supports more precise, targeted interventions and avoids on e -size-fits-all solutions. The key im pl ication is that effective capacity is joi ntl y determined by infrastructure, operations, and user behavior [8]. Improving sys tem performance therefore does not neces sarily require expansion. In many cases , r edu cing the probabilit y of failure - thr ough demand management, improved information, and better coordination - can be mor e effective and cost-efficient than increasing physical supply [3,5,6,10]. More broadly, the framework developed here provides a unified approach to measuring and managing shared resources in community setti ngs. By combining survey data, continuous operational measurement, and behavior al theory, it improves the interpretability of res ident feedback and supports more accurate, actionable decision- making in communit y planning. REFERENC ES 1. Ramas amy G, Ramasa my GD and Ramas amy P. Conceptual review of consumer satisfac tion theories with expectation-confirmation and disconfir mation paradigm for busines s sustainable growth and decision making [version 1; peer review : 1 approved with r eservations, 1 not approved] . F1000Resear ch 2024, 13 :1399 ( https://doi.or g /10.12688/f1000research.158612.1 ) 2. Rosenfield, A., Attanucci, J.P. & Zhao, J. A rando mized controlled trial in travel demand management. Transportation 47, 1907 – 19 32 (2020). https://doi.org/10.1007/s11116-019-10023-9 3. Allsup CK. Str etching Rubber, Not Budgets: Accurate Parking Utilization on a Shoestring. arXiv preprint arXiv:2502.09877. v3 2026 Jan 2 [eess.SY] https://doi.org/10.48550/arXiv.2502.09877 4. K lein, N., Brown , A. & Thigpen, C., (2023) “Clutter and Compliance: Scooter Parking I nte rventions and Perceptions”, Active Tr avel Studies 3(1). doi: https://doi.org/10.16997/ats.1196 5. Lee, J. B., Agdas, D., & Baker, D. (2017). Cruising for parking: New empirical evidence and influential factors on cruising time. Journal of Transport and Land Use, 10(1), 931 – 943. https://doi.org/10 .5198/jtlu.2017.1142 6. Akai K, Aoki K, Ueda Y, Kanetsuku K. Redesigning parking facilities using a parking service satisfaction survey at Izumo local airport in Japan. Transportation Rese arch Interdisciplinary Perspectives . 2021 Sep 1;11: 100433. 7. Gabashvili IS, Al lsup CK. Resident Turnover and Community Satisfaction in Active Lifestyle Communities. arXiv preprint arXi v:2502.15789. 2025 F eb 18. [stat.AP] https://doi.org/10.48550/arXiv .2502.15789 8. Allsup CK, Gabashvili IS. Democratizing Strategic Planning in Mas ter -Planned https://doi.org/10.48550/arXiv.2410.04676 9. Allsup CK, Gabashvili IS. Modeling the Dynamics of Growth in Ma ster -Planned Communities. 2024 arXiv preprint arXiv:2408.14214 [econ.EM] 2024 Aug 26. https://doi.org/10.48550/arXiv.2408.14214 10. Vakrinou K., Mantouka E.G., Kanatas M., Vlahogi anni E., Understanding searching for parking behavior in urban road networks, Case Studies on Transport Policy,Volume 23,2026,101739, ISSN 2213 -624X , https://doi.org/10.1016/j.cstp.2026.101739
Original Paper
Loading high-quality paper...
Comments & Academic Discussion
Loading comments...
Leave a Comment