Robust Twoblock Simultaneous Dimension Reduction
This paper introduces robust twoblock (RTB) simultaneous dimension reduction, which is the first statistically robust method to perform simultaneous dimension reduction in two blocks of variables and allows to fine-tune the model complexity in each b…
Authors: Sven Serneels
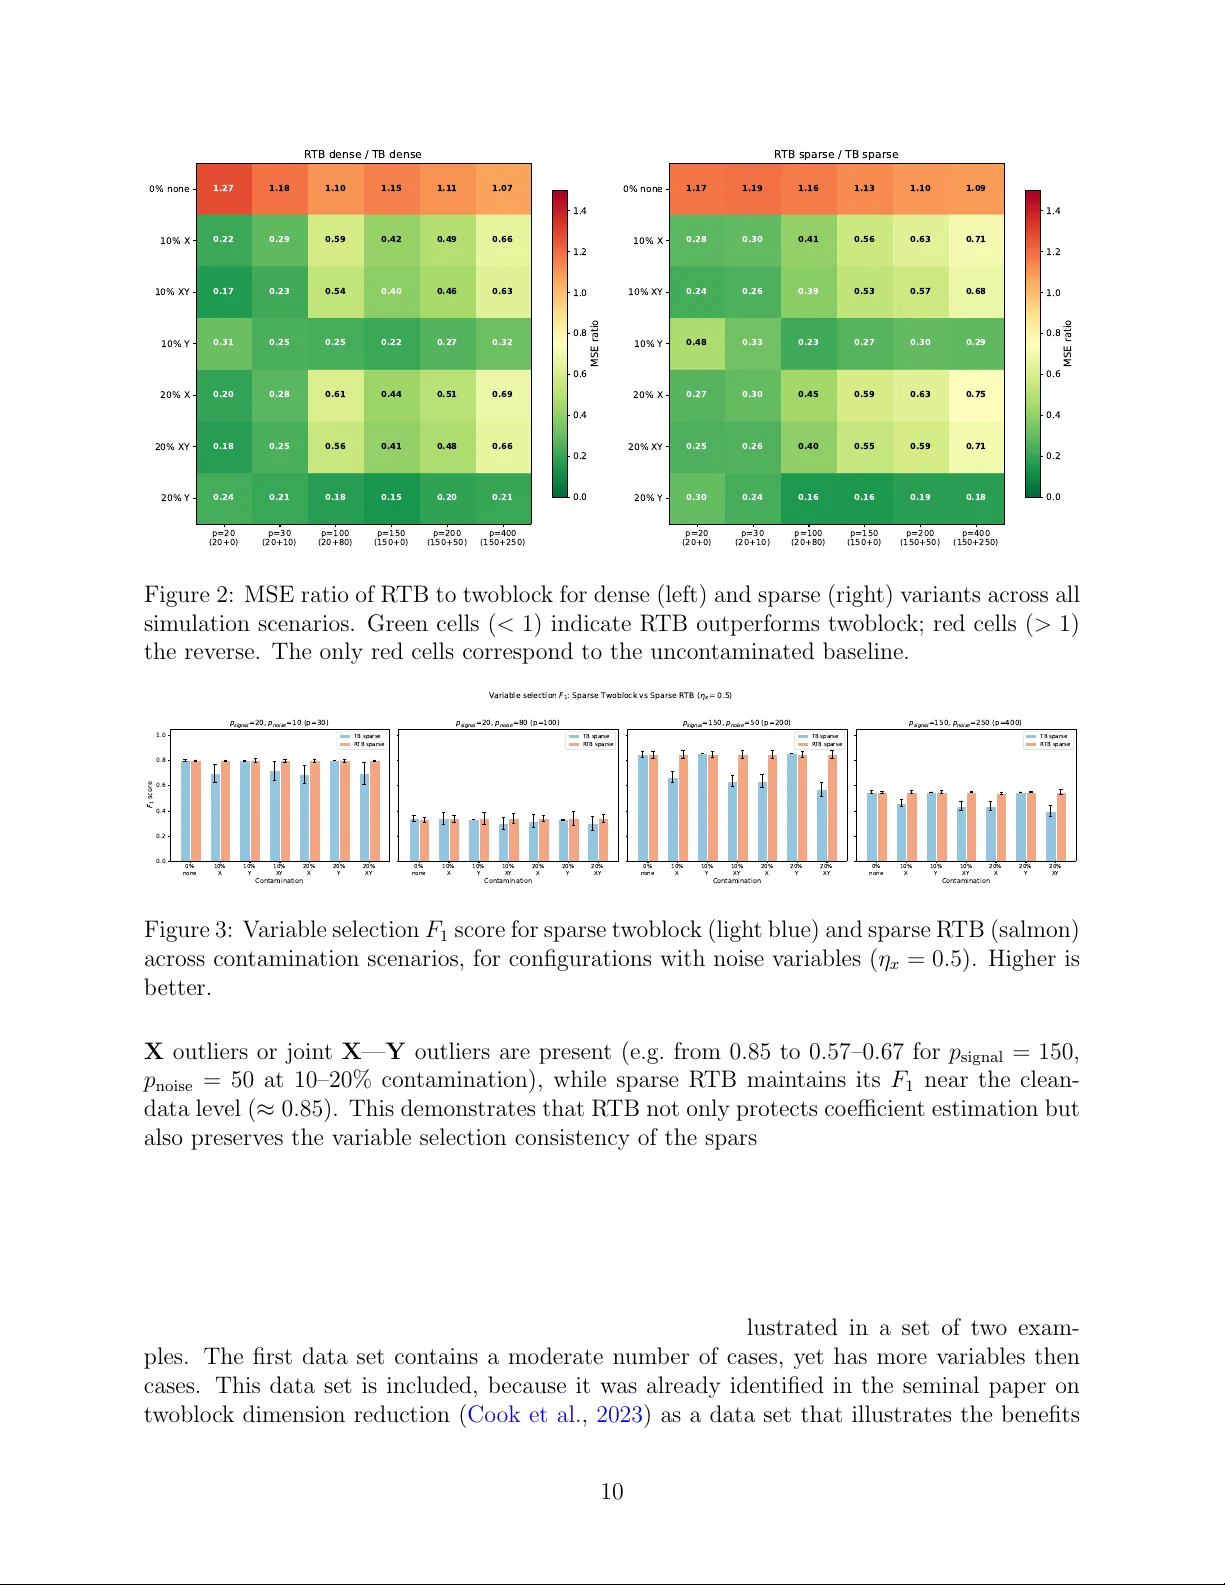
Robust Tw oblo c k Sim ultaneous Dimension Reduction Sv en Serneels 1 , 2 1 SiC Systems, F ranklin, T ennessee, USA 2 Departmen t of Mathematics, Universit y of Ant werp, Belgium Abstract This pap er in tro duces robust t woblock (R TB) simultaneous dimension reduction, whic h is the first statistically robust metho d to p erform simultaneous dimension re- duction in tw o blo c ks of v ariables and allows to fine-tune the mo del complexit y in each blo c k individually . The paper prop oses b oth a dense and a sparse v ersion of the new metho d. Sparse R TB is the first robust estimator that allo ws to select both mo del complexit y and the degree of sparsit y for eac h blo c k individually . R TB thereb y al- lo ws to optimally extract and summarize the relev an t p ortion of information in each blo c k of data, also in the presence of outliers. As a corollary , the estimators can b e recom bined into a single estimate of regression co efficien ts for m ultiv ariate regression that is op erable when the num b er of v ariables exceeds the num b er of cases in each blo c k. An extensiv e simulation study illustrates that the new metho ds are resistan t to different types of outliers, while maintaining estimation efficiency . across a range of dimensionalit y settings. These findings b oth hold true for the dense and the sparse metho d. The metho ds’ p erformance is further illustrated on tw o example data sets and a straightforw ard algorithm is presented and made accessible in an op en source rep ository . Keyw ords: v ariable selection, m ultiv ariate robust regression, robust tw oblo c k dimension reduction 1 In tro duction As data dimensionalit y con tinues to gro w, the abilit y to compress information in to a compact lo w-dimensional representation b ecomes ev er more critical. When data are structured as t wo co-observ ed blo c ks of v ariables, this compression should resp ect the in ter-blo c k relationship: the reduced spaces ough t to capture all information relev an t to mo del each blo c k from the other. Sim ultaneous t w o-blo c k sufficien t dimension reduction (SDR) provides exactly this, yielding a principled and parsimonious summary of the join t structure of b oth blocks. F ormally , let X ∈ R n × p and Y ∈ R n × q denote matrices of n observ ations of p -v ariate inde- p enden t and q -v ariate dep enden t random v ariables, resp ectiv ely . SDR seeks laten t v ariables T = XW satisfying Y ⊥ ⊥ X | T , (1) 1 where the fulfilling subspace is called the c entr al subsp ac e and ⊥ ⊥ denotes statistical indep en- dence. Among estimators of the central subspace, partial least squares (PLS) remains one of the oldest and most computationally efficient, with its theoretical grounding well estab- lished. More specifically , Co ok et al. ( 2013 ) deriv ed that PLS1 (univ ariate response) pro vides a consisten t estimator of the central subspace S Y | X when Y is univ ariate. It accomplishes this b ecause the PLS1 w eigh t v ectors span a Krylov subspace of Σ − 1 XX Σ XY , which under mild conditions conv erges to S Y | X . Equation ( 1 ) addresses dimension reduction in X alone. A ric her ob jectiv e is to simulta- neously reduce b oth blo c ks, seeking linear combinations U = YV and T = XW such that Y ⊥ ⊥ X | T , (2a) X ⊥ ⊥ Y | U . (2b) Since indep endence is difficult to establish directly , these conditions are relaxed to zero co- v ariance. Letting P = X T T ( T T T ) − 1 and Q = Y T U ( U T U ) − 1 denote the X - and Y -loadings, with residual complemen ts E = I n − T ( T T T ) − 1 T T X and F = I n − U ( U T U ) − 1 U T Y , sim ultaneous dimension reduction of b oth blocks requires co v ( E , F ) = 0 , (3a) co v ( UQ T , F ) = 0 , (3b) co v ( TP T , E ) = 0 . (3c) P artial least squares (PLS) regression is also a widely used metho d for sim ultaneous dimension reduction in a multiv ariate regression con text. It is often silently assumed that m ultiv ariate PLS (also denoted PLS2) yields an estimate for b oth central subspaces in ( 3 ). Ho wb eit, while Co ok et al. ( 2013 ) pro ved that the PLS1 score space is an estimator for the cen tral subspace S Y | X , Co ok et al. ( 2023 ) show ed that this result do es not extend to PLS2 (m ultiv ariate resp onse). PLS2 only reduces the X blo ck, while treating Y as fixed, and consequen tly do es not estimate the joint tw o-blo ck cen tral subspace ( 2 ). This motiv ated their dev elopment of two-blo ck simultane ous dimension r e duction (hereafter: t woblock, also referred to as “XY-PLS”), whic h sim ultaneously extracts laten t comp onents from both the predictor blo ck X and the resp onse blo c k Y , providing an estimator for the t wo-block SDR problem. The metho d pro ceeds in tw o sequen tial deflation stages: first extracting h x comp o- nen ts from X that are maximally cov ariant with Y and then extracting h y comp onen ts from Y that are maximally cov ariant with X . This provides true sim ultaneous SDR estimates for b oth blo cks, along with direct regression co efficien t estimates. It was sho wn to outp erform b oth PLS2 and v arious v arian ts of univ ariate regression. The author ( Serneels , 2025 ) has recen tly in tro duced sparse t woblock dimension reduction, whic h is a sparse extension of the original method, b y applying soft-thresholding to the w eight v ectors during eac h deflation step. This pro duces v ariable selection in b oth the X and Y blo c ks, yielding interpretable mo dels with comp etitive predictive p erformance. Beyond b eing a versatile alternative to b oth sparse PLS2 and sparse canonical correlation analysis (CCA), it is also the first metho d to allo w fine-tuning of b oth the mo del complexity and the sparsit y in eac h block of v ariables individually . 2 Both the dense and sparse t w oblo ck metho ds rely on classical lo cation and shap e esti- mates, making them sensitiv e to outlying observ ations. In c hemometrics, along other applied domains, data frequently contain at ypical cases, suc h as leverage points in the predictor space, vertical outliers in the resp onse, or b oth. The presence of suc h atypical cases that can sev erely distort the estimated subspaces and regression co efficien ts. With that in mind, this pap er introduces r obust twoblo ck (R TB) dimension reduction. The R TB algorithm prop osed herein applies iterative reweigh ting, inherited from M-estimation. F or a detailed ov erview of robust estimates in a regression context, we refer to e.g. Maronna et al. ( 2019 ). This approac h to robustifying dimension reduction and regression algorithms was previously suc- cessfully implemented by the author in the con text of partial least squares, leading to the no w widely adopted metho ds of Partial Robust M-regression (PRM, Serneels et al. ( 2005 )) and its sparse extension SPRM ( Hoffmann et al. , 2015 ). The algorithm introduced herein builds upon those t w o robust estimators, but in tro duces m ultiv ariate rew eighting scheme adapted to the t woblock setting. Caseweigh ts are computed indep endently for the X and Y blo cks based on Mahalanobis-type distances in the resp ective score spaces, then used to do wn w eight or omit at ypical cases when estimating the tw oblo ck decomp osition. The resulting metho d is the first robust version of tw oblo ck simultaneous dimension reduction altogether, a statement that applies b oth to the dense and sparse v arian ts. The remainder of this pap er is organized as follows. Section 2 introduces the new R TB metho d, along with an algorithm that can b e implemented straightforw ardly . Section 3 presen ts a sim ulation study ev aluating R TB under v arious con tamination and dimensionalit y scenarios. Section 4 illustrates the metho d on t wo real data sets that are known to b enefit from multiv ariate estimation and contain outliers. Finally , Section 5 concludes and provides a persp ective into pathw a ys for further future researc h. 2 Metho d Prior to in tro ducing the new robust estimators, a brief o verview will be provided of the existing non-robust alternatives. 2.1 Dense and sparse t w oblo c k dimension reduction Let the predictor matrix X and predictand matrix Y b oth b e cen tred and scaled. The t woblock metho d ( Co ok et al. , 2023 ) then extracts comp onen ts sequen tially . In essence, it applies a NIP ALS ( W old , 1966 ) inspired algorithm to calculate laten t v ariables to the original predictand and predictor data to extract the laten t space for X and then applies the algorithm again to data in which the roles of predictor and predictand hav e b een switc hed. Ev entually , b oth sets of estimates are recom bined into a single set of regression co efficients. The algorithm is summarized in Algorithm 1 , where W = [ w 1 , . . . , w h x ] and V = [ v 1 , . . . , v h y ] collect the w eight vectors for the X and Y blo cks, resp ectively . In the sparse v arian t ( Serneels , 2025 ), eac h weigh t vector is soft-thresholded (steps 7 and 14 in Algorithm 1 ) and η x , η y ∈ [0 , 1) control the degree of sparsity in the resp ective blo c ks. When η x = η y = 0, the dense tw oblo ck algorithm is reco vered. In the algorithm and elsewhere, ⊙ denotes the Hadamard (elemen t-wise) matrix pro duct. 3 Algorithm 1 Tw oblo c k dimension reduction Require: X ∈ R n × p , Y ∈ R n × q , components h x , h y 1: Centre and scale X → X 0 , Y → Y 0 2: ˜ X (1) ← X 0 ; ˜ Y (1) ← Y 0 — X -blo ck deflation — 3: for i = 1 , . . . , h x do 4: S ( i ) X Y ← ˜ X ( i ) ⊤ Y 0 / n 5: w i ← leading left singular vector of S ( i ) X Y 6: if sparse then w i ← sign( w i ) ⊙ max | w i | − η x max | w i | , 0 7: end if 8: t i ← ˜ X ( i ) w i ; p i ← ˜ X ( i ) ⊤ t i / ( t ⊤ i t i ) 9: ˜ X ( i +1) ← ˜ X ( i ) − t i p ⊤ i 10: end for — Y -blo ck deflation — 11: for j = 1 , . . . , h y do 12: S ( j ) Y X ← ˜ Y ( j ) ⊤ X 0 / n 13: v j ← leading left singular vector of S ( j ) Y X 14: if sparse then v j ← sign( v j ) ⊙ max | v j | − η y max | v j | , 0 15: end if 16: u j ← ˜ Y ( j ) v j ; q j ← ˜ Y ( j ) ⊤ u j / ( u ⊤ j u j ) 17: ˜ Y ( j +1) ← ˜ Y ( j ) − u j q ⊤ j 18: end for — R e gr ession c o efficients — 19: ˆ B scaled ← W ( W ⊤ X 0 W ) − 1 ( W ⊤ X 0 ) ⊤ ( X ⊤ 0 Y 0 V ) V ⊤ 20: Rescale ˆ B scaled to the original data scale → ˆ B 21: return ˆ B , W , V , T , U , P , Q 2.2 Robust Tw oblo c k (R TB) T o robustify the tw oblo c k algorithm, the approach of iterativ e reweigh ting is selected. The new metho d hereby builds up on prior successful application of iterative reweigh ting in the con text of univ ariate partial least squares, which has lead to the dense ( Serneels et al. , 2005 ) and sparse ( Hoffmann et al. , 2015 ) partial robust M regression estimators. While other paths to robustification could b e pursued, the iterativ e rew eighting is elegan t for v arious reasons: it is computationally tractable, has b een shown to yield robustness against v arious types of de- viations from normalit y a nd it can yield estimators that w ork in case there are more v ariables than cases. In v arious fields of application, such as chemometrics and bioinformatics, data with either p > n , q > n , or b oth, can b e encountered. The prerequisite that the metho d can b e computed for suc h data precludes other plausible approac hes, such as plugging sub- set selection based estimates, suc h as MCD ( Rousseeuw , 1985 ) or L TS ( Rousseeuw , 1984 ). Lik ewise, generalized spatial sign pre-pro cessing ( Serneels et al. , 2024 ), which originally was a step in the calculation of the generalized spatial sign co v ariance matrix ( Ra ymaek ers and Rousseeu w , 2019 ), cannot b e applied to data that ha ve more v ariables than cases. Accoun ting for the prerequisite of yielding an estimator that is op erable when p > n or 4 q > n , R TB wraps the tw oblo ck estimation into an iterativ e rew eigh ting sc heme. The key idea is to assign case weigh ts based on outlyingness in the resp ectiv e score spaces, and to re-estimate the mo del on the weigh ted data until conv ergence. Initialization. In the con text of iterativ e reweigh ting and M-estimation, it is well known that the even tual robustness of the estimates strongly dep ends on the selection of the start- ing v alues: reweigh ted metho ds can still break do wn in case the starting v alues themselves break do wn in the presence of outliers. This b egins with the cen tring and scaling of the data. Ideally , data are centred ab out a highly robust estimate of lo cation that also lies within the con vex hull of the data. Likewise, a highly robust scale estimator should b e chosen. Go o d selections for these tw o prepro cessing steps are the ℓ 1 median lo cation estimator (for com- putational aspects thereof, see e.g. F ritz et al. ( 2012 )) and the τ 2 scale estimator ( Maronna and Zamar , 2002 ), but other options are p ossible. If computational efficiency is paramount, then the column-wise median and median absolute deviation could be opted for. Another imp ortant choice to make for iterative rew eigh ting is the w eight function. Con- tin uous rew eighting functions, such as the F air function, can b e adopted. Ho wev er, the F air function will do wnw eight all cases outside the exact lo cation of the distribution, which yields w eights that can b e difficult to in terpret and ma y ha v e unsatisfactory predictiv e performance due to excessive do wnw eighting of non-outlying cases. Discon tinuous down w eighting func- tions, that use a certain cutoff b ey ond whic h cases are considered outliers and do wn weigh ting starts, are often seen as options that are easy to implemen t, that yield highly in terpretable casew eights, and also lead to go o d statistical robustness. P opular discon tinuous do wnw eight- ing functions are the Hub er and Hamp el functions. The latter is applied throughout the sim ulation and example section of this pap er. The Hamp el function is defined as: ψ H ( d i ) = 1 if d i ≤ c 1 , c 1 d i if c 1 < d i ≤ c 2 , c 1 ( c 3 − d i ) d i ( c 3 − c 2 ) if c 2 < d i ≤ c 3 , 0 if d i > c 3 , (4) where the case d i ∈ R + can b e an y p ositiv e scalar, but in what follows, is t ypically computed from the data as some distance metric. The Hamp el function dep ends on three cutoff v alues, whic h increase the harshness of do wnw eighting dep ending on how eccen tric the corresp ond- ing case is. These cutoff v alues are tunable parameters of the algorithm and they can b e set according to corresponding quan tiles, for instance quantiles of the χ 2 distribution for squared distances. This approach has b een successfully adopted b efore in related contexts, for instance in SPRM regression or in cellwise robust M regression ( Filzmoser et al. , 2020 ). The starting weigh t computation is formalized in Algorithm 2 . It is applied indep endently to both the X and Y blo cks. The R TB initialization then pro ceeds as: 1. Robustly centre and scale X → X s and Y → Y s . 2. w ( X ) ← St ar ting Weights ( X s , ψ ); w ( Y ) ← St ar ting Weights ( Y s , ψ ). 5 Algorithm 2 Starting W eigh ts Require: Scaled data blo c k Z s ∈ R n × d , w eigh ting function ψ 1: d ← ∥ z r,i ∥ 2 / median i ∥ z r,i ∥ 2 n i =1 ▷ Standardized casewise distances 2: w ← ψ ( d ) ▷ Apply weigh ting function 3: w i ← max( w i , 10 − 6 ) for all i ▷ Floor small w eights 4: return w Algorithm 3 Robust Tw oblo ck (R TB) Require: X ∈ R n × p , Y ∈ R n × q , components h x , h y , w eigh ting function ψ 1: Robustly centre and scale X → X s , Y → Y s 2: w ( X ) ← St ar ting Weights ( X s , ψ ) 3: w ( Y ) ← St ar ting Weights ( Y s , ψ ) 4: X w ← diag( √ w ( X ) ) X s ; Y w ← diag( √ w ( Y ) ) Y s 5: rep eat 6: Fit t w oblo c k( X w , Y w ) → scores T , U , co efficients b 7: T uw ← T ⊘ √ w ( X ) ; U uw ← U ⊘ √ w ( Y ) 8: w ( X ) ← ψ d ( T uw ) ; w ( Y ) ← ψ d ( U uw ) 9: X w ← diag( √ w ( X ) ) X s ; Y w ← diag( √ w ( Y ) ) Y s 10: until ∥ b ∥ 2 con verges 11: Rescale co efficients to original scale 12: return ˆ B , w ( X ) , w ( Y ) 3. F orm w eighted data: X w = diag( √ w ( X ) ) X s and Y w = diag( √ w ( Y ) ) Y s . Iterativ e rew eighting. Repeat un til conv ergence (or a maximum n umber of iterations): 1. Fit a tw oblo ck mo del (dense or sparse) to X w and Y w with cen tring set to ‘mean’ and scaling set to ‘None’ (since the data are already robustly prepro cessed). 2. Extract the X -block scores T and Y -blo c k scores U from the fi tted model, un w eighting them b y dividing by √ w . 3. Up date X -block weigh ts: compute robust Mahalanobis distances of the un weigh ted scores, apply the w eighting function ψ to obtain updated w ( X ) . 4. Up date Y -blo c k w eigh ts analogously from the Y scores to obtain up dated w ( Y ) . 5. Re-form X w and Y w with the up dated w eights. 6. Check conv ergence: |∥ b ( t ) ∥ 2 − ∥ b ( t − 1) ∥ 2 | / ∥ b ( t − 1) ∥ 2 < τ . Final estimates. After conv ergence, the regression co efficien ts are rescaled to the original data scale. The com bined case weigh t for observ ation i is w i = w ( X ) i · w ( Y ) i . The robust tw oblo c k algorithm is summarized in Algorithm 3 . 6 2.3 Prop erties As the sim ulation study in the ensuing section will sho w, R TB inherits the dimension reduc- tion and v ariable selection prop erties of tw oblo ck (dense or sparse), while gaining robustness to outliers. The indep enden t w eighting of the X and Y blo cks allows the metho d to handle lev erage p oints (outliers in X are down w eigh ted via w ( X ) ), v ertical outliers (outliers in Y are down w eighted via w ( Y ) ) and joint con tamination, since b oth w eights con tribute to the com bined w eigh t w = w ( X ) ⊙ w ( Y ) . On clean data, the Hamp el weigh ting function with standard cutoffs given as distribu- tional quan tiles ( p 1 = 0 . 95, p 2 = 0 . 975, p 3 = 0 . 999) assigns weigh t 1 to the v ast ma jority of observ ations, so R TB conv erges to a solution close to classical tw oblo ck. More aggressiv e cutoffs (e.g. p 1 = 0 . 75, p 2 = 0 . 90, p 3 = 0 . 95) can b e used when heavier contamination is exp ected. The latter option will b e used in the results presented hereinafter. 3 Sim ulation study In this sim ulation study , the robustness and sparsit y prop erties of the metho d will b e as- sessed. The simulations are set up suc h that they generate data according to a laten t v ariables mo del with kno wn mo del complexity and are thus apt to b e mo deled by eac h of the tw oblo ck metho ds without the need for tuning the corresp onding parameters. Outliers are added in six different scenarios, i.e. at tw o differen t prop ortions, and either as v ertical outliers only , as lev erage p oints only , or as b oth t yp es of outliers combined. T o assess the v ariable selection prop erties of the sparse metho d, noise v ariables will b e added to the X blo c k in t w o prop ortions, with one scenario adding far fewer noise v ariables than informative v ariables, whereas the other scenario adds mor e uninformativ e v ariables than informativ e ones. Finally , dimensions of the X blo ck data will also b e ev aluated b oth in a scenario where n < p and where p > n . Results for eac h setting are reported as a verages ov er t wo hundred runs. In total, the simulation study thereby ev aluates 42 scenarios, whic h require a grand total of 33200 individual runs. 3.1 Design Data are generated from a true laten t v ariable mo del: X = TP ⊤ + E , T ∈ R n × k , P ∈ R p signal × k , E ij ∼ N (0 , σ 2 e ) , (5) Y = TC + F , C ∈ R k × q , F ij ∼ N (0 , σ 2 f ) , (6) where P has orthonormal columns, T ij ∼ N (0 , 1), and C ij ∼ N (0 , 1). The true regression co efficien t is B true = [ PC ; 0 ], padded with zeros for uninformativ e v ariables. Uninformative v ariables are app ended as columns of N (0 , σ 2 e ) noise. W e set n = 100, k = 3, q = 4, σ e = σ f = 0 . 5, and v ary: • Dimensionality : p signal = 20 (with p noise ∈ { 0 , 10 , 80 } ) and p signal = 150 (with p noise ∈ { 0 , 50 , 250 } ), co v ering b oth p < n and p > n regimes. 7 • Contamination : 0%, 10%, or 20% of cases, with outliers in X only , Y only , or b oth, in tro duced as additive shifts of magnitude 10. F our metho ds are compared, eac h using the true k as the num b er of X comp onen ts and min( k , q ) as the num b er of Y comp onents: dense and sparse classical tw oblo ck (with stan- dard scaling), along with dense and sparse robust tw oblo ck (R TB) with Hamp el w eighting, median/MAD prepro cessing standard cutoffs and the set of { p 1 = 0 . 75 , p 2 = 0 . 90 , p 3 = 0 . 95 } for the Hamp el function cutoffs. At this p oint, w e note that a more stringent setting for the do wn w eighting cutoffs, suc h as { p 1 = 0 . 95 , p 2 = 0 . 99 , p 3 = 0 . 999 } w ould yield a less robust, yet highly efficient estimator. Ho wev er, simulation results for the estimator shown are already quite con vincing in terms of efficiency , so results for the more stringen t set of parameters will not b e presen ted. T o ev aluate the accuracy of the regression coefficients, the F rob enius norm of the deviation of estimated v ersus actual regression co efficients MSE( B ) = 1 pq ∥ ˆ B − B true ∥ 2 F , a v eraged ov er 200 indep endent rep eats, is rep orted. T o assess v ariable selection p erformance of the sparse metho ds, the F 1 score for v ariable selection is rep orted. 3.2 Results Co efficien t estimation accuracy . Figure 1 shows the MSE of the co efficien t estimates for all 42 scenarios, arranged in a 2 × 3 grid. All four metho ds—dense and sparse t w oblo c k, dense and sparse R TB—are shown side b y side. The top ro w corresp onds to p signal = 20 ( p ≤ n ) and the b ottom row to p signal = 150 ( p > n ), with the num b er of uninformative noise v ariables increasing from left to righ t. Sev eral patterns emerge consistently across all dimensionality settings: 1. Clean data. On uncontaminated data (0%, none), all four metho ds perform similarly , with R TB incurring only a mo dest efficiency loss (dense ratio ≈ 1 . 1–1 . 3; sparse ratio ≈ 1 . 1–1 . 2) relativ e to the corresp onding classical tw oblo ck v arian t. 2. X outliers. Lev erage p oin ts in X cause substantial MSE inflation for b oth dense and sparse t woblock (e.g. dense MSE jumps from 0.021 to 0.124 at 10% con tamination with p = 20; sparse from 0.030 to 0.135). Both R TB v arian ts are largely unaffected, with MSE remaining close to the clean-data baseline. 3. Y outliers. V ertical outliers in Y are the most challenging scenario for all metho ds. R TB reduces MSE substan tially relativ e to classical t w oblo c k (e.g. dense ratio 0.31 at 10% for p = 20; sparse ratio 0.48). With ma jorit y noise v ariables ( p noise = 80), the sparse R TB ac hieves particularly strong protection (MSE 0.014 vs 0.062 for sparse t woblock at 10%). 4. Joint XY outliers. When b oth blo cks are contaminated, the MSE ratios are similar to the X -only case, since the X -blo ck weigh ts dominate the reweigh ting. Both dense and sparse R TB main tain their adv antage. 5. High-dimensional setting. The R TB adv an tage p ersists in the p > n regime, with similar relativ e gains. F or p = 400 ( p signal = 150, p noise = 250), R TB dense achiev es ra- tios of 0.64–0.66 under X con tamination, and the sparse v ariant p erforms comparably . 8 0% none 10% X 10% Y 10% XY 20% X 20% Y 20% XY 0.00 0.05 0.10 0.15 0.20 0.25 0.30 M S E ( B ) p s i g n a l = 2 0 , p n o i s e = 0 ( p = 2 0 , p < n ) TB dense R TB dense TB sparse R TB sparse 0% none 10% X 10% Y 10% XY 20% X 20% Y 20% XY p s i g n a l = 2 0 , p n o i s e = 1 0 ( p = 3 0 , p < n ) 0% none 10% X 10% Y 10% XY 20% X 20% Y 20% XY p s i g n a l = 2 0 , p n o i s e = 8 0 ( p = 1 0 0 , p < n ) 0% none 10% X 10% Y 10% XY 20% X 20% Y 20% XY 0.00 0.02 0.04 0.06 0.08 0.10 M S E ( B ) p s i g n a l = 1 5 0 , p n o i s e = 0 ( p = 1 5 0 , p > n ) 0% none 10% X 10% Y 10% XY 20% X 20% Y 20% XY p s i g n a l = 1 5 0 , p n o i s e = 5 0 ( p = 2 0 0 , p > n ) 0% none 10% X 10% Y 10% XY 20% X 20% Y 20% XY p s i g n a l = 1 5 0 , p n o i s e = 2 5 0 ( p = 4 0 0 , p > n ) MSE of r egr ession coefficient estimates Figure 1: MSE of regression co efficient estimates across 42 sim ulation scenarios (200 rep eats eac h). Dark blue: TB dense; dark red: R TB dense; light blue: TB sparse; salmon: R TB sparse. T op ro w: p ≤ n ; b ottom ro w: p > n . Within eac h panel, the x-axis shows the con tamination prop ortion and type. Error bars indicate one standard deviation. 6. Noise v ariables. Adding uninformative v ariables do es not qualitativ ely change the relativ e p erformance of the methods, though absolute MSE v alues decrease (due to the normalization b y pq ). Sparse metho ds tend to ac hieve low er MSE than their dense coun terparts when man y noise v ariables are present (e.g. p noise = 80: sparse TB 0.010 vs dense TB 0.015 on clean data), reflecting the benefit of v ariable selection. Figure 2 summarizes the relativ e efficiency of dense and sparse R TB v ersus the corre- sp onding tw oblo c k v ariant across all scenarios as heatmaps of MSE ratios. V alues b elo w 1 (green) indicate that R TB outp erforms tw oblo ck; v alues ab ov e 1 (red) indicate the reverse. The only scenarios where t w oblo c k wins are the clean-data cases (ratio ≈ 1 . 07–1 . 27), re- flecting the mo dest robustness tax. Under an y form of contamination, R TB consistently ac hieves ratios w ell b elow 1, with the strongest gains for Y outliers at 20% contamination. The pattern is highly consistent across the dense and sparse v ariants. V ariable selection accuracy . F or the sparse metho ds, Figure 3 reports the F 1 score for v ariable selection—the harmonic mean of precision and recall for iden tifying the true signal v ariables among a mixture of signal and noise v ariables. On clean data, b oth sparse metho ds achiev e identical F 1 scores, confirming that robust prepro cessing does not impair v ariable selection in the absence of outliers. Under con tamina- tion, ho w ever, a striking pattern emerges: sparse t w oblo c k’s F 1 degrades substan tially when 9 p=20 (20+0) p=30 (20+10) p=100 (20+80) p=150 (150+0) p=200 (150+50) p=400 (150+250) 0% none 10% X 10% XY 10% Y 20% X 20% XY 20% Y 1.27 1.18 1.10 1.15 1.11 1.07 0.22 0.29 0.59 0.42 0.49 0.66 0.17 0.23 0.54 0.40 0.46 0.63 0.31 0.25 0.25 0.22 0.27 0.32 0.20 0.28 0.61 0.44 0.51 0.69 0.18 0.25 0.56 0.41 0.48 0.66 0.24 0.21 0.18 0.15 0.20 0.21 R TB dense / TB dense p=20 (20+0) p=30 (20+10) p=100 (20+80) p=150 (150+0) p=200 (150+50) p=400 (150+250) 0% none 10% X 10% XY 10% Y 20% X 20% XY 20% Y 1.17 1.19 1.16 1.13 1.10 1.09 0.28 0.30 0.41 0.56 0.63 0.71 0.24 0.26 0.39 0.53 0.57 0.68 0.48 0.33 0.23 0.27 0.30 0.29 0.27 0.30 0.45 0.59 0.63 0.75 0.25 0.26 0.40 0.55 0.59 0.71 0.30 0.24 0.16 0.16 0.19 0.18 R TB sparse / TB sparse 0.0 0.2 0.4 0.6 0.8 1.0 1.2 1.4 MSE ratio 0.0 0.2 0.4 0.6 0.8 1.0 1.2 1.4 MSE ratio Figure 2: MSE ratio of R TB to t woblock for dense (left) and sparse (righ t) v arian ts across all sim ulation scenarios. Green cells ( < 1) indicate R TB outp erforms tw oblo c k; red cells ( > 1) the rev erse. The only red cells corresp ond to the uncon taminated baseline. 0% none 10% X 10% Y 10% XY 20% X 20% Y 20% XY Contamination 0.0 0.2 0.4 0.6 0.8 1.0 F 1 s c o r e p s i g n a l = 2 0 , p n o i s e = 1 0 ( p = 3 0 ) TB sparse R TB sparse 0% none 10% X 10% Y 10% XY 20% X 20% Y 20% XY Contamination p s i g n a l = 2 0 , p n o i s e = 8 0 ( p = 1 0 0 ) TB sparse R TB sparse 0% none 10% X 10% Y 10% XY 20% X 20% Y 20% XY Contamination p s i g n a l = 1 5 0 , p n o i s e = 5 0 ( p = 2 0 0 ) TB sparse R TB sparse 0% none 10% X 10% Y 10% XY 20% X 20% Y 20% XY Contamination p s i g n a l = 1 5 0 , p n o i s e = 2 5 0 ( p = 4 0 0 ) TB sparse R TB sparse V a r i a b l e s e l e c t i o n F 1 : S p a r s e T w o b l o c k v s S p a r s e R T B ( x = 0 . 5 ) Figure 3: V ariable selection F 1 score for sparse t woblock (ligh t blue) and sparse R TB (salmon) across con tamination scenarios, for configurations with noise v ariables ( η x = 0 . 5). Higher is b etter. X outliers or joint X — Y outliers are present (e.g. from 0.85 to 0.57–0.67 for p signal = 150, p noise = 50 at 10–20% contamination), while sparse R TB main tains its F 1 near the clean- data lev el ( ≈ 0 . 85). This demonstrates that R TB not only protects coefficient estimation but also preserv es the v ariable selection consistency of the sparse metho d under con tamination. In terestingly , Y -only outliers do not degrade v ariable selection for either metho d, since the sparsit y is applied to the X -block weigh ts. 4 Applications to real w orld data In this section, the utilit y of the new metho ds will b e illustrated in a set of t wo exam- ples. The first data set contains a mo derate num b er of cases, yet has more v ariables then cases. This data set is included, b ecause it was already identified in the seminal pap er on t woblock dimension reduction ( Co ok et al. , 2023 ) as a data set that illustrates the b enefits 10 of sim ultaneous dimension reduction w ell. Moreo ver, Serneels ( 2025 ) sho wed that sparse t woblock dimension’s intrinsic v ariable selection impro ves up on the results in Cook et al. ( 2023 ). Moreov er, the data set is known to contain outliers, which were remo ved in b oth earlier publications. This section will sho w that robust sparse t woblock do es appro ximately as w ell as the t wo classical metho ds in spite of the presence of outliers and for one of the four response v ariables, even outp erforms the previously published results. The second data set considers a set of sensor readings from gas turbine op erations. It has far more cases than v ariables. V ariables w ere selected to b e represen tative, y et it is plausible that one or tw o v ariables contribute little to the mo deling target. The data set’s resp onse v ariables are known to generate natural v ertical outliers, whic h is conducive to an illustrativ e comparison betw een the metho ds proposed herein. 4.1 Co okie dough NIR data The co okie dough data set ( Osb orne et al. , 1984 ) consists of near-infrared (NIR) sp ectra ( p = 700 w a velengths) measured on dough pieces, with lab oratory measuremen ts of four analytes (F at, Sucrose, Flour, W ater) as the resp onse. The training set contains 40 samples and the test set 32 samples. This data set is kno wn to contain at ypical observ ations: case 23 in the training set and case 21 in the test set ha ve b een iden tified as outliers. F or the non-robust metho ds, these cases are remov ed and the fit is rep orted for the clean data ( n train = 39, n test = 31). F or R TB, all cases are retained for training, so as to allow the rew eighting to handle the outliers automatically . Metho ds compared. W e compare PLS2, PLS1 (per-resp onse), t woblock (dense and sparse), and R TB (dense and sparse). F or the classical metho ds, h yp erparameters are selected b y cross-v alidation on the clean data. F or R TB, hyperparameters are selected by cross-v alidation on the full (con taminated) data, with Hamp el weigh ting (cutoffs p 1 = 0 . 75, p 2 = 0 . 90, p 3 = 0 . 95) and median cen tring. Cross-v alidation selected the follo wing configurations: • PLS2: 6 comp onents, no scaling. • PLS1: 7 (F at), 6, 6, 7 (W ater) comp onents. • Twoblock dense: h x = 6, h y = 2, no scaling. • Twoblock sparse: h x = 9, h y = 2, η x = 0 . 5, standard scaling. • R TB dense: h x = 11, h y = 2, kstepL TS scaling. • R TB sparse: h x = 8, h y = 2, η x = 0 . 3, kstepL TS scaling. Results. T able 1 rep orts test set R 2 for each metho d and resp onse v ariable. The non- robust metho ds are trained and ev aluated on the clean data (39 training, 31 test samples), while R TB is trained on the full data (40 training samples, including the outlier) and ev al- uated on the clean test set (31 samples). 11 T able 1: Co okie dough data: test set R 2 b y metho d and resp onse v ariable. Non-robust metho ds trained on clean data; R TB trained on full data including outliers. Metho d F at Sucrose Flour W ater Mean PLS2 (clean) 0.550 0.948 0.746 0.658 0.725 PLS1 (clean) 0.979 0.935 0.730 0.916 0.890 Tw oblo c k dense (clean) 0.596 0.940 0.821 0.379 0.684 Tw oblo c k sparse (clean) 0.930 0.962 0.931 0.948 0.943 R TB dense (full) 0.933 0.908 0.839 0.823 0.876 R TB sparse (full) 0.980 0.914 0.876 0.904 0.918 Sev eral observ ations stand out. A t first, the dense tw oblo ck on clean data p erforms p o orly for F at and W ater ( R 2 = 0 . 596 and 0 . 379), suggesting that even after removing the kno wn outliers, the classical metho d is sensitiv e to the remaining data structure. Secondly , the sparse tw oblo ck on clean data ac hieves the b est ov erall p erformance (mean R 2 = 0 . 943), demonstrating the v alue of v ariable selection. Thirdly , R TB dense, trained on the ful l data including the outlier, achiev es a mean test R 2 of 0 . 876—substantially b etter than the dense t woblock on clean data. Finally , R TB sparse on full data achiev es strong p erformance across all four analytes (mean R 2 = 0 . 918), comp etitive with the sparse t w oblo c k on clean data, without requiring prior outlier identification or remo v al. This at once illustrates the utility of the method, as well as its outlier robustness and high efficiency , reaching results close to classical estimators for uncon taminated data. Case w eigh t diagnostics. Figure 4 sho ws the com bined case w eights from the dense R TB mo del. Case 23 receives a w eight of 10 − 6 (effectiv ely zero), confirming that R TB automatically identifies and down w eights this known outlier. Case 24 is also do wnw eighted, suggesting it may also be at ypical. All other cases receiv e full weigh t ( w = 1). 5 10 15 20 25 30 35 40 Case inde x 0.0 0.2 0.4 0.6 0.8 1.0 Case weight R TB Dense -- Combined case weights (case 23 in r ed) Figure 4: R TB dense case weigh ts for the co okie dough training data. Case 23 (red) and case 24 are assigned near-zero w eigh ts. The sparse R TB mo del pro duces the same weigh t pattern (Figure 5 ), confirming that the outlier identification is consisten t across the dense and sparse v arian ts. The fact that the 12 sparse robust metho d p erforms b etter than the classical metho ds for the fat v ariable may indicate that case 24 could b e a v ertical outlier for that v ariable only . Ho wev er, there is no w ay to practically v erify that assumption. 5 10 15 20 25 30 35 40 Case inde x 0.0 0.2 0.4 0.6 0.8 1.0 Case weight R TB Sparse -- Combined case weights (case 23 in r ed) Figure 5: R TB sparse case w eights for the co okie dough training data. Cases 23 and 24 (red: case 23) are again assigned near-zero w eights. V ariable selection. The sparse R TB mo del ( η x = 0 . 3, h x = 8) eliminates 368 of 700 w av elengths (52.6%), retaining 332 wa v elengths (47.4%). Figure 6 sho ws the NIR sp ectra o verlaid with the eliminated w a v elength regions (shaded in blue). F our main regions are eliminated: the initial baseline region (wa velengths 0–26), and three regions in the mid- to high-w av elength range (165–215, 302–341, 397–646). These corresp ond to sp ectral regions with lo w signal-to-noise ratio or limited discriminative p ow er for the four analytes. It is noted that this v ariable selection p erformance is virtually indistinguishable from the one obtained from non-robust sparse t woblock dimension reduction, first rep orted in ( Serneels , 2025 ). 4.2 Gas turbine data The gas turbine CO and NOx emission data set ( Ka y a et al. , 2019 ) con tains 36,733 hourly sensor readings from a gas turbine in a combined cycle pow er plant, collected betw een 2011 and 2015. The predictor blo c k consists of p = 9 process v ariables: ambien t temperature (A T), am bient pressure (AP), am bient humidit y (AH), air filter differen tial pressure (AFDP), gas turbine exhaust pressure (GTEP), turbine inlet temp erature (TIT), turbine after temp er- ature (T A T), turbine energy yield (TEY), and compressor discharge pressure (CDP). The biv ariate resp onse consists of CO and NOx emission concen trations, whic h are kno wn to generate natural vertical outliers. T o identify these natural outliers, a 97.5% tolerance ellipse based on the Minimum Co- v ariance Determinant (MCD) estimator ( Rousseeuw , 1985 ) was fitted to the biv ariate re- sp onse space. Out of a random subsample of 5,000 observ ations, this identified 1,064 outliers (21.3%), which w ere separated from 3,936 inliers. The inliers were split 70/30 into a clean training set ( n train = 2 , 755) and a clean test set ( n test = 1 , 181). A contaminated training set 13 1200 1400 1600 1800 2000 2200 2400 wavelength (nm) 0.2 0.4 0.6 0.8 1.0 1.2 1.4 1.6 1.8 r eflectance Figure 6: Co okie dough NIR spectra with eliminated w a velength regions (blue shading) from the sparse R TB model. w as then constructed by injecting 306 of the detected outliers (targeting ≈ 10% con tamina- tion), with care taken to include cases that are extreme in b oth CO and NOx individually . The tolerance ellipse and the resulting outlier classification are sho wn in Figure 7 . Metho ds compared. Five metho ds were compared, each with hyperparameters selected b y 5-fold cross-v alidation on the resp ective training set: • PLS2: 9 comp onents. • Twoblock dense: h x = 9, h y = 2, no scaling (clean); h x = 7, h y = 2 (con taminated). • Twoblock sparse: h x = 9, h y = 2, η x = 0 . 3 (clean); h x = 5, h y = 2, η x = 0 . 7 (con taminated). • R TB dense: h x = 9, h y = 2 (clean); h x = 7, h y = 1 (con taminated). • R TB sparse: h x = 9, h y = 2, η x = 0 . 3 (clean); h x = 5, h y = 2, η x = 0 . 7 (con taminated). Results. T able 2 rep orts the test set MSE for each metho d under b oth training scenarios. Since the CO and NOx v ariables differ substan tially in v ariance ( σ 2 CO ≈ 5 . 7, σ 2 NOx ≈ 135), a 14 0 10 20 30 40 CO (ppm) 40 50 60 70 80 90 100 110 120 NOx (ppm) T olerance ellipse on (CO, NOx) MCD r obust covariance Inliers Outliers 97.5% tolerance Figure 7: Biv ariate (CO, NOx) scatter plot with 97.5% MCD tolerance ellipse. Red crosses: observ ations classified as outliers; blue: inliers used for the clean training and test sets. w eighted mean MSE is also rep orted using inv erse-v ariance w eights, ensuring b oth resp onses con tribute prop ortionally to the ov erall score. T able 2: Gas turbine data: test set MSE b y metho d and resp onse v ariable. The w eighted mean uses inv erse-v ariance weigh ts (CO: 0.960, NOx: 0.040). Clean training Con taminated training Metho d CO NOx Wt. Mean CO NOx Wt. Mean PLS2 0.318 30.40 1.532 1.111 47.26 2.974 TB dense 0.318 30.40 1.532 1.121 47.56 2.997 TB sparse 0.318 30.40 1.532 1.114 60.43 3.509 R TB dense 0.318 30.38 1.532 0.566 34.99 1.956 R TB sparse 0.318 30.38 1.532 0.349 38.97 1.908 On clean data, all metho ds except PRM achiev e virtually identical MSE, with R TB incurring no measurable efficiency loss. It is still noted that the efficiency loss for PRM is limited. Under contamination, the non-robust metho ds (PLS2, TB dense, TB sparse) suffer a roughly t wofold MSE increase for CO, while the R TB v ariants remain close to their clean-data p erformance. Notably , R TB sparse on contaminated data achiev es a CO MSE of 0.349, v ery close to the result for clean data (0.318), while also providing the b est result for the w eighted mean MSE for b oth v ariables, indicating that sparse R TB yields the b est sim ultaneous m ultiv ariate mo del for both emissions in the presence of outliers. 15 Case w eight diagnostics. Figure 8 shows the com bined case w eights from the R TB dense mo del fitted on the contaminated training set. The 306 injected outliers (red bars, app ended after the 2,755 clean cases) receive substantially reduced w eights, with 47% fully do wnw eighted ( w < 0 . 5). The remaining outliers receive partial weigh t, consisten t with the fact that not all observ ations outside the tolerance ellipse are equally extreme. 0 500 1000 1500 2000 2500 3000 Case inde x 0.0 0.2 0.4 0.6 0.8 1.0 Case weight R TB dense case weights (r ed = natural outliers fr om tolerance ellipse) Figure 8: R TB dense case w eights for the gas turbine contaminated training set. Red bars indicate natural outliers iden tified b y the MCD tolerance ellipse. V ariable selection. The sparse R TB mo del ( η x = 0 . 7, h x = 5) ev en tually do es retain all 9 predictor v ariables on the contaminated data, indicating that all sensor readings carry some information for predicting the emission pair. Ho wev er, Figure 9 reveals a strikingly differen t co efficien t profile for eac h resp onse. F or CO, the dominant predictors are TIT (turbine inlet temp erature) and TEY (energy yield), with AFDP , T A T, and CDP con tributing near- zero co efficients. F or NOx, the dominan t predictor is A T (am bient temp erature), follow ed b y GTEP (exhaust pressure) and TIT, with a m uch more distributed co efficient pattern across all v ariables. This differen tial structure illustrates the benefit of m ultiv ariate t w oblo c k mo delling: the shared latent space captures the common structure, while the p er-resp onse co efficien ts reveal whic h ph ysical pro cess v ariables drive eac h emission t yp e. The fact that the fiv e comp onent R TB mo del ev entually retains all v ariables, y et still manages to outperform the dense version, indicates that there still is an adv an tage to extracting comp onents in a sparse manner: for dense R TB, all X blo ck comp onent w eigh ts are non-zero, whereas for sparse t woblock, the comp onent weigh ts are nonzero for just one or a few of the v ariables. Ev entually , the w eighted av erage MSE result sho ws that there can b e a b enefit to sparse comp onen t extraction, ev en when the final model ends up using all v ariables. Moreov er, sparse component weigh ts are easier to interpret. 5 Conclusions and Outlo ok In this article, Robust Twoblock Dimension Reduction (R TB) was in tro duced. R TB is the first robust v arian t of tw o-blo ck sim ultaneous dimension reduction, av ailable in b oth dense and sparse forms. It thereby is the first metho d for sim ultaneous t w oblo c k dimension reduc- tion that allows to tune the mo del complexit y in eac h blo c k of v ariables individually and is robust to outliers. The sparse version is also the first sparse t w oblo c k dimension reduction metho d that allows to tune a separate num b er of latent v ariables in each blo ck, as well as 16 A T AP AH AFDP G TEP TIT T A T TEY CDP 0.0000 0.0025 0.0050 0.0075 0.0100 0.0125 0.0150 0.0175 0.0200 |coefficient| CO -- R TB sparse coefficients A T AP AH AFDP G TEP TIT T A T TEY CDP 0.0 0.2 0.4 0.6 0.8 1.0 |coefficient| NO X -- R TB sparse coefficients V ariable importance (contaminated training) Figure 9: R TB sparse absolute co efficient magnitudes for CO (left) and NOx (right) on the contaminated gas turbine data. All 9 predictors are retained; colour intensit y reflects co efficien t magnitude. a separate sparsity parameter in each blo ck. A t this p oin t, it is noted that tuning a sepa- rate sparsit y parameter w as already possible in sparse robust canonical correlation analysis ( Wilms and Croux , 2016 ), y et an intrinsic dra wbac k top canonical correlation analysis is that the same num b er of latent comp onents needs to apply to b oth blo cks of v ariables, even in cases where dimensionalities of b oth blo c ks are very differen t. By applying iterativ ely reweigh ted estimation with indep enden t case w eighting for the X and Y blo cks, R TB ac hieves resistance to lev erage p oin ts, v ertical outliers, and join t con tamination while maintaining estimation efficiency close to classical tw oblo ck on clean data. This was illustrated in an extensive sim ulation study , as well as in a set of tw o examples. The simulation study demonstrates that R TB consistently outp erforms classical tw oblo ck under contamination, with the b enefit increasing with the prop ortion of outliers, and that these gains extend to the high-dimensional p > n setting. The w ork prop osed in this article leav es sev eral a ven ues open to explore in future w ork. While the metho d allo ws to select different sparsities in each blo ck of v ariables, the fo cus of this pap er was on the robustness prop erties in a setting of dimension reduction and m ultiv ariate regression, as w ell as on v ariable selection in the X blo c k. V ariable selection in the blo ck of dep endent v ariables needs to b e inv estigated in future work in a similar w ay . Applications for that asp ect of the method can arise in bioinformatics, for instance in mo dels that link genome data to metab olome data, where it is unknown b efore the analysis which v ariables to select in each of these blocks, while outliers can naturally occur in either block. Another area to explore is extension of this method to time series data. While man y potential paths for future research can b e envisaged, hop efully the results presented in this article can already spur broader adoption of the robust tw oblo ck dimension reduction metho d. A Co de a v ailabilit y All metho ds prop osed in this article, are implemented in the Python 3 pack age twoblock , whic h has b een made publicly a v ailable on PyPI and the source code of which can b e retrieved 17 on GitHub. The pac k age implemen ts the metho ds twoblock and the robust coun terpart rtb . Its hyperparameters, discussed in this article, can readily b e tuned, since the metho ds are compatible with the widely used scikit-learn API, supp orting common attributes, such as fit , predict and transform . B Data a v ailabilit y All data are public domain and for con venience, a cop y is distributed with the twoblock pac k- age in the data/ directory ( https://github.com/SvenSerneels/twoblock/data ). The original gas turbine CO and NOx emission data set ( Ka ya et al. , 2019 ) is publicly av ailable from the UCI Machine Learning Rep ository at https://archive.ics.uci.edu/dataset/ 551 . All simulation co de and example noteb o oks used to pro duce the results in this pap er are included in the pack age rep ository . C Generativ e AI use In the preparation of this manuscript, Claude Opus 4.6 (Anthropic, Inc.) w as used to em b ellish co de and Jup yter noteb o oks, as well as to transfer some results ov er into tables and figures in the pap er. References Co ok, R. D., F orzani, L., and Liu, L. (2023). P artial least squares for simultaneous reduc- tion of resp onse and predictor v ectors in regression. Journal of Multivariate Analysis , 196:105163. Co ok, R. D., Helland, I. S., and Su, Z. (2013). Env elop es and partial least squares regression. Journal of the R oyal Statistic al So ciety: Series B (Statistic al Metho dolo gy) , 75(5):851–877. Filzmoser, P ., H¨ oppner, S., Ortner, I., Serneels, S., and V erdonc k, T. (2020). Cellwise robust m regression. Computational Statistics & Data Analysis , 147:106944. F ritz, H., Filzmoser, P ., and Croux, C. (2012). A comparison of algorithms for the multi- v ariate l 1-median. Computational Statistics , 27(3):393–410. Hoffmann, I., Serneels, S., Filzmoser, P ., and Croux, C. (2015). Sparse partial robust M regression. Chemometrics and Intel ligent L ab or atory Systems , 149:50–59. Ka ya, H., T ¨ ufek¸ ci, P ., and Uzun, E. (2019). Gas turbine CO and NOx emission data set. UCI Mac hine Learning Rep ository . Dataset #551, https://archive.ics.uci.edu/dataset/ 551 . Maronna, R. A., Martin, R. D., Y ohai, V. J., and Salibi´ an-Barrera, M. (2019). R obust statistics: the ory and metho ds (with R) . John Wiley & Sons. 18 Maronna, R. A. and Zamar, R. H. (2002). Robust estimates of lo cation and disp ersion for high-dimensional datasets. T e chnometrics , 44(4):307–317. Osb orne, B. G., F earn, T., Miller, A. R., and Douglas, S. (1984). Application of near in- frared reflectance sp ectroscopy to the comp ositional analysis of biscuits and biscuit doughs. Journal of the Scienc e of F o o d and A gricultur e , 35(1):99–105. Ra ymaekers, J. and Rousseeu w, P . (2019). A generalized spatial sign cov ariance matrix. Journal of Multivariate Analysis , 171:94–111. Rousseeu w, P . J. (1984). Least median of squares regression. Journal of the Americ an Statistic al Asso ciation , 79(388):871–880. Rousseeu w, P . J. (1985). Multiv ariate estimation with high breakdo wn p oint. In Grossmann, W., Pflug, G., Vincze, I., and W ertz, W., editors, Mathematic al Statistics and Applic ations, V ol. B , pages 283–297. Reidel Publishing Company , Dordrec ht. Serneels, S. (2025). Sparse tw oblo ck dimension reduction: A versatile alternativ e to sparse PLS2 and CCA. Journal of Chemometrics , 39:e70051. Serneels, S., Croux, C., Filzmoser, P ., and V an Esp en, P . J. (2005). Partial robust M- regression. Chemometrics and Intel ligent L ab or atory Systems , 79(1–2):55–64. Serneels, S., Insolia, L., and V erdonck, T. (2024). Elegan t robustification of sparse partial least squares by robustness-inducing transformations. Statistics , 58(1):44–64. Wilms, I. and Croux, C. (2016). Robust sparse canonical correlation analysis. BMC Systems Biolo gy , 10:1–13. W old, H. (1966). Nonlinear estimation by iterativ e least squares pro cedures. In Da vid, F., editor, Pap ers in Statistics: F estschrift for J. Neyman , pages 411–444. Wiley . 19
Original Paper
Loading high-quality paper...
Comments & Academic Discussion
Loading comments...
Leave a Comment