Multiple-group (Controlled) Interrupted Time Series Analysis with Higher-Order Autoregressive Errors: A Simulation Study Comparing Newey-West and Prais-Winsten Methods
Background: Multiple group controlled interrupted time series analysis (MG-ITSA) is widely used to evaluate healthcare interventions. Prior studies compared ordinary least squares with Newey-West standard errors (OLS-NW) and Prais-Winsten (PW) regres…
Authors: Ariel Linden
Multiple-group (Con trolled) In terrupted Time Series Analysis with Higher-Order Autoregressiv e Errors: A Sim ulation Study Comparing New ey–W est and Prais–Winsten Metho ds Ariel Linden, DrPH Univ ersity of California, San F rancisco Departmen t of Medicine Division of Clinical Informatics & Digital T ransformation (DoC-IT) ariel.linden@ucsf.edu Abstract Bac kground: Multiple-group (con trolled) interrupted time series analysis (MG-ITSA) is increasingly used to ev aluate in terven tions in healthcare settings. Previous studies ha ve compared ordinary least squares with Newey–W est standard errors (OLS-NW) and Prais–Winsten (PW) regression under first-order autoregressive (AR[1]) errors, but p erformance under higher-order autoregressive errors has not b een explored. Re- cen t extensions of the Prais–Winsten transformation to AR[k] pro cesses make such comparisons feasible. Metho ds: A Monte Carlo simulation study w as conducted based on the MG-ITSA regression model with 4 con trol units. Data w ere generated under AR[2] and AR[3] error structures representing mild p ositiv e, oscillatory , and high p ersisten t auto correlation across series lengths (10–100 p eriods) and effect sizes. T reatmen t effects w ere defined as difference-in-differences in level and trend. Six p erformance measures w ere ev aluated: p o w er, 95% confidence in terv al co v erage, T yp e I error rate, p ercen tage bias, ro ot mean squared error, and empirical standard errors. Sensitivity analyses examined alternative design sp ecifications under b oth AR orders. Results: Both metho ds pro duced approximately unbiased estimates across all condi- tions. OLS-NW generally had higher p ow er but inflated Type I error and p o or co verage, esp ecially with increasing AR order and series length. Under high p ersisten t auto cor- relation, OLS-NW cov erage decreased with series length, dropping to 45–50% at 100 p erio ds, while PW main tained near-nominal cov erage (91–94%). OLS-NW Type I error also increased with series length, reaching 50–57% at 100 p erio ds. Under sp ecific con- ditions, PW sho wed p ow er adv antages ov er OLS-NW. Sensitivity analyses supp orted the primary findings. Conclusions: The trade-off b et ween p ow er and inferential v alidit y seen under AR[1] errors p ersists and in tensifies with higher AR orders. The p ow er adv an tage of OLS-NW is mainly due to inflated false p ositiv es, esp ecially under high p ersistent auto correlation, where its inferen tial p erformance w orsens with increasing series length. PW offers more 1 reliable inference and is the preferred estimator for v alid hypothesis testing, co verage, and Type I error control. Keyw ords: In terrupted time series analysis; multiple-group in terrupted time series analysis; con trolled in terrupted time series analysis; auto correlation; higher-order au- toregression; Newey-W est; Prais-Winsten regression; p ow er; simulation study 2 Bac kground In terrupted time series analysis (ITSA) is widely used in healthcare research to ev aluate the effects of interv entions, p olicy c hanges, and natural ev en ts. In this quasi-exp erimen tal design, outcomes are observed sequen tially at regular in terv als, often as aggregated measures suc h as morbidit y or mortalit y rates or av erage exp enditures. Typically , a single unit (e.g., a hospital or geographic region) is exp osed to an treatmen t exp ected to pro duce an observ able change— an “interruption”—in the level and/or trend of the outcome following implemen tation [ 1 , 2 ]. Because ITSA relies on m ultiple observ ations b efore and after the treatment, it is often considered to ha ve strong internal v alidit y , particularly in its ability to mitigate threats suc h as regression to the mean [ 1 , 2 , 3 ]. When applied to p opulation-level data or replicated across settings, ITSA may also supp ort broader external v alidity [ 1 , 2 ]. Despite these strengths, the single-group ITSA design (SG-ITSA) remains susceptible to imp ortan t v alidit y threats. In particular, SG-ITSA may fail to accoun t for con temp oraneous external influences and ma y yield misleading conclusions when outcome trends are already changing prior to the treatmen t [ 4 ]. These limitations can b e addressed b y incorp orating one or more comparison units that resem ble the treated unit with resp ect to baseline outcome lev els, pre-treatment trends, and other observ able c haracteristics [ 5 , 6 , 7 , 8 , 9 ]. This approac h, commonly referred to as m ultiple-group or controlled interrupted time series analysis (MG-ITSA), strengthens causal inference by pro viding a comparison series that approximates the counterfactual outcome tra jectory that w ould ha ve b een observed in the absence of the treatment [ 10 ]. Although a wide range of modeling approac hes has been prop osed for ev aluating treat- men t effects in SG-ITSA, the options a v ailable for MG-ITSA are more limited. The tw o most widely used approac hes in practice, largely b ecause they are accessible to applied researc hers without adv anced econometric training, are ordinary least squares with Newey– W est [ 11 ] heterosk edasticity- and auto correlation-consisten t standard errors (OLS-NW) and 3 Prais–Winsten (PW) regression [ 12 ]. Prior comparisons of these metho ds ha ve focused on AR[1] error pro cesses, reflecting the fact that the classical PW estimator was originally de- v elop ed for this case [ 13 , 14 , 15 ]. Ho wev er, time series in health services and p olicy researc h ma y exhibit higher-order serial dep endence. Recen tly , V ougas [ 16 ] prop osed a generalized Prais–Winsten algorithm that accommo- dates higher-order autoregressive pro cesses, AR[ k ]. This approach has since been imple- men ted in Stata TM through the communit y-con tributed praisk pac k age [ 17 ], making it feasible to estimate MG-ITSA mo dels under higher-order auto correlation structures using standard softw are. These developmen ts create an opp ortunit y to examine ho w the tw o most widely used MG- ITSA estimation approaches p erform when the underlying error pro cess extends b eyond first- order auto correlation. T o address this gap, the presen t study ev aluates the p erformance of OLS-NW and PW regression under AR[2] and AR[3] error structures within a Monte Carlo sim ulation framework based on the standard MG-ITSA model. Sp ecifically , w e compare the tw o metho ds across a range of realistic design conditions, including v ariation in series length, effect size, and the form of the treatment effect (difference-in-differences in level or difference-in-differences in trend). Data are generated under three auto correlation patterns— mild p ositiv e, oscillatory , and high p ersistent auto correlation—chosen to reflect plausible conditions encoun tered in applied healthcare time series. In addition to statistical p ow er, w e ev aluate confidence in terv al co verage, Type I error rates, percentage bias, ro ot mean squared error, and empirical standard errors, in order to provide a comprehensive assessmen t of estimator p erformance under higher-order autoregressiv e dep endence. Metho ds The MG-ITSA mo del The MG-ITSA regression mo del assumes the following form [ 5 , 18 ]: 4 Y t = β 0 + β 1 T t + β 2 X t + β 3 ( X t × T t ) + β 4 Z + β 5 ( Z × T t ) + β 6 ( Z × X t ) + β 7 ( Z × X t × T t ) + ε t (1) where Y t is the aggregated outcome v ariable measured at each time-p oint t ; T t is the time since the start of the study; X t is a dummy v ariable for the treatmen t p erio d (0 = pre- treatmen t, 1 = p ost-treatmen t); Z is a dummy v ariable denoting cohort assignmen t (treat- men t or control); and ( X t × T t ) , ( Z × T t ) , ( Z × X t ) , and ( Z × X t × T t ) are in teraction terms. Co efficien ts β 0 – β 3 represen t the control group and β 4 – β 7 represen t the treatment unit. More sp ecifically: β 0 is the in tercept (starting lev el) for the control group; β 1 is the pre-treatmen t slop e for the con trol group; β 2 represen ts the change in level for the control group immedi- ately following introduction of the treatment; β 3 is the p ost-treatment c hange in slop e for the con trol group; β 4 is the difference in baseline lev el b etw een the treatment unit and con trols; β 5 is the difference in baseline slop e; β 6 indicates the difference-in-differences in level immedi- ately follo wing in tro duction of the treatmen t; and β 7 represen ts the difference-in-differences in trend after in tro duction of the treatmen t relativ e to pre-treatment [ 5 ]. When the random error terms foll o w an AR[1] pro cess, ε t = ρ ε t − 1 + u t (2) where ρ is the auto correlation co efficient ( | ρ | < 1 ) and u t ∼ i.i.d. N (0 , σ 2 ) . Equation (2) naturally generalizes to an AR[ k ] pro cess in whic h each error term dep ends on the previous k lags: ε t = ρ 1 ε t − 1 + ρ 2 ε t − 2 + · · · + ρ k ε t − k + u t (3) where u t ∼ i.i.d. N (0 , σ 2 ) and ρ j is the partial autocorrelation co efficient at lag j , for 5 j = 1 , 2 , . . . , k [see 19 , for a detailed discussion]. The parameters β 4 and β 5 pla y a particularly imp ortan t role in establishing whether the treatmen t unit and controls are balanced on the level and trend of the outcome in the pre- treatmen t p erio d. In an observ ational study where equiv alence cannot b e ensured, observ ed differences raise concerns about causal inference [ 5 , 18 ]. F or a visual depiction of these parameters, the reader is referred to Linden [ 5 , 20 ]. Estimation approac hes Or dinary le ast squar es r e gr ession with Newey–W est standar d err ors This approac h estimates the time series mo del using ordinary least squares (OLS), with sta- tistical inference based on heteroskedasticit y- and auto correlation-consistent (HAC) standard errors follo wing Newey and W est [ 11 ]. The estimator appro ximates the long-run v ariance of the regression disturbances as a weigh ted sum of sample auto cov ariances, using Bartlett k ernel weigh ts that decline linearly with lag order to ensure p ositive semi-definiteness. This pro duces a consisten t estimator of the asymptotic co v ariance matrix. Provided that the truncation lag increases at an appropriate rate with the sample size, the resulting t - and F - statistics are asymptotically v alid under heteroskedasticit y and serial correlation of unkno wn form. This mak es the approac h a flexible inferen tial framework when the underlying error structure—whether AR[1] or higher-order—is uncertain or p otentially missp ecified [ 21 ]. A detailed description of the Newey–W est metho d is pro vided in App endix 1 of the Supplemen t. Pr ais–Winsten r e gr ession The Prais–Winsten (PW) metho d is a feasible generalized least squares (FGLS) pro cedure for linear time-series regression models. It w as originally dev elop ed to correct for AR[1] serial correlation in the errors while retaining the full sample, including the first observ ation [ 12 ]. Under an AR[1] sp ecification, the metho d first estimates the auto correlation parameter ρ using an auxiliary regression of the OLS residuals on their lagged v alues. It then applies 6 a quasi-differencing transformation to b oth the dep endent and indep endent v ariables. OLS estimation on the transformed mo del yields co efficient estimates that are asymptotically more efficien t than standard OLS under the assumed AR[1] stru cture, and asso ciated standard errors and test statistics that are v alid for inference in the presence of such serial correlation [ 21 ]. V ougas [ 16 ] extends this approach to AR[ k ] error pro cesses of arbitrary order. In this form ulation, the metho d iterates b et ween Y ule–W alk er estimation of the AR[ k ] parameter v ector and generalized least squares (GLS) transformation un til conv ergence. This extension has b een implemented in Stata through the comm unity-con tributed praisk pack age [ 17 ]. A detailed description of the statistical methods as implemen ted in praisk is pro vided in App endix 2 of the Supplement. The power_itsa pac k age for Stata All simulations were conducted using the communit y-contributed Stata pack age power_itsa [ 22 ], whic h computes statistical p ow er for ITSA designs via simulation. The pack age uses user-sp ecified co efficien t v alues from the MG-ITSA regression mo del (Equation 1) to generate artificial datasets through the itsadgp pac k age [ 23 ]. This data-generating pro cess pro duces one treated unit and a user-sp ecified n umber of control units. Eac h generated dataset is passed to the itsa pac k age [ 5 ] to estimate treatmen t effects corresp onding to β 6 and β 7 (the difference-in-differences in level and trend, resp ectively). The pack age supp orts b oth OLS-NW and PW regression (via praisk ) as estimation metho ds, and all analyses w ere conducted using b oth approaches. F ollo wing mo del estimation, power_itsa p erforms W ald tests to ev aluate whether β 6 = 0 and β 7 = 0 . F or all analyses, the null hypothesis is rejected at α = 0 . 05 . Sim ulation strategy T able 1 presen ts the sim ulation inputs. The primary ob jective was to ev aluate whether, and to what exten t, the magnitude and structure of auto correlation under AR[2] and AR[3] 7 pro cesses differen tially influence the p erformance of OLS-NW and PW estimators across a range of conditions, including v ariation in the total num b er of time p erio ds, effect size, and the measure of effect—either the difference-in-differences in lev el ( β 6 in Equation 1) or the difference-in-differences in trend ( β 7 in Equation 1). Sim ulation inputs were mo deled on those used in Linden [ 15 ] to main tain comparabil- it y , with three key mo difications. First, the num b er of time perio ds was extended to range from 10 to 100 (compared with an upp er limit of 50 in [ 15 ]) to assess whether higher-order autoregressiv e error structures exhibit differen t b eha vior ov er longer time horizons. Second, the num b er of control units was fixed at 4; b ecause 4 controls represen ted b oth the mini- m um tested and the most v ariable condition in [ 15 ], fixing this v alue preserves comparability while reducing the total simulation burden. Third, this study introduces higher-order au- toregressiv e error structures. F or b oth AR[2] and AR[3], three auto correlation scenarios w ere sp ecified: mild p ositive autocorrelation, oscillatory auto correlation with damp ed b ehavior, and high p ersisten t p ositive auto correlation (see T able 1 for parameter v alues). All remaining inputs follo w Linden [ 15 , 24 ]. The starting level (in tercept) w as set to 10 for b oth the treated unit and controls. The pre-treatmen t trend was set to 1 for b oth series. The change in lev el for the control series at the initiation of the treatment was set to 0. F or the treated unit, the level change was set to 2, 2.5, and 3 when ev aluating lev el effects (representing increases of 20%, 25%, and 30% relativ e to the coun terfactual), and to 0 when ev aluating trend effects. The p ost-treatmen t trend for the con trol series w as set to 1. F or the treated unit, the p ost-treatment trend was set to 1.25, 1.5, and 2 when ev aluating trend effects (represen ting increases of 25%, 50%, and 100% o ver the pre-treatment slop e), and to 0 when ev aluating lev el effects. A standard deviation of 1 was used for the normally distributed random error term. The treatment w as inititated at the midp oin t of the time series in all scenarios. 8 Sensitivit y analysis The sensitivit y analysis examined whether the com bination of lev el and trend changes dif- feren tially affects the p erformance of OLS-NW and PW mo dels under the AR[2] and AR[3] scenarios. The controls’ baseline lev el was set to 8, and the treated unit’s baseline level w as set to 10. The treatmen t unit’s lev el change was set to 2 (a 20% increase), with no lev el c hange for the con trols. The treatmen t unit’s p ost-treatmen t trend w as set to 2 (a 100% increase), and the con trols’ p ost-treatmen t trend was set to 1, reflecting contin uation of the baseline trend. P erformance measures The p erformance of OLS-NW and PW was ev aluated using six metrics: statistical p o wer, 95% confidence interv al co v erage, Type I error rate, p ercentage bias, ro ot mean squared error (RMSE), and empirical standard errors [ 25 ]. F or each simulation scenario, 2,000 datasets w ere generated. All analyses were conducted using tata TM v ersion 19.0. Results Difference-in-Differences in T rend: AR[2] Power Figure 1 presents p o wer ( 1 − β ) for the difference-in-differences in trend under AR[2] error structures. Across all three AR[2] parameter conditions and effect sizes, OLS-NW consis- ten tly ac hieved higher p ow er than PW at shorter series lengths, with b oth metho ds conv erg- ing to maxim um p ow er as the num b er of p erio ds increased. Under mild p ositiv e auto cor- relation, OLS-NW reached near-maximum p ow er by appro ximately 40–50 p erio ds across all effect sizes, whereas PW required somewhat longer series to reach comparable lev els. Under oscillatory auto correlation, the gap b et ween the t wo metho ds narrow ed considerably , with 9 b oth conv erging to maxim um p o wer at similar rates. The largest differences were observed under high p ersistent p ositiv e auto correlation, where PW remained substantially underp ow- ered relativ e to OLS-NW across all effect sizes. A t the smallest effect size (25%), PW did not reach maximum p o w er even at 100 p erio ds, whereas OLS-NW ac hieved near-maxim um p o w er w ell b efore that p oint. As exp ected, larger effect sizes accelerated con vergence to maxim um p o wer for b oth metho ds, although the relative adv antage of OLS-NW p ersisted across all conditions. 95% Cover age Figure 2 presents 95% cov erage rates for the difference-in-differences in trend under AR[2] error structures. Under mild p ositiv e autocorrelation, PW main tained cov erage close to the nominal 95% level across all series lengths and effect sizes, whereas OLS-NW exhib- ited substantial and p ersistent undercov erage, remaining around 75% with no meaningful impro vemen t as the num b er of p erio ds increased. This deficit w as stable across all three effect sizes, indicating that it reflects a structural feature of OLS-NW under this auto cor- relation condition rather than a small-sample artifact. Under oscillatory auto correlation, b oth metho ds started b elo w the nominal lev el at short series lengths but conv erged up ward to ward 95% as the num b er of p erio ds increased, with PW main taining a mo dest but consis- ten t adv an tage throughout. The most consequen tial pattern emerged under high p ersisten t p ositiv e auto correlation. PW maintained stable cov erage near 90% across all series lengths and effect sizes. In contrast, OLS-NW cov erage deteriorated monotonically as the n umber of p erio ds increased, declining from appro ximately 80% at 10 p erio ds to approximately 50% at 100 p erio ds. This progressive worsening of cov erage with increasing sample size indicates that the apparen t p ow er adv antage of OLS-NW in this setting is achiev ed at the cost of increasingly anti-conserv ativ e inference. 10 T yp e I Err or Figure 3 presents Type I error rates for the difference-in-differences in trend under AR[2] error structures. PW maintained T yp e I error close to the nominal 5% level across all three AR[2] parameter conditions and the full range of series lengths, indicating w ell-con trolled false p ositiv e rates. In con trast, OLS-NW exhibited mark edly inflated Type I error in t wo of the three conditions. Under mild p ositive auto correlation, OLS-NW pro duced T yp e I error rates of approximately 25–30% across all series lengths, with no tendency to impro v e as the num b er of p erio ds increased. Under oscillatory auto correlation, Type I error was sev erely inflated at short series lengths ( ∼ 22%) but declined tow ard the nominal lev el b y appro ximately 40 p erio ds, suggesting that this is primarily a small-sample issue under this condition. Under high p ersistent p ositive auto correlation, OLS-NW exhibited the most severe pattern: T yp e I error increased monotonically with series length, rising from approximately 22% at short series lengths to appro ximately 50% at 100 p erio ds. T ak en together with the cov erage results, these findings indicate that the apparent p ow er adv antage of OLS-NW under AR[2] errors is largely driv en by inflated false p ositive rates, particularly under high p ersisten t auto correlation. Bias Figure 4 presents p ercentage bias for the difference-in-differences in trend under AR[2] error structures. Both OLS-NW and PW w ere essen tially un biased across all auto correlation conditions, effect sizes, and series lengths, with p ercen tage bias remaining close to zero in nearly all scenarios and no evidence of systematic directional bias. Some instabilit y w as observ ed at very short series len gths (10–20 p erio ds), particularly under oscillatory and high p ersisten t auto correlation, where b oth metho ds show ed mo dest v ariabilit y b efore stabilizing. These fluctuations diminished quic kly and were not meaningfully different b etw een metho ds. Ov erall, the bias results indicate that differences in p erformance b etw een OLS-NW and PW arise from v ariance and inferen tial prop erties rather than systematic error in p oint estimation. 11 RMSE Figure 5 presents ro ot mean squared error (RMSE) for the difference-in-differences in trend under AR[2] error structures. Under mild positive and oscillatory autocorrelation, b oth metho ds pro duced closely aligned and relativ ely flat RMSE profiles, increasing only slightly from appro ximately 1.0 at 10 p erio ds to appro ximately 1.15 at 100 p erio ds, with negligible differences b etw een OLS-NW and PW across all effect sizes. Under high p ersisten t p ositive auto correlation, RMSE increased substantially and monotonically for b oth metho ds, rising from approximately 1.3 at 10 p erio ds to approximately 1.9 at 100 p erio ds. In this setting, PW pro duced marginally higher RMSE than OLS-NW throughout, although the t wo meth- o ds trac ked eac h other closely . Giv en the negligible bias observed across conditions, the elev ated RMSE under high p ersistent auto correlation reflects increased v ariance rather than systematic misestimation. Empiric al Standar d Err ors Figure 6 presen ts empirical standard errors for the difference-in-differences in trend under AR[2] error structures. Both metho ds exhibited declining empirical standard errors as series length increased, consistent with improv ed estimation precision in larger samples. PW con- sisten tly pro duced larger empirical standard errors than OLS-NW across all auto correlation conditions and effect sizes. Under mild p ositive and oscillatory auto correlation, the gap b e- t ween the tw o metho ds narrow ed as the num b er of p erio ds increased, with b oth con verging to similar v alues by approximately 40–50 p erio ds. Under high p ersistent p ositiv e auto corre- lation, PW maintained noticeably larger empirical standard errors than OLS-NW across the full range of series lengths, with the separation remaining eviden t even at 100 p erio ds. These differences are consisten t with the broader pattern across p erformance measures: OLS-NW ac hieves smaller standard errors and higher p ow er, but at the cost of inflated T yp e I error and undercov erage, particularly under high p ersistent auto correlation. 12 Difference-in-Differences in T rend: AR[3] Power Figure 7 presents p o wer ( 1 − β ) for the difference-in-differences in trend under AR[3] error structures. The o verall pattern closely mirrors that observ ed under AR[2], with OLS-NW consisten tly achieving higher p o wer than PW at shorter series lengths across all three AR[3] parameter conditions and effect sizes. Under mild p ositiv e auto correlation, OLS-NW reac hed near-maxim um p ow er earlier than PW, although b oth metho ds con verged to maximum p ow er b y appro ximately 50–60 p erio ds at the 25% effect size and considerably so oner at larger ef- fect sizes. Under oscillatory auto correlation, a similar pattern w as observ ed, with OLS-NW main taining a consistent lead while b oth metho ds conv erged to maximum p ow er at approx- imately 50–60 p erio ds. The largest differences were observed under high p ersistent p ositive auto correlation, where the gap b etw een the tw o metho ds was substan tially larger than under AR[2]. OLS-NW approac hed near-maximum p o wer b y appro ximately 80–90 p erio ds at the 25% effect size, whereas PW reached only appro ximately 60% p o wer at 100 perio ds. A t larger effect sizes the gap narro wed, but PW con tinued to lag OLS-NW considerably , indi- cating that the p ow er disadv an tage of PW under high p ersisten t auto correlation b ecomes more pronounced as AR order increases from 2 to 3. 95% Cover age Figure 8 presents 95% cov erage rates for the difference-in-differences in trend under AR[3] error structures. PW maintained near-nominal cov erage across all conditions and series lengths, ranging from appro ximately 90–93% throughout. In contrast, OLS-NW exhibited substan tial underco verage across all three AR[3] conditions, with deficits generally larger than those observed under AR[2]. Under mild p ositive auto correlation, co verage remained p ersisten tly low at appro ximately 65–70% across all series lengths and effect sizes, with no meaningful improv emen t as the n umber of p erio ds increased. Under oscillatory auto correla- 13 tion, co verage b egan at approximately 67% at short series lengths and improv ed gradually to approximately 83–85% by 100 p erio ds, although it did not approach nominal lev els within the range examined. Under high p ersistent p ositiv e auto correlation, OLS-NW exhibited the most severe pattern: co verage b egan near 80% at short series lengths and declined monotoni- cally and steeply , falling to appro ximately 45% at 100 p erio ds. This progressive deterioration with increasing sample size is more pronounced than under AR[2] and reinforces the con- clusion that the inferen tial p erformance of OLS-NW worsens as b oth series length and AR order increase under p ersistent auto correlation. T yp e I Err or Figure 9 presents Type I error rates for the difference-in-differences in trend under AR[3] error structures. PW maintained relativ ely stable T yp e I error rates of appro ximately 10– 13% across all conditions and series lengths. Although mo destly elev ated ab ov e the nominal 5% level, these v alues w ere substan tially lo w er than those observed for OLS-NW. OLS-NW exhibited markedly inflated T yp e I error across all conditions. Under mild p ositive auto- correlation, Type I error fluctuated b etw een approximately 28–35% across all series lengths with no meaningful improv emen t. Under oscillatory auto correlation, T yp e I error b egan at appro ximately 32% at short series lengths and declined gradually to approximately 18% at 100 p erio ds, indicating some improv emen t with increasing sample size but remaining well ab o v e nominal levels. Under high p ersistent p ositive auto correlation, OLS-NW exhibited the most sev ere pattern: Type I error increased monotonically with series length, rising from appro ximately 21% at short series lengths to appro ximately 57% at 100 perio ds. This tra- jectory is more extreme than under AR[2] and, together with the cov erage results, indicates that the apparen t p ow er adv an tage of OLS-NW is largely driv en by inflated false p ositive rates that worsen with b oth series length and AR order. 14 Bias Figure 10 presen ts percentage bias for the difference-in-differences in trend under AR[3] error structures. Both OLS-NW and PW w ere essentially unbiased across all conditions, effect sizes, and series lengths, with p ercentage bias remaining at appro ximately 1% or less throughout. Unlike the AR[2] results, no meaningful instabilit y was observed ev en at the shortest series lengths, and bias estimates remained nearly flat across all conditions. These findings confirm that p erformance differences b et ween the t wo metho ds arise from v ariance and inferential prop erties rather than systematic error in p oin t estimation. RMSE Figure 11 presents RMSE for the difference-in-differences in trend under AR[3] error struc- tures. Under mild p ositiv e and oscillatory auto correlation, b oth metho ds pro duced closely aligned and relatively flat RMSE profiles, increasing mo destly from approximately 1.0–1.1 at 10 p erio ds to approximately 1.2 at 100 p erio ds, with negligible differences b et ween metho ds. Under high p ersisten t p ositiv e auto correlation, RMSE increased substan tially and monotoni- cally for b oth metho ds, rising from approximately 1.2 at 10 p erio ds to approximately 2.1–2.2 at 100 p erio ds. These v alues are higher than those observed under AR[2], indicating that estimation v ariabilit y increases with AR order under p ersistent auto correlation. PW pro- duced marginally higher RMSE than OLS-NW throughout this condition, although the t wo metho ds trac ked each other closely . The elev ated RMSE reflects increased v ariance rather than systematic misestimation. Empiric al Standar d Err ors Figure 12 presen ts empirical standard errors for the difference-in-differences in trend under AR[3] error structures. Both metho ds exhibited declining standard errors as series length increased, reflecting impro v ed estimation precision in larger samples. PW consistently pro- duced larger empirical standard errors than OLS-NW across all conditions and effect sizes. 15 Under mild p ositive and oscillatory auto correlation, the gap b etw een the tw o metho ds nar- ro wed as the num b er of p erio ds increased, with b oth conv erging to near-zero v alues by 100 p erio ds. Under high p ersistent p ositive auto correlation, PW main tained noticeably larger standard errors than OLS-NW across the full range of series lengths, with the separation remaining evident ev en at 100 p erio ds. As in the AR[2] results, these differences reflect the underlying trade-off: OLS-NW ac hieves smaller standard errors and higher p ow er, but at the cost of inflated T yp e I error and undercov erage, with these deficiencies b ecoming more pronounced as AR order increases. Difference-in-Differences in Lev el: AR[2] Lev el c hange results are presented in App endix 3 (Figures 1–6 for AR[2] and Figures 7–12 for AR[3]). Key findings are summarized here. Under AR[2], neither metho d reached maximum p ow er within the 100-p erio d range un- der most conditions. The relative p erformance of OLS-NW and PW v aried b y auto cor- relation scenario: OLS-NW outperformed PW under mild positive autocorrelation, PW outp erformed OLS-NW under oscillatory auto correlation at shorter series lengths, and b oth metho ds plateaued at appro ximately 50–55% under high persistent auto correlation with minimal separation. Co v erage and T yp e I error patterns broadly mirrored the trend re- sults, although co v erage reco vered more completely under oscillatory auto correlation for lev el c hange. Bias remained negligible throughout, and RMSE patterns closely mirrored those for trend c hange. Empirical standard errors revealed a notable reversal under oscilla- tory auto correlation, where PW ev entually pro duced smaller standard errors than OLS-NW at longer series lengths, consistent with PW’s p ow er adv an tage under that condition. Difference-in-Differences in Lev el: AR[3] Under AR[3], neither metho d reac hed maxim um p ow er under most conditions, and the relativ e p erformance of the tw o metho ds w as more v ariable than under AR[2]. OLS-NW 16 outp erformed PW under mild p ositive and oscillatory auto correlation. Under high p ersistent auto correlation, b oth methods remained substan tially underp o wered, with PW achieving a mo dest but consisten t p ow er adv an tage at the largest effect size (30%)—the only setting in this study where PW demonstrated a clear pow er adv antage ov er OLS-NW. Cov erage and T yp e I error patterns were broadly consisten t with the trend AR[3] results, with somewhat less extreme deterioration under high p ersistent auto correlation. Bias remained negligible and RMSE patterns w ere similar to the trend results. Under high p ersisten t auto correlation, a reversal in empirical standard errors was observed, with PW even tually pro ducing smaller standard errors than OLS-NW, consistent with PW’s p ow er adv an tage in that condition. Sensitivit y Analyses App endix 4 Figure 1 presents the sensitivity analysis results for AR[2] across all p erformance measures and auto correlation conditions. The results were fully consistent with the main sim ulation findings. Sp ecifically , all k ey patterns observed in the primary analyses w ere repro duced: the higher p ow er of OLS-NW at shorter series lengths, the stable and near- nominal cov erage achiev ed by PW, the progressiv e deterioration of OLS-NW co verage under high p ersisten t auto correlation, negligible bias for b oth metho ds, and substantially elev ated RMSE under high p ersisten t auto correlation. These findings provide no evidence that the primary results are sensitiv e to the alternative design sp ecifications examined. App endix 4 Figure 2 presen ts the sensitivit y analysis results for AR[3]. The results were fully consistent with b oth the primary AR[3] findings and the AR[2] sensitivit y analysis. All k ey patterns w ere repro duced, including the higher pow er of OLS-NW at shorter series lengths, the stable and near-nominal co verage of PW, the pronounced and progressive deteri- oration of OLS-NW cov erage under high p ersistent auto correlation, negligible bias for b oth metho ds, and elev ated RMSE under high p ersisten t auto correlation. These findings pro- vide no evidence that the AR[3] results are sensitiv e to the alternativ e design sp ecifications considered. 17 Discussion This no vel study contributes to the MG-ITSA literature b y comparing the p erformance of OLS-NW and Prais–Winsten regression under higher-order autoregressive error structures. While prior simulation w ork has examined these metho ds under AR[1] errors [ 15 ], extension to AR[2] and AR[3] has only recently b ecome feasible follo wing V ougas’s dev elopment [ 16 ] of an exact Prais–Winsten transformation for higher-order pro cesses and its implemen tation in Stata through the praisk pack age [ 17 ]. As in the AR[1] setting, the results demonstrate systematic trade-offs b etw een the tw o metho ds that arise primarily from differences in v ari- ance estimation and inferential calibration rather than bias or p oint-estimation accuracy . At the same time, the presen t study sho ws that these trade-offs are not constan t across error structures: their magnitude and character change as AR order increases, with imp ortant implications for the design and analysis of MG-ITSA studies. T able 2 summarizes the k ey findings across AR[1], AR[2], and AR[3]. The p o wer results are broadly consisten t with those rep orted under AR[1] [ 15 ], in that OLS-NW generally ac hieves higher p ow er than PW, particularly under mild positive auto- correlation. This pattern p ersists at AR[2] and AR[3] across most conditions and effect sizes. These findings are also consistent with Bottomley et al. [ 14 ], who rep orted higher p ow er for OLS-NW in SG-ITSA, and with W o oldridge [ 21 ], who notes that FGLS approaches ma y exhibit low er p ow er when auto correlation is mo dest or imp erfectly estimated. Ho wev er, imp ortan t departures from the AR[1] pattern emerge under more complex auto correlation structures. Under oscillatory auto correlation at AR[2], PW outp erformed OLS-NW for level c hange at shorter series lengths, a reversal not observed at AR[1]. More notably , under high p ersisten t auto correlation, the p ow er gap widened at AR[2] and further at AR[3], and PW achiev ed a gen uine p ow er adv an tage for level change at larger effect sizes under AR[3]. These findings indicate that the relativ e p ow er of OLS-NW and PW dep ends critically on AR order, auto correlation structure, and effect measure, and cannot b e inferred from AR[1] 18 results alone. As in prior work, how ever, the apparent p ow er adv an tages of OLS-NW m ust b e interpreted in ligh t of its inferential p erformance. Both OLS-NW and PW pro duced approximately un biased estimates across all AR orders, effect sizes, auto correlation conditions, and series lengths. These findings are consistent with results under AR[1] [ 15 ] and with prior SG-ITSA sim ulation studies [ 13 , 14 ], indicating that higher-order autoregressive error structures do not introduce bias in p oin t estimation for either metho d. Empirical standard errors declined with increasing series length for b oth metho ds across all AR orders. PW generally pro duced larger standard errors than OLS- NW, consisten t with the finite-sample prop erties of FGLS estimators [ 21 ] and with prior findings under AR[1] [ 15 ]. Ho w ev er, this relationship w as not inv arian t: under oscillatory auto correlation at AR[2] for lev el c hange, the metho ds con verged and crossed, with PW ev entually producing smaller standard errors; and under high p ersistent autocorrelation for level change at b oth AR[2] and AR[3], PW standard errors fell b elo w those of OLS- NW at longer series lengths, directly corresp onding to PW’s p ow er adv antage under those conditions. Despite these differences in standard errors, RMSE w as similar b etw een metho ds under mild p ositive and oscillatory auto correlation across all AR orders. Under high p ersisten t au- to correlation, ho w ever, RMSE increased substan tially and monotonically with series length at AR[2] and AR[3], reac hing approximately 1.9 and 2.1–2.2 at 100 p erio ds, resp ectiv ely . This pattern was not observed under AR[1] [ 15 ] and reflects increasing v ariance rather than bias, suggesting that higher-order p ersisten t auto correlation introduces instability that ac- cum ulates with longer series. In contrast to its p o wer adv antages, OLS-NW exhibited p o or finite-sample inferen tial p erformance across all AR orders, with deficiencies that in tensified at higher orders. Under AR[1], OLS-NW cov erage was substantially b elo w nominal but relatively stable (approxi- mately 82–83%) [ 15 ]. A t AR[2] and AR[3] under mild p ositiv e auto correlation, cov erage declined further to appro ximately 75% and 65–70%, resp ectively . More imp ortantly , under 19 high p ersisten t auto correlation, a qualitatively different pattern emerged: co v erage deterio- rated monotonically as series length increased, falling to approximately 50% at AR[2] and 45–50% at AR[3] at 100 p erio ds. This progressiv e decline with increasing time p erio ds—the opp osite of what would b e exp ected under asymptotic consistency—represents a key finding of the study . In con trast, PW main tained near-nominal co verage across all AR orders and conditions, demonstrating robustness to higher-order auto correlation. A similar pattern w as observ ed for Type I error. PW maintained near-nominal error rates at AR[1] and AR[2] and only mo destly elev ated rates (approximately 10–13%) at AR[3], likely reflecting the finite-sample prop erties of Y ule–W alk er estimation with m ultiple parameters (see App endix 2). OLS-NW, b y con trast, exhibited substan tial and p ersistent inflation across all conditions. Under high p ersistent auto correlation at AR[2] and AR[3], T yp e I error increased monotonically with series length, reaching appro ximately 50% and 57%, resp ectiv ely , at 100 p erio ds. This contrasts with the AR[1] case, where T yp e I error declined with increasing sample size [ 15 ]. These results indicate that longer series do not mitigate the inferential deficiencies of OLS-NW under persistent higher-order auto correlation, but instead exacerbate them. T ak en together, these findings extend the fundamen tal trade-off b etw een p ow er and in- feren tial v alidity observed under AR[1] [ 15 ] and in SG-ITSA [ 14 ]. OLS-NW provides higher p o w er in man y settings, but at the cost of inflated Type I error and p o or cov erage that wors- ens with increasing AR order and, under p ersistent auto correlation, with series length. PW pro vides more reliable inference across nearly all conditions and, under sp ecific higher-order scenarios, achiev es gen uine p ow er adv antages. As rep orted in prior work, these differences arise from v ariance estimation and inferential calibration rather than bias. These results underscore the imp ortance of c haracterizing the auto correlation structure of the data at the study design stage. When auto correlation is mild and p ositiv e, guidance deriv ed studying AR[1] errors largely applies [ 15 ]: PW is preferred when v alid inference is the priority , whereas OLS-NW may b e considered cautiously when maximizing p o wer is the 20 primary ob jective. When auto correlation is oscillatory , b oth metho ds may p erform reason- ably well with sufficiently long series, although PW remains preferable for inference. When auto correlation is strongly p ersisten t, the presen t findings strongly argue against the use of OLS-NW, particularly in studies with mo derate to long series lengths. In these settings, its inferen tial deficiencies are most sev ere and w orsen with increasing time p erio ds. PW is there- fore the clear recommendation. Regardless of the estimator used, researc hers should assess the auto correlation structure, rep ort key design features, and conduct sensitivity analyses to ev aluate the robustness of their findings. The simulation design employ ed here reflects a common MG-ITSA application in health- care researc h: a single treated unit, multiple controls, and a single treatment analyzed using regression-based time-series metho ds. As in prior work [ 15 ], sev eral factors were not con- sidered, including multiple treatments, seasonality , and alternative outcome types. When seasonalit y is present but cannot b e mo deled directly , longer series are generally required, as minim um sample size increases with v ariabilit y , mo del complexity , and seasonal p eri- o dicit y [ 26 ]. The num b er of con trol units was fixed at 4 to maintain comparability with prior w ork and to represent the most v ariable condition examined previously . The impact of v arying the num b er of controls under higher-order autoregressive structures remains an op en question. Although the maximum series length w as extended to 100 p erio ds, some conditions—particularly those inv olving high p ersistent auto correlation—had not stabilized, suggesting that even longer series may b e required to fully characterize asymptotic b ehavior. Sev eral limitations are sp ecific to the higher-order autoregressive setting. The auto corre- lation scenarios examined represent plausible but not exhaustiv e configurations of AR[2] and AR[3] pro cesses. Other parameterizations, particularly near the b oundary of stationarit y , ma y yield different p erformance patterns. In addition, while the praisk implementation fol- lo ws the exact GLS transformation of V ougas [ 16 ], the mo dest elev ation in PW T yp e I error at AR[3] lik ely reflects finite-sample limitations of Y ule–W alker estimation with multiple pa- rameters. The b ehavior of b oth estimators under higher orders (AR[4] and b eyond) remains 21 unkno wn. Finally , only OLS-NW and PW w ere ev aluated due to their widespread use and accessibilit y . F uture w ork should consider alternativ e approaches, including other time-series regression mo dels [ 27 , 28 ], Bay esian frameworks [ 29 ], and machine learning algorithms [ 30 ]. Conclusion This simulation study demonstrated that the fundamental trade-off b et ween statistical p o wer and inferential v alidity rep orted b y Linden [ 15 ] for AR[1] errors p ersists and intensifies at higher-order autoregressiv e error structures in the MG-ITSA design. OLS-NW consisten tly ac hieved higher p o wer than PW in most conditions, but at the cost of substantially inflated T yp e I error and p o or cov erage that worsened with increasing AR order and, under high p ersisten t auto correlation, with increasing series length. PW regression, extended to AR[2] and AR[3] via the exact GLS transformation of V ougas [ 16 ] and implemen ted in the praisk Stata pac k age [ 17 ], pro vided w ell-calibrated inference across virtually all conditions and ac hieved gen uine p o wer adv an tages ov er OLS-NW under sp ecific higher-order auto correlation structures. As under AR[1], both metho ds produced appro ximately un biased estimates, confirming that differences b etw een estimators arise from v ariance estimation and inferen tial prop erties rather than p oint-estimation accuracy . When v alid h yp othesis testing, cov erage, and T yp e I error con trol are primary ob jectiv es, PW is the preferred estimator across AR orders. When auto correlation is strongly p ersistent, the inferen tial deficiencies of OLS-NW are sufficiently severe that its use cannot b e recommended even when p ow er considerations dominate. These findings underscore the imp ortance of characterizing the auto correlation structure of MG-ITSA data at the study design stage and aligning estimator choice with the inferen tial priorities of the study . 22 References [1] Campb ell DT, Stanley JC. Exp erimental and Quasi-Exp erimental Designs for Research. Chicago: Rand McNally; 1966. [2] Shadish WR, Co ok TD, Campb ell DT. Exp erimen tal and Quasi-Exp erimental Designs for Generalized Causal Inference. Boston: Hough ton Mifflin; 2002. [3] Linden A. Assessing regression to the mean effects in health care initiatives. BMC Medical Research Metho dology . 2013;13:119. A v ailable from: https://doi.org/10. 1186/1471- 2288- 13- 119 . [4] Linden A, Y arnold PR. Using machine learning to iden tify structural breaks in single- group interrupted time series designs. Journal of Ev aluation in Clinical Practice. 2016;22:855-9. A v ailable from: https://doi.org/10.1111/jep.12544 . [5] Linden A. Conducting interrupted time-series analysis for single- and multiple-group comparisons. Stata Journal. 2015;15(2):480-500. A v ailable from: https://doi.org/ 10.1177/1536867X1501500208 . [6] Linden A. Challenges to v alidit y in single-group interrupted time series analysis. Journal of Ev aluation in Clinical Practice. 2017;23:413-8. A v ailable from: https://doi.org/ 10.1111/jep.12638 . [7] Linden A. Persisten t threats to v alidity in single-group interrupted time series analysis with a crossov er design. Journal of Ev aluation in Clinical Practice. 2017;23:419-25. A v ailable from: https://doi.org/10.1111/jep.12668 . [8] Abadie A, Diamond A, Hainmueller J. Syn thetic con trol metho ds for comparativ e case studies: Estimating the effect of California’s tobacco control program. Journal of the American Statistical Asso ciation. 2010;105(490):493-505. A v ailable from: https: //doi.org/10.1198/jasa.2009.ap08746 . 23 [9] Linden A. A matching framework to improv e causal inference in in terrupted time-series analysis. Journal of Ev aluation in Clinical Practice. 2018;24:408-15. A v ailable from: https://doi.org/10.1111/jep.12874 . [10] Rubin DB . Estimating causal effects of treatments in randomized and non-randomized studies. Journal of Educational Psychology . 1974;66:688-701. [11] New ey WK, W est KD. A simple, p ositive semi-definite, heterosk edasticity and auto- correlation consistent co v ariance matrix. Econometrica. 1987;55:703-8. A v ailable from: https://doi.org/10.2307/1913610 . [12] Prais SJ, Winsten CB. T rend estimators and serial correlation. Cowles Commission; 1954. 383. A v ailable from: https://cowles.yale.edu/sites/default/files/files/ pub/cdp/s- 0383.pdf . [13] T urner SL, F orb es AB, Karahalios A, T aljaard M, McKenzie JE. Ev aluation of statistical metho ds used in the analysis of in terrupted time series studies: a simulation study . BMC Medical Researc h Metho dology . 2021;21:181. A v ailable from: https://doi.org/ 10.1186/s12874- 021- 01393- 1 . [14] Bottomley C, Ook o M, Gasparrini A, Keogh RH. In praise of Prais–Winsten: an ev aluation of metho ds used to account for auto correlation in interrupted time series. Statistics in Medicine. 2023;42(8):1277-88. A v ailable from: https://doi.org/10.1002/ sim.9547 . [15] Linden A. A djustment for autocorrelation in multiple-group (controlled) interrupted time series analysis and its effect on pow er: a simulation study of the New ey-W est and Prais-Winsten metho ds; 2026. Preprint. Research Square. A v ailable from: https: //doi.org/10.21203/rs.3.rs- 8865851/v1 . [16] V ougas D V. Prais–Winsten algorithm for regression with second or higher order au- 24 toregressiv e errors. Econometrics. 2021;9(3):32. A v ailable from: https://doi.org/10. 3390/econometrics9030032 . [17] Linden A. PRAISK: Stata mo dule for computing iterated Prais-Winsten regression with AR( k ) errors; 2026. Statistical Softw are Comp onen ts s459648, Boston College Depart- men t of Economics. [18] Linden A. A comprehensive set of p ostestimation measures to enrich interrupted time- series analysis. Stata Journal. 2017;17:73-88. A v ailable from: https://doi.org/10. 1177/1536867X1501500208 . [19] Kutner MH, Nach tsheim CJ, Neter J, Li W. Applied Linear Statistical Mo dels. 5th ed. New Y ork: McGraw-Hill Irwin; 2005. [20] Linden A. Erratum: a comprehensiv e set of postestimation measures to enric h in- terrupted time-series analysis. Stata Journal. 2022;22:231-3. A v ailable from: https: //doi.org/10.1177/1536867X221083929 . [21] W o oldridge JM. In tro ductory Econometrics: A Mo dern Approach. 7th ed. Boston: Cengage; 2020. [22] Linden A. POWER_ITSA: Stata mo dule to compute p o wer for single and m ultiple- group in terrupted time series analysis; 2025. Statistical Softw are Comp onents S459461, Boston College Department of Economics. [23] Linden A. ITSADGP: Stata mo dule to generate artificial data for in terrupted time-series analysis; 2024. Statistical Soft ware Comp onen ts S459403, Boston College Departmen t of Economics. [24] Linden A. Po w er considerations for m ultiple-group (controlled) interrupted time series analysis: a comprehensive sim ulation study . Ev aluation & the Health Professions. 2026. Epub ahead of prin t. A v ailable from: https://doi.org/10.1177/01632787261428159 . 25 [25] Burton A, Altman DG, Royston P , Holder RL. The design of simulation studies in medical statistics. Statistics in Medicine. 2006;25:4279-92. A v ailable from: https: //doi.org/10.1002/sim.2673 . [26] Hyndman RJ, Kostenk o A V. Minim um sample size requirements for seasonal forecasting mo dels. F oresight. 2007;6:12-5. [27] Harv ey A C. F orecasting, Structural Time Series Mo dels and the Kalman Filter. Cam- bridge: Cambridge Universit y Press; 1989. [28] Enders W. Applied Econometric Time Series. 2nd ed. Hob ok en, NJ: Wiley; 2004. [29] Ma Y, Benmarhnia T. Interrupted time series analysis in en vironmental epidemiology: a review of traditional and no vel mo deling approac hes. Current En vironmen tal Health Re- p orts. 2025;12:50. A v ailable from: https://doi.org/10.1007/s40572- 025- 00517- 3 . [30] Linden A, Y arnold PR. Using machine learning to ev aluate treatment effects in multiple- group in terrupted time series analysis. Journal of Ev aluation in Clinical Practice. 2018;24:740-4. A v ailable from: https://doi.org/10.1111/jep.12966 . 26 Abbreviations AR: Autoregressive; F GLS: F easible generalized least squares; GLS: Generalized least squares; HA C: Heterosk edasticity- and auto correlation-consistent standard errors; ITSA: In terrupted time series analysis; MG-ITSA: Multiple-group interrupted time series analysis; OLS: Or- dinary least squares; OLS-NW: Ordinary least squares with New ey-W est standard errors; PW: Prais-Winsten regression; RMSE: Ro ot mean squared error; SG-ITSA: Single-group in terrupted time series analysis. Supplemen tary Information The Supplement contains App endices with details of the New ey-W est metho d, Prais-Winsten metho d for higher-order autoregressive structures, Figures, and Stata co de for replicating the simulations. Authors’ Contributions AL conceiv ed the study and its design, conducted all analyses, wrote the man uscript, and tak es public resp onsibility for its conten t. F unding There was no funding asso ciated with this work. Ethics Approv al and Consen t to P articipate Not applicable. 27 Consen t for Publication Not applicable. Comp eting In terests The author declares no comp eting in terests. A c kno wledgements I am grateful to Dimitrios V. V ougas for graciously providing the MA TLAB co de that served as the basis for implementation of the praisk pack age. 28 T able 1: Sim ulation inputs. P arameter Equation (1) term Input v alues Con trols’ baseline level β 0 10 T reated unit’s baseline lev el β 0 + β 4 10 Con trols’ baseline trend β 1 1 T reated unit’s baseline trend β 1 + β 5 1 Con trols’ lev el change β 2 0 T reated unit’s level change β 2 + β 6 2, 2.5, 3 (represen ting 20%, 25%, and 30%) Con trols’ p ost-treatment trend β 1 + β 3 1 T reated p ost-treatment trend β 1 + β 3 + β 5 + β 7 1.25, 1.50, 2 (represen ting 25%, 50%, and 100%) Num b er of time p erio ds 10–100 Initiation of treatment Halfw ay p oin t Num b er of controls 4 Std. dev. for random error term 1 Auto correlation co efficients: AR[2] Scenario 1: ρ = (0 . 4 , 0 . 2) Scenario 2: ρ = (0 . 5 , − 0 . 4) Scenario 3: ρ = (0 . 7 , 0 . 2) AR[3] Scenario 1: ρ = (0 . 4 , 0 . 2 , 0 . 1) Scenario 2: ρ = (0 . 7 , − 0 . 3 , 0 . 15) Scenario 3: ρ = (0 . 6 , 0 . 25 , 0 . 1) Note: F or the sensitivity analysis (combined level and trend changes), the controls’ baseline level is set to 8, the treatmen t unit’s lev el c hange is set to 2 (20% increase), and the treatment unit’s p ost-treatment trend is set to 2 (100% increase). All other v alues are unc hanged. 29 T able 2: Summary comparison of simulation findings across AR[1], AR[2], and AR[3] error structures for OLS-NW and Prais–Winsten regression in controlled interrupted time series analysis. AR[1] results are from Linden [ 15 ]. P erformance Measure AR[1] AR[2] AR[3] P ow er OLS-NW consistently higher than PW across all conditions; differences often exceeding 10–15% OLS-NW higher under mild p ositive and high p ersisten t auto correlation; PW higher for level c hange under oscillatory auto correlation at shorter series; p ow er gap widens under high p ersistent auto correlation relative to AR[1] OLS-NW higher under mild p ositive and oscillatory auto correlation; PW ac hieves a genuine adv an tage for level change under high p ersistent auto correlation at larger effect sizes; gap further widens relative to AR[2]; PW fails to reach 60% p o w er at 100 p erio ds under 25% trend effect 95% Co verage PW maintains near-nominal cov erage ( ∼ 94%); OLS-NW shows stable undercov erage ( ∼ 82–83%) across all conditions, worsening with more controls PW maintains near-nominal cov erage ( ∼ 91–94%); OLS-NW sho ws stable underco verage ( ∼ 75%) under mild auto correlation, and progressiv e monotonic deterioration to ∼ 50% under high p ersistent auto correlation—a pattern not observed at AR[1] PW maintains near-nominal cov erage ( ∼ 91–93%); OLS-NW underco verage worsens to ∼ 65–70% under mild auto correlation and deteriorates even more steeply to ∼ 45–50% under high p ersistent auto correlation—more sev ere than AR[2] T yp e I Error PW near-nominal ( ∼ 5%); OLS-NW inflated ( ∼ 18% a verage; max ∼ 30%), declining with increasing series length PW near-nominal ( ∼ 5%); OLS-NW shows stable inflation ( ∼ 25–30%) under mild auto correlation, partial decline under oscillatory auto correlation, and monotonically increasing inflation reaching ∼ 50% under high p ersistent auto correlation— qualitativ ely different from AR[1] PW mo destly elev ated ( ∼ 10–13%); OLS-NW sho ws stable inflation ( ∼ 28–35%) under mild auto correlation, partial decline under oscillatory auto correlation, and monotonically increasing inflation reaching ∼ 57% under high p ersistent auto correlation—more extreme than AR[2] Continue d on next p age 30 T able 2 c ontinue d P erformance Measure AR[1] AR[2] AR[3] Bias Both metho ds appro ximately unbiased across all conditions; bias decreased with larger effect sizes and longer series Both metho ds appro ximately unbiased across all conditions; minor instability at very short series under oscillatory and high p ersisten t auto correlation Both metho ds appro ximately unbiased across all conditions and series lengths with no instabilit y—cleaner than AR[2] RMSE Appro ximately constant ( ∼ 1.01) for b oth metho ds across all conditions with no meaningful difference b et w een them Lo w and flat ( ∼ 1.0–1.15) for b oth metho ds under mild p ositive and oscillatory auto correlation; rises substan tially and monotonically to ∼ 1.9 at 100 p erio ds under high p ersisten t auto correlation, with PW marginally higher than OLS-NW Lo w and flat ( ∼ 1.0–1.2) for b oth metho ds under mild p ositive and oscillatory auto correlation; rises substan tially and monotonically to ∼ 2.1–2.2 at 100 p erio ds under high p ersisten t auto correlation— somewhat higher than AR[2] Empirical Standard Errors PW consistently ∼ 25% larger than OLS-NW across all conditions; b oth decline with increasing series length PW larger than OLS-NW in most conditions; metho ds conv erge and cross under oscillatory auto correlation for level c hange; PW b ecomes smaller than OLS-NW under high p ersistent auto correlation for level c hange at longer series—consisten t with PW’s p ow er adv antage in that condition PW larger than OLS-NW under mild p ositive and oscillatory auto correlation with the gap p ersisting longer than at AR[2]; PW again smaller than OLS-NW under high p ersisten t auto correlation for level change at longer series—consisten t with PW’s p ow er adv antage in that condition Sensitivit y Analyses Consisten t with main findings across all conditions Consisten t with main findings across all conditions and AR parameter configurations Consisten t with main findings across all conditions and AR parameter configurations; also consistent with AR[2] sensitivit y findings 31 Figure 1: Comparison of Newey-W est and Prais-Winsten metho ds on p o wer for AR[2] error structures for difference-in-differences in trend. Columns represent different effect sizes (25%, 50%, and 100%); rows represent differen t auto correlation scenarios (mild p ositive: ρ = (0 . 4 , 0 . 2) ; oscillatory: ρ = (0 . 5 , − 0 . 4) ; high p ersistent p ositive: ρ = (0 . 7 , 0 . 2) ). 32 Figure 2: Comparison of Newey-W est and Prais-Winsten metho ds on 95% cov erage for AR[2] error structures for difference-in-differences in trend. Columns represent different effect sizes (25%, 50%, and 100%); ro ws represen t different auto correlation scenarios (mild p ositive: ρ = (0 . 4 , 0 . 2) ; oscillatory: ρ = (0 . 5 , − 0 . 4) ; high p ersistent p ositive: ρ = (0 . 7 , 0 . 2) ). Figure 3: Comparison of Newey-W est and Prais-Winsten metho ds on T yp e I error rates for AR[2] error structures for difference-in-differences in trend. Columns represent different auto correlation scenarios (mild p ositive: ρ = (0 . 4 , 0 . 2) ; oscillatory: ρ = (0 . 5 , − 0 . 4) ; high p ersisten t p ositiv e: ρ = (0 . 7 , 0 . 2) ). 33 Figure 4: Comparison of Newey-W est and Prais-Winsten metho ds on p ercen t bias for AR[2] error structures for difference-in-differences in trend. Columns represent different effect sizes (25%, 50%, and 100%); ro ws represen t different auto correlation scenarios (mild p ositive: ρ = (0 . 4 , 0 . 2) ; oscillatory: ρ = (0 . 5 , − 0 . 4) ; high p ersistent p ositive: ρ = (0 . 7 , 0 . 2) ). 34 Figure 5: Comparison of Newey-W est and Prais-Winsten metho ds on ro ot mean squared error (RMSE) for AR[2] error structures for difference-in-differences in trend. Columns represent differen t effect sizes (25%, 50%, and 100%); ro ws represent different auto correlation scenarios (mild p ositive: ρ = (0 . 4 , 0 . 2) ; oscillatory: ρ = (0 . 5 , − 0 . 4) ; high p ersisten t p ositive: ρ = (0 . 7 , 0 . 2) ). 35 Figure 6: Comparison of Newey-W est and Prais-Winsten metho ds on empirical standard errors for AR[2] error structures for difference-in-differences in trend. Columns represent differen t effect sizes (25%, 50%, and 100%); rows represent differen t auto correlation scenarios (mild p ositive: ρ = (0 . 4 , 0 . 2) ; oscillatory: ρ = (0 . 5 , − 0 . 4) ; high p ersistent p ositiv e: ρ = (0 . 7 , 0 . 2) ). 36 Figure 7: Comparison of Newey-W est and Prais-Winsten metho ds on p o wer for AR[3] error structures for difference-in-differences in trend. Columns represent different effect sizes (25%, 50%, and 100%); rows represent differen t auto correlation scenarios (mild p ositive: ρ = (0 . 4 , 0 . 2 , 0 . 1) ; oscillatory: ρ = (0 . 7 , − 0 . 3 , 0 . 15) ; high p ersistent p ositive: ρ = (0 . 6 , 0 . 25 , 0 . 1) ). 37 Figure 8: Comparison of Newey-W est and Prais-Winsten metho ds on 95% cov erage for AR[3] error structures for difference-in-differences in trend. Columns represent different effect sizes (25%, 50%, and 100%); ro ws represen t different auto correlation scenarios (mild p ositive: ρ = (0 . 4 , 0 . 2 , 0 . 1) ; oscillatory: ρ = (0 . 7 , − 0 . 3 , 0 . 15) ; high p ersisten t p ositive: ρ = (0 . 6 , 0 . 25 , 0 . 1) ). Figure 9: Comparison of Newey-W est and Prais-Winsten metho ds on T yp e I error rates for AR[3] error structures for difference-in-differences in trend. Columns represent different auto correlation scenarios (mild p ositive: ρ = (0 . 4 , 0 . 2 , 0 . 1) ; oscillatory: ρ = (0 . 7 , − 0 . 3 , 0 . 15) ; high p ersisten t p ositive: ρ = (0 . 6 , 0 . 25 , 0 . 1) ). 38 Figure 10: Comparison of Newey-W est and Prais-Winsten metho ds on p ercen t bias for AR[3] error structures for difference-in-differences in trend. Columns represent different effect sizes (25%, 50%, and 100%); ro ws represen t different auto correlation scenarios (mild p ositive: ρ = (0 . 4 , 0 . 2 , 0 . 1) ; oscillatory: ρ = (0 . 7 , − 0 . 3 , 0 . 15) ; high p ersisten t p ositive: ρ = (0 . 6 , 0 . 25 , 0 . 1) ). 39 Figure 11: Comparison of Newey-W est and Prais-Winsten metho ds on ro ot mean squared error (RMSE) for AR[3] error structures for difference-in-differences in trend. Columns represent differen t effect sizes (25%, 50%, and 100%); ro ws represent different auto correlation scenarios (mild p ositive: ρ = (0 . 4 , 0 . 2 , 0 . 1) ; oscillatory: ρ = (0 . 7 , − 0 . 3 , 0 . 15) ; high p ersistent p ositive: ρ = (0 . 6 , 0 . 25 , 0 . 1) ). 40 Figure 12: Comparison of Newey-W est and Prais-Winsten metho ds on empirical standard errors for AR[3] error structures for difference-in-differences in trend. Columns represent differen t effect sizes (25%, 50%, and 100%); rows represent differen t auto correlation scenarios (mild p ositive: ρ = (0 . 4 , 0 . 2 , 0 . 1) ; oscillatory: ρ = (0 . 7 , − 0 . 3 , 0 . 15) ; high p ersisten t p ositive: ρ = (0 . 6 , 0 . 25 , 0 . 1) ). 41
Original Paper
Loading high-quality paper...
Comments & Academic Discussion
Loading comments...
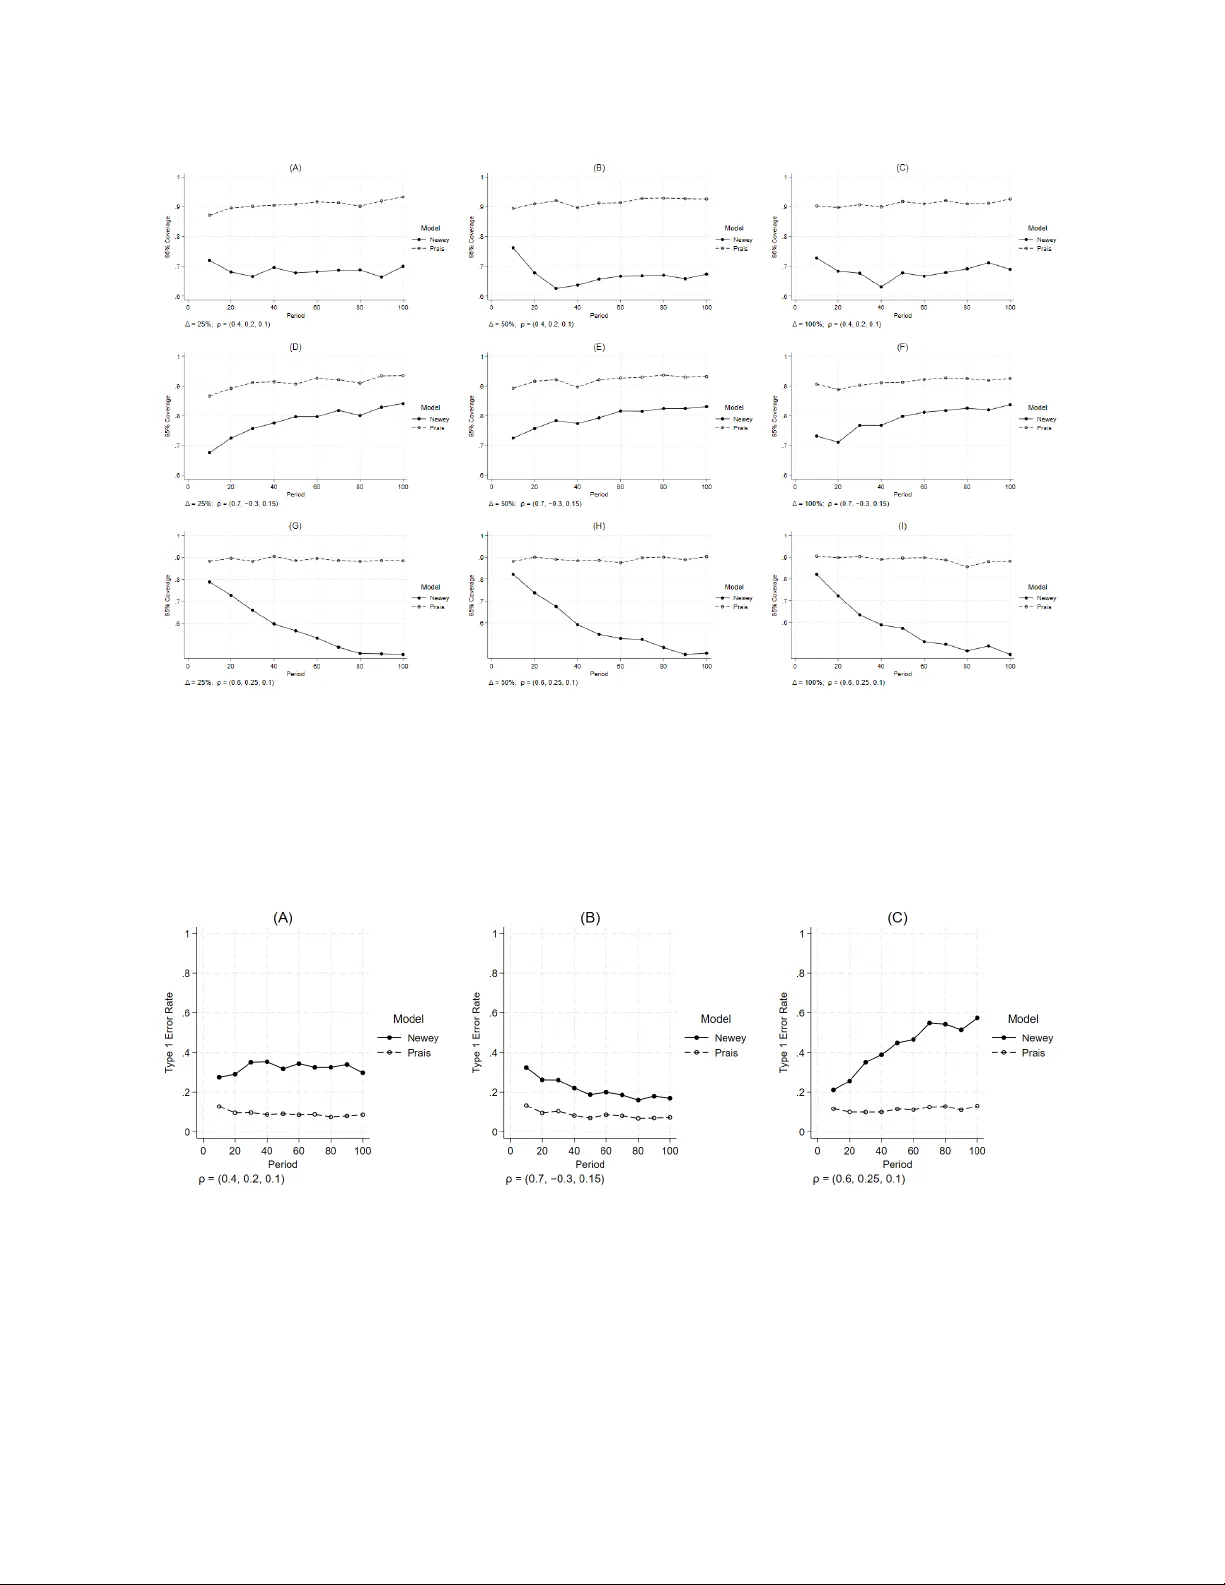
Leave a Comment