Grokking as a Falsifiable Finite-Size Transition
Grokking -- the delayed onset of generalization after early memorization -- is often described with phase-transition language, but that claim has lacked falsifiable finite-size inputs. Here we supply those inputs by treating the group order $p$ of $\…
Authors: Yuda Bi, Chenyu Zhang, Qiheng Wang
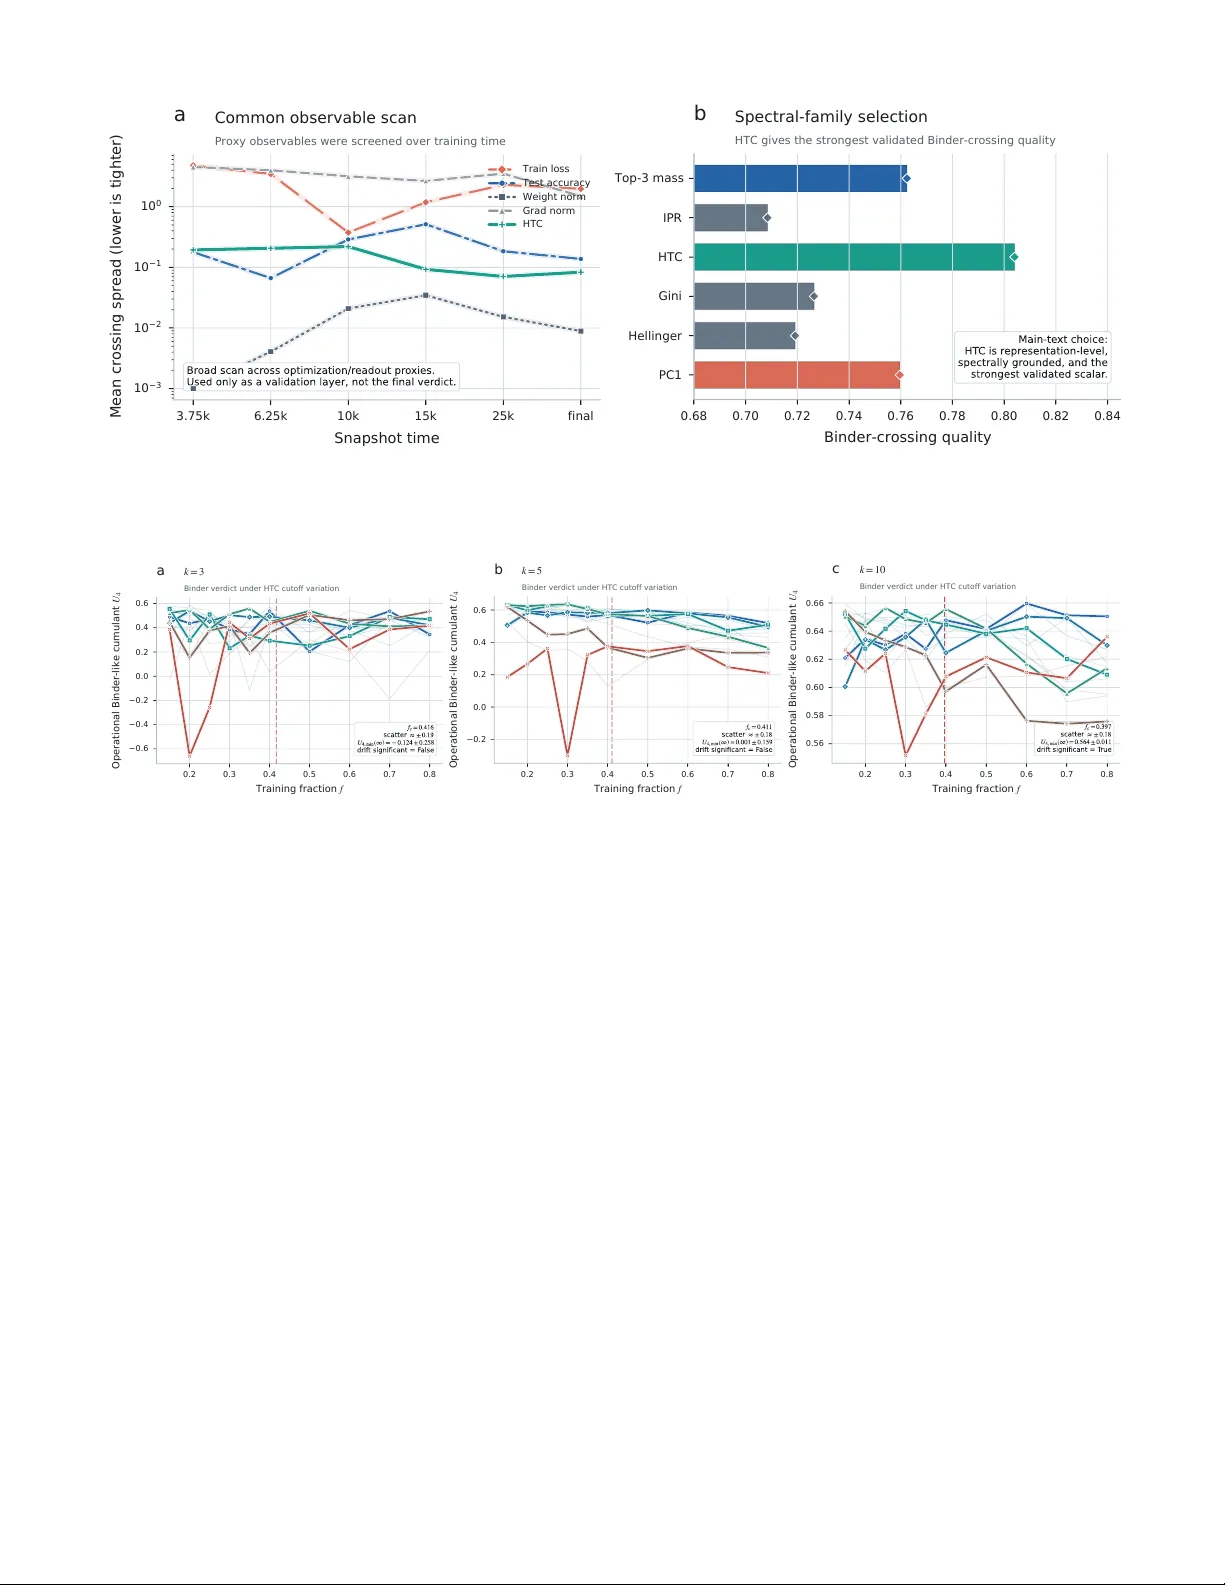
Grokking as a F alsifiable Finite-Size T ransition Y uda Bi, 1 , ∗ Chen yu Zhang, 2 Qiheng W ang, 2 and Vince D Calhoun 3, 1 1 T ri-Institutional Center for T r anslational R esear ch in Neur oimaging and Data Scienc e (TR eNDS Center), Atlanta, Ge or gia 30303, USA 2 Beijing Institute of T e chnology, Beijing 100081, China 3 Ge or gia Institute of T e chnolo gy, Atlanta, Ge or gia 30332, USA Grokking—the dela yed onset of generalization after early memorization—is often described with phase-transition language, but that claim has lack ed falsifiable finite-size inputs. Here w e supply those inputs by treating the group order p of Z p as an admissible extensive v ariable and a held- out sp ectral head–tail contrast as a representation-lev el order parameter, then apply a condensed- matter-st yle diagnostic chain to coarse-grid sw eeps and a dense near-critical addition audit. Binder- lik e crossings reveal a shared finite-size boundary , and susceptibility comparison strongly disfav ors a smo oth-crosso ver in terpretation (∆AIC = 16 . 8 in the near-critical audit). Phase-transition language in grokking can therefore b e tested as a quantitativ e finite-size claim rather than inv oked as analogy alone, although the transition order remains unresolved at present. I. INTR ODUCTION Neural netw orks on mo dular arithmetic tasks often memorize quickly and then generalize only after long optimization, a delay ed phenomenon now widely called gr okking [ 1 – 5 ]. The effect is sharp enough that transi- tion language is now routine: grokking is describ ed as a “phase transition” in which the netw ork reorganizes from a memorizing to a generalizing regime. But steep training curv es observed at a single system size do not b y themselv es constitute a falsifiable finite-size claim. With- out a legitimate size v ariable and an admissible order pa- rameter, the discussion remains descriptive rather than diagnostic. In equilibrium statistical mec hanics, where the same tension b et w een sharp features and genuine singularities arises in any finite system, finite-size scaling (FSS) pro- vides precisely the sequential diagnostic proto col needed to resolve suc h ambiguit y [ 6 – 9 ]. The logic is la y ered: one first identifies a size v ariable and an order parameter, then c hec ks whether Binder cum ulant curv es for differ- en t sizes cross at a common con trol-parameter v alue [ 10 ], then tests whether fluctuation p eaks gro w as a pow er la w rather than saturating, and only then asks ab out transi- tion order. Each lay er has a defined failure mo de, and the c hain can b e rejected at any step. This sequential falsifi- abilit y is what makes FSS a diagnostic to ol rather than a fitting exercise—and what distinguishes it from the common practice in machine-learning studies of fitting a sigmoidal curve to a single training run and declaring a transition—a pro cedure that the FSS literature would regard as necessary but far from sufficient [ 6 , 10 ]. Applying this proto col to learning systems, how ever, requires tw o inputs that are not automatic: an extensive size v ariable and a representation-lev el order parameter. The broader statistical-mechanics-of-learning tradition supplies a ric h v o cabulary of order parameters and scal- ∗ ybi3@gsu.edu ing relations [ 11 – 14 ]. Representation-geometry p ersp ec- tiv es likewise suggest that structured lo w-dimensional ob- serv ables should exist in trained netw orks [ 15 – 22 ], yet neither tradition has assembled these ingredients into a falsifiable finite-size chain for grokking. The usual mac hine-learning scaling v ariables—width, depth, and parameter count—mo ve across model classes rather than along a fixed task family , so they do not supply the con- trolled, single-family size v ariation that FSS requires [ 23 ]. Mean while, readout-level quantities such as training loss and test accuracy do not prob e the in ternal geometry of representations and therefore cannot serve as order parameters in the statistical-mechanics sense. The first obstacle is therefore upstream of any exp onen t fit: sp ec- ifying what to sc ale and what to me asur e . Recen t w ork frames grokking within incompatible ph ysical pictures—mean-field first-order [ 24 ], critical [ 25 – 28 ], mechanistic [ 3 , 29 – 31 ], glass [ 32 ]—but these do not share a common finite-width diagnostic chain, so their claims cannot yet b e compared on common ground. The p oin t, then, is not merely to imp ort Binder curv es in to mac hine learning, but to ask whether delay ed generaliza- tion can b e organized b y the same finite-size logic that distinguishes crossov er from gen uine transition in many- b ody systems. That requires sp ecifying what is b eing enlarged, what is ordering, and what observ ations would coun t as failure of the transition picture. What is missing is therefore not another interpretation but the standard of individually falsifiable links familiar from condensed matter [ 33 – 35 ]. Here we supply the t w o missing inputs for the canonical mo dular-addition b enc hmark. W e treat the group order p of the cyclic group Z p as the size v ariable and a held- out spectral head–tail contrast (HTC) as the order pa- rameter, then apply Binder crossings, susceptibilit y com- parison, and a near-critical audit as a first-lay er finite- size diagnostic proto col. The resulting evidence supports transition-lik e finite-size organization and strongly dis- fa v ors a smo oth-crosso ver interpretation, while leaving transition order, asymptotic exp onen ts, and univ ersal- it y outside the main claim. Section II specifies the tw o 2 iden tifications; Section I I I presents the diagnostic chain; Section IV closes with scop e and implications. I I. SETUP: TWO KEY IDENTIFICA TIONS A. System size: why the group order p Finite-size scaling requires an extensive v ariable that enlarges one con trolled family rather than switching among qualitatively different systems [ 6 , 7 , 36 ]. The group order p is chosen b ecause it indexes the alge- braic task family itself while leaving architecture, opti- mizer, regularization, and logging protocol fixed. Using p 2 w ould merely coun t ordered examples; it w ould not iden tify the family-defining con trol. F or prime groups, Z p remains cyclic for ev ery p , so v arying p enlarges one homogeneous algebraic class rather than introducing sub- group structure from composite mo duli. In this sense p is not a literal spatial length, but it is the admissible extensiv e v ariable the netw ork must resolve: the n um- b er of distinct group elements sets b oth the classifica- tion space and the combinatorial resolution demanded of the learned represen tation. This is precisely the quan- tit y that grows while the learning system itself is held fixed. W e do not claim that p is the only conceiv able scaling v ariable, only that it preserv es the task family while av oiding mo del-class changes that would arise in width-, depth-, or parameter-count sweeps. The present claim is therefore finite-size diagnostics on a fixed alge- braic task family , not a literal thermo dynamic-limit the- orem for arbitrary architectures. An imp ortan t ca veat is that the arc hitecture is held fixed at d model = 128: if p were taken far b eyond the present range, one would exp ect task extent and mo del capacity to comp ete, so the relev ant b ottlenec k could shift. Empirically , the ex- plored prime range is broad enough that sharp ening and near-common Binder crossings organize coherently when plotted against p , which is the consistency chec k one w ould w ant from an admissible finite-size con trol (Figs. 1 and 2 ). A t fixed ( p, f , op), the train/ev al/prob e partition is generated once from a task-level data seed and shared across all training seeds, so Binder and susceptibility fluc- tuations prob e initialization and optimization v ariability at fixed task instance. B. Order parameter: why sp ectral head-tail con trast The sp ectral head-tail contrast is defined as m HTC ( t ) = log P 5 j =1 p j ( t ) P d j =6 p j ( t ) ! , (1) where p j ( t ) = λ j ( t ) / P k λ k ( t ) are normalized eigen v al- ues of the prob e-set cov ariance matrix C t of hidden rep- resen tations z t ∈ R d . In implementation, a tiny sta- bilizer ε = 10 − 10 is added to numerator and denomi- nator for numerical safet y at extreme sp ectral concen- tration. A representation-lev el observ able is needed b e- cause grokking is not merely a late change in readout accuracy; it is accompanied by a reorganization of in- ternal geometry . Readout-level quan tities such as train- ing loss and test accuracy are therefore useful diagnos- tics but not natural order parameters for the statistical- mec hanics question p osed here [ 37 , 38 ]. Prior mechanistic w ork on modular arithmetic suggests that grokking is ac- companied b y reorganization of that in ternal geometry— from diffuse or memorization-sp ecific activ ations to struc- tured F ourier representations—not merely a late change in readout accuracy [ 3 , 31 , 39 ]. A t eac h logged c hec k- p oin t, the mo del is ev aluated on the held-out prob e sub- set, the mean-po oled p en ultimate represen tations are col- lected and centered, and their cov ariance matrix is di- agonalized; the normalized eigenv alues then define the sp ectral masses en tering the HTC definition. When the sp ectrum is diffuse, head and tail masses are compara- ble and m HTC is small; when a few mo des separate from the bulk, m HTC gro ws. HTC is therefore not introduced as a classifier of phases, but as a compact scalar prob e of whether sp ectral mass remains distributed across the co v ariance bulk or condenses into a small leading sec- tor. The log-ratio form keeps that prob e unbounded, so strongly ordered runs are not artificially compressed in to a saturating score, in the spirit of lo w-dimensional observ ables that summarize collective reorganization in high-dimensional systems [ 8 , 40 , 41 ]. F ourier-mo de am- plitudes are mechanistically informative, but they pre- supp ose a task-sp ecific basis and a more explicit cir- cuit story . HTC instead compresses the same represen- tational reorganization into a held-out cov ariance-level scalar that remains basis-agnostic and directly compati- ble with finite-size diagnostics. The c hoice k = 5 is op- erational rather than metaph ysic al: it separates a small leading sector from the cov ariance bulk in the present represen tation dimension, while Appendix Fig. 5 shows that k = 3 preserv es the same diagnostic verdict and k = 10 weak ens the separation. Screening across alter- nativ e observ ables (App endix Fig. 4 ) is therefore used as v alidation, not as tuning to maximize crossings. C. Exp erimen tal proto col All results use one fixed T ransformer family: d model = 128, tw o enco der la yers, four atten tion heads, feedfor- w ard dimension 512, pre-La yerNorm architecture, no drop out, and mean p o oling ov er the sequence dimension as the readout. Optimization is lik ewise fixed through- out: AdamW with learning rate 5 × 10 − 4 , weigh t decay 1 . 0, batch size 512, and observ ables logged ev ery 25 steps up to 40 , 000 training steps. The full dataset for each mo dular task consists of all p 2 ordered pairs in Z p × Z p ; at fixed ( p, f ), the first ⌊ f p 2 ⌋ examples form the training 3 0.2 0.3 0.4 0.5 0.6 0.7 0.8 T r a i n i n g f r a c t i o n f 4 5 6 7 8 9 10 11 F i n a l m H T C a Raw order-parameter curves All 13 primes; canonical addition case 0.25 0.30 0.35 0.40 0.45 0.50 0.55 T r a i n i n g f r a c t i o n f 4 5 6 7 8 9 10 11 F i n a l m H T C b Transition region Larger primes compress the window into a sharper boundary 75 100 125 150 175 200 225 250 P r i m e p FIG. 1. Raw sp ectral order-parameter curves for the canonical addition task. Panel A shows m HTC v ersus training fraction f for all 13 coarse-grid primes; Panel B zooms the transition region around the shared crossing in this first diagnostic step. The ordering structure sharp ens monotonically with p . set, a disjoint prob e subset (capp ed at 7 , 600 examples) is reserv ed for representation geometry , and the remainder serv es as the held-out ev aluation set. This split is gen- erated once per condition and shared across all seeds, so the seed ensemble prob es initialization and optimization v ariabilit y at fixed task instance rather than rep eated repartitioning. The coarse sweep is the broad evidence base: 13 primes, 10 training fractions, and 50 seeds p er condition on each op eration, supplemented b y a contex- tual phase map and F ourier prob e. The near-critical ad- dition sw eep is an audit rather than a discov ery run: it re-queries the same diagnostic chain on 6 larger primes and 11 closely spaced fractions, with the same mo del, op- timizer, split logic, and observ able definition. Addition is emphasized not b ecause subtraction or multiplication fail, but b ecause it is the cleanest algebraic benchmark in which the finite-size inputs can first b e tested with- out extra complication; the other op erations remain sup- p orting chec ks (Appendix A ). All main-text summaries are stationary-window measurements of the final regime rather than arbitrary snapshots from the training tra jec- tory . I II. RESUL TS: TRANSITION DIA GNOSTICS The coarse evidence base for the canonical addition task consists of 13 primes, 10 training fractions, and 50 seeds p er condition, while the near-critical follo w-up adds 6 larger primes and 11 closely spaced fractions under the same proto col. The first sweep supplies broad finite-size co v erage; the second re-queries the same diagnostics in the transition region. The diagnostic chain pro ceeds in order of increasing stringency: ra w sharp ening, crossing consistency , crosso ver rejection, and transition-order as- sessmen t. A. Ra w sharp ening The simplest finite-size observ ation is that the final sp ectral order parameter sharp ens systematically with system size. Figure 1 sho ws m HTC ( f , p ) for the canonical addition case across all 13 primes. At small p , the transi- tion from lo w to high sp ectral concen tration is broad. As p increases, the same transition sharp ens and lo calizes near a common fraction, which is the exp ected finite-size precursor of a sharp phase b oundary . The largest primes do not merely shift up w ard; they compress the transi- tion window itself, pro ducing a visibly steep er turnov er in the same low- f neighborho o d. No rescaling or fitting is applied: the size-resolv ed ordering is eviden t in the ra w data. B. Binder crossing The central finite-size diagnostic is the Binder-like cu- m ulan t [ 10 ], U 4 ( f , p ) = 1 − ⟨ m 4 HTC ⟩ 3 ⟨ m 2 HTC ⟩ 2 , (2) where the av erage is taken ov er seeds at fixed ( f , p ). Because HTC is p ositiv e-definite and lacks Z 2 symme- try , U 4 functions as a Binder-lik e cum ulant rather than a symmetric-magnetization ratio. What is lost is the usual symmetric-order-parameter plateau interpretation, not the fixed-p oin t logic itself: once an observ able ob eys a single-parameter finite-size form, dimensionless moment ratios remain v alid crossing diagnostics even for asym- metric p ositiv e observ ables [ 8 , 10 ]. Its role here is there- fore op erational and narrow: the Binder-lik e ratio tests common finite-size organization through crossings, not 4 0.2 0.3 0.4 0.5 0.6 0.7 0.8 T r a i n i n g f r a c t i o n f −0.2 0.0 0.2 0.4 0.6 O p e r a t i o n a l B i n d e r - l i k e c u m u l a n t U 4 a Binder-like crossing System-size crossing identifies a common boundary 0.0000 0.0025 0.0050 0.0075 0.0100 0.0125 0.0150 0.0175 0.0200 1 / m i n ( p i , p j ) 0.2 0.3 0.4 0.5 0.6 0.7 0.8 P a i r w i s e c r o s s i n g e s t i m a t e f i j b Crossing drift Selected dominant branch shows no significant drift with size 0.0000 0.0025 0.0050 0.0075 0.0100 0.0125 0.0150 0.0175 0.0200 1 / p −0.2 0.0 0.2 0.4 0.6 U 4 , m i n c Binder-minimum trend Large-size dip requires an explicit order-of-transition audit 1 0 2 6 × 1 0 1 2 × 1 0 2 P r i m e p 4 × 1 0 2 5 × 1 0 2 6 × 1 0 2 7 × 1 0 2 P e a k s u s c e p t i b i l i t y χ m a x d Susceptibility model comparison Power-law scaling is preferred over saturation Power law Saturation FIG. 2. Binder-based diagnostics for the canonical addition task. Panel A: Binder-like cum ulant curves cross near a common fraction. Panel B: all pairwise crossing estimates are shown, with the selected dominant branch highlighted for the drift fit; that branch shows no significant linear drift versus inv erse size. Panel C: the coarse-grid Binder minimum is contin uity-leaning but metho d-dependent, motiv ating the near-critical stress test in Fig. 3 A. Panel D: susceptibilit y model comparison fav ors p o wer-la w scaling ov er the minimal saturating null, disfav oring a smo oth-crosso ver interpretation. univ ersal plateau v alues for a symmetry-restored order parameter. Figure 2 summarizes the Binder-based evidence chain for addition. P airwise crossings are estimated by simple in terp olation and summarized on the dominant branch of the crossing region rather than by indiscriminately a v- eraging ev ery sign c hange; on the coarse grid they cluster around f c ≈ 0 . 39 , (3) with no statistically significant linear drift versus inv erse size under bo otstrap regression. The main v erdict is that a shared crossing p ersists across sizes. That is stronger evidence than generic sharp ening alone b ecause it indi- cates a common organizing b oundary rather than merely steep er size-sp ecific turno v er p oin ts. C. Rejecting smo oth crossov er A smo oth crossov er, in the FSS sense, is a transition- lik e feature that remains rounded and finite ev en in the thermo dynamic limit: the susceptibility saturates, the Binder cumulan t do es not develop a size-indep enden t crossing, and no singular behavior emerges as p → ∞ . The next diagnostic tests whether the observed sharp en- ing is b etter describ ed as a finite-size transition or such a smooth crossov er. The susceptibility is defined from HTC fluctuations across seeds as χ ( f , p ) = n s V ar[ m HTC ( f , p )] , (4) where n s is the num b er of seeds at fixed ( f , p ). Here n s is the ensemble size of random initializations, so χ should b e read as an op erational fluctuation susceptibil- it y across seeds rather than as a literal thermodynamic resp onse. The model comparison b elo w is ab out whether the p eak grows or saturates with p , and that div ergence- v ersus-plateau verdict do es not dep end on this ov erall prefactor conv ention. In standard FSS, the order pa- rameter near a contin uous transition ob eys m ( f , p ) = p − β /ν F ( f − f c ) p 1 /ν , and the susceptibility p eak scales as χ max ∝ p γ /ν . The presen t analysis tests the second re- lation directly; extracting β /ν via data collapse remains unreliable on the current grid (App endix B ). Two com- p eting models of the p eak susceptibility are compared: 5 0.000 0.001 0.002 0.003 0.004 0.005 0.006 0.007 1 / p −1.5 −1.0 −0.5 0.0 0.5 1.0 U 4 , m i n a Near-critical Binder trend Dense follow-up sharpens the boundary but deepens the minimum Coarse grid Near-critical 0 2 4 6 8 10 12 F i n a l m H T C 0.0 0.1 0.2 0.3 0.4 0.5 Seed density b Seed-level distributions Largest-size HTC remains unimodal despite negative Binder tension p = 3 0 7 , f = 0 . 4 2 p = 3 9 7 , f = 0 . 4 0 FIG. 3. Near-critical follow-up for the addition task. (A) Binder-minim um extrap olation on b oth grids. The coarse grid (op en symbols, p ≤ 251) extrap olates tow ard zero; the near-critical grid (filled symbols, p up to 397) develops a negative trend. (B) Seed-lev el HTC distributions at represen tative near-critical p oin ts for the tw o largest primes ( p = 307 , f = 0 . 42 and p = 397 , f = 0 . 40). Both distributions remain unimo dal and do not pro vide clean evidence of first-order co existence despite the negativ e Binder minimum at the largest size. a p o wer-la w form χ max ∝ p γ /ν (singular, transition- consisten t) versus a saturating form χ max ∝ 1 − e − bp (smo oth crossov er), each with k = 2 free parameters. The saturating form represents the exp ectation for a smo oth crossov er, in whic h the susceptibility approaches a finite thermo dynamic limit rather than diverging: a system with a broad but non-singular transition would pro duce a p eak height that plateaus at large p rather than gro wing without bound. The key requirement for a fair comparison is equal parameter coun t, so that the AIC dif- ference is not biased by mo del complexity . The resulting comparison is therefore a test against a simple saturating n ull, not an exhaustive census of every p ossible crosso v er ansatz. Mo del comparison uses AIC = n log(SS /n ) + 2 k . Figure 2 D sho ws that this comparison fa vors the singular description ov er crossov er, with ∆AIC = 11 . 4 , (5) in fav or of the pow er-law form. On standard information- criterion scales, this is substan tial supp ort against the saturating alternative on the presen t grid. This coarse-grid result already disfav ors the smo oth-crosso ver n ull; the near-critical follow-up in Section I II D 2 will strengthen the verdict to ∆AIC = 16 . 8, motiv ating a separate transition-order prob e. The result is therefore a transition-lik e, non-crossov er verdict; whether that tran- sition is contin uous or w eakly first-order is a separate question. D. T ransition order The Binder crossing establishes the existence of a finite-size transition; determining whether that tran- sition is con tin uous or first-order requires separate diagnostics—sp ecifically , the b eha vior of the Binder min- im um at large sizes and the seed-lev el distribution shape. 1. Co arse-grid assessment On the coarse grid, Binder-minim um extrapolation— linear regression of U 4 , min against 1 /p , with uncertain t y from 2 , 000 b ootstrap resamples—gives U 4 , min ( p → ∞ ) = 0 . 0006 ± 0 . 1574, near zero within present uncertain t y , leaning tow ard contin uity but inconclusive. 2. Ne ar-critic al str ess test A dense follo w-up at p ∈ { 149 , 179 , 211 , 251 , 307 , 397 } and f ∈ { 0 . 36 , . . . , 0 . 46 } (50 seeds each) re-queries the same diagnostic c hain at larger sizes and finer fraction spacing. On that denser grid, the crossing spread nar- ro ws from 0 . 057 to 0 . 019 and the case against the satu- rating null strengthens to ∆AIC = 16 . 8. Only then do es the order-sp ecific signal change: the t w o largest primes dev elop negative Binder minima, U 4 , min ( p → ∞ ) = − 0 . 67 ± 0 . 11 , (6) as sho wn in Fig. 3 A. That is a first-order-lik e ten- sion, not a final order verdict: seed-lev el HTC distribu- tions (Fig. 3 B) remain unimo dal and do not show clean co existence-lev el bimo dalit y under kernel-densit y and gap-based diagnostics (App endix B ). The near-critical audit therefore sharp ens the transition verdict while com- plicating the order verdict: it strengthens the locator and the non-crossov er rejection while leaving the transition order unresolved. T able I collects b oth grids. 6 T ABLE I. Summary of FSS diagnostics for canonical addition. Diagnostic Coarse grid Near-critical f c 0 . 390 0 . 418 Crossing spread 0 . 057 0 . 019 Crossing drift not significant not significan t ∆AIC (vs. crossov er) 11 . 4 16 . 8 U 4 , min ( p → ∞ ) 0 . 001 ± 0 . 157 − 0 . 67 ± 0 . 11 Seed bimo dalit y — absen t T ransition interpretation supp orted strengthened Smo oth crosso ver null disfa vored strongly disfav ored T ransition order con tinuit y-leaning unresolv ed The contextual phase-map role is given in App endix Fig. 6 ; it supp orts the same control-parameter framing but is not part of the primary verdict c hain. IV. DISCUSSION AND CONCLUSION The present results establish a narro wer but sharp er statemen t than a full critical-phenomena closure. In the canonical mo dular-addition setting, the group order p acts as an admissible finite-size con trol, HTC acts as a represen tation-lev el order parameter, Binder-like cross- ings organize at a common b oundary , and susceptibil- it y strongly disfav ors the minimal smo oth-crosso v er null. The claim is diagnostic rather than metaphysical: it w ould ha v e failed had the curves not sharp ened with p , had the cross in gs drifted systematically , had susceptibil- it y fav ored saturation, or had the near-critical audit dis- solv ed the shared crossing structure. What is not y et established is the transition or- der. Coarse-grid Binder minima are contin uity-leaning, whereas the near-critical audit develops negativ e minima at the largest sizes. That first-order-like tension do es not y et close the case b ecause the same audit do es not show co existence-lev el seed bimo dalit y . The larger-size follow- up therefore strengthens the transition verdict while com- plicating, rather than settling, the order verdict. These results help lo cate prior interpretations without collapsing them in to one final picture. Rubin et al. [ 24 ] motiv ate first-order exp ectations in a mean-field limit; our largest-size negativ e Binder minima keep that p ossi- bilit y alive, but the present finite-width data do not yet sho w coexistence. Zhang et al. [ 32 ] emphasize slow glassy relaxation; here the com bination of shared crossings, non- crosso v er susceptibilit y , and size-dependent sharp ening is more naturally organized by a finite-size transition pic- ture than by generic slo wdo wn alone. More broadly , phase-transition claims in learning should b e judged b y admissible finite-size controls, represen tation-lev el observ ables, and explicit failure cri- teria, not by sharp curves alone. The present verdict is therefore inten tionally scop ed to one fixed T ransformer family on canonical modular addition; dep endence on ar- c hitecture, asymptotic exp onen ts, and univ ersalit y across op erations remains op en. What is established is the first- la y er diagnostic claim: grokking in this setting admits finite-size organization that is transition-like and not well describ ed by a smo oth crossov er. What is not estab- lished is the final transition order or a stable univ ersalit y class. The broader contribution is to turn a widely used metaphor into a quantitativ e claim that can succeed or fail. D A T A A V AILABILITY T raining code, analysis scripts, and processed results are a v ailable in the shared pro ject rep ository . Raw train- ing histories ( ∼ 42 GB) are av ailable up on request. [1] A. Po wer, Y. Burda, H. Edwards, I. Babuschkin, and V. Misra, Grokking: Generalization b ey ond ov er- fitting on small algorithmic datasets, arXiv preprin t arXiv:2201.02177 (2022). [2] Z. Liu, E. J. Michaud, and M. T egmark, Omnigrok: Grokking b ey ond algorithmic data, in The Eleventh International Confer enc e on L e arning R epr esentations (2023). [3] N. Nanda, L. Chan, T. Lieb erum, J. Smith, and J. Stein- hardt, Progress measures for grokking via mec hanistic in- terpretabilit y , in The Eleventh International Confer enc e on L e arning R epr esentations (2023). [4] J. Lee, B. G. Kang, K. Kim, and K. M. Lee, Grokfast: Accelerated grokking b y amplifying slow gradien ts, arXiv preprin t arXiv:2405.20233 (2024). [5] A. I. Humayun, R. Balestriero, and R. Baraniuk, Deep net works alw a ys grok and here is why , in Pr o c e e dings of the 41st International Confer enc e on Machine L e arn- ing , Proceedings of Machine Learning Research, V ol. 235 (PMLR, 2024) pp. 20722–20745. [6] M. E. Fisher and M. N. Barb er, Scaling theory for finite- size effects in the critical region, Physical Review Letters 28 , 1516 (1972) . [7] V. Privman, Finite-size scaling theory , in Finite Size Sc aling and Numeric al Simulation of Statistic al Systems , edited by V. Privman (W orld Scientific, 1990) pp. 1–98. [8] N. Goldenfeld, L e ctur es on Phase T r ansitions and the R enormalization Gr oup (Addison-W esley , 1992). [9] H. E. Stanley , Intro duction to Phase T r ansitions and Critic al Phenomena (Oxford Universit y Press, 1971). [10] K. Binder, Finite size scaling analysis of Ising mo del blo c k distribution functions, Zeitschrift f ¨ ur Physik B Condensed Matter 43 , 119 (1981). [11] A. Engel and C. V an den Bro ec k, Statistic al Me chanics of L e arning (Cambridge Universit y Press, 2001). [12] Y. Bahri, J. Kadmon, J. Pennington, S. S. Schoenholz, J. Sohl-Dickstein, and S. Ganguli, Statistical mec hanics of deep learning, Ann ual Review of Condensed Matter 7 Ph ysics 11 , 501 (2020) . [13] A. Canatar, B. Bordelon, and C. Pehlev an, Statistical mec hanics of contin ual learning: V ariational principle and mean-field potential, Physical Review E 108 , 014309 (2023) . [14] L. Ziyin and M. Ueda, Zeroth, first, and second-order phase transitions in deep neural net w orks, Physical Re- view Researc h 5 , 043243 (2023) . [15] N. Tishb y and N. Zaslavsky , Deep learning and the in- formation b ottlenec k principle, in 2015 ie e e information the ory workshop (itw) (Ieee, 2015) pp. 1–5. [16] A. M. Saxe, Y. Bansal, J. Dapello, M. Adv ani, A. Kolchinsky , B. D. T racey , and D. D. Cox, On the information b ottlenec k theory of deep learning, Journal of Statistical Mechanics: Theory and Exp erimen t 2019 , 124020 (2019) . [17] C. Stringer, M. Pac hitariu, N. Steinmetz, M. Carandini, and K. D. Harris, High-dimensional geometry of p opula- tion responses in visual cortex, Nature 571 , 361 (2019). [18] A. Ansuini, A. Laio, J. H. Mac ke, and D. Zoccolan, In- trinsic dimension of data represen tations in deep neural net works, in A dvanc es in Neural Information Pro c essing Systems , V ol. 32 (2019). [19] S.-i. Amari, Information ge ometry and its applic ations , V ol. 194 (Springer, 2016). [20] C. F efferman, S. Mitter, and H. Nara yanan, T esting the manifold h ypothesis, Journal of the American Mathemat- ical Society 29 , 983 (2016). [21] J. A. Gallego, M. G. Peric h, L. E. Miller, and S. A. Solla, Neural manifolds for the con trol of mo vemen t, Neuron 94 , 978 (2017). [22] P . Gao and S. Ganguli, On simplicit y and complexit y in the brav e new world of large-scale neuroscience, Current opinion in neurobiology 32 , 148 (2015). [23] J. Kaplan, S. McCandlish, T. Henighan, T. B. Brown, B. Chess, R. Child, S. Gra y , A. Radford, J. W u, and D. Amo dei, Scaling laws for neural language mo dels, arXiv preprin t arXiv:2001.08361 (2020). [24] N. Rubin, I. Seroussi, and Z. Ringel, Grokking as a first order phase transition in tw o lay er netw orks, in Interna- tional Confer enc e on L e arning Repr esentations (ICLR) (2024). [25] B. ˇ Zunk ovi ˇ c and E. Ilievski, Grokking phase transitions in learning local rules with gradien t descent, Journal of Mac hine Learning Research 25 , 1 (2024). [26] Z. Liu, O. Kitouni, N. S. Nolte, E. J. Michaud, M. T egmark, and M. Williams, T o wards understanding grokking: An effective theory of representation learning, in Advanc es in Neural Information Pr o c essing Systems , V ol. 35 (2022) pp. 34651–34663. [27] K. Clau w, S. Stramaglia, and D. Marinazzo, Information- theoretic progress measures reveal grokking is an emer- gen t phase transition, arXiv preprint 10.48550/arXiv.2408.08944 (2024), iCML 2024 Mecha- nistic In terpretabilit y W orkshop. [28] B. DeMoss, S. Sap ora, J. F o erster, N. Haw es, and I. Pos- ner, The complexit y dynamics of grokking, Physica D: Nonlinear Phenomena 482 , 134859 (2025) . [29] W. Merrill, N. Tsilivis, and A. Shukla, A tale of tw o cir- cuits: Grokking as comp etition of sparse and dense sub- net works, in ICLR 2023 Workshop on Mathematic al and Empiric al Understanding of F oundation Mo dels (2023). [30] K. Lyu, J. Jin, Z. Li, S. S. Du, J. D. Lee, and W. Hu, Dic hotomy of early and late phase implicit biases can pro v ably induce grokking, in The Twelfth International Confer enc e on L e arning R epresentations (2024). [31] B. Chugh tai, L. Chan, and N. Nanda, A toy model of univ ersality: Reverse engineering ho w neural netw orks learn group op erations, arXiv preprin t (2023). [32] X. Zhang, Y. Shang, E. Y ang, and G. Zhang, Is grokking a computational glass relaxation?, arXiv preprint arXiv:2505.11411 10.48550/arXiv.2505.11411 (2025). [33] J. P . Sethna, Statistical me chanics: entr opy, or der p a- r ameters, and c omplexity , V ol. 14 (Oxford Universit y Press, 2021). [34] L. D. Landau and E. M. Lifshitz, Statistic al Physics: V ol- ume 5 , V ol. 5 (Elsevier, 2013). [35] Y. Bahri, E. Dy er, J. Kaplan, J. Lee, and U. Sharma, Ex- plaining neural scaling laws, Pro ceedings of the National Academ y of Sciences 121 , e2311878121 (2024). [36] J. L. Cardy , Finite-size scaling, Current Physics–Sources and Commen ts 2 , 1 (1988). [37] C. H. Martin and M. W. Mahoney , Implicit self- regularization in deep neural netw orks: Evidence from random matrix theory and implications for learning, Journal of Machine Learning Research 22 , 1 (2021). [38] M. M. Churc hland, B. M. Y u, J. P . Cunningham, L. P . Sugrue, M. R. Cohen, G. S. Corrado, W. T. Newsome, A. M. Clark, P . Hosseini, B. B. Scott, et al. , Stim ulus onset quenches neural v ariability: a widespread cortical phenomenon, Nature neuroscience 13 , 369 (2010). [39] V. Pap yan, X. Han, and D. L. Donoho, Prev alence of neural collapse during the terminal phase of deep learn- ing training, Pro ceedings of the National Academy of Sci- ences 117 , 24652 (2020). [40] B. B. Mach ta, R. Chachra, M. K. T ranstrum, and J. P . Sethna, P arameter space compression underlies emergent theories and predictive models, Science 342 , 604 (2013). [41] E. Ott and T. M. An tonsen, Lo w dimensional b eha vior of large systems of globally coupled oscillators, Chaos: An In terdisciplinary Journal of Nonlinear Science 18 (2008). [42] L. Prieto, M. Barsb ey , P . A. M. Mediano, and T. Birdal, Grokking at the edge of n umerical stabilit y , arXiv preprin t arXiv:2501.04697 10.48550/arXiv.2501.04697 (2025). [43] P . J. T. Notsaw o, H. Zhou, M. Pezeshki, I. Rish, and G. Dumas, Predicting grokking long before it happens: A lo ok into the loss landscape of mo dels which grok, in ICLR 2024 Workshop on Mathematic al and Empiric al Understanding of F oundation Mo dels (2024). [44] T. N. P . Junior, G. Dumas, and G. Rabusseau, Grokking b ey ond the euclidean norm of mo del parameters, in Pr o- c e e dings of the 42nd International Confer enc e on Ma- chine L e arning , Pro ceedings of Machine Learning Re- searc h, V ol. 267 (PMLR, 2025) pp. 28552–28618. [45] J. J. Hopfield, Neural netw orks and physical systems with emergen t collective computational abilities., Pro ceedings of the national academy of sciences 79 , 2554 (1982). [46] O. Roy and M. V etterli, The effectiv e rank: A measure of effective dimensionality , in 2007 15th Eur op e an signal pr o c essing c onfer enc e (IEEE, 2007) pp. 606–610. [47] T. M. Cov er, Elements of information the ory (John Wi- ley & Sons, 1999). [48] E. T. Jaynes, Information theory and statistical mechan- ics, Ph ysical review 106 , 620 (1957). [49] H. Li, Z. Xu, G. T aylor, C. Studer, and T. Goldstein, Visualizing the loss landscap e of neural nets, Adv ances 8 in neural information pro cessing systems 31 (2018). [50] F. Draxler, K. V eschgini, M. Salmhofer, and F. Ham- prec ht, Essentially no barriers in neural netw ork energy landscap e, in International c onfer enc e on machine le arn- ing (PMLR, 2018) pp. 1309–1318. [51] S. F ort and S. Jastrzebski, Large scale structure of neural net work loss landscap es, in A dvanc es in Neur al Informa- tion Pr o c essing Systems , V ol. 32 (2019). [52] A. Jacot, F. Gabriel, and C. Hongler, Neural tangen t k er- nel: Conv ergence and generalization in neural netw orks, Adv ances in neural information pro cessing systems 31 (2018). [53] R. Shw artz-Ziv and N. Tish b y , Op ening the black box of deep neural netw orks via information, arXiv preprint arXiv:1703.00810 (2017). App endix A: Exp erimen tal Details 1. Exp erimen tal proto col All main-text results use one fixed mo del family: a t w o-tok en T ransformer with embedding width 128, tw o enco der la yers, four atten tion heads, learned p ositional em b eddings, and a linear deco der ov er Z p classes. Op- timization is held fixed as well: AdamW, learning rate 5 × 10 − 4 , weigh t decay 1 . 0, batch size 512, ev aluation batc h size 4096, and training for up to 40 , 000 steps with observ ables logged every 25 steps. The coarse finite-size sweep spans the prime set p ∈ { 53 , 59 , 67 , 79 , 89 , 97 , 107 , 113 , 127 , 149 , 179 , 211 , 251 } and the training-fraction grid f ∈ { 0 . 15 , 0 . 20 , 0 . 25 , 0 . 30 , 0 . 35 , 0 . 40 , 0 . 50 , 0 . 60 , 0 . 70 , 0 . 80 } , with 50 seeds p er condition. The near-critical follo w-up is addition-only and uses p ∈ { 149 , 179 , 211 , 251 , 307 , 397 } with f ∈ { 0 . 36 , 0 . 37 , . . . , 0 . 46 } , again with 50 seeds pe r condition. Because the mo del, optimizer, and logging cadence are unchanged b et w een the tw o sweeps, the near-critical study functions as a stress test of the same diagnostic sequence rather than as a new system. Addition is treated as the canonical case b ecause it is the algebraically simplest and historically standard grokking b enc hmark, while subtraction and multiplication are retained as supp orting chec ks rather than as the basis for a universalit y claim. 2. Data partition and prob e construction F or eac h mo dular task, the full dataset consists of all ordered input pairs in Z p × Z p , so the total p o ol con tains p 2 examples. At fixed ( p, f , op), this p ool is sh uffled once with a fixed task-level data seed. The first ⌊ f p 2 ⌋ exam- ples define the training set, and the remaining held-out examples are split into a probe subset and an ev aluation subset. The prob e subset is used only for representation geometry; rep orted test accuracy is computed only on the remaining held-out ev aluation subset. In the main sw eeps, the prob e subset is capp ed at 7 , 600 examples or b y the a v ailable held-out p ool, whichev er is smaller. This split is shared across all training seeds at the same con- dition, so the seed ensemble measures initialization and optimization v ariability at fixed task data rather than v ariabilit y from rep eated repartitioning. 3. Observ able extraction and steady-state summaries A t each logging time, the mo del is ev aluated on the full prob e subset and the mean-p ooled p en ultimate rep- resen tation is collected. After centering those prob e ac- tiv ations, we form the cov ariance matrix, regularize it as C t + 10 − 6 I to ensure numerical stabilit y when the effec- tiv e rank of the prob e-set represen tation is low er than the em b edding dimension, diagonalize it, and compute HTC from the normalized eigensp ectrum. The primary observ able is therefore a held-out represen tation statistic rather than a readout statistic. Final order-parameter v alues are not taken from a sin- gle c hec kp oin t. F or each seed, we av erage HTC ov er the last 40 logged chec kp oin ts , or ov er the full a v ailable tail for shorter histories. This tail av erage is meant to capture the stationary late-training regime rather than transient fluctuations near the onset of grokking. Grokking itself is detected from held-out accuracy by a rolling-window criterion. In practice, we use a win- do w of 40 logged chec kp oin ts, require the recent held- out accuracy mean to exceed 0 . 98, require the held-out standard deviation in that windo w to stay b elo w 0 . 02, and require full-training accuracy to exceed 0 . 995. Runs ma y stop early only after grokking has b een detecte d, at least 5 , 000 p ost-grok optimization steps ha v e elapsed, and the recent HTC window has stabilized with stan- dard deviation b elo w 0 . 02 ov er the last 20 logged chec k- p oin ts. Final-state summaries therefore remain late- time measurements rather than premature truncations. The coarse and near-critical sweeps share fixed random- seed conv entions (50 seeds p er condition, dra wn from a con tiguous integer range starting at 0), the same split logic, the same represen tation measurement pip eline, and the same late-time av eraging rule, so rep orted ensem- ble statistics are reproducible under one proto col rather than stitched together from task-sp ecific analysis v ari- an ts. All exp erimen ts were run on NVIDIA A100 GPUs; a single coarse-grid condition (50 seeds at one ( p, f , op)) completes in approximately 2–4 hours dep ending on p . 4. Op eration robustness: subtraction and m ultiplication The main text fo cuses on addition as the canonical case; subtraction and m ultiplication were run on the same coarse grid to test whether the transition structure is op eration-sp ecific or extends across algebraic op era- tions. On the coarse grid, all three op erations indep en- 9 den tly pro duce Binder crossings and p o wer-la w suscep- tibilit y scaling, supp orting a finite-size transition in ter- pretation in each case. The estimated critical fractions differ across op erations: The shift in f c across op erations is consisten t with dif- feren t computational demands on the netw ork, but the presen t data do not isolate a sp ecific algebraic mecha- nism for the ordering of critical fractions. Exploratory exp onen t and collapse estimates also v ary across op er- ations, but on the presen t grid those differences can- not b e cleanly separated from finite-size contamination and metho d dep endence (App endix B ). F or that reason, the supp orting-operation comparison is not used to argue for or against universalit y; its role is narrow er and more robust. The table rep orts rough operation-level coarse- grid lo cators from the original p er-operation sw eeps; they are mean t as contextual summaries and should not b e conflated with the main-text addition lo cator, which is quoted from the audited dominant crossing branc h. The k ey statemen t is that all three op erations indep enden tly supp ort a finite-size transition in terpretation—Binder crossings cluster and susceptibilit y fav ors p o w er-la w ov er saturation—ev en though their quantitativ e exponent-lik e summaries are not stable enough for a shared-class claim. The transition structure is therefore not an artifact of the addition op eration alone. App endix B: FSS Metho d Details This appendix briefly summarizes the finite-size defini- tions used in the main analysis and separates them from exploratory diagnostics retained for transparency . The analysis c hain is sequen tial: we first compute late-time HTC tail means, then construct the Binder-lik e cumu- lan t, then iden tify the dominan t crossing branc h, then compare susceptibility against a smooth-crossov er alter- nativ e, and only after that use Binder minima together with the near-critical audit to discuss transition order. This ordering matters b ecause supp ort for a transition in terpretation and the order of that transition are dis- tinct verdicts in the presen t data. 1. Sp ectral order-parameter definition A t eac h logged c heckpoint, the held-out prob e repre- sen tations are mapp ed into a co v ariance matrix and di- agonalized. The normalized eigensp ectrum { p i } defines the order parameter m HTC = log P k i =1 p i + ε P i>k p i + ε ! , (B1) with k = 5 in the main text. A final-time a v erage (last stationary window) yields m HTC ( p, f ) at each seed. 2. Binder cumulan t for asymmetric observ ables The standard Binder cumulan t U 4 = 1 − ⟨ m 4 ⟩ / 3 ⟨ m 2 ⟩ 2 w as introduced for symmetric order parameters where the magnetization density satisfies ⟨ m ⟩ = 0 at critical- it y , giving the familiar plateau v alues U 4 → 2 / 3 (or- dered) and U 4 → 0 (disordered) [ 10 ]. F or a p ositiv e- definite observ able such as HTC, ⟨ m ⟩ = 0 generically , so those absolute plateau v alues are not exp ected and should not be interpreted literally . What is retained is the diagnostic crossing prop ert y: if a non-trivial FSS form holds, moment ratios such as U 4 ( f , p ) can become size-indep enden t near the fixed p oin t even without Z 2 symmetry [ 8 , 10 ]. Likewise, a deep ening negativ e min- im um is used only qualitatively , as an indicator of in- creasingly non-Gaussian fluctuations rather than as an exact plateau analogue. F or a cen tered v ariable, U 4 is a monotone function of the excess kurtosis; for the present p ositiv e-definite observ able, the relationship is modified but the diagnostic conten t is analogous: U 4 detects non- Gaussianit y of the seed-lev el distribution, which is the signature of collectiv e fluctuations near a transition. F or this reason, w e use the term “Binder-lik e cum ulant” and restrict its role to crossing detection and cautious transition-order diagnostics. 3. T ransition diagnostics The Binder quantit y used in the main text is U 4 ( f , p ) = 1 − ⟨ m 4 HTC ⟩ 3 ⟨ m 2 HTC ⟩ 2 , computed across seeds at fixed ( p, f ). Because HTC is p ositiv e and asymmetric rather than symmetry-restored, U 4 serv es as a Binder-like cumulan t rather than a Z 2 magnetization ratio. Its role is diagnostic: common crossings support transition-like organization, while min- im um b eha vior is used cautiously when discussing tran- sition order. Crossing summaries are not formed by av eraging ev- ery sign c hange b et w een ev ery size pair. Instead, pair- wise crossings are enumerated and then restricted to the dominan t branch in the crossing region, so the rep orted f c trac ks the common finite-size structure rather than outlying branches. The crossing spread is interpreted as a coarse lo cator on the present grids, not as a high- precision confidence interv al. The susceptibility is defined from seed-to-seed HTC fluctuations as χ ( f , p ) = n s V ar[ m HTC ( f , p )]. Its role is to discriminate singular finite-size b eha vior from smo oth saturation. T ransition-order assessment is delib erately lay ered. On the coarse grid, Binder-minim um extrapolation is treated only as a con tin uit y-leaning heuristic. The near-critical addition follow-up then stress-tests that heuristic at larger sizes and finer fraction spacing. Negativ e min- 10 T ABLE I I. Contextual coarse-grid diagnostics by op eration, quoted from the original per-op eration sweeps rather than the audited main-text dominant-branc h lo cator. Addition Subtraction Multiplication f c 0 . 411 0 . 465 0 . 431 Original-sw eep crossing spread 0 . 057 0 . 064 0 . 071 ∆AIC (v s. crosso ver) 11 . 4 9 . 2 8 . 7 ima at the largest primes are recorded as first-order ten- sion, but a final order verdict is not assigned without co existence-lik e seed structure and metho d-stable min- ima in the transition region. Seed-lev el bimo dalit y at near-critical conditions is as- sessed using kernel density estimation with Silverman bandwidth selection together with a gap statistic that requires b oth a gap exceeding one standard deviation of the seed distribution and balanced population on each side of the gap. Neither diagnostic detects bimo dalit y at an y near-critical condition examined. 4. Finite-size scaling ansatz and corrections The standard FSS ansatz for a contin uous transition p osits that the order parameter ob eys [ 6 , 7 ] m ( f , p ) = p − β /ν F ( f − f c ) p 1 /ν , (B2) where β and ν are critical exp onen ts and F is a uni- v ersal scaling function. The susceptibility p eak scales as χ max ∝ p γ /ν , the relation tested directly in the main text. F or finite systems, the scaling form receives correc- tions [ 6 , 7 ]: m ( f , p ) = p − β /ν F ( · ) + p − ω F 1 ( · ) + . . . , (B3) where ω is the leading correction-to-scaling exp onen t. On the present prime grid ( p ∈ [53 , 397]), systematic extrac- tion of ω is not feasible: the dynamic range spans less than one decade, and fits including a correction term are underdetermined. The analysis chain is therefore de- signed to b e robust to corrections by relying on crossing and divergence tests—which require only that the leading scaling form dominates—rather than on precision expo- nen t fits that would b e sensitiv e to subleading terms. 5. Screening and cutoff chec ks The main text treats screening as v alidation, not as a selection-b y-optimization. Readout quantities suc h as training loss and test accuracy are retained as controls b ecause they are interpretable but remain tied to p er- formance rather than directly to representation geom- etry . W eight and gradien t norms are also useful diag- nostics, but they mix transition information with op- timizer and regularization effects. Within cov ariance- deriv ed observ ables, HTC is retained b ecause it giv es a compact representation-lev el summary that consisten tly organizes the size-resolv ed structure without requiring a v ector-v alued order parameter. F ourier-mo de amplitudes remain mechanistically v aluable on mo dular tasks, but they presupp ose a task-sp ecific basis choice and a more explicit circuit mo del. HTC is retained instead because it compresses the same head-v ersus-bulk sp ectral reorgani- zation in to a basis-agnostic held-out cov ariance statistic, whic h is the more conserv ative choice for a finite-size di- agnostic chain. F or the k -cutoff choice, App endix Fig. 5 shows that k = 3 and k = 5 give consistent crossing structure, while k = 10 weak ens the separation of head and bulk sectors. 6. Phase-lab el and transition-order rules Phase-diagram lab els are assigned p er seed by a fixed rule set: no memorization, memorization-only , grokking, and instant generalization. The main-text phase map is the ma jority lab el p er ( f , λ ); companion panels re- p ort grokking fraction and mean grokking time o ver grokking seeds. This ma jority-map construction is used only to contextualize the con trol landscap e, not to re- place the finite-size diagnostics. T ransition-order review is handled separately . The indep enden t near-critical au- dit combines Binder-minimum trends with kernel-densit y estimation, a gap-based bimo dalit y statistic, and light tail-trimming chec ks on the largest-size seed distribu- tions. T ail trimming is treated only as a robustness note: if Binder negativity w eakens under sligh t trimming while no co existence-lik e bimo dalit y app ears, the correct pap er-lev el conclusion is unresolv ed order rather than a clean first-order verdict. 7. Phase diagram as contextual supp ort W e include phase mapping as con textual supp ort rather than a primary v erdict. At fixed p = 113, mapping the ( f , λ ) plane for addition shows a distinct grokking band whose b oundary shifts with regularization, supp ort- ing f as a meaningful con trol axis. The phase-lab eling proto col con tains four categories, but on the present grid three categories are dominant in the ma jority map; in- stan t generalization app ears mainly as a minority seed lab el. 11 3.75k 6.25k 10k 15k 25k final Snapshot time 1 0 − 3 1 0 − 2 1 0 − 1 1 0 0 Mean crossing spread (lower is tighter) a Common observable scan Proxy observables were screened over training time Train loss Test accuracy Weight norm Grad norm HTC 0.68 0.70 0.72 0.74 0.76 0.78 0.80 0.82 0.84 Binder-crossing quality Top-3 mass IPR HTC Gini Hellinger PC1 b Spectral-family selection HTC gives the strongest validated Binder-crossing quality FIG. 4. Order-parameter screening summary for context. P anel A reports time-resolv ed scans ov er common observ ables. P anel B compares sp ectral candidates and do cumen ts that HTC is retained as the representation-lev el choice for the finite-size diagnostic chain, with screening treated as v alidation rather than selection. 0.2 0.3 0.4 0.5 0.6 0.7 0.8 T r a i n i n g f r a c t i o n f −0.6 −0.4 −0.2 0.0 0.2 0.4 0.6 O p e r a t i o n a l B i n d e r - l i k e c u m u l a n t U 4 a k = 3 Binder verdict under HTC cutoff variation 0.2 0.3 0.4 0.5 0.6 0.7 0.8 T r a i n i n g f r a c t i o n f −0.2 0.0 0.2 0.4 0.6 O p e r a t i o n a l B i n d e r - l i k e c u m u l a n t U 4 b k = 5 Binder verdict under HTC cutoff variation 0.2 0.3 0.4 0.5 0.6 0.7 0.8 T r a i n i n g f r a c t i o n f 0.56 0.58 0.60 0.62 0.64 0.66 O p e r a t i o n a l B i n d e r - l i k e c u m u l a n t U 4 c k = 1 0 Binder verdict under HTC cutoff variation FIG. 5. Robustness of the HTC head–tail cutoff in near-critical and coarse-grid data. P anel A shows the near-critical pairwise crossing behavior across k = 3 , 5 , 10; Panel B shows the same for Binder-minimum extrap olation. k = 3 and k = 5 remain aligned, while k = 10 low ers head–bulk separation at large sizes. 8. Exploratory analyses Data-collapse optimization ov er ( β /ν, 1 /ν ) was at- tempted via grid searc h and Nelder-Mead minimization on the coarse-grid addition data. Collapse quality is metho d-dependent: constrained single- ν collapse gives χ 2 / dof < 0 . 01, suggesting ov erfitting or insufficient size range rather than a well-determined scaling function. Quotien t and phenomenological-RG estimates of 1 /ν are noisy and inconsistent across size cuts, with v alues rang- ing from 0 . 5 to 3 . 0 dep ending on the pair selected. Hy- p erscaling combinations constructed from indep enden tly extracted exp onen ts do not conv erge to a stable rela- tion. Op eration-dependent exp onen t estimates (addi- tion, subtraction, multiplication) differ b ey ond statisti- cal error, but on the present grid this cannot b e distin- guished from finite-size contamination. These failures motiv ate the conserv ative approac h in the main text: the Binder/susceptibility chain supp orts the transition in terpretation, while exp onen t extraction is deferred un- til larger primes and finer fraction grids are a v ailable. App endix C: Extended Related W ork A useful wa y to organize the grokking literature is b y the kind of transition claim b eing made and by the diag- nostics used to support it. The debate is now rich enough that simply listing pap ers is les s useful than lo cating their claims relative to one another. Gr okking as tr ansition or critic al phenomenon. The original grokking paper established the delay ed- generalization phenomenon in small algorithmic tasks [ 1 ], and subsequent work broadened its empirical scop e to other data regimes and deep er mo dels [ 2 , 5 ]. Within ex- plicit transition framings, Rubin et al. [ 24 ] argue for a first-order transition in a mean-field tw o-lay er netw ork, ˇ Zunk o vi ´ c and Ilievski [ 25 ] derive analytic critical b eha v- ior in solv able lo cal-rule problems, Liu et al. [ 26 ] build an effectiv e theory of representation learning, Clauw et al. [ 27 ] in terpret information-theoretic progress measures as evidence for an emergent phase transition, and De- Moss et al. [ 28 ] recast the dynamics through complexity measures. These works make a transition picture plau- sible and imp ortan t, but they do not conv erge on one 12 1 0 − 1 5 1 0 − 1 2 1 0 − 9 1 0 − 6 1 0 − 3 1 0 0 W e i g h t d e c a y λ 0.1 0.2 0.3 0.4 0.5 0.6 0.7 0.8 0.9 T r a i n i n g f r a c t i o n f a Phase map D i s t i n c t r e g i m e s i n ( f , λ ) a t p = 1 1 3 No mem. Mem. only Grokking Instant 1 0 − 1 5 1 0 − 1 2 1 0 − 9 1 0 − 6 1 0 − 3 1 0 0 W e i g h t d e c a y λ 0.1 0.2 0.3 0.4 0.5 0.6 0.7 0.8 0.9 T r a i n i n g f r a c t i o n f b Grokking fraction Delayed generalization occupies an intermediate band 0.0 0.2 0.4 0.6 0.8 1.0 Fraction of seeds 1 0 − 1 5 1 0 − 1 2 1 0 − 9 1 0 − 6 1 0 − 3 1 0 0 W e i g h t d e c a y λ 0.1 0.2 0.3 0.4 0.5 0.6 0.7 0.8 0.9 T r a i n i n g f r a c t i o n f c Mean grokking time Critical slowing concentrates near the boundary 5000 10000 15000 20000 25000 30000 35000 Steps FIG. 6. Phase diagram in the ( f , λ ) plane at fixed p = 113 for addition. P anel A shows the ma jorit y phase map under the four-lab el proto col. The phase-lab eling proto col contains four categories, but on the present grid the ma jority map exhibits only three dominant regions; instant generalization app ears only as a minority seed lab el. Panel B shows the fraction of seeds that grok. Panel C sho ws the mean grokking time where grokking o ccurs. The grokking regime o ccupies a distinct in termediate band in control-parameter space. finite-width diagnostic proto col. A lternative interpr etations and tensions. Recen t pa- p ers also highligh t why the order question is subtle. Zhang et al. [ 32 ] argue for computational glass relaxation rather than a phase transition. Prieto et al. [ 42 ] em- phasize n umerical-stabilit y structure, P ezeshki et al. [ 43 ] connect long-range prediction to loss-landscap e organi- zation, and Notsa w o et al. [ 44 ] show that some simple norm-based summaries do not exhaust the phenomenon. T ak en together, these studies sharp en the p oin t that de- la y ed generalization, sharp reorganization, and slow dy- namics need not automatically imply one sp ecific transi- tion order. Me chanistic and c ontr ol-oriente d work. A differen t line of w ork fo cuses less on transition order than on the mec hanisms and controllabilit y of grokking. Nanda et al. [ 3 ] introduced mechanistic progress measures, Merrill et al. [ 29 ] describe comp etition b et ween sparse and dense circuits, Lyu et al. [ 30 ] prov e that early- and late-phase implicit biases can induce grokking, Lee et al. [ 4 ] accel- erate the phenomenon by amplifying slo w gradients, and Ch ugh tai et al. [ 31 ] reverse-engineer how netw orks learn group op erations. These pap ers explain why grokking happ ens or how to manipulate it, but they do not them- selv es settle the finite-size v erdict. Br o ader physics-of-le arning c ontext. The present pap er also sits inside a wider literature that treats learning systems with the language of order param- eters, scaling, and collective organization. This in- cludes the classical treatment of phase transitions and critical phenomena [ 9 ], the early statistical-mechanics program for neural learning [ 11 , 45 ], mo dern synthe- ses of deep-learning statistical mechanics [ 12 – 14 ], and represen tation-geometry work sho wing that trained net- w orks often reorganize through effectiv e-dimensional or sp ectral structure [ 18 , 39 , 46 ]. Information-theoretic and information-geometric traditions likewise motiv ate low- dimensional state descriptions and structured observ- ables for complex learning systems [ 15 , 16 , 19 , 47 , 48 ]. Landscap e and training-dynamics viewp oin ts pro vide ad- ditional but non-equiv alent pictures of reorganization during optimization [ 49 – 53 ]. Our metho dological differ- ence is to use that broader p erspective to define a con- crete finite-size diagnostic chain for grokking itself: ex- plicit size con trol, a representation-lev el observ able, re- jection of smooth crossov er, and a separate audit of tran- sition order.
Original Paper
Loading high-quality paper...
Comments & Academic Discussion
Loading comments...
Leave a Comment