A Large-Scale Comparative Analysis of Imputation Methods for Single-Cell RNA Sequencing Data
Single-cell RNA sequencing (scRNA-seq) is inherently affected by sparsity caused by dropout events, in which expressed genes are recorded as zeros due to technical limitations. These artifacts distort gene expression distributions and can compromise …
Authors: Yuichiro Iwashita, Ahtisham Fazeel Abbasi, Muhammad Nabeel Asim
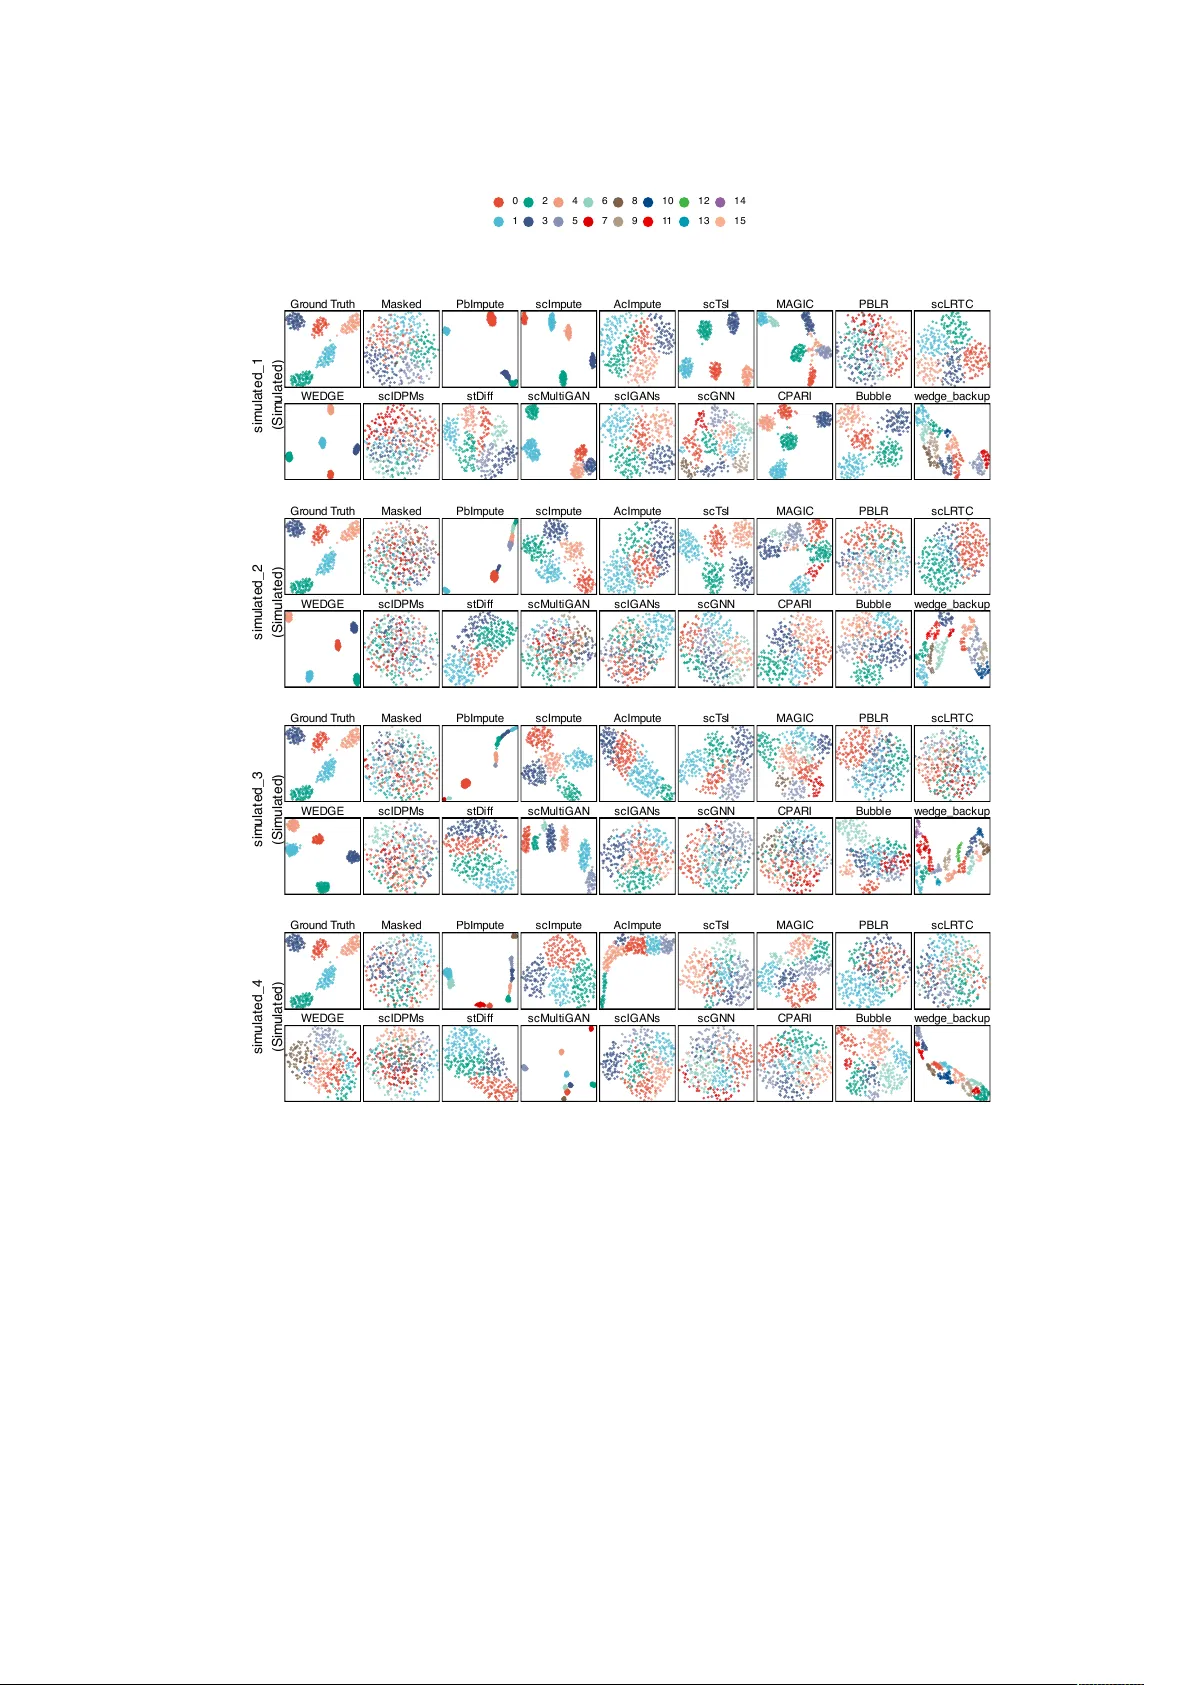
A Large-Scale Comparativ e Analysis of Imputation Metho ds for Single-Cell RNA Sequencing Data Y uic hiro Iw ashita 1,2* † , Ah tisham F azeel Abbasi 1,2 † , Muhammad Nabeel Asim 2,3 , Andreas Dengel 1,2,3 1 RPTU Univ ersity Kaiserslautern-Landau, 67663 Kaiserslautern, German y . 2 German Researc h Center for Artificial In telligence (DFKI Gm bH), 67663 Kaiserslautern, German y . 3 In telligentx Gm bH (in telligentx.com), 67663 Kaiserslautern, German y . *Corresp onding author(s). E-mail(s): yuic hiro.iw ashita@dfki.de ; Con tributing authors: ahtisham.abbasi@dfki.de ; m uhammad_nab eel.asim@dfki.de ; andreas.dengel@dfki.de ; † These authors con tributed equally to this work. Abstract Single-cell RNA sequencing (scRNA-seq) enables gene expression profiling at cellular resolution, but it is inheren tly affected b y sparsity caused by drop out ev ents, in whic h expressed genes are recorded as zeros due to tec hnical limi- tations, such as lo w mRNA capture efficiency and amplification noise. These artifacts distort gene expression distributions and can compromise do wnstream analyses. Numerous computational metho ds ha v e b een prop osed to address this issue by imputing drop out even ts and recov ering latent transcriptional signals. These metho ds encompass a wide range of approaches, from traditional statis- tical models to recently dev elop ed deep learning (DL)-based methods. Ho wev er, their comparative performance remains unclear, as existing b enc hmarking stud- ies t ypically ev aluate only a limited subset of metho ds, datasets, and do wnstream analytical tasks. Here, we presen t a comprehensive b enc hmark of 15 scRNA-seq imputation methods spanning 7 methodological categories, including traditional and modern DL-based metho ds. These metho ds are ev aluated across 30 datasets (26 real and 4 simulated) sourced from 10 exp erimental proto cols and assessed in terms of 6 do wnstream analytical tasks. Our results sho w that across the ev aluated datasets and analytical tasks, traditional imputation metho ds, suc h as 1 mo del-based, smo othing-based, and lo w-rank matrix-based metho ds, generally outp erform DL-based metho ds, such as diffusion-based, GAN-based, GNN-based, and auto encoder-based metho ds. In addition, strong p erformance in numerical gene expression reco very do es not necessarily translate into impro ved biologi- cal interpretabilit y in downstream analyses, including cell clustering, differen tial expression analysis, mark er gene analysis, tra jectory analysis, and cell type annotation. F urthermore, the p erformance of imputation metho ds v aries substan- tially across datasets, proto cols, and downstream analytical tasks, and no single metho d consisten tly outp erforms others across all ev aluation scenarios. T ogether, our results provide practical guidance for selecting imputation metho ds tailored to specific analytical ob jectives and highlight the importance of task-sp ecific ev aluation when assessing imputation p erformance in scRNA-seq data analysis. Keyw ords: single-cell RNA sequencing, gene expression data, imputation, b enchmark 1 In tro duction Single-cell RNA sequencing (scRNA-seq) has b ecome a p o werful technology for profil- ing gene expression at the resolution of individual cells [ 1 – 4 ]. In scRNA-seq, individual cells are isolated from a tissue, and their mRNA con tent is reverse-transcribed in to complemen tary DNA (cDNA), amplified to increase signal, and sequenced to generate large collections of short DNA reads [ 5 – 10 ]. These reads are subsequently pro cessed through a computational pip eline that includes alignment to a reference genome, qual- it y filtering, and transcript counting [ 5 – 8 ]. The output of this pipeline is a structured gene expression matrix in which rows represen t individual cells, columns represent genes or vice v ersa, and each matrix entry represents the expression of a sp ecific gene in a cell [ 2 ]. scRNA-seq plays a significant role in biological research by addressing k ey ques- tions related to cellular heterogeneity and disease mechanisms [ 2 , 5 ]. F or instance, scRNA-seq enables the discov ery of dynamic gene regulatory features [ 11 ], the inv es- tigation of cellular in teractions [ 12 ], and the iden tification of rare cell t yp es [ 13 ]. Moreo ver, scRNA-seq is an essential to ol for constructing cell atlases, such as the Human Cell A tlas (HCA) [ 14 ] and the T abula Sapiens [ 15 ], and these atlases enable comprehensiv e mapping of cell types and states across v arious tissues and organs [ 13 , 16 ]. A wide range of do wnstream tasks can b e p erformed on scRNA-seq data to address div erse biological questions [ 2 , 17 – 20 ]. These tasks include cell clustering to group cells with similar expression profiles [ 21 , 22 ], tra jectory inference to model dynamic cellu- lar pro cesses [ 23 – 27 ], marker gene analysis to identify genes that define sp ecific cell p opulations [ 28 ], cell t yp e iden tification to assign biological identities to cells [ 29 ], and differen tial expression (DE) analysis to detect genes that are differentially expressed b et w een different conditions [ 30 ]. Despite the widespread use of scRNA-seq, the reliability of results from down- stream tasks critically dep ends on the quality of gene expression data [ 31 , 32 ]. In practice, ac hieving high-quality data is c hallenging due to substantial technical noise 2 T able 1 Summary of existing b enchmarking studies on scRNA-seq data imputation methods Study Methods Datasets Proto cols T asks T raditional DL-based Model- based Smoothing- based Low-rank Matrix-based Diffusion- based GAN- based GNN- based AE- based Hou et al. [ 19 ] 6 3 3 0 0 0 6 16 5 3 Dai et al. [ 18 ] 2 3 2 0 1 1 3 8 1 3 Cheng et al. [ 17 ] 2 4 1 0 0 0 4 16 3 3 This Study 2 3 3 2 2 1 2 30 10 5 inheren t to scRNA-seq exp eriments, arising from the limited amount of mRNA in individual cells [ 33 ], inefficiencies in reverse transcription [ 34 ], and sto c hastic v ari- abilit y introduced during mRNA capture and amplification steps [ 16 , 33 , 34 ]. These tec hnical limitations can lead to drop out even ts, where genes are observ ed as zero despite b eing expressed at low lev els in the cell [ 16 , 33 – 36 ]. How ever, not all zero coun ts arise from technical noise; zero coun ts in scRNA-seq data ma y also reflect a true biological absence of transcription, often referred to as biological zeros, which are fundamentally distinct from technical drop out even ts [ 16 , 36 , 37 ]. Since drop out ev ents distort the observ ed gene expression distribution, they can adv ersely affect the accuracy and robustness of downstream analyses [ 16 , 36 , 38 , 39 ]. In light of these lim- itations, data imputation strategies hav e b een introduced to address drop out even ts b efore p erforming do wnstream analyses [ 2 , 17 – 19 , 36 ]. scRNA-seq imputation metho ds fall in to traditional and deep learning (DL)- based categories [ 40 – 54 ]. T raditional imputation metho ds typically rely on statistical mo deling or similarity-based heuristics [ 40 – 47 ]. T raditional methods can b e broadly categorized into 3 metho dological classes, namely mo del-based, smo othing-based, and lo w-rank matrix-based metho ds [ 16 , 19 , 36 ], and are briefly describ ed in Section 2.3.1 . In contrast, DL-based methods rely on represen tation learning using deep neural net works (DNNs) [ 48 – 54 ], which is a fundamen tally different approach compared to traditional metho ds. DL-based metho ds can b e broadly categorized in to 4 metho d- ological classes, namely diffusion-based, generative adversarial netw ork (GAN)-based, graph neural netw ork (GNN)-based, and auto encoder (AE)-based methods, and are briefly discussed in Section 2.3.2 . Despite the a v ailability of numerous imputation metho ds, existing b enc hmarking studies remain limited in their cov erage of metho ds, datasets, exp erimen tal proto- cols, and downstream tasks. T able 1 summarizes 3 existing b enc hmarking studies on scRNA-seq data imputation, namely Hou et al. [ 19 ], Dai et al. [ 18 ], and Cheng et al. [ 17 ]. Hou et al. [ 19 ] ev aluated 12 traditional metho ds and 6 AE-based metho ds, but do not include an y diffusion-based, GAN-based, or GNN-based metho ds. Dai et al. [ 18 ] expanded the scop e of DL-based metho ds by incorp orating 1 GAN-based and 1 GNN-based metho ds in addition to 3 AE-based metho ds. How ever, their ev aluation is limited to 8 datasets and a single proto col. Cheng et al. [ 17 ] assessed 7 traditional metho ds and 4 AE-based metho ds, but similarly , they do not ev aluate diffusion- based, GAN-based, or GNN-based metho ds. F urthermore, all 3 studies restricted their 3 ev aluation to at most 3 downstream tasks, whic h ma y not adequately capture the mul- tifaceted effects of imputation on biological analyses. These gaps highlight the need for a more comprehensiv e and robust b enc hmarking study that spans a wider range of imputation metho ds, including recent DL architectures, and ev aluates their impact across a broader set of downstream tasks and proto cols. In this study , w e address these limitations by presenting a comprehensiv e and systematic b enc hmark of scRNA-seq data imputation methods. Our ev aluation cov- ers 15 represent ative metho ds spanning 7 metho dological categories, including b oth traditional metho ds (mo del-based, smoothing-based, and lo w-rank matrix-based) and recen t DL-based metho ds (diffusion-based, GAN-based, GNN-based, and AE-based metho ds). T o ensure a robust and representativ e assessment, w e ev aluate these meth- o ds across 30 datasets (26 real and 4 simulated) sourced from 10 distinct proto cols. Bey ond imputing scRNA-seq data using these metho ds, w e further inv estigate the impact of imputation on a broad range of biologically relev ant downstream analyses. Sp ecifically , we assess metho d p erformance across 6 key tasks in scRNA-seq data anal- ysis, including n umerical gene expression reco very , cell clustering, DE analysis, marker gene analysis, tra jectory analysis, and cell type annotation. T ogether, this study pro vides a comprehensive benchmarking framew ork for ev aluating scRNA-seq data imputation metho ds and offers practical insights into their strengths and limitations across diverse analytical settings. Our systematic comparison of metho ds across het- erogeneous datasets, proto cols, and downstream tasks provides guidance for selecting appropriate imputation strategies tailored to sp ecific single-cell analysis ob jectives. 2 Materials and Metho ds 2.1 Summary of the Data Imputation Benc hmarking F ramew ork scRNA-seq data cannot b e reliably analyzed directly due to the presence of excessive drop out even ts, whic h manifest as false zero expression v alues and distort observed gene expression distributions [ 2 ]. T o address this limitation, data imputation meth- o ds aim to recov er latent gene expression signals and impro ve the robustness of do wnstream tasks [ 17 – 19 , 36 , 40 – 54 ]. In this study , a comprehensive benchmark- ing framew ork is designed to systematically ev aluate a diverse set of scRNA-seq imputation methods, spanning 8 traditional metho ds, including mo del [ 40 , 41 ], smo othing [ 42 – 44 ], and low-rank matrix-based metho ds [ 45 – 47 ], and 7 DL-based metho ds, including diffusion [ 48 , 49 ], GAN [ 51 , 54 ], GNN [ 53 ], and AE-based meth- o ds [ 50 , 52 ]. These metho ds differ substantially in their underlying assumptions, including statistical mo deling of drop out mechanisms [ 40 , 41 ], exploiting cell-cell simi- larit y [ 42 – 44 ], enforcing lo w-rank structures [ 45 – 47 ], or learning laten t representations through DNNs [ 48 – 54 ]. Giv en this diversit y , it is essen tial to assess their effectiveness across heterogeneous datasets and multiple downstream tasks rather than relyin g on a single ev aluation criterion [ 17 – 19 ]. T o ensure a fair and unbiased comparison, the b enc hmarking framew ork incorp o- rates a carefully curated collection of 26 real and 4 simulated scRNA-seq datasets 4 T raditional Methods Deep Lear ning-based Methods Cell T ype Annotation D E C N P C H F F G e n e s C e l l s C l a ssi e r T rajectory Analysis U M A P 1 U M A P 2 P s e u d o t i m e 0 1 0 0 Marker Gene Analysis Clustering DE Analysis Cell Clustering G e n e s C e l l s U M A P 1 2 C e l l s D i m e n s i o n a l i t y R e d u c t i o n ( e . g . U M A P , t - S N E ) Clustering V isualization C l u s t e r i n g R e s u l t C l u s t e r A v s R e s t D E A n a l y s i s DE Genes Gene A Gene C Gene D Gene G Numerical Gene Expr ession Recovery - 2 0 E r r o r ( i m p u t e d - g r o u n d t r u t h ) 2 0 Numerical Gene Expr ession Recovery Marker Gene Analysis T rajectory Analysis Cell T ype Annotation Cell Clustering DE Analysis Forwar d Pr ocess Reverse Pr ocess Diusion-based Methods S m o o t h e d M a t r i x + L o w - r a n k M a t r i x S p a r s i t y M a t r i x Model-based Methods Smoothing-based Methods Low-rank Matrix-based Methods GNN-based Methods AE-based Methods r eal? fake? Generator Discriminator GAN-based Methods MSE PCC MCC MAE LND MedAE M arker Gen e E x p r es s io n D is trib u tio n s C ell T y p e Sep aratio n ACC PR RC F1 FP IoU ARI Purity NMI Silhouette Scor e UMAP V isualization POS KRCC Data Imputation Methods c e l l s g e n e s c e l l s g e n e s T r a i n V a l i d a t i o n T e s t Quality Contr ol Dr opout Simulation by Random Masking Data Split Data Pr epr ocessing 0 0 0 0 0 1 0 0 0 0 0 0 0 0 0 4 0 0 0 300 c e l l s g e n e s 26 Real Datasets 0 0 1 0 0 0 0 0 0 0 8 0 0 0 2 0 0 0 0 0 0 g e n e s c e l l s 4 Simulated Datasets Dr opout Rate 30, 50, 70, 90% Dataset Collection Downstr eam T asks Evaluation Fig. 1 Data Imputation Benchmarking F ramework. 5 that v ary in size, sparsity level, biological context, and proto col. Each dataset under- go es standardized quality control (QC) and is split into training, v alidation, and test sets to preven t data leak age during training and ev aluation. Drop out ev ents are arti- ficially in tro duced in to eac h set to establish kno wn ground truth v alues, enabling ob jective assessment of numerical gene expression reco very [ 17 – 19 ]. This design allo ws the framew ork to isolate the true impact of eac h imputation metho d on data quality while a voiding ov erfitting and biased p erformance estimates. Ev aluation of data imputation methods is p erformed from both numerical and functional persp ectives using 6 do wnstream tasks. First, the p erformance of numerical gene expression reco very is quantified by directly comparing imputed and ground truth v alues using error-based metrics [ 17 , 18 ]. Subsequently , biological utilit y is assessed through a diverse set of do wnstream tasks, including cell clustering [ 21 , 22 , 55 ], DE analysis [ 2 , 30 ], marker gene analysis [ 2 , 28 ], tra jectory analysis [ 2 , 23 – 27 ], and cell t yp e annotation [ 2 , 29 , 55 , 56 ]. These tasks collectiv ely capture core analytical ob jectives in scRNA-seq studies and provide insigh t into ho w data imputation influences biological in terpretation [ 17 – 19 ]. Imp ortan tly , all do wnstream tasks are conducted consistently across methods to ensure comparability . Fig. 1 presents an ov erview of the prop osed b enc hmarking framew ork, illustrating the complete pip eline from dataset collection and prepro cessing to data imputation, do wnstream tasks, and p erformance ev aluation. Detailed descriptions of dataset col- lection and prepro cessing are provided in Section 2.2 . Data imputation metho ds, do wnstream tasks, and ev aluation measures are described in Sections 2.3 , 2.4 and 2.5 , resp ectiv ely . T ogether, this framework enables a systematic and repro ducible assess- men t of scRNA-seq data imputation metho ds, highligh ting their strengths, limitations, and suitabilit y for differen t analytical scenarios. 2.2 Benc hmark Datasets The p erformance of scRNA-seq imputation methods is hea vily influenced by the c har- acteristics of the datasets, suc h as dataset size, sparsity rate, biological context, and proto col [ 17 – 19 ]. In particular, datasets not only affect the difference b etw een imputed and ground truth expression v alues but also directly impact do wnstream tasks [ 17 – 19 ], including cell clustering [ 21 , 22 , 55 ], DE analysis [ 2 , 30 ], marker gene analysis [ 2 , 28 ], tra jectory analysis[ 2 , 23 – 27 ], and cell type annotation [ 2 , 2 , 29 , 55 , 56 , 56 ]. There- fore, the use of represen tative, well-curated, and high-qualit y scRNA-seq datasets is fundamen tal to conducting an un biased and meaningful benchmark [ 17 , 19 ]. T able 2 : Details of the used scRNA-seq datasets Dataset Description Source Size ( Cells × Genes ) Sparsity Rates (%) Protocol ad_case [ 57 ] Human brain cells with Alzheimer’s disease GSE138852 10278 × 13214 94 . 93 10x Chromium Continue d on next p age 6 Continue d fr om previous p age Dataset Description Source Size ( Cells × Genes ) Sparsity Rates (%) Protocol jurk at Human Jurk at T- cell leuk emia cell line scRNA-seq dataset 10x Genomics 1 1740 × 13494 81 . 19 10x Chromium 293t Human HEK293T embry onic kidney cell line scRNA-seq dataset 10x Genomics 2 2868 × 16290 81 . 20 10x Chromium pbmc4k Peripheral bloo d mononuclear cells (PBMCs) from a healthy donor. 10x Genomics 3 4220 × 16412 92 . 26 10x Chromium sc_10x [ 58 , 59 ] Single cells from three h uman lung adenocarcinoma cell lines GSM3022245 902 × 16468 45 . 02 10x Chromium sc_10x_5cl [ 58 , 59 ] Single cells from five human lung adeno- carcinoma cell lines GSM3618014 3913 × 11786 63 . 04 10x Chromium guo [ 60 ] Mouse early embry- onic developmen t scRNA-seq dataset. GSE150861 18177 × 18538 96 . 18 10x Chromium itc [ 61 ] Human innate T cells (ITCs). GSE124731 2005 × 13260 93 . 74 10x Chromium hca_10x_tissue Bone marrow cells from sample Man- tonBM6 HCA 4 6515 × 18203 91 . 13 10x Chromium cellmix1 [ 58 , 59 ] Pseudo cells from nine cell mixtures GSE118767 263 × 11798 81 . 41 CEL-seq2 rnamix_celseq2 [ 58 , 59 ] Pseudo cells from RNA mixtures GSM3305230 340 × 14804 52 . 07 CEL-seq2 sc_celseq2 [ 58 , 59 ] Single cells from three h uman lung adenocarcinoma cell lines GSM3336845 273 × 22014 67 . 82 CEL-seq2 sc_celseq2_5cl_p1 [ 58 , 59 ] Single cells from five human lung adeno- carcinoma cell lines GSM3618022 291 × 15564 65 . 28 CEL-seq2 hcc [ 62 ] T cells from hepa- tocellular carcinoma (HCC). GSE98638 5035 × 21576 85 . 54 SMAR T-seq2 petrop oulos [ 63 ] Human preim- plantation embry o scRNA-seq dataset across early developmen tal stages E-MT AB- 3929 1517 × 23583 62 . 12 SMAR T-seq2 ch u_cell_type [ 64 ] Human em bryonic stem cell scRNA-seq dataset with defined cell states. GSE75748 1018 × 17559 45 . 24 SMAR T-seq Continue d on next p age 7 Continue d fr om previous p age Dataset Description Source Size ( Cells × Genes ) Sparsity Rates (%) Protocol ch u_time_course [ 64 ] Human embry onic stem cell scRNA-seq dataset following differentiation ov er time. GSE75748 758 × 16863 48 . 45 SMAR T-seq chen [ 65 ] Mus musculus scRNA-seq dataset of adult mouse hypothalamus revealing diverse neuronal and non-neuronal cell types GSE87544 13891 × 17623 92 . 73 Drop-seq romanov [ 66 ] Mus m usculus brain scRNA-seq dataset profiling hypotha- lamic neuronal cell types. GSE74672 3005 × 16979 85 . 66 Drop-seq sc_dropseq [ 58 , 59 ] Single cells from three h uman lung adenocarcinoma cell lines GSM3336849 224 × 15113 62 . 13 Drop-seq usokin [ 67 ] Mouse sensory neu- ron scRNA-seq dataset profiling dorsal ro ot ganglion cell t yp es. GSE59739 622 × 17777 82 . 13 STR T-Seq zeisel [ 68 ] Mouse brain scRNA-seq dataset defining ma jor neu- ronal and glial cell types. GSE60361 3005 × 19972 82 . 15 STR T-Seq baron [ 69 ] Human pancreas scRNA-seq dataset profiling endocrine and exo crine cell types. GSM2230757 1918 × 14708 87 . 03 inDrop encode_fluidigm_5cl [ 70 ] Single cells from five cell lines GSE81861 360 × 36092 67 . 07 Fluidigm C1 bladder [ 71 ] Mus musculus blad- der scRNA-seq dataset from the Mouse Cell Atlas profiling cell types across bladder tissue. Figshare 5 1278 × 16387 94 . 44 Micro well-seq rnamix_sortseq [ 58 , 59 ] Pseudo cells from RNA mixtures GSM3305231 296 × 15571 60 . 84 Sort-seq simulated_1 - - 2000 × 600 30 . 79 - simulated_2 - - 2000 × 600 50 . 62 - simulated_3 - - 2000 × 600 70 . 12 - simulated_4 - - 2000 × 600 89 . 61 - 8 T able 2 presents 30 unique benchmark datasets spanning 10 scRNA-seq data extraction protcols, 12 cell lines, 11 tissues from human and mouse samples, and 6 disease conditions which are collected from 10x Genomics dataset repository [ 72 ], Gene Expression Omnibus (GEO) database [ 73 ], Figshare [ 74 ], HCA [ 14 ] and BioS- tudies [ 75 ]. These datasets are selected for representativ e cov erage of the heterogeneity and protocol v ariations presen t in real-world scRNA-seq studies. The curated dataset collection co vers a wide range of sizes and sparsit y rates to ev aluate imputation metho ds under different num b er of cells, genes, and drop out conditions. These datasets v ary significantly in scale, with n umber of cells ranging from 224 to 13,891 and n umber of genes spanning 14,708 to 23,583. This v ariet y helps ev aluate if data imputation metho ds can handle b oth small samples and large- scale data [ 17 ]. F urthermore, the collection includes sparsity rates from 45 . 24 % to 96 . 18 % , reflecting realistic drop out levels encountered in scRNA-seq exp eriments [ 17 ]. Conducting benchmarks across these different lev els of data densit y ensures a clear ev aluation of how well each metho d reco vers gene expression v alues in both high and lo w-quality datasets [ 17 , 19 ]. Proto cols introduce distinct tec hnical noise profiles and dropout patterns that can substantially influence imputation p erformance [ 6 – 8 ]. This proto col-lev el hetero- geneit y is addressed by selecting 26 datasets obtained using 10 different proto cols, namely 10x Chromium [ 8 ], SMAR T-seq [ 76 ], SMAR T-seq2 [ 77 ], CEL-seq2 [ 78 ], Drop- seq [ 79 ], inDrop [ 80 ], Microw ell-seq [ 71 ], STR T-seq [ 81 ], Sort-seq [ 82 ], and Fluidigm C1 [ 83 ]. This dataset collection enables a systematic assessment of imputation robust- ness across platforms with fundamentally different library preparation strategies, read depths, and technical noise profiles [ 17 , 19 ]. In addition to real datasets, 4 simulated datasets with known ground truth to compare the p erformance of imputation metho ds under different drop out rates are used in this b enc hmarking framew ork [ 17 ]. The simulated datasets are generated using the Splatter [ 84 ] pac k age, which allo ws con trolled simulation of scRNA-seq data with kno wn ground truth [ 17 , 84 ]. Each simulated dataset contains 2,000 cells and 10,000 genes, and 5 clusters. T o compare the performance of imputation methods under differen t dropout rates, 4 sim ulated datasets with v arying dropout rates of 30 . 79 , 50 . 62 , 70 . 12 , and 89 . 61 % are generated, which reflect a range of drop out conditions commonly observ ed in real scRNA-seq experiments [ 17 ]. After dataset collection, QC is applied to eac h real dataset to remov e low-qualit y cells and genes [ 17 ]. F ollowing Cheng et al. [ 17 ], cells whose num b er of expressed genes is larger than the 75th p ercen tile or less than the 25th percentile are filtered out [ 17 ]. Similarly , genes which are expressed in more than the 75th percentile or few er than the 25th p ercentile of the num b er of cells are filtered out [ 17 ]. With this QC pro cedure, only high-quality cells and genes are retained for subsequen t imputation and do wnstream tasks [ 17 ]. 1 https://www.10xgenomics.com/jp/datasets/jurk at- cells- 1- standard- 1- 1- 0 2 https://www.10xgenomics.com/datasets/293- t- cells- 1- standard- 1- 1- 0 3 https://www.10xgenomics.com/jp/datasets/4- k- pbm- cs- from- a- healthy- donor- 2- standard- 2- 1- 0 4 https://explore.data.h umancellatlas.org/pro jects/cc95ff89- 2e68- 4a08- a234- 480eca21ce79 5 https://figshare.com/s/865e694ad06d5857db4b 9 The cells are randomly partitioned into training, v alidation, and test sets. The training set is used for training the data imputation metho ds, the v alidation set is used for early stopping of training iteration of DL-based metho ds, and the test set is used for ev aluating the impuataion metho ds including running downstream tasks. This dataset splitting strategy preven ts data leak age b et ween training and ev alua- tion phases, ensuring a fair assessment of imputation p erformance, whereas previous b enc hmarking studies [ 17 – 19 ] use the same ground truth data for b oth training and testing, whic h can lead to o verfitting and biased results. The split ratio is 70 % for training, 10 % for v alidation, and 20 % for testing. After QC and data splitting, drop out even ts are artificially introduced into eac h split set of real scRNA-seq datasets since it is not p ossible to distinguish b etw een true biological zeros and technical drop out even ts in real scRNA-seq datasets [ 16 , 36 , 37 ]. T o introduce drop out even ts, following Cheng et al. [ 17 ], 10 % of non-zero expression v alues in each split dataset are selected and masked as zero expression v alues [ 17 ]. The original non-zero expression v alues b efore masking are used as ground truth for ev aluation. 2.3 Data Imputation Metho ds 2.3.1 T raditional Metho ds T raditional data imputation metho ds for scRNA-seq can be broadly categorized into 3 metho dological classes: mo del-based metho ds, smo othing-based metho ds, and lo w- rank matrix-based metho ds. These categories and the sp ecific metho ds ev aluated in this study are describ ed b elo w. • Mo del-b ase d Metho ds: Model-based metho ds explicitly mo del the o ccurrence of drop out even ts and the distribution of gene expression v alues using parametric sta- tistical models to estimate and impute drop out even ts in scRNA-seq data [ 40 , 41 ]. 2 different mo del-based metho ds are selected in this study , i.e., scImpute [ 41 ] and PbImpute [ 40 ]. scImpute [ 41 ] mo dels the o ccurrence of drop out ev ents and the dis- tribution of gene expression v alues using a mixture distribution, in which drop out ev ents are mo deled b y a Gamma distribution and true expression v alues are mo d- eled b y a Normal distribution [ 41 ]. An exp ectation-maximization (EM) algorithm is then used to estimate the drop out probabilit y of each zero expression v alue [ 41 , 85 ]. Cells with similar expression patterns are then identified using non-negative least squares regression, and expression v alues from these similar cells are used to impute v alues at inferred dropout p ositions [ 41 ]. In contrast, PbImpute [ 40 ] addresses the common problem of ov er-imputation by utilizing a m ulti-stage method [ 40 ]. The pro cess b egins with zero-inflated negativ e binomial (ZINB) mo deling to pro- vide robust dropout iden tification and initial imputation [ 40 ]. T o enhance data fidelit y , the metho d incorp orates a static repair step that corrects ov er-imputed v alues by adjusting outlying nonzero v alues [ 40 ]. Moreov er, the metho d iden tifies residual drop out ev ents using node2vec [ 86 ], whic h capture compl ex relationships b et w een cells, and impute residual drop out even ts dynamically [ 40 ]. This multi- stage approac h allows PbImpute to accurately iden tify and impute dropout even ts while minimizing the risk of ov er-imputation [ 40 ]. 10 • Smo othing-b ase d Metho ds: Smo othing-based metho ds lev erage the similarity of expression profiles among neighboring cells to reduce noise and preserve biological signals in scRNA-seq data [ 42 – 44 ], a process typically referred to as smooth- ing [ 42 – 44 ]. 3 represen tative smo othing-based methods are selected in this study , i.e., MAGIC [ 44 ], scT sI [ 43 ], and AcImpute [ 42 ]. MAGIC is designed based on the concept that gene expression profiles can b e shared among similar cells to recov er missing v alues, and utilizes Marko v pro cesses to impute dropout even ts [ 44 ]. MA GIC first calculates the cell-cell Euclidean distance matrix and constructs a cell-cell affinit y matrix using a Gaussian kernel [ 44 ]. The affinit y matrix is then normalized using ro w normalization to obtain a Mark ov transition matrix, which represen ts the transition probabilities b etw een cells [ 44 ]. The pro cess of calculating the Mark ov matrix is repeated multiple times to reduce noise and k eep the biological signal [ 44 ]. Finally , the imputed gene expression matrix is obtained b y multiplying the final Mark ov transition matrix with the observed gene expression matrix [ 44 ]. scT sI is a 2-stage smo othing-based imputation method that first imputes the zero expres- sion v alues using the information of neigh b oring cells and genes, and then adjusts the imputed v alues using ridge regression [ 43 , 87 ]. In the first stage, scT sI imputes the zero expression v alues by calculating an av erage of the expression v alues from nearest neigh b or cells and nearest neighbor genes [ 43 ]. In the second stage, scT sI refines the imputed v alues by fitting a ridge regression model that predicts the expression v alue of eac h gene in eac h cell based on the expression v alues of other genes in the same cell and the same gene in other cells [ 43 ]. While MAGIC diffuses gene expression v alues equally across all genes, A cImpute applies different diffu- sion strengths for highly and lowly expressed genes based on the observ ation that drop out even ts are more prev alent in lo wly expressed genes [ 42 ]. A cImpute first nor- malizes, selects highly v ariable genes, and reduces dimensionalit y using principal comp onen t analysis (PCA) [ 42 , 88 ]. Similar to MA GIC, AcImpute then constructs a cell-cell affinit y matrix using k -nearest neighbor ( k -NN)-based adaptiv e k ernel, and obtains a Marko v transition matrix through row normalization [ 42 ]. In addi- tion, AcImpute calculates the p o wer matrix, a lo cally a veraged diffusion op erator, b y a veraging the normalized matrix ov er its neigh b oring cells to capture av erage gene expression patterns across neighboring cells [ 42 ]. Finally , A cImpute combines the Marko v transition matrix, the p o wer matrix, and the observ ed gene expression matrix to create a mo dified Mark ov transition matrix [ 42 ]. • L ow-r ank Matrix-b ase d Metho ds: Low-rank matrix-based metho ds are built on the idea that gene expression data often ha ve an underlying simple structure [ 45 – 47 ]. Sp ecifically , these methods assume that the true gene expression matrix can b e well- appro ximated by a matrix with low rank, meaning that the expression patterns of thousands of genes across man y cells can actually b e explained b y a small n umber of shared biological factors, such as cell t yp es or cell states [ 45 – 47 ]. In practice, scRNA- seq data contain a large n umber of zero v alues, some of which are caused by drop out ev ents rather than true absence of gene expression [ 16 ]. T o address this, the observ ed gene expression matrix can b e form ulated as X obs = X true + E ∈ R n × m , where n is the num b er of cells, m is the num b er of genes, X true is the true gene expres- sion matrix to b e estimated, and E is a sparse noise matrix that captures drop out 11 ev ents [ 45 – 47 ]. The ob jectiv e of lo w-rank matrix-based metho ds is to estimate X true b y using the low-rank structure of the gene expression data while accounting for drop out even ts represented b y E [ 45 – 47 ]. 3 representativ e low-rank matrix-based metho ds are selected in this study , i.e., PBLR [ 45 ], scLR TC [ 46 ], and WEDGE [ 47 ]. PBLR explicitly incorp orates cell heterogeneit y into the imputation pro cess [ 45 ]. It first identifies cell subpopulations b y constructing m ultiple cell-cell affinit y matri- ces and applying non-negative matrix factorization (NMF) follow ed by hierarchical clustering [ 45 ]. This step partitions the global expression matrix into more homoge- neous submatrices [ 45 ]. F or each subpopulation-sp ecific submatrix, PBLR p erforms b ounded low-rank matrix recov ery , where drop out v alues are constrained by gene- sp ecific upper b ounds estimated from observed expression levels [ 45 ]. This b ounded form ulation prev ents unrealistically large imputations and impro ves reco very accu- racy , esp ecially in heterogeneous datasets [ 45 ]. scLR TC generalizes matrix-based approac hes by mo deling scRNA-seq data as a third-order tensor, constructed using cell-cell similarit y information [ 46 ]. This tensor representation enables simultaneous mo deling of gene-gene and cell-cell correlations. scLR TC applies lo w-rank tensor completion to reco ver missing v alues, effectively denoising the data while preserv- ing higher-order structural relationships [ 46 ]. By leveraging tensor decomp osition rather than simple matrix factorization, scLR TC can b etter capture complex dep en- dencies in scRNA-seq data and improv e downstream analyses such as clustering and tra jectory inference [ 46 ]. WEDGE addresses drop out by introducing a biased lo w-rank matrix decomp osition framework [ 47 ]. Unlik e standard matrix factoriza- tion metho ds that ignore zero entries, WEDGE assigns differen t weigh ts to zero and non-zero elements in the ob jective function [ 47 ]. Non-zero entries are fitted closely to preserv e observ ed expression, while ze ro en tries are softly p enalized using a tunable bias parameter, reducing the risk of ov er-imputation [ 47 ]. T he mo del is optimized via alternating non-negativ e least squares, ensuring biologically meaning- ful imputed v alues [ 47 ]. This w eighted strategy allows WEDGE to robustly recov er expression patterns in highly sparse scRNA-seq datasets [ 47 ]. 2.3.2 DL-based Metho ds DL-based metho ds can b e broadly categorized into 4 methodological classes: diffu- sion, GAN, GNN, and AE-based metho ds. These categories and the sp ecific metho ds ev aluated in this study are describ ed b elo w. • Diffusion-b ase d Metho ds: Diffusion-based metho ds utilize diffusion mo dels [ 89 , 90 ] to mo del the underlying data distribution and impute drop out even ts in scRNA- seq data [ 48 , 49 ]. Most diffusion mo dels are built on denoising diffusion p robabilistic mo dels (DDPMs) [ 90 ] composed of 2 Mark ov pro cesses, the forward pro cess that gradually adds Gaussian noise to the data ov er multiple time steps, and the rev erse pro cess that learns to recov er the original data from the noisy input step b y step [ 90 ]. Moreo ver, conditional diffusion mo dels can align the output of the reverse denoising pro cess with the giv en conditions [ 90 ]. In this study , 2 represen tative diffusion-based metho ds are selected, i.e., scIDPMs [ 48 ] and stDiff [ 49 ]. scIDPMs identifies poten- tial dropout sites by leveraging intercellular relationships and trains a conditional 12 DDPM conditioned on the observ ed gene expression v alues [ 48 ]. T o train scIDPMs, the metho d receives the imputation target matrix as input, where it represen ts the true v alues and the p ositions of drop out even ts, and the observ ed gene expression matrix as a condition, where it shows gene expression v alues of the remaining part, and learns the parameters by adding noise to the imputation target matrix and remo ving the noise from it [ 48 ]. During the inference step of scIDPMs, the metho d receiv es the imputation target matrix with random noise as input and the observed gene expression matrix as a condition, and outputs an estimated gene expression matrix corresp onding to the imputation target matrix [ 48 ]. In contrast, stDiff uti- lizes a conditional DDPM architecture to impute spatial transcriptomics data by learning gene-gene expression relationships from reference scRNA-seq data, rather than modeling cell-cell relationships [ 49 ]. T o train stDiff, the method first aug- men ts the observed gene expression data by adding noise to enhance robustness against batch effects [ 49 ]. The augmented gene expression matrices are input to the forw ard pro cess, and the metho d adds Gaussian noise step by step [ 49 ]. The matri- ces with Gaussian noise are passed to the rev erse process, and the metho d learns to reconstruct the noised matrices into true expression v alues using the Diffusion T ransformer (DiT) [ 49 , 91 ]. During the inference step of stDiff, the metho d receiv es a random noise matrix as input, and outputs an estimated gene expression matrix [ 49 ]. stDiff is designed to impute spatial transcriptomics data [ 49 ], how ever, here stDiff is adopted for scRNA-seq data imputation to ev aluate the performance of m ulti- ple diffusion-based metho ds as diffusion-based imputation metho ds for scRNA-seq data are still limited. • GAN-b ase d Metho ds: GAN-based methods utilize GANs to learn the underly- ing distribution of scRNA-seq data and generate imputed v alues [ 51 , 54 ]. GANs are comp osed of 2 neural net works, a generator and a discriminator, that are trained in an adversarial manner [ 92 ]. The generator learns to generate realistic data sam- ples from random noise, while the discriminator learns to distinguish b et ween real and generated samples [ 92 ]. Through the training process, GANs can learn complex data distributions and generate high-quality samples [ 92 ]. Due to their ability to mo del complex data distributions, GAN-based imputation metho ds are b eing pro- p osed [ 51 , 54 ]. In this study , 2 representativ e GAN-based metho ds are included, i.e., scMultiGAN [ 51 ] and scIGANs [ 54 ]. scIGANs is designed to apply image-generating GANs to scRNA-seq data [ 54 ]. scIGANs first conv erts scRNA-seq data to gra yscale square images, which are the format accepted as input b y image-generating GANs, b y reshaping gene expression vector of a cell into a gra yscale square image [ 54 ]. The squared images are fed into a GAN and the mo del learns parameters by generating fak e samples and distinguishing b et ween the true samples and the fak e samples [ 54 ]. During the inference step of scIGANs, the metho d generates synthetic grayscale square images from the observed scRNA-seq data, selects k -NN cells of the cell to b e imputed, and imputes based on the generated image [ 54 ]. While scIGANs simply uses a single GAN to generate syn thetic cells, scMultiGAN utilizes 3 GANs to learn the complex patterns of scRNA-seq data and generate high-quality imputed v al- ues [ 51 ]. scMultiGAN p erforms scRNA-seq imputation using multiple GANs with a t wo-stage training strategy [ 51 ]. In the first stage of scMultiGAN, 2 GANs are 13 trained to learn the distribution of true expression v alues and drop out even ts sep- arately [ 51 ]. T o precisely impute drop out even ts, in the second stage, it learns the distribution of true expression v alues precisely by integrating the true expression v alues generator trained in the first stage, an additional U-Net [ 93 ]-based genera- tor, and a discriminator [ 51 ]. Finally , the generator from the second stage is used to impute drop out ev ents [ 51 ]. • GNN-b ase d Metho ds: GNN-based metho ds leverage GNNs to mo del the rela- tionships b etw een cells and impute dropout ev ents [ 53 ]. By propagating information through the graph structure, GNNs can aggregate neighborho o d-lev el features and effectiv ely capture b oth lo cal and global cellular relationships [ 94 ]. In this study , scGNN [ 53 ] is included as a representativ e GNN-based metho d. scGNN is a h yp othesis-free GNN-based metho d and it integrates 3 iterativ e multi-modal auto encoders, namely feature AE, graph AE, cluster AE, to mo del heterogeneous gene expression patterns and aggregate cell-cell relationships [ 53 ]. The feature AE receiv es the regularized gene expression matrix calculated through the left-truncated mixture Gaussian (L TMG) mo del [ 95 ] as input and learns low-dimensional cell rep- resen tations b y minimizing the reconstruction loss b etw een the input and output of the AE [ 53 ]. Based on the output of the feature AE, scGNN constructs a cell-cell graph using k -NN and feeds it into the graph AE to aggregate neighborho o d-lev el features and learn enhanced cell representations [ 53 ]. The cluster AE receives the reconstructed gene expression matrix from the feature AE and an individual enco der is used for each cell cluster to b etter capture cluster-specific gene expression pat- terns, which are identified through clustering on the output of the graph AE [ 53 ]. The reconstructed gene expression matrices from an individual enco der of the clus- ter AE are concatenated, and fed in to the feature AE and graph AE in the next iteration [ 53 ]. This iterative pro cess con tinues un til conv ergence, and the final recon- structed gene expression matrix from the feature AE is used as the imputed gene expression matrix [ 53 ]. • AE-b ase d Metho ds: AE-based methods utilize AE arc hitectures to learn lo w- dimensional represen tations of scRNA-seq data and reconstruct imputed v alues [ 50 , 52 ]. AEs are enco der-decoder architectures that consist of an enco der that maps the input data to a lo w-dimensional latent represen tation, and a deco der that recon- structs the original data from the latent represen tation [ 96 , 97 ]. By training the AE to minimize the reconstruction loss, which measures the error b et ween the ground truth and reconstructed data, AEs can learn meaningful represe n tations of the input data [ 96 , 97 ]. AEs are adapted for scRNA-seq data imputation due to their ability to capture complex gene expression patterns and reconstruct drop out ev ents [ 50 , 52 ]. In this study , 2 representativ e AE-based metho ds are included, i.e., Bubble [ 52 ] and CP ARI [ 50 ]. Bubble utilizes an AE to selectively impute drop out even ts that are iden tified through statistical analysis of gene expression patterns within cell sub- p opulations [ 52 ]. Bubble consists of 2 main steps, namely iden tification of drop out ev ents, and imputation [ 52 ]. In the first step, Bubble first reduces the dimensional- it y of the observed gene expression matrix using PCA [ 88 ], divides cells into clusters using k -means clustering, and identifies drop out even ts through predefined statisti- cal rules, which state that if a gene has a high expression rate and lo w v ariation in 14 Cell T ype Annoatation D E C N P C H F F G e n e s C e l l s C l a ssi e r T rajectory Analysis U M A P 1 U M A P 2 P s e u d o t i m e 0 1 0 0 Marker Gene Analysis Clustering DE Analysis Cell Clustering C l u s t e r i n g R e s u l t C l u s t e r A v s R e s t D E A n a l y s i s DE Genes Gene A Gene C Gene D Gene G Numerical Gene Expr ession Recovery - 2 0 E r r o r ( i m p u t e d - g r o u n d t r u t h ) 2 0 a b c e f d G e n e s C e l l s U M A P 1 2 C e l l s D i m e n s i o n a l i t y R e d u c t i o n ( e . g . U M A P , t - S N E ) Clustering V isualization Fig. 2 The ov erview of downstream tasks used for b enchmarking imputation metho ds. a Numerical gene expression recovery , b cell clustering, c DE analysis, d marker gene analysis, e tra jectory analysis, and f cell type annotation. cells within a cluster, then zero expression levels of the gene in the cluster are more lik ely to b e drop out even ts [ 52 ]. In the second step, Bubble trains an AE with the ob jective of minimizing the total loss function comp osed of reconstruction loss of the AE, biological loss, which aims to recov er non-zero expression v alues, and align- men t loss, whic h aims to align the aggregated reconstructed gene expression v alues to the matc hed bulk RNA-seq data, to impute the iden tified dropout ev ents [ 52 ]. On the other hand, CP ARI combines cell partitioning with absolute and relative impu- tation strategies to effectively distinguish biological zeros from drop out even ts [ 50 ]. In the first step, CP ARI selects highly v ariable genes, and partitions cells into mul- tiple clusters using fuzzy C-means clustering [ 50 , 98 ]. Absolute imputation is done for each cell cluster b y identifying drop out ev ents from the observed gene expres- sion v alues by statistical rules, and imputing drop out even ts using an AE [ 50 ]. As absolute imputation alone may not fully identify and impute all drop out even ts, relativ e imputation is p erformed by statistical rules based on gene expression pat- terns within cell subp opulations [ 50 ]. Finally , the outputs of absolute and relative imputation are integrated to create the final imputed gene expression matrix [ 50 ]. 2.4 Do wnstream T asks The qualit y of imputed scRNA-seq data directly influences the reliability and p er- formance of computational models in downstream tasks [ 17 – 19 ]. Inaccurate or biased imputation can distort underlying biological signals, leading to misleading conclu- sions [ 17 – 19 ]. Therefore, a comprehensive ev aluation of imputation metho ds must assess not only numerical recov ery of gene expression v alues but also their impact on biologically meaningful downstream tasks [ 17 – 19 ]. In this section, as illustrated in Fig. 2 , we describ e 6 distinct do wnstream tasks used to b enc hmark imputation meth- o ds, namely numerical gene expression recov ery , cell clustering, DE analysis, marker gene analysis, tra jectory analysis, and cell type annotation. 15 • Numeric al Gene Expr ession R e c overy: Numerical gene expression reco very can b e form ulated as a regression task, in whic h the ob jective is to predict true gene expression v alues from sparsely observ ed scRNA-seq data affected b y drop out ev ents [ 17 ]. In this setting, the input consists of corrupted expression matrices where zero or near-zero v alues arise due to tec hnical dropouts, while the target outputs corresp ond to the original, uncorrupted gene expression v alues [ 36 ]. Ground truth data are obtained from real datasets where artificial dropout is in tro duced in a con trolled manner [ 17 , 19 , 36 ]. Imputation models are trained by learning a mapping from the observ ed sparse data to the complete expression space, and p erformance is quan titatively ev aluated using regression-based error metrics such as mean squared error (MSE) and mean absolute error (MAE) computed at the gene, cell, or matrix lev el [ 17 , 18 ]. • Cel l Clustering: Cell clustering can b e form ulated as an unsup ervised learning problem, where each cell is treated as an individual sample represented b y a high- dimensional gene expression v ector [ 55 ]. The ob jective is to group similar cells into clusters based on their expression profiles [ 55 ]. Since scRNA-seq data is inheren tly high-dimensional, with thousands of genes measured p er cell, dimensionality reduc- tion tec hniques, suc h as PCA [ 88 ], t-distributed sto c hastic neigh b or em b edding (t-SNE) [ 99 ], and uniform manifold approximation and pro jection (UMAP) [ 100 ], are often applied prior to clustering to reduce noise and improv e computational efficiency [ 2 ]. Cell clustering is typically p erformed as an initial downstream task and serves as a foundation for subsequent do wnstream tasks, such as marker gene analysis and cell type annotation [ 2 , 55 ]. Meaningful clusters enable the iden tifica- tion of distinct cell p opulations and cellular states, whereas inaccurate clustering can lead to misleading biological interpretations [ 2 ]. In this b enchmark, dimension- alit y reduction is performed using PCA [ 88 ], and subsequently apply the Leiden algorithm [ 21 ] for cell clustering. The Leiden algorithm is a graph-based comm u- nit y detection algorithm that op erates on a cell-cell similarity graph constructed from the scRNA-seq data and partitions cells into clusters b y optimizing modular- it y , a quality function that measures the densit y of edges within clusters compared to edges b etw een clusters [ 21 ]. • DE analysis: DE analysis can b e form ulated as a feature selection problem, in whic h the ob jectiv e is to ide n tify genes that exhibit statistically significant expression differences b et ween conditions, suc h as disease versus healthy groups or treatmen t versus con trol groups [ 2 , 30 ]. This is typically achiev ed by testing the n ull hypothesis that the expression levels of a given gene are iden tical b et w een the 2 groups [ 101 ]. DE analysis enables the iden tification of genes asso ciated with sp e- cific biological pro cesses or disease states and represents a core downstream task for linking gene expression changes to underlying biological phenomena [ 2 ]. Accu- rate identification of differen tially expressed genes (DEGs) is therefore crucial for understanding molecular mechanisms related to disease progression or treatment resp onse [ 2 ]. In this b enchmark, 2 common DE analysis metho ds are used, namely MAST [ 102 ], which is a statistical framew ork using a hurdle mo del to account for the bimo dal distribution of scRNA-seq data [ 19 , 102 ], and the Wilcoxon rank-sum 16 test [ 103 – 105 ], in order to ev aluate the p erformance and robustness of imputation metho ds across multiple DE analysis approac hes [ 19 ]. • Marker Gene A nalysis: Marker gene analysis is an application of DE analy- sis, and can be formulated as a feature selection problem, in which the ob jective is to identify genes that b est represen t each cluster of cells [ 2 , 28 ]. This task is t ypically p erformed in 2 steps. First, DE analysis is conducted to iden tify genes whose expression levels significantly differ betw een a giv en cluster and the remain- ing clusters [ 2 , 28 ]. Second, genes are ranked based on log-fold change (LFC) or test statistics deriv ed from DE analysis, and the top-ranked genes are selected as mark er genes for each cluster [ 28 ]. Marker gene analysis plays a crucial role in the in terpretation of cell clusters, as marker genes provide insigh ts in to the biological functions and identities of distinct cell p opulations [ 2 , 28 ]. A ccurate identification of marker genes enables reliable interpretation of the biological significance of cell clusters, and a deep er understanding of underlying cellular heterogeneity [ 2 , 28 ]. In this benchmark, marker gene analysis is p erformed using the Wilcoxon rank-sum test [ 103 – 105 ]-based DE analysis b et ween each cluster and the remaining clusters. • T r aje ctory Analysis: T ra jectory analysis can b e formulated as an unsup ervised laten t-structure inference task, where the ob jective is to infer con tinuous cellular progression and lineage relationships from scRNA-seq data [ 2 ]. This ordering is com- monly represented by pseudotime v alues assigned to each cell [ 2 ]. Pseudotime is a con tinuous laten t v ariable that captures the relativ e progression of cells through a biological pro cess, suc h as differentiation or developmen t [ 2 , 23 , 106 ]. Pseudotime is t ypically inferred from cell-cell relationships by measuring distances b et w een cells in the original expression space or in a reduced-dimensional represen tation [ 2 , 23 , 106 ]. T ra jectory analysis is essen tial for understanding dynamic cellular pro cesses and iden tifying k ey regulatory genes inv olv ed in these pro cesses [ 2 ]. Reliable inference of pseudotime enables the discov ery of temp oral patterns of gene expression and pro vides insights in to the mechanisms driving cellular transitions [ 2 ]. In this b enc h- mark, TSCAN [ 107 ] is used to p erform tra jectory inference. TSC AN first reduces the dimensionalit y of gene expression data using PCA, then clusters cells in the reduced space, and constructs a minim um spanning tree (MST) connecting cluster cen- ters to represent the tra jectory structure [ 107 ]. Pseudotime v alues are subsequently assigned b y pro jecting individual cells on to the nearest edge of the MST [ 107 ]. • Cel l T yp e Annotation: Cell type annotation can b e formulated as a sup ervised m ulti-class classification problem, in which inputs are gene e xpression vectors of eac h cell, and outputs are corresp onding cell type lab els [ 2 , 55 , 56 ]. The ob jectiv e of this task is to learn a mapping from gene expression vectors to cell type labels based on known cell type lab els [ 56 ]. Cell types are predefined at different lev els of gran ularity , suc h as broad cell types, e.g., T cells, B cells, and mono cytes, or fine-grained cell subt yp es, e.g., CD4 + T cells, CD8 + T cells, and regulatory T cells [ 56 , 108 ]. A typical approac h to p erform cell type annotation is to compare th e scRNA-seq data with previously annotated reference datasets using classification mo dels [ 56 ]. In this approach, a classifier is trained on a reference dataset to learn the mapping from gene expression v ectors to cell t yp e lab els, and is subsequently used to predict cell type lab els for new scRNA-seq data [ 56 ]. This task is essential 17 for the interpretation of scRNA-seq data, as it provides biological context for cells and clusters identified in the data [ 16 , 55 , 56 ]. Robust cell t yp e annotation enables researc hers to b etter understand cellular heterogeneity and the functional roles of differen t cell t yp es in biological pro cesses [ 2 , 56 ]. In this b enc hmark, scGPT [ 109 ], a foundation mo del for scRNA-seq data which supp orts cell type annotation, and 1D con volutional neural netw ork (1D-CNN) are used to ev aluate the p erformance of cell t yp e annotation across different imputation metho ds and scRNA-seq datasets. F or scGPT, the pretrained mo del released by the authors 1 , which is trained on 33 million human cells, is used, and for 1D-CNN, the mo del is trained on the training set of each dataset. 2.5 Ev aluation Measures All 15 imputation metho ds are ev aluated across 6 downstream tasks that capture b oth numerical accuracy and biological relev ance. Since each task serves a differen t analytical ob jectiv e, a single metric is insufficient to fully c haracterize performance. Therefore, task-sp ecific 15 differen t ev aluation measures are utilized to assess recon- struction qualit y , clustering consistency , statistical agreement, temp oral ordering, and classification accuracy . T ogether, these measures provide a comprehensive and fair comparison of all metho ds. • Numeric al Gene Expr ession R e c overy: The ev aluation of numerical gene expression recov ery can b e p erformed by directly comparing imputed gene expres- sion v alues with ground truth v alues or b y comparing with corresp onding bulk RNA-seq data [ 17 – 19 ]. 3 distinct ev aluation measures are used to directly ev aluate the n umerical gene expression recov ery p erformance of all 15 imputation metho ds, namely MAE, median absolute error (MedAE), log normalized difference (LND), and MSE. Each measure is computed by comparing the imputed gene expression v alues with the ground truth expression v alues. MAE is computed as the av erage of the absolute differences betw een imputed and ground truth v alues, which provides a more direct measure of av erage error [ 17 ]. MedAE is computed as the median of the absolute differences betw een imputed and ground truth v alues, which pro- vides a similar measure as MAE without outliers [ 17 ]. LND is calculated as the log-transformed difference betw een imputed and ground truth v alues, which allows assessmen t of ov er- or under-imputation [ 17 ]. MSE is calculated as the a verage of the squared differences b et ween imputed and ground truth v alues, whic h pro- vides a measure of ov erall error magnitude [ 17 , 18 ]. In addition to comparison with ground truth v alues, comparison with matc hed bulk RNA-seq data is p erformed to ev aluate the performance of imputation metho ds in reco vering gene expression patterns [ 19 ] with 2 distinct ev aluation measures, namely pseudo-bulk correlation co efficien t (PCC) and median correlation coefficient (MCC). PCC measures the cor- relation b et ween pseudo-bulk expression v alues, calculated by av eraging imputed gene expression v alues across all cells, and bulk RNA-seq expression v alues [ 19 ]. MCC measures the median correlation b et w een imputed gene expression v alues of individual cells and bulk RNA-seq expression v alues [ 19 ]. Both measures are 1 https://gith ub.com/bowang- lab/scGPT 18 calculated using Sp earman’s rank correlation coefficient (SCC) [ 110 ]. f ( x ) = MAE = 1 N P N i =1 | ˆ y i − y i | MedAE = median {| ˆ y i − y i |} N i =1 LND = ( log 2 ( ˆ y i − y i + 1) if ˆ y i − y i ≥ 0 − log 2 ( − ˆ y i + y i + 1) if ˆ y i − y i < 0 MSE = 1 N P N i =1 ( ˆ y i − y i ) 2 PCC = SCC ( ˆ y pseudo-bulk , y bulk ) MCC = median { SCC ( ˆ y i , y bulk ) } N i =1 (1) Here, N is the total n umber of imputed en tries, ˆ y i is the imputed expression v alue of the i -th cell, and y i is the corresponding ground truth expression v alue. ˆ y pseudo-bulk is the pseudo-bulk expression v alues calculated by a veraging imputed gene expression v alues across all cells, and y bulk is the matched bulk RNA-seq expression v alues [ 19 ]. SCC is caluculated as SCC(X, Y) = 1 − 6 P N i =1 D 2 N ( N 2 − 1) , where N is the total num b er of genes, and D is the difference b et ween the ranks of the given 2 v ariables X and Y [ 19 ]. • Cel l Clustering: 4 distinct ev aluation measures are used to ev aluate cell clus- tering p erformance, namely adjusted rand index (ARI) [ 111 ], normalized mutual information (NMI), purity , and silhouette co efficien t (SC) [ 17 – 19 ]. ARI measures the similarity b et ween 2 clustering results by considering all pairs of cells and count- ing pairs that are assigned in the same or different clusters in the clustering results of imputed data and ground truth data [ 17 – 19 ]. NMI measures the mutual dep en- dence b et ween the clustering results of imputed data and ground truth data [ 17 ]. Purit y measures clustering quality b y quantifying ho w homogeneous eac h predicted cluster is with resp ect to ground truth lab els [ 17 ]. SC measures clustering quality b y quantifying cohesion within clusters and separation b etw een clusters [ 17 , 18 ]. f ( x ) = ARI = P ij ( n ij 2 ) − h P i ( a i 2 ) P j ( b j 2 ) i / ( n 2 ) 1 2 h P i ( a i 2 ) + P j ( b j 2 ) i − h P i ( a i 2 ) P j ( b j 2 ) i / ( n 2 ) NMI = I ( X ; Y ) √ H ( X ) H ( Y ) Purit y = 1 n P K k =1 max j | c k ∩ t j | SC = b ( i ) − a ( i ) max { a ( i ) ,b ( i ) } (2) Here, for ARI, n is the total n umber of cells, i and j are cluster indices in the cluster- ing results of imputed data and ground truth data, resp ectiv ely , n ij is the n umber of cells in b oth cluster i and cluster j , a i = P j n ij , and b j = P i n ij . F or NMI, X and Y are the cluster assignments from the clustering results of imputed data and ground truth data, resp ectiv ely , I ( X ; Y ) is the mutual information b et ween X and Y , and H ( X ) and H ( Y ) are the entropies of X and Y , resp ectiv ely . F or purit y , n is 19 the total num b er of cells, K is the num b er of predicted clusters, c k is the set of cells in predicted cluster k , and t j is the set of cells in ground truth cluster j . F or SC, a ( i ) is the av erage distance b etw een cell i and all other cells in the same cluster, and b ( i ) is the minimum av erage distance b et w een cell i and all cells in other clusters. • DE analysis: 2 distinct ev aluation measures are used to ev aluate DE analysis p er- formance, namely intersection o ver union (IoU) and false positive DEG (FPDEG). IoU measures the o verlap b et ween the sets of genes in the 2 different groups, e.g., DEGs iden tified from imputed scRNA-seq data and from the corresp onding bulk RNA-seq data. FPDEG measures the num b er of genes identified as DEGs that are not true DEGs. f ( x ) = ( IoU = | G A ∩ G B | | G A ∪ G B | FPDEG (3) Here, G A and G B are the sets of genes in groups A and B, resp ectiv ely . • Marker Gene A nalysis: The ev aluation is done qualitatively through visual insp ection of marker gene expression distributions and cell type separation. Vio- lin plots are used to compare the distribution of known mark er gene expression lev els across cell types, which assess whether imputed data retain exp ected cell- t yp e-sp ecific enrichmen t patterns. In addition, UMAP visualizations are used to ev aluate whether imputed data pro duce clear separation of distinct cell t yp es in lo w-dimensional space. Heatmaps of mark er gene expression v alues across cell types further complemen t this ev aluation b y illustrating whether imputation metho ds reco ver distinct expression signatures for each cell t yp e. T ogether, these visualiza- tions assess the degree to whic h eac h imputation method preserves the biological signal encoded in established marker genes. • T r aje ctory Analysis: 2 distinct ev aluation metrics are used to ev aluate tra jec- tory analysis p erformance, namely pseudo-temp oral ordering score (POS) [ 18 , 107 ] and Kendall’s rank correlation co efficien t (KR CC) [ 18 , 112 ]. POS is calculated by summing scores that characterize how well the inferred cell ordering matches the exp ected ordering based on external information. KRCC is computed to measure the correlation b et ween the inferred pseudotime v alues and the true cell developmen t lab els. f ( x ) = ( Pseudo-temp oral Ordering Score (POS) = P n − 1 i =1 P n j >i g ( i, j ) Kendall’s Rank Correlation Co efficien t (KRCC) = 4 C n ( n − 1) − 1 (4) Here, n is the num b er of cells, and g ( i, j ) is a score that c haracterizes ho w w ell the order of the i -th and j -th cells in the ordered path matches their exp ected order based on the external information [ 18 , 107 ], and C is the num b er of concordan t pairs [ 18 , 112 ]. See Ji and Ji [ 107 ] for a detailed definition of g ( i, j ) . • Cel l T yp e Annotation: 4 distinct ev aluation measures are used to ev aluate cell type annotation p erformance, namely macro accuracy (ACC), macro precision (PR), macro recall (RC), and macro F1 score (F1). Each measure is computed using a macro-a veraging approach to ensure equal w eighting for all cells irresp ectiv e of their types. ACC is calculated as the av erage of individual accuracy scores across all cells. F or a single cell, accuracy is computed as the ratio of correctly predicted 20 samples to the total samples in that cluster. PR is calculated as the av erage of the ratio of true p ositiv es to total predicted p ositiv es for each cell, with single-cell PR computed as true positives divided by predicted positives. RC is the a verage of the ratio of true p ositiv es to total actual p ositives for eac h cell, with single-cell R C com- puted as true p ositives divided by actual p ositiv es. F1 is the harmonic mean of PR and RC, calculated across all cells. F or individual cells, the F1 is computed as the harmonic mean of that cell’s PR and R C. f ( x ) = A CC = 1 n P n i =1 TP i +TN i TP i +TN i +FP i +FN i PR = 1 n P n i =1 TP i TP i +FP i R C = 1 n P n i =1 TP i TP i +FN i F1 = 1 n P n i =1 2PR i RC i PR i +RC i (5) Here, n is the num b er of cells, and for each cell i , TP i , TN i , FP i , and FN i denote the num b ers of true positive, true negative, false p ositiv e, and false negative cell t yp e annotations compared to ground truth cell t yp e annotations, resp ectively . 2.6 Exp erimen tal Setup Our b enc hmarking framew ork is implemented using Python and R. After collecting datasets, each real dataset is formatted into a anndata [ 113 ] ob ject, which is a widely used sparse matrix format for scRNA-seq data in Python. Simulated datasets are generated using the Splatter [ 84 ] pac k age in R. Data imputation metho ds are imple- men ted based on their original implemen tations pro vid ed by the method authors, and run with default hyperparameters except for scIDPMs [ 48 ] and scMultiGAN [ 51 ], whose hyperparameters are adjusted to utilize GPU acceleration. Downstream tasks are p erformed using the Scanpy [ 105 ] pack age in Python, except for DE analysis whic h is p erformed using the MAST [ 102 ] and limma [ 114 ] pack age in R, tra jectory analy- sis which is p erformed using the TSCAN [ 107 ] pagk age in R, and cell type annotation whic h is p erformed using the scGPT [ 109 ] pac k age in Python and 1D-CNN imple- men ted with PyTorch [ 115 ] pac k age in Python. The ev aluation metrics are calculated on top of the scikit-learn [ 116 ] pack age in Python. All visualizations are created using the ggplot2 [ 117 ] pack age in R. 3 Results 3.1 Numerical Gene Expression Recov ery Fig. 3 represents the distribution of LND v alues b et ween imputed and ground truth expression v alues for 15 imputation metho ds in terms of 26 real and 4 simulated datasets. The width of each violin plot represen ts the densit y of LND v alues, and the b o x plot sho ws the median and interquartile range (IQR) of LND v alues. LND = 0 indicates that all imputed expression v alues are identical to the ground truth v alues, LND > 0 indicates o ver-imputation, where the imputed v alues are greater than the 21 b l a d d e r ( M i c r o w e l l - s e q ) r n a m i x _ s o r t s e q ( S o r t - s e q ) s i m u l a t e d _ 1 ( S i m u l a t e d ) s i m u l a t e d _ 2 ( S i m u l a t e d ) s i m u l a t e d _ 3 ( S i m u l a t e d ) s i m u l a t e d _ 4 ( S i m u l a t e d ) r o m a n o v ( D r o p - s e q ) s c _ d r o p s e q ( D r o p - s e q ) u s o k i n ( S T R T - S e q ) z e i s e l ( S T R T - S e q ) b a r o n ( i n D r o p ) e n c o d e _ fl u i d i g m _ 5 c l ( F l u i d i g m C 1 ) s c _ c e l s e q 2 _ 5 c l _ p 1 ( C E L - s e q 2 ) h c c ( S M A R T - s e q 2 ) p e t r o p o u l o s ( S M A R T - s e q 2 ) c h u _ c e l l _ t y p e ( S M A R T - s e q ) c h u _ t i m e _ c o u r s e ( S M A R T - s e q ) c h e n ( D r o p - s e q ) g u o ( 1 0 x C h r o m i u m ) i t c ( 1 0 x C h r o m i u m ) h c a _ 1 0 x _ t i s s u e ( 1 0 x C h r o m i u m ) c e l l m i x 1 ( C E L - s e q 2 ) r n a m i x _ c e l s e q 2 ( C E L - s e q 2 ) s c _ c e l s e q 2 ( C E L - s e q 2 ) a d _ c a s e ( 1 0 x C h r o m i u m ) j u r k a t ( 1 0 x C h r o m i u m ) 2 9 3 t ( 1 0 x C h r o m i u m ) p b m c 4 k ( 1 0 x C h r o m i u m ) s c _ 1 0 x ( 1 0 x C h r o m i u m ) s c _ 1 0 x _ 5 c l ( 1 0 x C h r o m i u m ) - 2 - 1 0 1 2 - 2 . 5 0 . 0 2 . 5 5 . 0 7 . 5 - 4 0 4 - 4 0 4 - 4 0 4 8 - 8 - 4 0 4 - 2 0 2 4 - 2 . 5 0 . 0 2 . 5 5 . 0 7 . 5 - 1 0 - 5 0 5 1 0 - 2 0 2 4 - 2 - 1 0 1 2 - 1 0 - 5 0 5 1 0 - 2 0 2 4 6 - 1 0 - 5 0 5 1 0 - 1 0 - 5 0 5 1 0 - 1 0 - 5 0 5 1 0 1 5 - 5 0 5 1 0 - 2 0 2 - 2 - 1 0 1 2 3 - 2 - 1 0 1 2 - 2 . 5 0 . 0 2 . 5 - 2 0 2 4 - 2 0 2 4 - 2 0 2 4 6 - 1 0 1 - 2 0 2 - 2 0 2 4 6 - 2 - 1 0 1 2 - 2 . 5 0 . 0 2 . 5 - 2 0 2 4 6 B u b b l e C P A R I s c G N N s c I G A N s s c M u l t i G A N s t D i f f s c I D P M s W E D G E s c L R T C P B L R M A G I C s c T s I A c I m p u t e s c I m p u t e P b I m p u t e M a s k e d B u b b l e C P A R I s c G N N s c I G A N s s c M u l t i G A N s t D i f f s c I D P M s W E D G E s c L R T C P B L R M A G I C s c T s I A c I m p u t e s c I m p u t e P b I m p u t e M a s k e d B u b b l e C P A R I s c G N N s c I G A N s s c M u l t i G A N s t D i f f s c I D P M s W E D G E s c L R T C P B L R M A G I C s c T s I A c I m p u t e s c I m p u t e P b I m p u t e M a s k e d B u b b l e C P A R I s c G N N s c I G A N s s c M u l t i G A N s t D i f f s c I D P M s W E D G E s c L R T C P B L R M A G I C s c T s I A c I m p u t e s c I m p u t e P b I m p u t e M a s k e d B u b b l e C P A R I s c G N N s c I G A N s s c M u l t i G A N s t D i f f s c I D P M s W E D G E s c L R T C P B L R M A G I C s c T s I A c I m p u t e s c I m p u t e P b I m p u t e M a s k e d Fig. 3 Distribution of LND betw een imputed and ground truth expression v alues for eac h imputation method. The x-axis represents LND v alues, and the y-axis represents different imputation metho ds. 22 b a c d f e 1 0 0 1 0 1 1 0 2 1 0 3 1 0 4 1 0 5 Ma ske d Pb I mp u t e scI mp u t e AcI mp u t e scT sI MAG I C PBL R scL R T C W ED G E scI D PMs st D i f f scMu l t i G AN scI G AN s scG N N C P AR I Bu b b l e M A E 1 0 - 1 1 0 0 1 0 1 1 0 2 1 0 3 1 0 4 Ma ske d Pb I mp u t e scI mp u t e AcI mp u t e scT sI MAG I C PBL R scL R T C W ED G E scI D PMs st D i f f scMu l t i G AN scI G AN s scG N N C P AR I Bu b b l e M e d A E MAE Me d AE 1 0 x C h ro mi u m C EL -se q 2 SMAR T -se q / SMAR T -se q 2 D ro p -se q O t h e rs Si mu l a t e d Ma ske d Pb I mp u t e scI mp u t e AcI mp u t e scT sI MAG I C PBL R scL R T C W ED G E scI D PMs st D i f f scMu l t i G AN scI G AN s scG N N C P AR I Bu b b l e Ma ske d Pb I mp u t e scI mp u t e AcI mp u t e scT sI MAG I C PBL R scL R T C W ED G E scI D PMs st D i f f scMu l t i G AN scI G AN s scG N N C P AR I Bu b b l e 1 0 0 1 0 1 1 0 2 1 0 0 1 0 1 1 0 2 1 0 3 1 0 2 1 0 2 . 5 1 0 3 1 0 3 . 5 1 0 4 1 0 4 . 5 1 0 - 0 . 5 1 0 0 1 0 0 . 5 1 0 1 1 0 1 . 5 1 0 2 1 0 2 . 5 1 0 2 1 0 3 1 0 4 1 0 5 1 0 1 1 0 1 . 5 1 0 2 1 0 2 . 5 1 0 3 E r r o r a d _ ca se j u rka t 2 9 3 t p b mc4 k sc_ 1 0 x sc_ 1 0 x_ 5 cl g u o i t c h ca _ 1 0 x_ t i ssu e ce l l mi x1 rn a mi x_ ce l se q 2 sc_ ce l se q 2 sc_ ce l se q 2 _ 5 cl _ p 1 h cc p e t ro p o u l o s ch u _ ce l l _ t yp e ch u _ t i me _ co u rse ch e n ro ma n o v sc_ d ro p se q u so ki n ze i se l b a ro n e n co d e _ fl u i d i g m_ 5 cl b l a d d e r rn a mi x_ so rt se q si mu l a t e d _ 1 si mu l a t e d _ 2 si mu l a t e d _ 3 si mu l a t e d _ 4 0 . 5 9 0 . 6 0 0 . 5 6 0 . 5 9 0 . 6 0 0 . 4 6 0 . 5 8 0 . 4 3 - 0 . 3 5 0 . 1 2 0 . 2 3 0 . 4 5 0 . 5 9 0 . 5 9 0 . 5 9 0 . 4 6 - 0 . 2 5 0 . 0 0 0 . 2 5 0 . 5 0 0 . 7 5 M a s k e d P b I m p u t e s c I m p u t e A c I m p u t e s c T s I M A G I C P B L R s c L R T C W E D G E s c I D P M s s t D i f f s c M u l t i G A N s c I G A N s s c G N N C P A R I B u b b l e P C C sc_ 1 0 x_ 5 cl 0 . 7 3 0 . 7 6 0 . 7 4 0 . 7 4 0 . 7 3 0 . 7 5 0 . 7 2 0 . 5 9 0 . 4 6 0 . 0 9 0 . 7 4 0 . 7 2 0 . 7 6 0 . 7 2 0 . 7 3 0 . 6 9 0 . 0 0 . 2 0 . 4 0 . 6 0 . 8 M a s k e d P b I m p u t e s c I m p u t e A c I m p u t e s c T s I M A G I C P B L R s c L R T C W E D G E s c I D P M s s t D i f f s c M u l t i G A N s c I G A N s s c G N N C P A R I B u b b l e P C C e n co d e _ fl u i d i g m _ 5 cl 0 . 4 3 0 . 5 6 0 . 4 7 0 . 4 3 0 . 4 5 0 . 6 4 0 . 5 0 0 . 7 2 0 . 7 1 0 . 7 1 0 . 3 0 0 . 3 3 0 . 4 4 0 . 3 4 0 . 3 2 0 . 6 0 0 . 6 1 0 . 6 2 0 . 6 1 0 . 6 2 0 . 5 4 0 . 5 6 0 . 6 0 0 . 5 9 0 . 6 0 0 . 5 0 0 . 5 0 0 . 5 0 0 . 5 0 0 . 5 0 0 . 6 3 0 . 7 0 0 . 6 7 0 . 6 3 0 . 6 6 0 . 5 1 0 . 4 4 0 . 5 6 0 . 5 6 0 . 5 7 0 . 2 6 0 . 3 5 0 . 1 7 0 . 2 5 0 . 2 5 - 0 . 0 7 - 0 . 0 8 0 . 0 9 0 . 1 6 0 . 1 3 0 . 3 9 0 . 5 3 0 . 2 9 0 . 2 7 0 . 2 3 0 . 5 4 0 . 6 2 0 . 5 9 0 . 5 8 0 . 5 7 0 . 5 6 0 . 6 1 0 . 6 1 0 . 6 0 0 . 5 0 0 . 4 2 0 . 3 8 0 . 5 1 0 . 5 0 0 . 5 1 0 . 3 5 0 . 2 7 0 . 4 9 0 . 4 6 0 . 4 9 0 . 3 4 0 . 2 5 0 . 5 4 0 . 4 7 0 . 5 8 0 . 2 8 0 . 3 1 0 . 2 5 0 . 3 2 0 . 2 8 0 . 5 1 0 . 5 5 0 . 5 3 0 . 5 4 0 . 5 1 0 . 1 4 0 . 1 5 0 . 1 4 0 . 1 4 0 . 1 2 0 . 4 6 0 . 4 9 0 . 4 4 0 . 4 6 0 . 4 1 0 . 4 9 0 . 5 2 0 . 5 0 0 . 5 0 0 . 4 8 0 . 1 4 0 . 1 4 0 . 1 4 0 . 1 4 0 . 1 4 0 . 5 5 0 . 5 9 0 . 5 5 0 . 5 7 0 . 5 3 0 . 4 3 0 . 4 4 0 . 4 2 0 . 4 3 0 . 4 2 - 0 . 1 7 - 0 . 1 8 - 0 . 1 9 - 0 . 1 7 - 0 . 1 6 0 . 1 4 0 . 0 0 0 . 0 9 0 . 0 4 0 . 0 6 - 0 . 0 4 - 0 . 0 5 - 0 . 0 3 - 0 . 0 4 - 0 . 0 1 0 . 2 7 0 . 2 8 0 . 2 8 0 . 2 7 0 . 2 7 0 . 4 7 0 . 5 0 0 . 4 5 0 . 4 9 0 . 4 2 0 . 3 7 0 . 3 9 0 . 3 7 0 . 3 8 0 . 3 5 0 . 3 4 0 . 3 6 0 . 3 4 0 . 3 3 0 . 3 0 0 . 3 3 0 . 3 1 0 . 3 5 0 . 3 0 0 . 2 6 1 0 x F l u i d i g m B u b b l e C P A R I s c G N N s c I G A N s s c M u l t i G A N s t D i f f s c I D P M s W E D G E s c L R T C P B L R M A G I C s c T s I A c I m p u t e s c I m p u t e P b I m p u t e M a s k e d A5 4 9 H 1 9 7 5 H 2 2 2 8 H 8 3 8 H C C 8 2 7 A5 4 9 G M1 2 8 7 8 H 1 I MR 9 0 K5 6 2 Fig. 4 Numerical gene expression reco very performance. a – b MAE and MedAE, resp ectiv ely . The x-axis represents differen t imputation metho ds, and the y-axis represents error v alues in a log scale. c Protocol-wise total MAE and MedAE. The x-axis represents different imputation methods, and the y-axis represen ts total error v alues in a log scale. d – e PCC. The x-axis represen ts differen t imputation methods, and the y-axis represents PCC v alues. f MCC. The x-axis represents differen t cell lines, and the y-axis represents different imputation methods. 23 ground truth v alues, and LND < 0 indicates under-imputation, i.e., the imputed v alues are less than the ground truth v alues. The comparison of LND distributions across 15 imputation metho ds in terms of 30 different datasets shows that scT sI, PBLR, and WEDGE ac hieve the b est ov erall p erformance, with medians of LND v alues consistently close to zero. This distribution indicates sup erior n umerical reco very quality and better preserv ation of the original data structure. Conv ersely , scIDPMs shows the p o orest p erformance, with a substan- tial ov er-imputation across 25 datasets. In contrast, scLR TC exhibits the strongest under-imputation in all datasets. The remaining 10 metho ds, including PbImpute, scImpute, AcImpute, MA GIC, stDiff, scMultiGAN, scIGANs, scGNN, CP ARI, and Bubble, sho w mo derate p erformance. Proto col-wise analysis of LND distributions is essential b ecause proto cols differ in sparsit y , noise, and drop out c haracteristics, whic h directly affect imputation b eha vior. A cross 5 proto cols, WEDGE maintains LND v alues closest to zero with compact distri- butions, which indicates stable reconstruction and superior preserv ation of the original data structure. In con trast, scIDPMs frequen tly exhibits positive LND shifts, which reflect systematic ov er-imputation. Con versely , scLR TC consistently demonstrates under-imputation in all proto cols. Proto cols based on full-length sequencing, includ- ing SMAR T-seq, SMAR T-seq2, and Fluidigm C1, show greater v ariability ov erall. All metho ds displa y broader or bimo dal distributions, and none achiev e mo de or median LND v alues close to zero. These patterns suggest increased difficulty for accurate imputation. The remaining metho ds exhibit in termediate, dataset-dep enden t b eha vior with mo derate deviations around zero. Collectively , these findings highligh t WEDGE as the most protocol-robust approac h, while revealing distinct proto col-dependent biases for comp eting metho ds. Figs. 4 a and b represent the box plots for MAE and MedAE b etw een imputed and ground truth expression v alues for 15 imputation metho ds in terms of 26 real and 4 sim ulated datasets. MAE sho ws the ov erall p erformance of the metho ds considering outliers, while MedAE shows the ov erall p erformance of the metho ds without outliers. Lo wer MAE and MedAE v alues indicate b etter reco very performance, as they suggest that the imputed expression v alues are closer to the ground truth v alues. A thorough analysis of MAE and MedAE among the 15 im putation methods rev eals that scT sI and WEDGE exhibit the lo west MAE and MedAE. In addition, 12 metho ds, namely PbImpute, scImpute, AcImpute, MAGIC, PBLR, scLR TC, stDiff, scMultiGAN, scIGANs, scGNN, CP ARI, and Bubble, sho w mo derate results, which are similar to the p erformance using the mask ed baseline. On the other hand, scIDPMs sho ws the worst MAE and MedAE. Fig. 4 c sho ws total MAE and total MedAE across all datasets for each imputation metho d. WEDGE sho ws the b est MAE across 5 proto cols, namely 10x Chromium, CEL-seq2, SMAR T-seq2, SMAR T-seq, and Drop-seq. Similarly , WEDGE sho ws the b est MedAE across 3 proto cols, namely 10x Chromium, CEL-seq2, and Drop-seq. On the other hand, scIDPMs and scIGANs exhibit the highest MAE and MedAE as their v alues significantly exceed the mask ed baseline for all proto cols. Figs. 4 d and e sho w PCC b etw een pseudo-bulk and the corresp onding bulk RNA- seq data for 15 imputation metho ds in terms of 2 cell line datasets, namely sc_10x_5cl 24 and enco de_fluidigm_5cl. A higher PCC indicates that pseudo-bulk data is highly correlated with the corresponding bulk RNA-seq data. The comparison of PCC across the 15 metho ds shows that AcImpute, WEDGE, and CP ARI achiev e the b est p erfor- mance. In addition, 10 metho ds, namely PbImpute, scImpute, scT sI, MAGIC, PBLR, scLR TC, scIDPMs, stDiff, scGNN, and Bubble, sho w mo derate p erformance. On the other hand, scMultiGAN and scIGANs show the worst p erformance. Fig. 4 f shows MCC b etw een imputed scRNA-seq data and the corresp onding bulk RNA-seq data at the cell line level for 15 imputation metho ds in terms of 2 cell line datasets, namely sc_10x_5cl and enco de_fluidigm_5cl. A higher MCC indicates that imputed scRNA-seq data is highly correlated with the corr esp ond- ing bulk RNA-seq data. The comparison of MCC across the 15 metho ds shows that MA GIC and WEDGE ac hieve the b est performance. In addition, 10 metho ds, namely PbImpute, scImpute, AcImpute, scT sI, PBLR, scLR TC, stDiff, scGNN, CP ARI, and Bubble, sho w mo derate p erformance. On the other hand, scIDPMs, scMultiGAN, and scIGANs sho w the w orst p erformance. In summary , for comparison with ground truth data, scT sI, PBLR, and WEDGE sho w the b est o verall performance, while scLR TC, scIDPMs, and scIGANs show the w orst p erformance. F urthermore, imputation qualit y is protocol dep enden t, as meth- o ds show largely consistent b eha vior on 10x Chromium, CEL-seq2, and Drop-seq datasets, whereas SMAR T-seq, SMAR T-seq2, and Fluidigm C1 datasets demonstrate higher instabilit y , characterized by sy stematic ov er- or under-imputation across the 15 imputation metho ds. These metho ds tend to struggle with SMAR T-seq, SMAR T- seq2, and Fluidigm C1 datasets b ecause these datasets are generated only using read-coun ts, whereas other datasets use unique molecular identifiers (UMIs) [ 17 ]. The absence of UMIs can lead to duplicate read counts in the scRNA-seq data, which results in increased technical noise in the data [ 17 ]. F or comparison with bulk RNA-seq data, WEDGE ac hieves the b est ov erall p erformance. On the other hand, scMulti- GAN shows p o or correlation with bulk RNA-seq data at b oth the pseudo-bulk and cell line lev els, despite its mo derate numerical recov ery of ground truth data. This sug- gests that comparable ground truth recov ery do es not necessarily translate to faithful agreemen t with bulk RNA-seq data. 3.2 Cell Clustering Fig. 5 a represen ts ARI of cell clustering based on the imputed and ground truth data for the 15 imputation metho ds in terms of 26 real and 4 simulated datasets. Par- ticularly , it demonstrates the consistency b etw een cell clustering using imputed and ground truth data. ARI = 1 shows clusters match p erfectly , ARI = 0 sho ws cell clus- tering p erformance is equiv alen t to randomly assigning clusters, and ARI < 0 sho ws cell clustering p erformance is worse than randomly assigning clusters. Out of 15 dis- tinct imputation metho ds, scLR TC exhibits the highest ARI scores in 13 datasets. In addition, 12 methods, namely PbImpute, scImpute, A cImpute, scT sI, MA GIC, WEDGE, scIDPMs, scMultiGAN, scIGANs, scGNN, CP ARI, and Bubble, sho w mo d- erate ARI scores. On the other hand, PBLR and stDiff show the lo w est ARI scores for 8 datasets. Moreov er, for 12 datasets, including sc_10x_5cl, hca_10x_tissue, cellmix1, sc_celseq2, hcc, p etrop oulos, ch u_time_course, chen, romanov, usokin, zeisel, and 25 bladder rnamix_sor tseq simulated_1 simulated_2 simulated_3 simulated_4 romanov sc_dropseq usokin zeisel baron encode_fluidigm_5cl sc_celseq2_5cl_p1 hcc petropoulos chu_cell_type chu_time_course chen guo itc hca_10x_tissue cellmix1 rnamix_celseq2 sc_celseq2 0.2 0.4 0.6 0.8 0.00 0.25 0.50 0.75 0.2 0.4 0.6 0.3 0.5 0.7 0.9 0.00 0.02 0.04 0.6 0.8 1.0 0.0 0.2 0.4 0.6 0.2 0.4 0.6 0.8 0.25 0.50 0.75 0.0 0.2 0.4 0.6 0.2 0.4 0.6 0.0 0.1 0.2 0.3 0.4 0.5 0.25 0.50 0.75 0.25 0.50 0.75 0.00 0.25 0.50 0.75 1.00 0.1 0.2 0.3 0.2 0.4 0.6 0.2 0.4 0.6 0.8 0.0 0.2 0.4 0.6 0.00 0.25 0.50 0.75 1.00 0.0 0.1 0.2 0.3 0.4 0.0 0.2 0.4 0.6 0.0 0.2 0.4 0.6 0.8 0.2 0.4 0.6 0.0 0.2 0.4 0.6 0.8 ad_case jurkat 293t pbmc4k sc_10x sc_10x_5cl 0.0 0.2 0.4 0.6 0.8 0.2 0.4 0.6 0.0 0.2 0.4 0.6 0.8 0.2 0.4 0.6 0.8 0.2 0.4 0.6 ARI a bladder r namix_sortseq simulated_1 simulated_2 simulated_3 simulated_4 romanov sc_dropseq usokin zeisel baron encode_fluidigm_5cl sc_celseq2_5cl_p1 hcc petropoulos chu_cell_type chu_time_course chen guo itc hca_10x_tissue cellmix1 rnamix_celseq2 sc_celseq2 0.0 0.1 0.2 0.3 0.0 0.1 0.2 0.3 0.0 0.1 0.2 0.3 0.4 0.0 0.2 0.4 0.6 0.0 0.1 0.2 0.3 0.1 0.2 0.3 0.4 −0.1 0.0 0.1 0.2 0.3 0.4 0.0 0.1 0.2 0.3 0.4 0.5 0.0 0.1 0.2 0.3 0.0 0.1 0.2 0.3 0.0 0.1 0.2 0.3 0.4 0.5 0.0 0.1 0.2 0.3 0.0 0.2 0.4 0.0 0.1 0.2 0.3 0.0 0.1 0.2 0.3 0.0 0.1 0.2 0.3 0.4 0.0 0.1 0.2 0.3 0.0 0.1 0.2 0.3 0.0 0.1 0.2 0.3 0.0 0.1 0.2 0.3 0.4 0.0 0.1 0.2 0.3 0.4 0.0 0.1 0.2 0.0 0.1 0.2 0.3 0.4 0.0 0.2 0.4 0.6 0.8 0.0 0.1 0.2 0.3 ad_case jurkat 293t pbmc4k sc_10x sc_10x_5cl 0.0 0.1 0.2 0.3 0.4 0.0 0.1 0.2 0.0 0.2 0.4 0.6 0.0 0.1 0.2 0.3 0.4 0.0 0.1 0.2 0.3 0.4 Silhouette b Masked PbImpute scImpute AcImpute scTsI MA GIC PBLR scLR TC WEDGE scIDPMs stDiff scMultiGAN scIGANs scGNN CP ARI Bubble Fig. 5 Cell clustering consistency and coherency p erformance. a ARI. Each plot shows ARI scores of different imputation metho ds. Each p oin t in a plot represen ts different metho ds. The horizon tal dashed line represen ts the mask ed baseline v alue. b SC. Eac h plot sho ws SC scores of differen t imputation metho ds. Each p oint in a plot represen ts differen t metho ds. The horizon tal dashed line represents the masked baseline v alue. 26 0 1 2 3 4 5 6 7 8 9 1 0 1 1 1 2 1 3 1 4 1 5 1 6 1 7 1 8 1 9 2 0 2 1 2 2 2 3 2 4 2 5 ad_c as e (10x C hrom ium ) W ED G E s c I D PM s s t D i f f s c M u l t i G AN s c I G AN s s c G N N C PAR I Bu b b l e w e d g e _ b a c k u p G r o u n d T r u t h M a s k e d Pb I m p u t e s c I m p u t e Ac I m p u t e s c T s I M AG I C PBL R s c L R T C s c _c els eq2_5 c l_p1 (C EL-s eq2) W ED G E s c I D PM s s t D i f f s c M u l t i G AN s c I G AN s s c G N N C PAR I Bu b b l e w e d g e _ b a c k u p G r o u n d T r u t h M a s k e d Pb I m p u t e s c I m p u t e Ac I m p u t e s c T s I M AG I C PBL R s c L R T C pet ropoulos (SM AR T -s eq2) W ED G E s c I D PM s s t D i f f s c M u l t i G AN s c I G AN s s c G N N C PAR I Bu b b l e w e d g e _ b a c k u p G r o u n d T r u t h M a s k e d Pb I m p u t e s c I m p u t e Ac I m p u t e s c T s I M AG I C PBL R s c L R T C rom anov (D rop-s eq) W ED G E s c I D PM s s t D i f f s c M u l t i G AN s c I G AN s s c G N N C PAR I Bu b b l e w e d g e _ b a c k u p G r o u n d T r u t h M a s k e d Pb I m p u t e s c I m p u t e Ac I m p u t e s c T s I M AG I C PBL R s c L R T C Fig. 6 UMAP visualization of the cell clustering using 4 real datasets with differen t protocols. Eac h plot shows the UMAP visualization of the metho d. Different colors represent different clusters. 27 0 1 2 3 4 5 6 7 8 9 1 0 1 1 1 2 1 3 1 4 1 5 s im ulat ed_1 (Sim ulat ed) W ED G E s c I D PM s s t D i f f s c M u l t i G AN s c I G AN s s c G N N C PAR I Bu b b l e w e d g e _ b a c k u p G r o u n d T r u t h M a s k e d Pb I m p u t e s c I m p u t e Ac I m p u t e s c T s I M AG I C PBL R s c L R T C s im ulat ed_2 (Sim ulat ed) W ED G E s c I D PM s s t D i f f s c M u l t i G AN s c I G AN s s c G N N C PAR I Bu b b l e w e d g e _ b a c k u p G r o u n d T r u t h M a s k e d Pb I m p u t e s c I m p u t e Ac I m p u t e s c T s I M AG I C PBL R s c L R T C s im ulat ed_3 (Sim ulat ed) W ED G E s c I D PM s s t D i f f s c M u l t i G AN s c I G AN s s c G N N C PAR I Bu b b l e w e d g e _ b a c k u p G r o u n d T r u t h M a s k e d Pb I m p u t e s c I m p u t e Ac I m p u t e s c T s I M AG I C PBL R s c L R T C s im ulat ed_4 (Sim ulat ed) W ED G E s c I D PM s s t D i f f s c M u l t i G AN s c I G AN s s c G N N C PAR I Bu b b l e w e d g e _ b a c k u p G r o u n d T r u t h M a s k e d Pb I m p u t e s c I m p u t e Ac I m p u t e s c T s I M AG I C PBL R s c L R T C Fig. 7 UMAP visualization of the cell clustering using 4 simulated datasets with different drop out rates. Each plot shows the UMAP visualization of the method. Different colors represent different clusters. 28 baron, none of the 15 metho ds exceed the ARI scores of the mask ed baseline. This indicates that imputation do es not necessarily improv e cell clustering and can even degrade performance compared to using the mask ed baseline data. Fig. 5 b represents SC for the 15 imputation metho ds in terms of 26 real and 4 sim ulated datasets. SC = 1 represents cells are p erfectly assigned to highly dense and isolated clusters, SC = 0 represents cells are located at the b oundaries b et ween 2 clusters, and SC < 0 represents cells are inaccurately assigned to clusters. The comparison of SC scores among the 15 metho ds shows that MAGIC and WEDGE ac hieve the best p erformance for 9 datasets. On the other hand, PBLR sho ws the worst SC scores for 13 datasets. The remaining 12 metho ds, namely PbImpute, scImpute, A cImpute, scT sI, scLR TC, scIDPMs, stDiff, scMultiGAN, scIGANs, scGNN, CP ARI, and Bubble, show moderate SC scores. Figs. 6 and 7 represent UMAP visualization of the cell clustering for the 15 impu- tation metho ds in terms of 4 real datasets, and 4 simulated datasets, resp ectively . The datasets with the highest n umber of cells are selected from 4 protocols, includ- ing 10x Chromium, CEL-seq2, SMAR T-seq2, and Drop-seq, to p erform a qualitative ev aluation. A qualitative assessment of UMAP plots provides a visual p ersp ectiv e on cluster consistency and coherency that complemen ts the quan titative ev aluations. The comparison of cluster structures among the 15 metho ds shows that MAGIC and WEDGE pro duce the most visually coherent clusters across 4 real datasets, including sc_celseq2_5cl_p1 with small samples. On the other hand, stDiff and PBLR show the least coherent cluster structures across 4 real datasets, with clusters app earing frag- men ted or p o orly separated compared to the cell clustering based on the ground truth data. In the simulated datasets, 5 metho ds, namely PbImpute, scImpute, MAGIC, WEDGE, and scMultiGAN, main tain visually distinct clusters across 4 simulated datasets. On the other hand, the remaining 10 metho ds show limited abilit y to reco ver the cluster structure of the ground truth data. This suggests that these 10 metho ds ha ve low er robustness to dropout-induced sparsity . T ables 3 and 4 rep ort NMI and purity scores, resp ectiv ely , comparing cell clus- tering results from the imputed data with those from ground truth data across the 15 imputation metho ds for the 26 real and 4 simulated datasets. An NMI score of 1 indicates p erfect agreement b et ween the 2 clustering results, whereas 0 indicates indep endence. Similarly , a purit y score of 1 indicates that each predicted cluster con- tains cells from a single ground truth cluster, while 0 indicates complete mixing of cells from differen t ground truth clusters. The analyses of NMI and purit y scores among the 15 imputation metho ds show that these scores are largely consistent with the ARI scores, where scLR TC exhibits the b est p erformance in 13 datasets, PBLR and stDiff show the low est NMI and purity scores in 8 datasets, and the remain- ing 12 metho ds, including PbImpute, scImpute, AcImpute, scT sI, MAGIC, WEDGE, scIDPMs, scMultiGAN, scIGANs, scGNN, CP ARI, and Bubble, show mo derate NMI and purity scores. This consistency across multiple cell clustering metrics reinforces the robustness of the observed p erformance differences among the 15 metho ds. In summary , b oth quantitativ e and qualitativ e ev aluations rev eal substantial v ari- abilit y in cell clustering p erformance across the 15 imputation metho ds in terms of 26 real and 4 simulated datasets. scLR TC sho ws the b est consistency performance, 29 T able 3 NMI of cell clustering based on the imputed and ground truth expression v alues. The b old v alues in each row represen t the best performance metho ds. Dataset Masked PbImpute scImpute AcImpute scT sI MAGIC PBLR scLR TC WEDGE s cIDPMs stDiff scMultiGAN scIGANs scGNN CP ARI Bubble ad_case 0.825 0.547 0.811 0.585 0.491 0.766 0.157 0.812 0.549 0.550 0.028 0.674 0.704 0.844 0.830 0.498 jurk at 0.531 0.372 0.356 0.526 0.572 0.196 0.093 0.534 0.304 0.148 0.204 0.448 0.041 0.424 0.339 0.196 293t 0.450 0.311 0.274 0.110 0.458 0.089 0.083 0.466 0.249 0.146 0.141 0.364 0.139 0.256 0.274 0.141 pbmc4k 0.777 0.551 0.792 0.689 0.630 0.628 0.184 0.791 0.630 0.346 0.354 0.711 0.478 0.705 0.758 0.562 sc_10x 0.955 0.882 0.903 0.815 0.880 0.695 0.712 0.955 0.781 1.000 0.974 0.826 1.000 0.763 0.903 0.902 sc_10x_5cl 0.949 0.761 0.843 0.864 0.751 0.719 0.239 0.946 0.509 0.789 0.872 0.884 0.708 0.767 0.815 0.902 guo 0.780 0.447 0.772 0.305 0.530 0.687 0.257 0.793 0.545 0.480 0.122 0.620 0.788 0.738 0.786 0.642 itc 0.565 0.096 0.440 0.106 0.513 0.480 0.088 0.567 0.511 0.026 0.084 0.358 0.233 0.634 0.573 0.325 hca_10x_tissue 0.850 0.555 0.784 0.215 0.603 0.684 0.277 0.844 0.455 0.605 0.394 0.660 0.570 0.707 0.750 0.654 cellmix1 0.546 0.143 0.377 0.124 0.187 0.325 0.075 0.455 0.345 0.114 0.048 0.168 0.054 0.351 0.329 0.161 rnamix_celseq2 0.590 0.066 0.004 0.607 0.619 0.028 0.258 0.590 0.101 0.024 0.021 0.313 0.138 0.287 0.082 0.019 sc_celseq2 0.869 0.192 0.223 0.550 0.563 0.246 0.126 0.869 0.346 0.218 0.177 0.428 0.045 0.378 0.248 0.215 sc_celseq2_5cl_p1 0.696 0.384 0.599 0.091 0.741 0.816 0.309 0.696 0.744 0.140 0.351 0.220 0.001 0.744 0.675 0.653 hcc 0.792 0.203 0.509 0.079 0.310 0.536 0.043 0.724 0.475 0.095 0.084 0.420 0.152 0.569 0.566 0.301 petrop oulos 0.788 0.425 0.382 0.146 0.523 0.381 0.141 0.782 0.368 0.443 0.401 0.443 0.406 0.526 0.391 0.419 ch u_cell_type 0.932 0.731 0.920 0.748 0.740 0.809 0.295 0.932 0.795 0.807 0.809 0.764 0.863 0.745 0.909 0.859 ch u_time_course 0.763 0.725 0.671 0.728 0.600 0.604 0.162 0.747 0.602 0.537 0.506 0.645 0.648 0.620 0.671 0.628 chen 0.884 0.625 0.785 0.298 0.668 0.777 0.292 0.875 0.766 0.511 0.188 0.759 0.824 0.795 0.821 0.676 romanov 0.864 0.603 0.630 0.658 0.579 0.657 0.228 0.861 0.635 0.410 0.327 0.683 0.437 0.655 0.637 0.627 sc_dropseq 0.719 0.231 0.388 0.359 0.773 0.398 0.168 0.565 0.382 0.314 0.417 0.381 0.308 0.382 0.388 0.383 usokin 0.646 0.457 0.431 0.197 0.298 0.407 0.057 0.557 0.415 0.328 0.208 0.553 0.303 0.484 0.442 0.360 zeisel 0.919 0.624 0.712 0.588 0.685 0.674 0.156 0.908 0.508 0.212 0.430 0.682 0.474 0.707 0.719 0.704 baron 0.920 0.376 0.753 0.645 0.621 0.672 0.239 0.920 0.555 0.597 0.228 0.637 0.608 0.710 0.717 0.617 encode_fluidigm_5cl 0.764 0.708 0.800 0.511 0.660 0.764 0.398 0.723 0.601 0.777 0.312 0.810 0.874 0.777 0.606 0.664 bladder 0.802 0.390 0.665 0.641 0.609 0.749 0.402 0.813 0.742 0.450 0.123 0.729 0.635 0.766 0.737 0.593 rnamix_sortseq 0.593 0.219 0.082 0.156 0.788 0.026 0.275 0.593 0.169 0.273 0.033 0.553 0.181 0.286 0.102 0.026 simulated_1 0.395 0.073 1.000 0.814 0.991 0.793 0.075 0.848 0.466 0.209 0.717 0.456 0.774 0.331 0.975 0.967 simulated_2 0.074 0.079 0.707 0.128 0.975 0.602 0.052 0.031 0.475 0.045 0.181 0.153 0.217 0.175 0.630 0.539 simulated_3 0.060 0.081 0.049 0.015 0.714 0.231 0.072 0.058 0.340 0.024 0.018 0.045 0.128 0.094 0.099 0.227 simulated_4 0.026 0.037 0.015 0.012 0.055 0.048 0.015 0.016 0.059 0.023 0.010 0.030 0.044 0.033 0.024 0.111 30 T able 4 Purity of cell clustering based on the imputed and ground truth expression values. The b old v alues in each ro w represent the b est performance metho ds. Dataset Masked PbImpute scImpute AcImpute scT sI MAGIC PBLR scLR TC WEDGE scIDPMs stDiff scMultiGAN scIGANs scGNN CP ARI Bubble ad_case 0.803 0.611 0.814 0.677 0.515 0.846 0.268 0.803 0.618 0.543 0.204 0.648 0.731 0.850 0.830 0.557 jurk at 0.631 0.503 0.545 0.699 0.730 0.461 0.326 0.644 0.549 0.381 0.426 0.600 0.279 0.647 0.585 0.426 293t 0.480 0.471 0.496 0.297 0.489 0.315 0.308 0.523 0.468 0.337 0.379 0.517 0.299 0.464 0.515 0.353 pbmc4k 0.755 0.637 0.859 0.828 0.686 0.727 0.309 0.781 0.735 0.435 0.468 0.729 0.570 0.778 0.775 0.661 sc_10x 0.989 0.994 1.000 0.994 0.994 1.000 0.912 0.989 1.000 1.000 0.994 1.000 1.000 1.000 1.000 1.000 sc_10x_5cl 0.968 0.715 0.980 0.918 0.946 0.980 0.512 0.967 0.796 0.830 0.972 1.000 0.925 0.982 0.980 0.980 guo 0.776 0.464 0.776 0.327 0.478 0.744 0.275 0.784 0.573 0.413 0.220 0.506 0.739 0.728 0.806 0.574 itc 0.711 0.413 0.659 0.413 0.699 0.756 0.358 0.771 0.764 0.368 0.413 0.607 0.498 0.823 0.756 0.612 hca_10x_tissue 0.844 0.618 0.815 0.377 0.671 0.769 0.428 0.840 0.554 0.565 0.478 0.676 0.599 0.734 0.778 0.695 cellmix1 0.792 0.491 0.736 0.491 0.566 0.604 0.491 0.774 0.698 0.528 0.472 0.566 0.453 0.698 0.679 0.509 rnamix_celseq2 0.725 0.536 0.507 0.841 0.754 0.507 0.667 0.725 0.522 0.507 0.507 0.667 0.551 0.696 0.580 0.507 sc_celseq2 0.964 0.564 0.636 0.836 0.836 0.600 0.582 0.964 0.691 0.636 0.491 0.745 0.527 0.727 0.636 0.564 sc_celseq2_5cl_p1 0.881 0.695 0.831 0.390 0.847 0.932 0.627 0.881 0.898 0.458 0.644 0.508 0.322 0.898 0.864 0.831 hcc 0.902 0.338 0.656 0.300 0.477 0.708 0.232 0.861 0.610 0.296 0.262 0.510 0.339 0.737 0.658 0.445 petrop oulos 0.898 0.610 0.587 0.407 0.754 0.590 0.416 0.898 0.574 0.636 0.603 0.610 0.593 0.715 0.584 0.587 ch u_cell_type 0.971 0.883 0.971 0.907 0.907 0.966 0.566 0.971 0.937 0.971 0.937 0.922 0.937 0.932 0.966 0.966 ch u_time_course 0.882 0.824 0.824 0.869 0.804 0.824 0.464 0.876 0.824 0.804 0.699 0.817 0.817 0.824 0.824 0.810 chen 0.845 0.679 0.761 0.364 0.656 0.777 0.300 0.829 0.655 0.421 0.228 0.682 0.793 0.731 0.720 0.636 romanov 0.883 0.672 0.599 0.740 0.576 0.637 0.333 0.841 0.627 0.424 0.386 0.698 0.457 0.623 0.620 0.583 sc_dropseq 0.870 0.609 0.652 0.587 0.957 0.674 0.609 0.739 0.652 0.652 0.696 0.717 0.674 0.652 0.652 0.652 usokin 0.829 0.653 0.688 0.547 0.606 0.706 0.394 0.753 0.706 0.606 0.512 0.824 0.576 0.771 0.718 0.635 zeisel 0.960 0.700 0.765 0.689 0.717 0.805 0.349 0.955 0.607 0.388 0.498 0.764 0.566 0.802 0.785 0.777 baron 0.961 0.514 0.829 0.787 0.691 0.740 0.358 0.961 0.655 0.688 0.442 0.706 0.673 0.769 0.730 0.631 encode_fluidigm_5cl 0.904 0.863 0.877 0.699 0.808 0.863 0.616 0.890 0.781 0.890 0.562 0.863 0.959 0.863 0.671 0.685 bladder 0.705 0.383 0.593 0.639 0.546 0.755 0.409 0.789 0.720 0.413 0.252 0.664 0.647 0.729 0.656 0.622 rnamix_sortseq 0.750 0.583 0.483 0.583 0.917 0.467 0.667 0.750 0.583 0.633 0.467 0.833 0.567 0.667 0.517 0.450 simulated_1 0.680 0.330 1.000 0.935 0.998 0.927 0.360 0.935 0.670 0.540 0.865 0.710 0.917 0.593 0.993 0.990 simulated_2 0.380 0.352 0.885 0.367 0.993 0.845 0.325 0.287 0.685 0.300 0.425 0.435 0.497 0.472 0.833 0.792 simulated_3 0.335 0.362 0.323 0.258 0.890 0.537 0.330 0.335 0.625 0.270 0.273 0.305 0.388 0.385 0.398 0.520 simulated_4 0.285 0.315 0.275 0.260 0.328 0.318 0.278 0.273 0.352 0.280 0.250 0.305 0.318 0.278 0.278 0.400 31 Bulk RNA-seq DEGs Imputed DEGs IoU = 0.83 Ave. IoU = 0.78 DEG1 ⋮ DEG10 ⋮ DEG20 ⋮ DEG1000 ⋮ IoU = 0.72 IoU = 0.78 a b g1 g2 g3 g4 … Cell T ype A c1 10 18 20 30 … Cell T ype A c4 12 19 24 28 … Cell T ype A c10 14 20 22 32 … … … … … … … … Imputed data with homogeneous cell population g1 g2 g3 g4 … Cell T ype A c1 10 18 20 30 … Cell T ype A c10 14 20 22 32 … … … … … … … … g1 g2 g3 g4 … Cell T ype A c4 12 19 24 28 … Cell T ype A c18 15 20 23 30 … … … … … … … … Random Sampling DE Analysis Number of DEGs = False Positive DEGs c High LFC Genes (Bulk) g3 g4 … Low LFC Genes (Bulk) g4 g9 … g1 g2 g3 g4 … Cell Line A 10 18 20 100 … g1 g2 g3 g4 … Cell Line B 20 24 30 10 … g1 g2 g3 g4 … Cell Line A 1.00 0.41 0.58 -3.32 … Control Group (Bulk) T arget Group (Bulk) Control Group (Imputed) T arget Group (Imputed) Calculate LFC Split with High/Low LFC DEG1 ⋮ DEG10 ⋮ DEG20 ⋮ DEG1000 ⋮ Imputed DEGs IoU IoU Fig. 8 The ov erview of 3 complementary analyses of DE analysis. a DE enrichmen t analysis, b null DE analysis, and c effect size analysis. as supp orted by ARI, NMI, and purity , and MAGIC and WEDGE show the b est coherency p erformance, as supp orted by SC and UMAP visualization. Conv ersely , PBLR and stDiff show the worst results in terms of consistency and coherency . 3.3 DE analysis F ollowing Hou et al. [ 19 ], 3 different DE analyses are conducted, namely DE enrich- men t analysis, n ull DE analysis, and effect size analysis, as illustrated in Fig. 8 . The DE enric hment analysis ev aluates how well DEGs from imputed scRNA-seq data recov er DEGs identified from bulk RNA-seq data, which serv e as the ground truth DEGs. The DEGs from imputed scRNA-seq data are ranked by p v alues or LFC if there is a tie for p v alues, and the IoU b et ween the bulk RNA-seq DEGs and the top 10 i imputed DEGs is computed for i from 1 to 100. The av erage IoU across all 100 v alues of i is used to measure the p erformance. The null DE analysis assesses the robustness of imputed data to false p ositiv e DEGs. Ideally , DEGs should not b e identified when con trol and target groups belong to the same cell p opulation, and any identified DEGs can b e treated as false p ositiv e DEGs under such conditions. The imputed scRNA-seq data is filtered to a single cell t yp e or cell line to obtain a homogeneous cell p opula- tion. F rom this cell p opulation, N 1 and N 2 cells are randomly sampled as control and target groups, resp ectiv ely , where N 1 ≤ N 2 and N 1 , N 2 ∈ { 10 , 50 , 100 } . All 6 combina- tions, namely ( N 1 , N 2 ) = (10 , 10) , (10 , 50) , (10 , 100) , (50 , 50) , (50 , 100) , (100 , 100) , are tested to assess robustness across v arying sample sizes and group balances, and DE analysis is p erformed betw een the control and target groups. The n umber of false p os- itiv e DEGs is used to measure the p erformance, where a lo wer coun t indicates greater robustness. The effect size analysis ev aluates whether DEGs identified from imputed scRNA-seq data capture genes with b oth high and lo w LF C in bulk RNA-seq data. Here, LFC is defined as LFC = log 2 ( y target /y control ) , where y control and y target repre- sen t the gene expression v alues of the con trol and target groups, resp ectiv ely . Genes in the upp er and low er 10 % of the LFC distribution from bulk RNA-seq data are defined as high- and low-LF C genes, resp ectiv ely . As in the DE enrichmen t analysis, 32 the IoU is used to measure the o verlap betw een high- or lo w-LFC genes from bulk RNA-seq data and the DEGs from imputed scRNA-seq data. Figs. 9 a–c sho w the DE enric hment analysis p erformance for 15 imputation metho ds in terms of 3 datasets, namely sc_10x_5cl, enco de_fluidigm_5cl, and hca_10x_tissue. These datasets are selected on the basis of the av ailability of corre- sp onding bulk RNA-seq data. MAST [ 102 ] and the Wilcoxon rank-sum test [ 103 – 105 ] are use d to iden tify DEGs from the imputed data, and limma [ 114 ] is used to identify DEGs from the bulk RNA-seq data. The comparison of the DE enrichmen t analysis p erformance across the 15 metho ds ev aluated on the 3 datasets sho ws that AcImpute and scLR TC achiev e the b est o verall performance. In addition, 10 metho ds, namely PbImpute, scIm- pute, scT sI, MAGIC, WEDGE, scIDPMs, scIGANs, scGNN, CP ARI, and Bubble, exhibit mo derate p erformance across the 3 datasets. Conv ersely , scMultiGAN, stDiff, and PBLR show the worst p erformance on sc_10x_5cl, encode_fluidigm_5cl, and hca_10x_tissue, resp ectively . How ev er, the mask ed baseline demonstrates high IoU scores on sc_10x_5cl, and none of the 15 methods significantly outp erform it. Figs. 9 d–f sho w the n ull DE analysis performance using MAST [ 102 ] and the Wilco xon rank-sum test [ 103 – 105 ] for 15 imputation metho ds in terms of 3 datasets. The analysis of false positive DEGs in the null DE analysis sho ws that 5 metho ds, namely WEDGE, MAGIC, scIGANs, scGNN, and scMultiGAN, pro duce almost no false p ositiv e DEGs across all datasets . In addition, 9 methods, namely PbImpute, scImpute, A cImpute, scT sI, PBLR, scIDPMs, stDiff, CP ARI, and Bubble, pro duce false p ositiv e DEGs across 3 datasets. In con trast, scLR TC pro duces substantial false p ositiv e DEGs under MAST in 2 datasets, sc_10x_5cl and hca_10x_tissue. Figs. 9 g and h show the effect size analysis p erformance of high- and low-LF C genes, respectively , for 15 imputation methods using MAST [ 102 ] in sc_10x_5cl. MAST and sc_10x_5cl are selected as represen tative examples. A thorough ev alua- tion of effect size analysis performance shows that AcImpute, MAGIC, and WEDGE ac hieve the b est p erformance, with high IoU scores in b oth high- and lo w-LFC genes. In addition, 9 metho ds, namely PbImpute, scImpute, scT sI, scLR TC, scMultiGAN, scIGANs, scGNN , CP ARI, and Bubble, exhibit mo derate performance. On the other hand, PBLR, scIDPMs, and stDiff show the worst performance, with low IoU scores in high- or low-LF C genes. In summary , A cImpute achiev es the b est ov erall p erformance, as supp orted by the highest DE enric hment analysis performance across 3 datasets and the b est effect size analysis p erformance. How ever, AcImpute pro duces false p ositive DEGs under MAST in sc_10x_5cl. MAGIC, WEDGE, scMultiGAN, s cIGANs, and scGNN pro duce nearly 0 false p ositiv es across all datasets. Conv ersely , PBLR sho ws the w orst o verall p erformance, with the worst DE enric hment and effect size analysis p erformance. 3.4 Mark er Gene Analysis Fig. 10 shows mark er gene expression of 4 cell t yp es, namely T cell, B cell, natural killer (NK) cell, and mono cyte, in hca_10x_tissue for 15 distinct metho ds. Generally , CD3D and CD3E are considered to b e marker genes for T cells, CD79A and MS4A1 for B 33 AcImpute Bub b le CP ARI MA GIC Mask ed PbImpute PBLR scGNN scIDPMs scIGANs scImpute scLR TC scMultiGAN scTsI stDiff WEDGE 0.5 0.6 0.7 0.8 0.9 Wilcoxon (IoU) 0.5 0.6 0.7 0.8 0.9 MAST (IoU) sc_10x_5cl a AcImpute Bub b le CP ARI MA GIC Mask ed PbImpute PBLR scGNN scIDPMs scIGANs scImpute scLR TC scMultiGAN scTsI stDiff WEDGE 0.4 0.6 0.8 Wilcoxon (IoU) 0.4 0.6 0.8 MAST (IoU) encode_fluidigm_5cl b AcImpute Bub b le CP ARI MA GIC Mask ed PbImpute PBLR scGNN scIDPMs scIGANs scImpute scLR TC scMultiGAN scTsI stDiff WEDGE 0.0 0.2 0.4 0.6 0.8 Wilcoxon (IoU) 0.0 0.2 0.4 0.6 0.8 MAST (IoU) hca_10x_tissue c AcImpute Bub b le CP ARI MA GIC Mask ed PbImpute PBLR scGNN scIDPMs scIGANs scImpute scLR TC scMultiGAN scTsI stDiff WEDGE 0.00 0.05 0.10 0.15 0.20 Wilcoxon (FP) 0 20 40 MAST (FP) sc_10x_5cl d AcImpute Bub b le CP ARI MA GIC Mask ed PbImpute PBLR scGNN scIDPMs scIGANs scImpute scLR TC scMultiGAN scTsI stDiff WEDGE −0.050 −0.025 0.000 0.025 0.050 Wilcoxon (FP) 0 1 2 3 MAST (FP) encode_fluidigm_5cl e AcImpute Bub b le CP ARI MA GIC Mask ed PbImpute PBLR scGNN scIDPMs scIGANs scImpute scLR TC scMultiGAN scTsI stDiff WEDGE 0.00 0.05 0.10 0.15 0.20 Wilcoxon (FP) 0 20 40 MAST (FP) hca_10x_tissue f 0.86 0.90 0.93 0.86 0.94 0.96 0.90 0.97 0.94 0.96 0.85 0.88 0.92 0.85 0.93 0.95 0.89 0.96 0.93 0.96 0.85 0.91 0.92 0.87 0.94 0.96 0.90 0.97 0.95 0.96 0.87 0.91 0.92 0.88 0.94 0.95 0.90 0.96 0.95 0.96 0.85 0.88 0.92 0.85 0.93 0.95 0.89 0.96 0.93 0.96 0.83 0.90 0.92 0.85 0.94 0.96 0.90 0.97 0.95 0.96 0.56 0.71 0.62 0.67 0.32 0.74 0.35 0.78 0.52 0.85 0.82 0.84 0.89 0.81 0.90 0.94 0.84 0.94 0.91 0.93 0.66 0.80 0.80 0.74 0.72 0.72 0.57 0.82 0.76 0.81 0.66 0.78 0.83 0.73 0.82 0.83 0.75 0.87 0.85 0.87 0.85 0.91 0.91 0.85 0.94 0.96 0.90 0.97 0.94 0.96 0.84 0.90 0.92 0.84 0.94 0.95 0.88 0.96 0.94 0.96 0.81 0.88 0.91 0.83 0.92 0.89 0.78 0.94 0.86 0.94 0.77 0.80 0.88 0.79 0.91 0.94 0.84 0.95 0.93 0.95 0.59 0.67 0.75 0.59 0.69 0.74 0.56 0.83 0.68 0.83 0.85 0.90 0.91 0.87 0.95 0.96 0.91 0.96 0.95 0.96 0.92 0.91 0.92 0.92 0.91 0.92 0.61 0.88 0.74 0.80 0.92 0.91 0.88 0.88 0.69 0.92 Bubble CP ARI scGNN scIGANs scMultiGAN stDiff scIDPMs WEDGE scLRTC PBLR MAGIC scTsI AcImpute scImpute PbImpute Masked A549_H1975 A549_H2228 A549_H838 A549_HCC827 H1975_H2228 H1975_H838 H1975_HCC827 H2228_H838 H2228_HCC827 H838_HCC827 Mean sc_10x_5cl MAST , high−LFC genes g 0.67 0.56 0.49 0.56 0.32 0.35 0.32 0.43 0.34 0.37 0.38 0.28 0.27 0.26 0.06 0.06 0.08 0.12 0.13 0.21 0.63 0.46 0.44 0.53 0.31 0.31 0.20 0.35 0.26 0.30 0.67 0.51 0.47 0.56 0.36 0.38 0.33 0.46 0.35 0.39 0.37 0.26 0.28 0.26 0.04 0.03 0.06 0.12 0.11 0.18 0.46 0.28 0.33 0.37 0.12 0.16 0.13 0.30 0.20 0.25 0.42 0.36 0.31 0.43 0.09 0.26 0.07 0.37 0.21 0.31 0.32 0.28 0.25 0.28 0.19 0.16 0.15 0.18 0.17 0.20 0.34 0.30 0.24 0.31 0.03 0.03 0.01 0.08 0.03 0.04 0.52 0.41 0.37 0.44 0.32 0.35 0.29 0.45 0.27 0.40 0.53 0.49 0.44 0.46 0.38 0.38 0.11 0.36 0.26 0.39 0.24 0.37 0.33 0.27 0.26 0.26 0.05 0.43 0.20 0.36 0.53 0.45 0.38 0.46 0.36 0.38 0.33 0.46 0.30 0.41 0.49 0.45 0.36 0.42 0.39 0.00 0.01 0.08 0.30 0.48 0.03 0.02 0.03 0.06 0.00 0.01 0.00 0.01 0.02 0.01 0.72 0.58 0.56 0.66 0.43 0.36 0.34 0.50 0.38 0.49 0.44 0.19 0.38 0.45 0.17 0.26 0.28 0.22 0.14 0.38 0.38 0.28 0.41 0.30 0.02 0.50 Bubble CP ARI scGNN scIGANs scMultiGAN stDiff scIDPMs WEDGE scLRTC PBLR MAGIC scTsI AcImpute scImpute PbImpute Masked A549_H1975 A549_H2228 A549_H838 A549_HCC827 H1975_H2228 H1975_H838 H1975_HCC827 H2228_H838 H2228_HCC827 H838_HCC827 Mean sc_10x_5cl MAST , low−LFC genes h Fig. 9 DE analysis p erformance. a – c DE enrichment analysis. IoU betw een DEGs identified from imputed scRNA-seq data and bulk RNA-seq data using MAST and the Wilcoxon rank-sum test. The dashed line represents equal p erformance. Each p oin t represents an imputation metho d. d – f Null DE analysis. A verage num b er of false p ositive DEGs across 6 different sample sizes for A549 ( d ), GM12878 ( e ), and mono cyte ( f ). g – h Effect size analysis. IoU b et ween DEGs identified from imputed scRNA-seq data and high- ( g ) or lo w- ( h ) LFC genes from bulk RNA-seq data. 34 CD3D CD3E MS4A1 CD79A GNLY NKG7 CD14 LYZ Ground Truth 0.00 1.00 2.00 3.00 Masked 0.00 1.00 2.00 3.00 PbImpute 1.00 1.50 2.00 scImpute 0.00 1.00 2.00 3.00 AcImpute 0.00 1.00 2.00 3.00 scTsI 0.50 1.00 1.50 2.00 MAGIC 0.00 1.00 2.00 PBLR 0.00 0.50 1.00 1.50 2.00 2.50 scLRTC 0.00 0.00 0.00 0.00 0.00 WEDGE 0.00 0.50 1.00 1.50 2.00 scIDPMs 0.00 1.00 2.00 stDiff 0.00 0.50 1.00 1.50 2.00 scMultiGAN 0.00 0.50 1.00 1.50 2.00 scIGANs 0.50 1.00 1.50 2.00 scGNN -0.05 -0.02 0.00 0.03 0.05 CPARI 0.00 1.00 2.00 3.00 Bubble 0.00 1.00 2.00 3.00 Bcell Mono NKcell Tcell Bcell Mono NKcell Tcell Bcell Mono NKcell Tcell Bcell Mono NKcell Tcell Bcell Mono NKcell Tcell Bcell Mono NKcell Tcell Bcell Mono NKcell Tcell Bcell Mono NKcell Tcell Fig. 10 Comparison of imputation metho ds for marker gene expression in hca_10x_tissue. Violin plots show the distribution of expression levels for 8 marker genes across 4 cell types, T cell, B cell, NK cell, and mono cyte (shown as Mono). The y-axis represents gene expression v alues. 35 Masked PbImpute scImpute AcImpute scTsI MAGIC PBLR scLRTC WEDGE scIDPMs stDiff scMultiGAN scIGANs scGNN CPARI Bubble DEC EC H1 H9 HFF NPC TB a DEC EC H1 H9 HFF NPC TB Masked PbImpute scImpute AcImpute scTsI MAGIC PBLR scLRTC SLC25A5 UGP2 DNMT3B ADD2 LECT1 RAN VASH2 CYP2S1 DPPA4 PHC1 SLC25A5 UGP2 DNMT3B ADD2 LECT1 RAN VASH2 CYP2S1 DPPA4 PHC1 SLC25A5 UGP2 DNMT3B ADD2 LECT1 RAN VASH2 CYP2S1 DPPA4 PHC1 SLC25A5 UGP2 DNMT3B ADD2 LECT1 RAN VASH2 CYP2S1 DPPA4 PHC1 SLC25A5 UGP2 DNMT3B ADD2 LECT1 RAN VASH2 CYP2S1 DPPA4 PHC1 SLC25A5 UGP2 DNMT3B ADD2 LECT1 RAN VASH2 CYP2S1 DPPA4 PHC1 SLC25A5 UGP2 DNMT3B ADD2 LECT1 RAN VASH2 CYP2S1 DPPA4 PHC1 SLC25A5 UGP2 DNMT3B ADD2 LECT1 RAN VASH2 CYP2S1 DPPA4 PHC1 DEC EC H1 H9 HFF NPC TB WEDGE scIDPMs stDiff scMultiGAN scIGANs scGNN CPARI Bubble SLC25A5 UGP2 DNMT3B ADD2 LECT1 RAN VASH2 CYP2S1 DPPA4 PHC1 SLC25A5 UGP2 DNMT3B ADD2 LECT1 RAN VASH2 CYP2S1 DPPA4 PHC1 SLC25A5 UGP2 DNMT3B ADD2 LECT1 RAN VASH2 CYP2S1 DPPA4 PHC1 SLC25A5 UGP2 DNMT3B ADD2 LECT1 RAN VASH2 CYP2S1 DPPA4 PHC1 SLC25A5 UGP2 DNMT3B ADD2 LECT1 RAN VASH2 CYP2S1 DPPA4 PHC1 SLC25A5 UGP2 DNMT3B ADD2 LECT1 RAN VASH2 CYP2S1 DPPA4 PHC1 SLC25A5 UGP2 DNMT3B ADD2 LECT1 RAN VASH2 CYP2S1 DPPA4 PHC1 SLC25A5 UGP2 DNMT3B ADD2 LECT1 RAN VASH2 CYP2S1 DPPA4 PHC1 0 4 8 12 16 b Fig. 11 Mark er gene expression p erformance on chu_cell_t ype. a UMAP visualizations with 7 cell type labels, namely DEC, EC, H1, H9, HFF, NPC, and TB, colored by cell t yp e. Eac h plot represen ts an imputation method. b Heatmaps of 10 marker gene expression v alues across the 7 cell t yp es. The x-axis represents individual cells ordered by cell type, and the y-axis represents marker genes. cells, NKG7 and GNL Y for NK cells, and CD14 and L YZ for mono cytes [ 17 , 118 ]. The analysis of mark er gene expression reveals that scImpute, MA GIC, scIGANs, and CP ARI achiev e the best performance, as these metho ds sho w strong expression lev- els of mark er genes in the corresp onding cell types. In addition, 6 metho ds, namely 36 PbImpute, AcImpute, scT sI, WEDGE, scMultiGAN, and Bubble, sho w moderate p er- formance, as these metho ds show relativ ely strong expression levels of mark er genes for B cells and monocytes. Conv ersely , 5 metho ds, namely PBLR, scLR TC, scIDPMs, stDiff, and scGNN, show the worst p erformance, as they pro duce similar marker gene expression lev els across the 4 cell types or show near-zero expression lev els. Figs. 11 a and b show UMAP visualizations with cell type lab els, and marker gene expression for the 15 imputation metho ds in ch u_cell_type, resp ectiv ely . The UMAP visualizations show that 5 metho ds, namely scImpute, MAGIC, WEDGE, scIDPMs, and scMultiGAN, clearly separate 3 cell types, including EC, HFF, and NPC. In addition, 5 metho ds, namely AcImpute, scT sI, scLR TC, scIGANs, and CP ARI, sho w mo derate separation of 2 cell types, with HFF and NPC partially separated. Con- v ersely , 5 metho ds, namely PbImpute, PBLR, stDiff, scGNN, and Bubble, do not sho w clear separation, as the 7 cell t yp es are mixed together. The analysis of the mark er gene expression shows that 3 of the 5 metho ds that achiev e clear separation in the UMAP visualizations, namely scImpute, MAGIC, and WEDGE, exhibit distinct mark er gene expression patterns for 2 cell types, namely H1 and H9. In addition, 5 metho ds, namely A cImpute, scT sI, scMultiGAN, CP ARI, and Bubble, sho w mo der- ate marker gene expression patterns for H1 and H9. In contrast, 7 metho ds, including PbImpute, PBLR, scLR TC, scIDPMs, stDiff, scIGANs, and scGNN, show the worst p erformance, with no distinct mark er gene expression patterns. In summary , the marker gene analysis rev eals substantial v ariability in the abilit y of imputation metho ds to preserv e biologically meaningful gene expression patterns across the 2 datasets. scImpute and MA GIC show the b est o verall p erformance. These 2 metho ds consistently exhibit strong cell-t yp e-sp ecific marker gene expression in hca_10x_tissue and distinct expression patterns in ch u_cell_type, which is fur- ther supp orted by clear cell t yp e separation in the UMAP visualizations. scIGANs and CP ARI also p erform well in hca_10x_tissue, though their p erformance is less consisten t in c hu_cell_t yp e. Conv ersely , PBLR, stDiff, and s cGNN show the w orst results, as they pro duce indistinct marker gene expression patterns and p o or cell type separation across the 2 datasets. 3.5 T ra jectory Analysis Figs. 12 a and b sho w POS and KR CC for 15 imputation methods in terms of 2 datasets, namely p etropoulos and ch u_time_course. High POS and KRCC represent pro ximity to true cell dev elopment lab els. In each plot, p oin ts close to the dashed line represen t consistent performance across the 2 datasets. T he comparison of POS and KR CC across 15 metho ds ev aluated on 2 datasets shows that PbImpute, scImpute, scLR TC, CP ARI, and Bubble achiev e relativ ely high performance in b oth datasets. In addition, 7 metho ds, namely AcImpute, scT sI, MAGIC, PBLR, WEDGE, scMulti- GAN, and scGNN, show moderate p erformance. Conv ersely , scIDPMs and scIGANs sho w the w orst p erformance in p etropoulos dataset, while stDiff sho ws the w orst p erformance in c hu_time_course dataset. How ev er, the masked baseline shows rela- tiv ely high p erformance, and 10 metho ds, including A cImpute, scT sI, MA GIC, PBLR, WEDGE, scIDPMs, stDiff, scMultiGAN, scIGANs, and scGNN, do not exceed it. 37 petropoulos WEDGE scIDPMs stDiff scMultiGAN scIGANs scGNN CP ARI Bubble Ground T r uth Masked PbImpute scImpute AcImpute scTsI MAGIC PBLR scLRTC 3d 4d 5d 6d 7d chu_time_course WEDGE scIDPMs stDiff scMultiGAN scIGANs scGNN CP ARI Bubble Ground T r uth Masked PbImpute scImpute AcImpute scTsI MAGIC PBLR scLRTC 0h 24h 48h 72h 96h AcImpute Bubble CP ARI MAGIC Masked PbImpute PBLR scGNN scIDPMs scIGANs scImpute scLRTC scMultiGAN scTsI stDiff WEDGE 0.00 0.25 0.50 0.75 1.00 0.00 0.25 0.50 0.75 1.00 petropoulos chu_time_course POS a c b AcImpute Bubble CP ARI MAGIC Masked PbImpute PBLR scGNN scIDPMs scIGANs scImpute scLRTC scMultiGAN scTsI stDiff WEDGE − 0.5 0.0 0.5 1.0 − 0.5 0.0 0.5 1.0 petropoulos chu_time_course KRCC Fig. 12 T ra jectory analysis p erformance. a – b POS and KRCC between the inferred pseudotime from imputed data and the true cellular developmen t time lab el, resp ectively . The x-axis and y- axis represent the performance of p etropoulos and chu_time_course, resp ectively . The dashed line represents equal performance across the 2 datasets. Each point in the plot represents an imputation method. c UMAP visualizations with inferred pseudotime tra jectories for petropoulos (top) and ch u_time_course (b ottom). Cells are colored by inferred pseudotime. Fig. 12 c sho ws UMAP visualizations of tra jectory analysis for 15 imputation meth- o ds in terms of 2 datasets. The qualitative analyses through the UMAP visualizations sho w that the pseudotime c hanges gradually for PbImpute and scImpute, with cells 38 colored by pseudotime progressing smo othly . On the other hand, the UMAP visualiza- tions of AcImpute, scT sI, PBLR, WEDGE, scIDPMs, stDiff, scMultiGAN, scIGANs, and CP ARI sho w that the pseudotime do es not change smo othly , with cells of differ- en t time p oin ts app earing intermixed along the tra jectory . How ev er, since tra jectory analysis is p erformed in higher dimensions than UMAP, POS and KRCC results may not be fully reflected in the 2-dimensional UMAP pro jections. In summary , the tra jectory analysis reveals that 5 metho ds, including PbImpute, scImpute, scLR TC, CP ARI, and Bubble, consistently preserv e the temporal ordering of cells across 2 datasets, while scIDPMs, stDiff, and scIGANs p erform the worst. Ho wev er, the fact that 10 metho ds fail to outp erform the mask ed baseline highlights a critical challenge that imputation can distort the underlying developmen tal structure of scRNA-seq data. This can p oten tially lead to less accurate tra jectory analysis than simply using the data without imputation. 3.6 Cell Type Annotation Fig. 13 shows ACC, PR, RC, and F1 of cell type annotation for the 15 imputation metho ds in terms of 6 datasets, namely sc_10x_5cl, hca_10x_tissue, c h u_cell_type, baron, encode_fluidigm_5cl, and bladder. 1D-CNN and scGPT [ 109 ] are used to annotate cell t yp es. Higher ACC represents b etter ov erall accuracy of cell t yp e anno- tations, higher PR represents b etter precision in identifying true cell t yp es, higher RC represen ts b etter recall of true cell types, and higher F1 represen ts a b etter balance b et w een precision and recall. A thorough a nalysis of ACC, PR, RC, and F1 for the 15 imputation metho ds in terms of 6 datasets reveals that MAGIC achiev es the b est ov erall p erformance. In addition, 13 methods, namely PbImpute, scImpute, AcImpute, scT sI, PBLR, scLR TC, WEDGE, scIDPMs, scMultiGAN, scIGANs, scGNN, CP ARI, and Bubble, sho w moderate results. On the other hand, stDiff shows the w orst p erformance. The comparison of the 2 cell t yp e annotation methods, namely 1D-CNN and scGPT, sho ws that the p erformance differences b et w een them are substantial in the 2 cell line datasets, namely sc_10x_5cl and enco de_fluidigm_5cl, while the differences are rel- ativ ely small in the 4 tissue datasets, namely hca_10x_tissue, ch u_cell_type, baron, and bladder. Ho wev er, none of the 15 methods significan tly outp erform the masked baseline in 3 datasets, including sc_10x_5cl, hca_10x_tissue, and c hu_cell_t yp e. In summary , MAGIC sho ws the b est cell type annotation p erformance, while stDiff sho ws the worst performance. F urthermore, the c hoice of cell type annotation methods in tro duces considerable v ariability in the cell line datasets, namely sc_10x_5cl and enco de_fluidigm_5cl. 4 Discussion In this study , we conduct a systematic ev aluation of 15 imputation metho ds across 6 do wnstream tasks, including numerical gene expression reco very , cell clustering, DE analysis, marker gene analysis, tra jectory analysis, and cell type annotation. The ev aluation is p erformed using 26 real and 4 simulated datasets generated from 10 differen t proto cols, including 10x Chromium, CEL-seq2, SMAR T-seq2, SMAR T-seq, 39 ACC PR RC F1 sc_10x_5cl hca_10x_tissue chu_cell_type baron encode_fluidigm_5cl bladder 0.7 0.8 0.9 1.0 0.0 0.5 1.0 0.5 1.0 0.5 1.0 Bubble CP ARI scGNN scIGANs scMultiGAN stDiff scIDPMs WEDGE scLRTC PBLR MAGIC scTsI AcImpute scImpute PbImpute Masked Ground T ruth Bubble CP ARI scGNN scIGANs scMultiGAN stDiff scIDPMs WEDGE scLRTC PBLR MAGIC scTsI AcImpute scImpute PbImpute Masked Ground T ruth Bubble CP ARI scGNN scIGANs scMultiGAN stDiff scIDPMs WEDGE scLRTC PBLR MAGIC scTsI AcImpute scImpute PbImpute Masked Ground T ruth Bubble CP ARI scGNN scIGANs scMultiGAN stDiff scIDPMs WEDGE scLRTC PBLR MAGIC scTsI AcImpute scImpute PbImpute Masked Ground T ruth Bubble CP ARI scGNN scIGANs scMultiGAN stDiff scIDPMs WEDGE scLRTC PBLR MAGIC scTsI AcImpute scImpute PbImpute Masked Ground T ruth Bubble CP ARI scGNN scIGANs scMultiGAN stDiff scIDPMs WEDGE scLRTC PBLR MAGIC scTsI AcImpute scImpute PbImpute Masked Ground T ruth 1D−CNN scGPT Fig. 13 Cell type annotation p erformance. Dumbbell plots comparing ACC, PR, RC, and F1 achiev ed by 1D-CNN (green circles) and scGPT [ 109 ] (orange triangles) across 6 datasets, including sc_10x_5cl, hca_10x_tissue, chu_cell_t yp e, baron, encode_fluidigm_5cl, and bladder. The x-axis represents the v alue of each ev aluation measure, and the y-axis represen ts differen t imputation meth- ods. Each horizontal line connects the 1D-CNN and scGPT p erformances for a given metho d. 40 T able 5 Summary of the p erformance of imputation methods. ⋆ , △ , and × indicate b est, moderate, and worst performance, respectively . Category Method Numerical gene expression reco very Cell clustering DE analysis Marker gene analysis T ra jectory analysis Cell t yp e annotation Model-based PbImpute △ △ △ △ ⋆ △ scImpute △ △ △ ⋆ ⋆ △ Smoothing- based AcImpute △ △ ⋆ △ △ △ scT sI ⋆ △ △ △ △ △ MAGIC △ ⋆ △ ⋆ △ ⋆ Low-rank matrix-based PBLR ⋆ × × × △ △ scLR TC × ⋆ △ △ ⋆ △ WEDGE ⋆ ⋆ △ △ △ △ Diffusion- based scIDPMs × △ △ △ × △ stDiff △ × △ × × × GAN-based scMultiGAN △ △ △ △ △ △ scIGANs × △ △ △ × △ GNN-based scGNN △ △ △ × △ △ AE-based CP ARI △ △ △ △ ⋆ △ Bubble △ △ △ △ ⋆ △ Drop-seq, STR T-Seq, inDrop, Fluidigm C1, Micro well-seq, and Sort-seq. The results rev eal substantial v ariability in the p erformance of imputation metho ds across dif- feren t downstream tasks and datasets, which highligh ts the imp ortance of carefully selecting imputation metho ds based on specific do wnstream analyses and dataset c haracteristics. T able 5 summarizes the p erformance of the 15 imputation metho ds across 6 do wnstream tasks. MA GIC shows the best ov erall p erformance with the highest p erformance in 3 tasks, namely cell clustering, marker gene analysis, and cell type annotation, and mo derate p erformance in the remaining 3 tasks. In addition, scImpute and WEDGE sho w mo derately high o verall p erformance with the b est p erformance in 2 tasks, and mo derate p erformance in the remaining 4 tasks. Similarly , PbImpute, A cImpute, scT sI, scMultiGAN, CP ARI, and Bubble show moderately lo w o verall p er- formance, with the b est performance in 0 or 1 tasks, and mo derate p erformance in the remaining 5 or 6 tasks. Con versely , PBLR, scLR TC, scIDPMs, stDiff, scIGANs, and scGNN sho w the worst o verall p erformance, with the w orst p erformance in 1 to 3 tasks. W e find that traditional metho ds, such as scImpute, MA GIC, and WEDGE, sho w the b est or mo derately high o verall p erformance across the 6 tasks, whereas none of the 7 DL-based metho ds reac h the same level of o verall performance. This suggests that traditional metho ds may b e more effectiv e at preserving biologically meaningful information across a wide range of do wnstream analyses, while the p er- formance of DL-based metho ds can b e more v ariable and may require careful tuning and v alidation for sp ecific tasks. 41 In numerical gene expression recov ery , the p erformance of imputation metho ds v aries significan tly across metho ds. scT sI, PBLR, and WEDGE achiev e the b est ov er- all LND performance, with medians consisten tly close to 0. scT sI achiev es this through its t wo-stage strategy , which first imputes drop outs using k -NN-based a veraging across neigh b oring cells and genes, and refines the initial estimates through ridge regression. PBLR preserves the data structure through its cell sub-p opulation-based b ounded lo w-rank matrix recov ery . The b oundaries constrain reconstructed v alues within bio- logically plausible ranges. WEDGE shows sup erior LND p erformance likely due to its biased low-rank matrix-based approach that assigns low weigh ts to 0 elemen ts and minimizes approximation error for nonzero elements. This approach effectiv ely sepa- rates true biological signal from dropouts without ov er-imputing zero entries. scT sI and WEDGE also exhibit the low est MAE and MedAE, which further supp orts this finding. Proto col-wise analysis reveals that WEDGE maintains LND v alues closest to zero with compact distributions across all proto cols, which indicates that it is the most proto col-robust approach among the 15 metho ds. F or comparison with bulk RNA- seq data, WEDGE also achiev es the b est ov erall performance, while MA GIC sho ws the highest cell line-lev el correlation through its diffusion-based smo othing, which enforces lo cally coherent expression profiles aligned with av eraged bulk patterns. In con trast, scMultiGAN exhibits the worst correlation with bulk RNA-seq data at b oth the pseudo-bulk and cell line levels despite its mo derate numerical recov ery p erfor- mance from ground truth data. This highlights a trade-off betw een numerical accuracy and biological fidelit y . Its dual-GAN arc hitecture, which minimizes numerical recov- ery error, may ov erfit to ground truth distributions at the exp ense of generalization to bulk RNA-seq data. The ov er-imputation by scIDPMs ma y arise from its iterative denoising pro cess that pushes sparse drop out entries to ward higher-density non-zero mo des across m ultiple sequen tial denoising steps. scLR TC consistently under-imputes b ecause its low-rank matrix-based approac h compresses the dynamic range of highly v ariable genes. scIGANs exhibits the highest proto col-wise MAE and MedAE that significan tly exceed the masked baseline, and also sho ws the worst correlation with bulk RNA-seq data. This worst p erformance likely arises b ecause its adv ersarially trained generator learns conserv ative mappings that fail to generalize across proto cols and sequencing mo dalities. F urthermore, methods show largely consisten t b eha vior on 10x Chromium, CEL-seq2, and Drop-seq datasets, while SMAR T-seq, SMAR T-seq2, and Fluidigm C1 datasets demonstrate higher instabilit y . This is lik ely b ecause the latter 3 proto cols use only read-counts without UMIs. The absence of UMIs leads to increased tec hnical noise that mak es accurate imputation more c hallenging [ 17 , 119 ]. In cell clustering, the performance of imputation metho ds also v aries significantly across metho ds. In terms of consistency , scLR TC achiev es the b est p erformance. This is likely b ecause scLR TC reconstructs gene expression v alues through its low-rank tensor completion that captures global gene expression patterns while preserving the distinct expression signatures that define cell clusters. In terms of coherency , MAGIC and WEDGE achiev e the b est p erformance. MA GIC pro duces tightly group ed clus- ters, lik ely because its diffusion-based smo othing o v er k -NN graphs harmonizes expression profiles within cell neighborho o ds, which enhances intra-cluster homo- geneit y . WEDGE achiev es coheren t clusters through its biased lo w-rank matrix 42 decomp osition that suppresses noise-driven v ariability within clusters while preserving in ter-cluster separation. The distinction b et ween consistency and coherency suggests that w ell-separated clusters do not necessarily corresp ond to accurately reco vered expression patterns, as MA GIC and WEDGE ac hieve the b est cluster coherency but not the b est cluster consistency . Conv ersely , PBLR and stDiff show the w orst results in b oth consistency and coherency . F or PBLR, this may b e due to its b ounded lo w-rank matrix recov ery approac h that compresses expression v ariability in to a small num b er of latent factors and can merge expression signatures of distinct but transcriptionally similar cell p opulations. F or stDiff, its diffusion-based denoising pro cess may ov er- smo oth expression differences b et ween closely related cell p opulations, which leads to p oor cluster separation and inaccurate cluster assignments. Notably , none of the 15 metho ds exceed the ARI scores of the mask ed baseline in 12 datasets, which suggests that imputation does not univ ersally improv e cell clustering and can even degrade clus- ter consistency by in tro ducing imputed expression patterns. F urthermore, the UMAP visualization reveals that PbImpute, scImpute, MAGIC, WEDGE, and scMultiGAN main tain visually distinct clusters across sim ulated datasets with v arying dropout rates, while the remaining 10 metho ds show limited ability to reco ver cluster struc- tures. This suggests that these 10 metho ds may b e less robust to drop out-induced sparsit y , which can lead to p o or cluster recov ery in datasets with high drop out rates. In DE analysis, AcImpute achiev es the best o verall p erformance, with the highes t DE enric hment analysis performance across 3 datasets and the best effect size analysis p erformance. This is lik ely due to its smo othing-based approach that leverages gene- gene relationships to estimate dropouts and gene expression v alues, whic h preserves the relativ e expression differences b et ween cell p opulations. A cImpute also achiev es high IoU scores in b oth high- and low-LF C genes, which indicates that it effectively reco vers expression differences across a range of effect sizes. Ho wev er, AcImpute pro- duces false positive DEGs under MAST [ 102 ] in sc_10x_5cl, whic h suggests that its smo othing approach can introduce systematic expression patterns that create false differences b et ween randomly partitioned cell groups. scLR TC also achiev es the b est DE enric hment analysis p erformance but pro duces substan tial false p ositiv e DEGs under MAST in 2 datasets, sc_10x_5cl and hca_10x_tissue. This indicates that its low-rank tensor completion approach effectively reco vers relative expression dif- ferences for DEG identification but can simultaneously in tro duce imputed expression patterns that inflate false p ositiv e rates. WEDGE, MAGIC, scIGANs, scGNN, and scMultiGAN pro duce nearly 0 false p ositiv es across all datasets. Ho wev er, scMulti- GAN exhibits the w orst DE enrichmen t performance on sc_10x_5cl, which further reinforces the trade-off b et ween numerical recov ery accuracy and biological signal preserv ation observ ed in numerical gene expression recov ery . The low false p ositiv e rates of these metho ds do not universally translate into accurate DEG identification, whic h indicates that av oiding false positives is necessary but not sufficient for accurate DE analysis. Con versely , PBLR sho ws the worst ov erall p erformance, with the worst DE enrichmen t and effect size analysis p erformance. This indicates that its b ounded lo w-rank matrix recov ery fails to preserv e the relative expression differences b etw een cell p opulations, whic h results in p o or DEG identification regardless of effect size. Notably , the masked baseline demonstrates high IoU scores on sc_10x_5cl, and none 43 of the 15 methods significantly outperform it, which suggests that imputation do es not alw ays improv e DE analysis ov er data without imputation. In mark er gene analysis, w e examine the preserv ation of biologically meaningful gene expression patterns by comparing marker gene expression levels across different cell types in imputed data. The results reveal that scImpute and MAGIC consisten tly sho w the b est p erformance, with strong cell-type-sp ecific marker gene expression pat- terns across the 2 datasets. scImpute shows the b est performance, lik ely due to its mixture distribution-based approach that selectively imputes v alues on a per-gene basis, which allows it to impute only the v alues that are likely to b e tec hnical dropouts while preserving biological zeros. This approac h maintains the distinct marker gene expression patterns in their resp ectiv e cell t yp es while keeping non-expressing cell t yp es at lo w expression levels. MA GIC ac hieves strong mark er gene expression through its diffusion-based smo othing ov er a k -NN graph, whic h propagates expression sig- nals among transcriptionally similar cells. This may amplify mark er gene expression within the corresp onding cell t yp es without spreading signals across other p opula- tions, as the graph structure naturally limits diffusion within cell t yp e b oundaries. Con versely , PBLR, stDiff, and scGNN show the worst results across b oth datasets, as they pro duce indistinct mark er gene expression patterns and p o or cell type sepa- ration. F or PBLR, its b ounded lo w-rank matrix recov ery approac h compresses gene expression v ariability in to a small num b er of latent factors, which in turn w eakens the distinct expression p eaks of marker genes and blurs cell-t yp e-sp ecific signatures. F or stDiff, its diffusion-based denoising pro cess can ov er-smo oth lo calized expression sig- natures. F or scGNN, its graph-based architecture may homogenize expression v alues across neighboring cells, thereby diminishing cell-type-sp ecific mark er gene patterns. Notably , scIGANs and CP ARI p erform well in hca_10x_tissue but show less consis- ten t results in ch u_cell_type, while scIDPMs p erforms p oorly in hca_10x_tissue yet ac hieves clear cell t yp e separation in the UMAP visualizations for ch u_cell_type. This inconsistency b et ween numerical gene expression recov ery or cell clustering p erfor- mance and marker gene analysis further reinforces the finding that ov erall imputation accuracy do es not guarantee the preserv ation of biologically meaningful expression patterns. In tra jectory analysis, we ev aluate the abilit y of imputation metho ds to preserve the temp oral ordering of cells by comparing inferred pseudotime from imputed data with true cellular dev elopment time lab els. The results reveal that PbImpute, scIm- pute, scLR TC, CP ARI, and Bubble consistently preserve the temporal ordering of cells across the 2 datasets. This shows that 2 mo del-based metho ds, 1 low-rank matrix- based metho d, and 2 AE-based metho ds p erform well in tra jectory analysis. This ma y b e due to the fact that these metho ds preserv e the relative expression differences along developmen tal tra jectories, which is critical for accurate pseudotime inference. The mo del-based methods, scImpute and PbImpute, selectively target drop out even ts while preserving the original expression v alues, whic h helps main tain the gradual expression changes that define developmen tal tra jectories. scLR TC reconstructs gene expression v alues through its lo w-rank tensor completion that captures global gene expression patterns while preserving the distinct expression signatures that define dev elopmental tra jectories. The AE-based metho ds, CP ARI and Bubble, learn latent 44 represen tations using autoenco der architectures that retain the con tinuous struc- ture of developmen tal progression without collapsing intermediate states. Conv ersely , scIDPMs, stDiff, and scIGANs sho w the w orst p erformance. The diffusion-based meth- o ds, namely scIDPMs and stDiff, use an iterative denoising pro cess trained to denoise expression v alues to ward high-density mo des, which may collapse the subtle expres- sion gradien ts b et ween adjacen t developmen tal stages into discrete expression states. This disrupts the con tinuous pseudotime ordering that tra jectory inference relies on, as cells at intermediate developmen tal stages are pushed tow ard the expression pro- files of more mature or earlier stages. F or scIGANs, its adversarial training aims to matc h the o verall data distribution, but the GAN-based generation process may suffer from mode collapse that concen trates imputed v alues around high-density expres- sion states rather than preserving the con tinuous gradients b et ween developmen tal stages. This can disrupt the temp oral ordering of cells by homogenizing expression profiles at intermediate stages. This is cons isten t with the UMAP visualizations, where cells of different time p oin ts app ear intermixed along the tra jectory for these meth- o ds. F urthermore, 10 metho ds, including A cImpute, scT sI, MAGIC, PBLR, WEDGE, scIDPMs, stDiff, scMultiGAN, scIGANs, and scGNN, fail to outp erform the mask ed baseline, which highlights that imputation can distort the underlying dev elopmental structure of scRNA-seq data and lead to less accurate tra jectory inference than simply using the original data. This suggests that tra jectory analysis, whic h dep ends on the preserv ation of con tinuous expression gradien ts rather than discrete cluster b ound- aries, is particularly sensitive to imputation artifacts that alter the relative ordering of expression v alues along dev elopmental axes. In cell type annotation, we assess the impact of imputation on the accuracy of cell t yp e predictions by comparing annotations derived from imputed data with known cell t yp e labels. The results rev eal that MAGIC ac hieves the best ov erall p erfor- mance across the 6 datasets. The strong p erformance of MAGIC ma y b e attributed to its smo othing-based approach that propagates expression signals across similar cells, whic h enhances the expression profiles used b y annotation classifiers to distinguish cell t yp es without the elimination of cell-t yp e-specific patterns. Con versely , stDiff shows the worst p erformance. This ma y be due to its diffusion-based denoising pro cess that o ver-smooths expression profiles by iterativ ely refining v alues tow ard high-densit y mo des, whic h can blur the b oundaries b et ween transcriptionally similar cell t yp es. The comparison b et ween 1D-CNN and scGPT rev eals substantial p erformance differences in the 2 cell line datasets but relatively small differences in the 4 tissue datasets. This ma y be b ecause cell line datasets con tain more homogeneous p opulations with subtle transcriptomic differences that are more sensitive to the c hoice of annotation metho d, while tissue datasets contain more heterogeneous p opulations with larger expression differences that are consisten tly captured b y b oth classifiers. F urthermore, none of the 15 methods significantly outp erform the masked baseline in 3 datasets, which is con- sisten t with the observ ations in cell clustering and DE analysis, and reinforces that imputation do es not universally improv e downstream task p erformance, particularly in datasets with sufficient sequencing depth. Ov erall, the comprehensiv e ev aluation across 6 downstream tasks reveals that although some imputation metho ds excel in sp ecific tasks, there is no universally 45 sup erior method across all tasks. This indicates that the choice of imputation metho d should b e carefully tailored to the sp ecific downstream task and dataset c haracteristics to ensure optimal p erformance. F or instance, scImpute and MAGIC are recommended for tasks that require the preserv ation of biologically meaningful information, suc h as mark er gene analysis, tra jectory analysis, and cell t yp e annotation, while WEDGE ma y b e more suitable for tasks that prioritize numerical gene expression recov ery . The v ariability in p erformance across different tasks and datasets also suggests that researc hers should consider using multiple imputation metho ds and comparing their results to ensure the robustness of their findings. In addition, while traditional meth- o ds, such as scImpute, MAGIC, and WEDGE, show relatively b etter performance across a wide range of tasks, the performance of DL-based methods is more v ariable, with no metho ds showing the b est or mo derately high p erformance, and 4 metho ds, namely scMultiGAN, scGNN, CP ARI, and Bubble, sho wing moderately low p erfor- mance across the 6 tasks. This suggests that further developmen t and optimization of DL-based imputation metho ds are needed to ac hieve consisten t performance across div erse downstream analyses. The trade-off b et ween numerical gene expression reco v- ery p erformance and biological signal preserv ation is a critical consideration in the design and selection of imputation metho ds, as metho ds that excel in one aspect ma y p erform po orly in the other, which can ha ve significan t implications for the in terpretation of scRNA-seq data and the biological conclusions drawn from it. Moreo ver, this study includes limitations that should b e ackno wledged. One limita- tion is the selection of imputation metho ds, whic h co vers a range of recently developed approac hes and 2 well-kno wn traditional methods, i.e., scImpute and MAGIC, but do es not encompass all existing metho ds ev aluated in previous b enc hmarking studies. In addition, while w e ev aluate p erformance in terms of 26 real and 4 simulated datasets with 10 differen t proto cols, it may b e b eneficial to further expand the diversit y of datasets, including more complex tissues and disease states. In terms of do wnstream tasks, we fo cus on 6 core tasks, including numerical gene expression recov ery , cell clustering, DE analysis, mark er gene analysis, tra jectory analysis, and cell type anno- tation. F uture studies could explore additional op en problems, suc h as RNA v elo cit y analysis and batch effect correction, to further understand the impact of imputation on more complex analyses. Declarations F unding This w ork was supp orted in part by JST ASPIRE Program Japan Grant Number JPMJAP2403. Comp eting in terests The authors declare no comp eting in terests. 46 Ethics approv al and consen t to participate Not applicable. This study used only publicly av ailable datasets and did not inv olve h uman sub jects or animal exp erimen ts. Consen t for publication Not applicable. Data av ailabilit y All datasets used in this study are publicly a v ailable. See T able 2 for more details. Materials av ailabilit y Not applicable. Co de a v ailabilit y A v ailable on reasonable request from the corresp onding authors. Author contribution Y.I.: Conceptualization, Data curation, F ormal analysis, In vestigation, Metho dology , Soft ware, V alidation, Visualization, and W riting – original draft. A.F.A.: Con- ceptualization, Data curation, Metho dology , Sup ervision, V alidation, Visualization, W riting – original draft, and W riting – review & editing. M.N.A.: Conceptualization, Sup ervision, and W riting – review & editing. A.D.: F unding acquisition, Resources, Sup ervision, and W riting – review & editing. References [1] T ang, F., Barbacioru, C., W ang, Y., Nordman, E., Lee, C., Xu, N., W ang, X., Bo deau, J., T uch, B.B., Siddiqui, A., Lao, K., Surani, M.A.: mRNA-Seq whole- transcriptome analysis of a single cell. Nature Metho ds 6 (5), 377–382 (2009) h ttps://doi.org/10.1038/nmeth.1315 [2] Luec ken, M.D., Theis, F.J.: Current b est practices in single-cell RNA-seq anal- ysis: A tutorial. Molecular Systems Biology 15 (6), 188746 (2019) https://doi. org/10.15252/msb.20188746 [3] Rafi, F.R., Heya, N.R., Hafiz, M.S., Jim, J.R., Kabir, M.M., Mridha, M.F.: A systematic review of single-cell RNA sequencing applications and inno v ations. Computational Biology and Chemistry 115 , 108362 (2025) h ttps://doi.org/10. 1016/j.compbiolc hem.2025.108362 [4] Cheng, C., Chen, W., Jin, H., Chen, X.: A Review of Single-Cell RNA-Seq Anno- tation, Integration, and Cell–Cell Comm unication. Cells 12 (15), 1970 (2023) h ttps://doi.org/10.3390/cells12151970 47 [5] Hw ang, B., Lee, J.H., Bang, D.: Single-cell RNA sequencing technologies and bioinformatics pipelines. Exp erimental & Molecular Medicine 50 (8), 1–14 (2018) h ttps://doi.org/10.1038/s12276- 018- 0071- 8 [6] K olo dziejczyk, A.A., Kim, J.K., Svensson, V., Marioni, J.C., T eichmann, S.A.: The T echnology and Biology of Single-Cell RNA Sequencing. Molecular Cell 58 (4), 610–620 (2015) https://doi.org/10.1016/j.molcel.2015.04.005 [7] Jo vic, D., Liang, X., Zeng, H., Lin, L., Xu, F., Luo, Y.: Single-cell RNA sequenc- ing tec hnologies and applications: A brief ov erview. Clinical and T ranslational Medicine 12 (3), 694 (2022) https://doi.org/10.1002/ctm2.694 [8] Zheng, G.X.Y., T erry , J.M., Belgrader, P ., Ryvkin, P ., Bent, Z.W., Wilson, R., Ziraldo, S.B., Wheeler, T.D., McDermott, G.P ., Zhu, J., Gregory , M.T., Sh uga, J., Montesclaros, L., Underw o o d, J.G., Masquelier, D.A., Nishimura, S.Y., Sc hnall-Levin, M., W yatt, P .W., Hindson, C.M., Bharadwa j, R., W ong, A., Ness, K.D., Beppu, L.W., Deeg, H.J., McF arland, C., Lo eb, K.R., V alen te, W.J., Eric- son, N.G., Stev ens, E.A., Radic h, J.P ., Mikkelsen, T.S., Hindson, B.J., Bielas, J.H.: Massively parallel digital transcriptional profiling of single cells. Nature Comm unications 8 (1), 14049 (2017) h ttps://doi.org/10.1038/ncomms14049 [9] W en, L., T ang, F.: Single-cell omics sequencing tec hnologies: The long-read gen- eration. T rends in Genetics 42 (1), 46–62 (2026) h ttps://doi.org/10.1016/j.tig. 2025.07.012 [10] Hu, T., Chi tnis, N., Monos, D., Dinh, A.: Next-generation seq uencing technolo- gies: An ov erview. Human Immunology 82 (11), 801–811 (2021) h ttps://doi.org/ 10.1016/j.h umimm.2021.02.012 [11] Kan ton, S., Boyle, M.J., He, Z., San tel, M., W eigert, A., Sanchís-Calleja, F., Guijarro, P ., Sido w, L., Flec k, J.S., Han, D., Qian, Z., Heide, M., Huttner, W.B., Khaitovic h, P ., Pääb o, S., T reutlein, B., Camp, J.G.: Organoid single-cell genomic atlas uncov ers human-specific features of brain developmen t. Nature 574 (7778), 418–422 (2019) https://doi.org/10.1038/s41586- 019- 1654- 9 [12] Ramilo wski, J.A., Goldberg, T., Harshbarger, J., Kloppmann, E., Lizio, M., Satagopam, V.P ., Itoh, M., Kaw a ji, H., Carninci, P ., Rost, B., F orrest, A.R.R.: Correction: Corrigendum: A draft netw ork of ligand-receptor-mediated m ul- ticellular signalling in human. Nature Communications 7 (1), 10706 (2016) h ttps://doi.org/10.1038/ncomms10706 [13] Huang, K., Xu, Y., F eng, T., Lan, H., Ling, F., Xiang, H., Liu, Q.: The A dv ance- men t and Application of the Single-Cell T ranscriptome in Biological and Medical Researc h. Biology 13 (6), 451 (2024) https://doi.org/10.3390/biology13060451 [14] Regev, A., T eichmann, S.A., Lander, E.S., Amit, I., Benoist, C., Birney , E., Bo denmiller, B., Campbell, P ., Carninci, P ., Clatw orthy , M., Clev ers, H., 48 Deplanc ke, B., Dunham, I., Eb erwine, J., Eils, R., Enard, W., F armer, A., F ugger, L., Göttgens, B., Hacohen, N., Haniffa, M., Hem b erg, M., Kim, S., Klenerman, P ., Kriegstein, A., Lein, E., Linnarsson, S., Lundberg, E., Lun- deb erg, J., Ma jumder, P ., Marioni, J.C., Merad, M., Mhlanga, M., Na wijn, M., Netea, M., Nolan, G., Pe’er, D., Phillipakis, A., Pon ting, C.P ., Quak e, S., Reik, W., Rozenblatt-Rosen, O., Sanes, J., Satija, R., Sch umac her, T.N., Shalek, A., Shapiro, E., Sharma, P ., Shin, J.W., Stegle, O., Stratton, M., Stub- bington, M.J.T., Theis, F.J., Uhlen, M., v an Oudenaarden, A., W agner, A., W att, F., W eissman, J., W old, B., Xavier, R., Y osef, N., Human Cell A tlas Meeting Participan ts: The Human Cell Atlas. eLife 6 , 27041 (2017) https: //doi.org/10.7554/eLife.27041 [15] The T abula Sapiens Consortium: The T abula Sapiens: A multiple-organ, single- cell transcriptomic atlas of humans. Science 376 (6594), 4896 (2022) https:// doi.org/10.1126/science.abl4896 [16] Lähnemann, D., Köster, J., Szczurek, E., McCarthy , D.J., Hicks, S.C., Robinson, M.D., V allejos, C.A., Campb ell, K.R., Beerenwink el, N., Mahfouz, A., Pinello, L., Skums, P ., Stamatakis, A., Attolini, C.S.-O., Aparicio, S., Baaijens, J., Balv ert, M., Barbanson, B., Cappuccio, A., Corleone, G., Dutilh, B.E., Florescu, M., Gury ev, V., Holmer, R., Jahn, K., Lob o, T.J., Keizer, E.M., Khatri, I., Kiel- basa, S.M., Korbel, J.O., Kozlo v, A.M., Kuo, T.-H., Leliev eldt, B.P .F. , Mandoiu, I.I., Marioni, J.C., Marsc hall, T., Mölder, F., Niknejad, A., Rączk owsk a, A., Reinders, M., Ridder, J., Saliba, A.-E., Somarakis, A., Stegle, O., Theis, F.J., Y ang, H., Zelik ovsky , A., McHardy , A.C., Raphael, B.J., Shah, S.P ., Schönh uth, A.: Eleven grand c hallenges in single-cell data science. Genome Biology 21 (1), 31 (2020) https://doi.org/10.1186/s13059- 020- 1926- 6 [17] Cheng, Y., Ma, X., Y uan, L., Sun, Z., W ang, P .: Ev aluating imputation metho ds for single-cell RNA-seq data. BMC Bioinformatics 24 (1), 302 (2023) https:// doi.org/10.1186/s12859- 023- 05417- 7 [18] Dai, C., Jiang, Y., Yin, C., Su, R., Zeng, X., Zou, Q., Nak ai, K., W ei, L.: scIMC: A platform for b enc hmarking comparison and visualization analysis of scRNA- seq data imputation metho ds. Nucleic A cids Researc h 50 (9), 4877–4899 (2022) h ttps://doi.org/10.1093/nar/gk ac317 [19] Hou, W., Ji, Z., Ji, H., Hicks, S.C.: A systematic ev aluation of single-cell RNA- sequencing imputation metho ds. Genome Biology 21 (1), 218 (2020) h ttps:// doi.org/10.1186/s13059- 020- 02132- x [20] Saelens, W., Canno odt, R., T o dorov, H., Saeys, Y.: A comparison of single- cell tra jectory inference metho ds. Nature Biotec hnology 37 (5), 547–554 (2019) h ttps://doi.org/10.1038/s41587- 019- 0071- 9 [21] T raag, V.A., W altman, L., v an Eck, N.J.: F rom Louv ain to Leiden: Guaranteeing w ell-connected communities. Scientific Rep orts 9 (1), 5233 (2019) https://doi. 49 org/10.1038/s41598- 019- 41695- z [22] Blondel, V.D., Guillaume, J.-L., Lam biotte, R., Lefebvre, E.: F ast unfolding of comm unities in large netw orks. Journal of Statistical Mechanics: Theory and Exp erimen t 2008 (10), 10008 (2008) https://doi.org/10.1088/1742- 5468/2008/ 10/P10008 [23] Hagh verdi, L., Büttner, M., W olf, F.A., Buettner, F., Theis, F.J.: Diffusion pseudotime robustly reconstructs lineage branching. Nature Metho ds 13 (10), 845–848 (2016) https://doi.org/10.1038/nmeth.3971 [24] T rapnell, C., Cacchiarelli, D., Grimsby , J., P okharel, P ., Li, S., Morse, M., Lennon, N.J., Liv ak, K.J., Mikkelsen, T.S., Rinn, J.L.: The dynamics and regula- tors of cell fate decisions are revealed by pseudotemp oral ordering of single cells. Nature Biotechnology 32 (4), 381–386 (2014) h ttps://doi.org/10.1038/nbt.2859 [25] Bendall, S.C., Da vis, K.L., Amir, E.-a.D., T admor, M.D., Simonds, E.F., Chen, T.J., Shenfeld, D.K., Nolan, G.P ., Pe’er, D.: Single-Cell T ra jectory Detec- tion Uncov ers Progression and Regulatory Co ordination in Human B Cell Dev elopment. Cell 157 (3), 714–725 (2014) h ttps://doi.org/10.1016/j.cell.2014. 04.005 [26] Street, K., Risso, D., Fletc her, R.B., Das, D., Ngai, J., Y osef, N., Purdom, E., Dudoit, S.: Sl ingshot: Cell lineage and pseudotime inference for single-cell transcriptomics. BMC Genomics 19 (1), 477 (2018) https://doi.org/10.1186/ s12864- 018- 4772- 0 [27] Lotfollahi, M., W olf, F.A., Theis, F.J.: Generative Mo deling and Latent Space Arithmetics Predict Single-Cell Perturbation Resp onse across Cell Types, Studies and Sp ecies. bioRxiv (2018). h ttps://doi.org/10.1101/478503 [28] Pullin, J.M., McCarthy , D.J.: A comparison of mark er gene selection metho ds for single-cell RNA sequencing data. Genome Biology 25 (1), 56 (2024) h ttps: //doi.org/10.1186/s13059- 024- 03183- 0 [29] W agner, A., Regev, A., Y osef, N.: Rev ealing the v ectors of cellular iden tity with single-cell genomics. Nature Biotechnology 34 (11), 1145–1160 (2016) h ttps: //doi.org/10.1038/n bt.3711 [30] Sc holtens, D., v on Heydebrec k, A.: Analysis of Differen tial Gene Expression Studies. In: Gentleman, R., Carey , V.J., Hub er, W., Irizarry , R.A., Dudoit, S. (eds.) Bioinformatics and Computational Biology Solutions Using R and Bio- conductor, pp. 229–248. Springer, New Y ork, NY (2005). https://doi.org/10. 1007/0- 387- 29362- 0_14 [31] Jia, C., Hu, Y., Kelly , D., Kim, J., Li, M., Zhang, N.R.: A ccounting for techni- cal noise in differential expression analysis of single-cell RNA sequencing data. 50 Nucleic Acids Research 45 (19), 10978–10988 (2017) https://doi.org/10.1093/ nar/gkx754 [32] Andrews, T.S., Hem b erg, M.: Iden tifying cell p opulations with scRNASeq. Molecular Asp ects of Medicine 59 , 114–122 (2018) https://doi.org/10.1016/j. mam.2017.07.002 [33] Marino v, G.K., Williams, B.A., McCue, K., Sc hroth, G.P ., Gertz, J., Myers, R.M., W old, B.J.: F rom single-cell to cell-p o ol transcriptomes: Sto c hasticity in gene expression and RNA splicing. Genome Researc h 24 (3), 496–510 (2014) h ttps://doi.org/10.1101/gr.161034.113 [34] Islam, S., Zeisel, A., Joost, S., La Manno, G., Za jac, P ., Kasp er, M., Lönnerb erg, P ., Linnarsson, S.: Quan titative single-cell RNA-seq with unique molecular iden- tifiers. Nature Metho ds 11 (2), 163–166 (2014) https://doi.org/10.1038/nmeth. 2772 [35] Kharc henko, P .V., Silb erstein, L., Scadden, D.T.: Bay esian approach to single- cell differential expression analysis. Nature Methods 11 (7), 740–742 (2014) h ttps://doi.org/10.1038/nmeth.2967 [36] W ang, M., Gan, J., Han, C., Guo, Y., Chen, K., Shi, Y.-z., Zhang, B.-g.: Impu- tation Methods for scRNA Sequencing Data. Applied Sciences 12 (20), 10684 (2022) h ttps://doi.org/10.3390/app122010684 [37] Jiang, R., Sun, T., Song, D., Li, J.J.: Statistics or biology: The zero-inflation con trov ersy ab out scRNA-seq data. Genome Biology 23 (1), 31 (2022) https: //doi.org/10.1186/s13059- 022- 02601- 5 [38] Stegle, O., T eichmann, S.A., Marioni, J.C.: Computational and analytical chal- lenges in single-cell transcriptomics. Nature Reviews Genetics 16 (3), 133–145 (2015) h ttps://doi.org/10.1038/nrg3833 [39] Chen, G., Ning, B., Shi, T.: Single-Cell RNA-Seq T ec hnologies and Related Computational Data Analysis. F rontiers in Genetics 10 (2019) https://doi.org/ 10.3389/fgene.2019.00317 [40] Zhang, Y., W ang, Y., Liu, X., F eng, X.: PbImpute: Precise Zero Discrimina- tion and Balanced Imputation in Single-Cell RNA Sequencing Data. Journal of Chemical Information and Mo deling 65 (5), 2670–2684 (2025) https://doi.org/ 10.1021/acs.jcim.4c02125 [41] Li, W.V., Li, J.J.: An accurate and robust imputation metho d scImpute for single-cell RNA-seq data. Nature Communications 9 (1), 997 (2018) h ttps://doi. org/10.1038/s41467- 018- 03405- 7 [42] Zhang, W., Liu, T., Zhang, H., Li, Y.: A cImpute: A constraint-enhancing 51 smo oth-based approac h for imputing single-cell RNA sequencing data. Bioin- formatics 41 (3), 711 (2025) https://doi.org/10.1093/bioinformatics/btae711 [43] Zhang, H., Li, W., Guan, J.: scT sI: An effective tw o-stage imputation method for single-cell RNA-seq data. Briefings in Bioinformatics 26 (3), 298 (2025) https: //doi.org/10.1093/bib/bbaf298 [44] Dijk, D., Sharma, R., Nain ys, J., Yim, K., Kathail, P ., Carr, A.J., Burdziak, C., Mo on, K.R., Chaffer, C.L., Pattabiraman, D., Bierie, B., Mazutis, L., W olf, G., Krishnaswam y , S., P e’er, D.: Reco vering Gene In teractions from Single-Cell Data Using Data Diffusion. Cell 174 (3), 716–72927 (2018) https://doi.org/10. 1016/j.cell.2018.05.061 [45] Zhang, L., Zhang, S.: Imputing single-cell RNA-seq data b y considering cell het- erogeneit y and prior expression of drop outs. Journal of Molecular Cell Biology 13 (1), 29–40 (2021) https://doi.org/10.1093/jmcb/mjaa052 [46] P an, X., Li, Z., Qin, S., Y u, M., Hu, H.: ScLR TC: Imputation for single-cell RNA-seq data via low-rank tensor completion. BMC Genomics 22 (1), 860 (2021) h ttps://doi.org/10.1186/s12864- 021- 08101- 3 [47] Hu, Y., Li, B., Zhang, W., Liu, N., Cai, P ., Chen, F., Qu, K.: WEDGE: Imputation of gene expression v alues from single-cell RNA-seq datasets using biased matrix decomp osition. Briefings in Bioinformatics 22 (5), 085 (2021) h ttps://doi.org/10.1093/bib/bbab085 [48] Zhang, Z., Liu, L.: scIDPMs: Single-Cell RNA-Seq Imputation Using Diffusion Probabilistic Models. IEEE Journal of Biomedical and Health Informatics 29 (4), 3057–3068 (2025) https://doi.org/10.1109/JBHI.2024.3430554 [49] Li, K., Li, J., T ao, Y., W ang, F.: stDiff: A diffusion model for imputing spatial transcriptomics through single-cell transcriptomics. Briefings in Bioinformatics 25 (3), 171 (2024) https://doi.org/10.1093/bib/bbae171 [50] Zhang, Y., W ang, Y., Liu, X., F eng, X.: CP ARI: A no vel approac h com bining cell partitioning with absolute and relative imputation to address drop out in single-cell RNA-seq data. Briefings in Bioinformatics 26 (1), 668 (2025) https: //doi.org/10.1093/bib/bbae668 [51] W ang, T., Zhao, H., Xu, Y., W ang, Y., Shang, X., Peng, J., Xiao, B.: scMulti- GAN: Cell-sp ecific imputation for single-cell transcriptomes with multiple deep generativ e adversarial netw orks. Briefings in Bioinformatics 24 (6), 384 (2023) h ttps://doi.org/10.1093/bib/bbad384 [52] Chen, S., Y an, X., Zheng, R., Li, M.: Bubble: A fast single-cell RNA-seq impu- tation using an auto encoder constrained by bulk RNA-seq data. Briefings in Bioinformatics 24 (1), 580 (2023) https://doi.org/10.1093/bib/bbac580 52 [53] W ang, J., Ma, A., Chang, Y., Gong, J., Jiang, Y., Qi, R., W ang, C., F u, H., Ma, Q., Xu, D.: scGNN is a no vel graph neural netw ork framework for single- cell RNA-Seq analyses. Nature Communications 12 (1), 1882 (2021) https://doi. org/10.1038/s41467- 021- 22197- x [54] Xu, Y., Zhang, Z., Y ou, L., Liu, J., F an, Z., Zhou, X.: scIGANs: Single-cell RNA- seq imputation using generativ e adversarial net works. Nucleic Acids Researc h 48 (15), 85 (2020) https://doi.org/10.1093/nar/gk aa506 [55] Kiselev, V.Y., Andrews, T.S., Hem b erg, M.: Challenges in unsupervised cluster- ing of single-cell RNA-seq data. Nature Reviews Genetics 20 (5), 273–282 (2019) h ttps://doi.org/10.1038/s41576- 018- 0088- 9 [56] P asquini, G., Ro jo Arias, J.E., Schäfer, P ., Bussk amp, V.: Automated meth- o ds for cell t yp e annotation on scRNA-seq data. Computational and Structural Biotec hnology Journal 19 , 961–969 (2021) https://doi.org/10.1016/j.csb j.2021. 01.015 [57] Grubman, A., Chew, G., Ouyang, J.F., Sun, G., Cho o, X.Y., McLean, C., Simmons, R.K., Buc kb erry , S., V argas-Landin, D.B., Poppe, D., Pflueger, J., Lister, R., Rackham, O.J.L., Petretto, E., Polo, J.M.: A single-cell atlas of en torhinal cortex from individuals with Alzheimer’s disease reveals cell-t yp e- sp ecific gene expression regulation. Nature Neuroscience 22 (12), 2087–2097 (2019) h ttps://doi.org/10.1038/s41593- 019- 0539- 4 [58] Tian, L., Dong, X., F reytag, S., Lê Cao, K.-A., Su, S., JalalAbadi, A., Amann- Zalcenstein, D., W eb er, T.S., Seidi, A., Jabbari, J.S., Naik, S.H., Ritc hie, M.E.: Benc hmarking single cell RNA-sequencing analysis pipelines using mixture con- trol exp erimen ts. Nature Metho ds 16 (6), 479–487 (2019) https://doi.org/10. 1038/s41592- 019- 0425- 8 [59] Tian, L., Su, S., Dong, X., Amann-Zalcenstein, D., Bib en, C., Seidi, A., Hilton, D.J., Naik, S.H., Ritchie, M.E.: scPip e: A flexible R/Bio conductor prepro cess- ing pip eline for single-cell RNA-sequencing data. PLOS Computational Biology 14 (8), 1006361 (2018) https://doi.org/10.1371/journal.pcbi.1006361 [60] Guo, C., Li, B., Ma, H., W ang, X., Cai, P ., Y u, Q., Zh u, L., Jin, L., Jiang, C., F ang, J., Liu, Q., Zong, D., Zhang, W., Lu, Y., Li, K., Gao, X., F u, B., Liu, L., Ma, X., W eng, J., W ei, H., Jin, T., Lin, J., Qu, K.: Single-cell analysis of t wo severe CO VID-19 patients reveals a mono cyte-associated and to cilizumab- resp onding cytokine storm. Nature Communications 11 (1), 3924 (2020) h ttps: //doi.org/10.1038/s41467- 020- 17834- w [61] Gutierrez-Arcelus, M., T eslovic h, N., Mola, A.R., P olidoro, R.B., Nathan, A., Kim, H., Hannes, S., Slowik owski, K., W atts, G.F.M., K orsunsky , I., Bren- ner, M.B., Ra yc haudhuri, S., Brennan, P .J.: Lympho cyte innateness defined b y transcriptional states reflects a balance b et ween proliferation and effector 53 functions. Nature Comm unications 10 (1), 687 (2019) https://doi.org/10.1038/ s41467- 019- 08604- 4 [62] Zheng, C., Zheng, L., Y o o, J.-K., Guo, H., Zhang, Y., Guo, X., Kang, B., Hu, R., Huang, J.Y., Zhang, Q., Liu, Z., Dong, M., Hu, X., Ouyang, W., Peng, J., Zhang, Z.: Landscap e of Infiltrating T Cells in Liv er Cancer Revealed by Single- Cell Sequencing. Cell 169 (7), 1342–135616 (2017) h ttps://doi.org/10.1016/j. cell.2017.05.035 [63] P etrop oulos, S., Edsgärd, D., Reinius, B., Deng, Q., Pan ula, S.P ., Co deluppi, S., Plaza Reyes, A., Linnarsson, S., Sandb erg, R., Lanner, F.: Single-Cell RNA- Seq Reveals Lineage and X Chromosome Dynamics in Human Preimplantation Em bryos. Cell 165 (4), 1012–1026 (2016) https://doi.org/10.1016/j.cell.2016.03. 023 [64] Ch u, L.-F., Leng, N., Zhang, J., Hou, Z., Mamott, D., V ereide, D.T., Choi, J., Kendziorski, C., Stewart, R., Thomson, J.A.: Single-cell RNA-seq rev eals no vel regulators of human em bryonic stem cell differentiation to definitive endo derm. Genome Biology 17 (1), 173 (2016) h ttps://doi.org/10.1186/s13059- 016- 1033- x [65] Chen, R., W u, X., Jiang, L., Zhang, Y.: Single-Cell RNA-Seq Reveals Hyp otha- lamic Cell Diversit y . Cell Rep orts 18 (13), 3227–3241 (2017) https://doi.org/10. 1016/j.celrep.2017.03.004 [66] Romano v, R.A., Zeisel, A., Bakk er, J., Girac h, F., Hellysaz, A., T omer, R., Alpár, A., Mulder, J., Clotman, F., Keimpema, E., Hsueh, B., Crow, A.K., Martens, H., Sch windling, C., Calvigioni, D., Bains, J.S., Máté, Z., Szabó, G., Y anagaw a, Y., Zhang, M.-D., Rendeiro, A., F arlik, M., Uhlén, M., W ulff, P ., Bo c k, C., Broberger, C., Deisseroth, K., Hökfelt, T., Linnarsson, S., Horv ath, T.L., Hark any , T.: Molecular in terrogation of h yp othalamic organization rev eals distinct dopamine neuronal subtypes. Nature Neuroscience 20 (2), 176–188 (2017) h ttps://doi.org/10.1038/nn.4462 [67] Usoskin, D., F urlan, A., Islam, S., Abdo, H., Lönnerb erg, P ., Lou, D., Hjerling- Leffler, J., Haeggström, J., Kharchenk o, O., Kharc henko, P .V., Linnarsson, S., Ernfors, P .: Un biased classification of sensory neuron types by large-scale single- cell RNA sequencing. Nature Neuroscience 18 (1), 145–153 (2015) https://doi. org/10.1038/nn.3881 [68] Zeisel, A., Muñoz-Manchado, A.B., Co deluppi, S., Lönnerb erg, P ., La Manno, G., Juréus, A., Marques, S., Munguba, H., He, L., Betsholtz, C., Rolny , C., Castelo-Branco, G., Hjerling-Leffler, J., Linnarsson, S.: Cell t yp es in the mouse cortex and hipp o campus revealed by single-cell RNA-seq. Science 347 (6226), 1138–1142 (2015) https://doi.org/10.1126/science.aaa1934 [69] Baron, M., V eres, A., W olo ck, S.L., F aust, A.L., Gaujoux, R., V etere, A., Ryu, J.H., W agner, B.K., Shen-Orr, S.S., Klein, A.M., Melton, D.A., Y anai, I.: A 54 Single-Cell T ranscriptomic Map of the Human and Mouse Pancreas Reveals In ter- and Intra-cell Population Structure. Cell Systems 3 (4), 346–3604 (2016) h ttps://doi.org/10.1016/j.cels.2016.08.011 [70] Li, H., Courtois, E.T., Sengupta, D., T an, Y., Chen, K.H., Goh, J.J.L., Kong, S.L., Chua, C., Hon, L.K., T an, W.S., W ong, M., Choi, P .J., W ee, L.J.K., Hillmer, A.M., T an, I.B., Robson, P ., Prabhak ar, S.: Reference comp onen t anal- ysis of single-cell transcriptomes elucidates cellular heterogeneity in human colorectal tumors. Nature Genetics 49 (5), 708–718 (2017) h ttps://doi.org/10. 1038/ng.3818 [71] Han, X., W ang, R., Zhou, Y., F ei, L., Sun, H., Lai, S., Saadatpour, A., Zhou, Z., Chen, H., Y e, F., Huang, D., Xu, Y., Huang, W., Jiang, M., Jiang, X., Mao, J., Chen, Y., Lu, C., Xie, J., F ang, Q., W ang, Y., Y ue, R., Li, T., Huang, H., Orkin, S.H., Y uan, G.-C., Chen, M., Guo, G.: Mapping the Mouse Cell Atlas b y Micro well-Seq. Cell 172 (5), 1091–110717 (2018) https://doi.org/10.1016/j.cell. 2018.02.001 [72] 10x Genomics: 10x Genomics Dataset Repository . h ttps://www.10xgenomics.com/datasets [73] Edgar, R., Domrac hev, M., Lash, A.E.: Gene Expression Omnibus: NCBI gene expression and hybridization array data repository . Nucleic A cids Research 30 (1), 207–210 (2002) https://doi.org/10.1093/nar/30.1.207 [74] Figshare: Figshare. https://figshare.com/ [75] Sark ans, U., Gostev, M., Athar, A., Behrangi, E., Melnic huk, O., Ali, A., Minguet, J., Rada, J.C., Snow, C., Tikhono v, A., Brazma, A., McEnt yre, J.: The BioStudies database—one stop shop for all data supp orting a life sciences study . Nucleic A cids Researc h 46 (D1), 1266–1270 (2018) https://doi.org/10. 1093/nar/gkx965 [76] Ramsköld, D., Luo, S., W ang, Y.-C., Li, R., Deng, Q., F aridani, O.R., Daniels, G.A., Khrebtuko v a, I., Loring, J.F., Lauren t, L.C., Sc hroth, G.P ., Sandb erg, R.: F ull-length mRNA-Seq from single-cell levels of RNA and individual circulating tumor cells. Nature Biotechnology 30 (8), 777–782 (2012) https://doi.org/10. 1038/n bt.2282 [77] Picelli, S., F aridani, O.R., Björklund, Å.K., Winberg, G., Sagasser, S., Sandberg, R.: F ull-length RNA-seq from single cells using Smart-seq2. Nature Proto cols 9 (1), 171–181 (2014) https://doi.org/10.1038/nprot.2014.006 [78] Hashimshon y , T., Senderovic h, N., A vital, G., Klo c hendler, A., de Leeu w, Y., Ana vy , L., Gennert, D., Li, S., Liv ak, K.J., Rozen blatt-Rosen, O., Dor, Y., Regev, A., Y anai, I.: CEL-Seq2: Sensitive highly-m ultiplexed single- cell RNA-Seq. Genome Biology 17 (1), 77 (2016) https://doi.org/10.1186/ 55 s13059- 016- 0938- 8 [79] Macosk o, E.Z., Basu, A., Satija, R., Nemesh, J., Shekhar, K., Goldman, M., Tirosh, I., Bialas, A.R., Kamitaki, N., Martersteck, E.M., T rombetta, J.J., W eitz, D.A., Sanes, J.R., Shalek, A.K., Regev, A., McCarroll, S.A.: Highly P arallel Genome-wide Expression Profiling of Individual Cells Using Nanoliter Droplets. Cell 161 (5), 1202–1214 (2015) https://doi.org/10.1016/j.cell.2015.05. 002 [80] Klein, A.M., Mazutis, L., Ak artuna, I., T allapragada, N., V eres, A., Li, V., P eshkin, L., W eitz, D.A., Kirsc hner, M.W.: Droplet Barco ding for Single-Cell T ranscriptomics Applied to Em bry onic Stem Cells. Cell 161 (5), 1187–1201 (2015) h ttps://doi.org/10.1016/j.cell.2015.04.044 [81] Islam, S., Kjällquist, U., Moliner, A., Za jac, P ., F an, J.-B., Lönnerb erg, P ., Linnarsson, S.: Highly m ultiplexed and strand-sp ecific single-cell RNA 5 ′ end sequencing. Nature Protocols 7 (5), 813–828 (2012) https://doi.org/10.1038/ nprot.2012.022 [82] Muraro, M.J., Dharmadhik ari, G., Grün, D., Groen, N., Dielen, T., Jansen, E., v an Gurp, L., Engelse, M.A., Carlotti, F., de Koning, E.J.P ., v an Oudenaarden, A.: A Single-Cell T ranscriptome Atlas of the Human Pancreas. Cell Systems 3 (4), 385–3943 (2016) https://doi.org/10.1016/j.cels.2016.09.002 [83] Xin, Y., Kim, J., Ni, M., W ei, Y., Ok amoto, H., Lee, J., A dler, C., Ca vino, K., Murphy , A.J., Y ancop oulos, G.D., Lin, H.C., Gromada, J.: Use of the Flu- idigm C1 platform for RNA sequencing of single mouse pancreatic islet cells. Pro ceedings of the National Academ y of Sciences 113 (12), 3293–3298 (2016) h ttps://doi.org/10.1073/pnas.1602306113 [84] Zappia, L., Phipson, B., Oshlack, A.: Splatter: Simulation of single-cell RNA sequencing data. Genome Biology 18 (1), 174 (2017) h ttps://doi.org/10.1186/ s13059- 017- 1305- 0 [85] Dempster, A.P ., Laird, N.M., Rubin, D.B.: Maximum Likelihoo d from Incom- plete Data Via the EM Algorithm. Journal of the Ro y al Statistical Society: Series B (Methodological) 39 (1), 1–22 (1977) h ttps://doi.org/10.1111/j.2517- 6161. 1977.tb01600.x [86] Gro ver, A., Lesko vec, J.: No de2v ec: Scalable F eature Learning for Netw orks. In: Pro ceedings of the 22nd A CM SIGKDD In ternational Conference on Kno wledge Disco very and Data Mining. KDD ’16, pp. 855–864. Asso ciation for Comput- ing Machinery , New Y ork, NY, USA (2016). https://doi.org/10.1145/2939672. 2939754 [87] McDonald, G.C.: Ridge regression. WIREs Computational Statistics 1 (1), 93– 100 (2009) https://doi.org/10.1002/wics.14 56 [88] P earson, K.: LI II. On lines and planes of closest fit to systems of p oin ts in space. The London, Edin burgh, and Dublin Philosophical Magazine and Journal of Science 2 (11), 559–572 (1901) [89] Sohl-Dic kstein, J., W eiss, E., Mahesw aranathan, N., Ganguli, S.: Deep Unsu- p ervised Learning using Nonequilibrium Thermo dynamics. In: Pro ceedings of the 32nd In ternational Conference on Mac hine Learning, pp. 2256–2265. PMLR, Lille, F rance (2015) [90] Ho, J., Jain, A., Abb eel, P .: Denoising Diffusion Probabilistic Mo dels. In: A dv ances in Neural Information Pro cessing Systems, vol. 33, pp. 6840–6851. Curran Associates, Inc., Virtual (2020) [91] P eebles, W., Xie, S.: Scalable Diffusion Models with T ransformers. In: Pro- ceedings of the IEEE/CVF International Conference on Computer Vision, pp. 4195–4205 (2023) [92] Go odfellow, I.J., Pouget-Abadie, J., Mirza, M., Xu, B., W arde-F arley, D., Ozair, S., Courville, A., Bengio, Y.: Generative A dversarial Nets. In: Adv ances in Neu- ral Information Pro cessing Systems, v ol. 27. Curran Asso ciates, Inc., Montréal Canada (2014) [93] Ronneb erger, O., Fisc her, P ., Brox, T.: U-Net: Con volutional Netw orks for Biomedical Image Segmen tation. In: Nav ab, N., Hornegger, J., W ells, W.M., F rangi, A.F. (eds.) Medical Image Computing and Computer-Assisted Interv en- tion – MICCAI 2015, pp. 234–241. Springer, Cham (2015). https://doi.org/10. 1007/978- 3- 319- 24574- 4_28 [94] Scarselli, F., Gori, M., T soi, A.C., Hagen buc hner, M., Monfardini, G.: The Graph Neural Netw ork Mo del. IEEE T ransactions on Neural Netw orks 20 (1), 61–80 (2009) h ttps://doi.org/10.1109/TNN.2008.2005605 [95] W an, C., Chang, W., Zhang, Y., Shah, F., Lu, X., Zang, Y., Zhang, A., Cao, S., Fishel, M.L., Ma, Q., Zhang, C.: L TMG: A no vel statistical modeling of tran- scriptional expression states in single-cell RNA-Seq data. Nucleic A cids Research 47 (18), 111 (2019) https://doi.org/10.1093/nar/gkz655 [96] Hin ton, G.E., Salakh utdinov, R.R.: Reducing the Dimensionality of Data with Neural Net works. Science 313 (5786), 504–507 (2006) https://doi.org/10.1126/ science.1127647 [97] Kingma, D.P ., W elling, M.: Auto-Enco ding V ariational Ba yes. arXiv (2022). h ttps://doi.org/10.48550/arXiv.1312.6114 [98] Dunn, J.C.: A F uzzy Relativ e of the ISODA T A Pro cess and Its Use in Detecting Compact W ell-Separated Clusters. Journal of Cyb ernetics 3 (3), 32–57 (1973) h ttps://doi.org/10.1080/01969727308546046 57 [99] Maaten, L., Hin ton, G.: Visualizing Data using t-SNE. Journal of Machine Learning Researc h 9 (86), 2579–2605 (2008) [100] McInnes, L., Healy , J., Melville, J.: UMAP: Uniform Manifold Approxima- tion and Pro jection for Dimension Reduction. arXiv (2020). h ttps://doi.org/10. 48550/arXiv.1802.03426 [101] Lo ve, M.I., Hub er, W., Anders, S.: Moderated estimation of fold c hange and disp ersion for RNA-seq data with DESeq2. Genome Biology 15 (12), 550 (2014) h ttps://doi.org/10.1186/s13059- 014- 0550- 8 [102] Finak, G., McDavid, A., Y a jima, M., Deng, J., Gersuk, V., Shalek, A.K., Slic hter, C.K., Miller, H.W., McElrath, M.J., Prlic, M., Linsley , P .S., Gottardo, R.: MAST: A flexible statistical framew ork for assessing transcriptional changes and c haracterizing heterogeneity in single-cell RNA sequencing data. Genome Biology 16 (1), 278 (2015) h ttps://doi.org/10.1186/s13059- 015- 0844- 5 [103] Mann, H.B., Whitney , D.R.: On a T est of Whether one of T wo Random V ariables is Sto c hastically Larger than the Other. The Annals of Mathematical Statistics 18 (1), 50–60 (1947) 2236101 [104] Wilco xon, F.: Individual Comparisons by Ranking Metho ds. Biometrics Bulletin 1 (6), 80–83 (1945) https://doi.org/10.2307/3001968 3001968 [105] W olf, F.A., Angerer, P ., Theis, F.J.: SCANPY: Large-scale single-cell gene expression data analysis. Genome Biology 19 (1), 15 (2018) https://doi.org/10. 1186/s13059- 017- 1382- 0 [106] W olf, F.A., Hamey , F.K., Plass, M., Solana, J., Dahlin, J.S., Göttgens, B., Ra jewsky , N., Simon, L., Theis, F.J.: P AGA: Graph abstraction recon- ciles clustering with tra jectory inference through a topology preserving map of single cells. Genome Biology 20 (1), 59 (2019) https://doi.org/10.1186/ s13059- 019- 1663- x [107] Ji, Z., Ji, H.: TSCAN: Pseudo-time reconstruction and ev aluation in single-cell RNA-seq analysis. Nucleic Acids Research 44 (13), 117 (2016) https://doi.org/ 10.1093/nar/gkw430 [108] Domínguez Conde, C., Xu, C., Jarvis, L.B., Rainbow, D.B., W ells, S.B., Gomes, T., Howlett, S.K., Suchanek, O., Polanski, K., King, H.W., Mamanov a, L., Huang, N., Szabo, P .A., Richardson, L., Bolt, L., F asouli, E.S., Mahbubani, K.T., Prete, M., T uc k, L., Richoz, N., T uong, Z.K., Campos, L., Mousa, H.S., Needham, E.J., Pritchard, S., Li, T., Elmentaite, R., Park, J., Rahmani, E., Chen, D., Menon, D.K., Bayraktar, O.A., James, L.K., Meyer, K.B., Y osef, N., Clat worth y , M.R., Sims, P .A., F arb er, D.L., Saeb-P arsy, K., Jones, J.L., T eich- mann, S.A.: Cross-tissue imm une cell analysis rev eals tissue-sp ecific features in humans. Science 376 (6594), 5197 (2022) h ttps://doi.org/10.1126/science. 58 abl5197 [109] Ding, S., Li, J., Luo, R., Cui, H., W ang, B., Chen, R.: scGPT: End-to-end proto col for fine-tuned retinal cell t yp e annotation. Nature Protocols (2025) h ttps://doi.org/10.1038/s41596- 025- 01220- 1 [110] Sp earman, C.: The Pro of and Measuremen t of Asso ciation b et ween T wo Things. The American Journal of Psychology 15 (1), 72–101 (1904) h ttps://doi.org/10. 2307/1412159 1412159 [111] Hub ert, L., Arabie, P .: Comparing partitions. Journal of Classification 2 (1), 193–218 (1985) https://doi.org/10.1007/BF01908075 [112] Kendall, M.G.: A New Measure of Rank Correlation. Biometrik a 30 (1-2), 81–93 (1938) h ttps://doi.org/10.1093/biomet/30.1- 2.81 [113] Virsh up, I., Rybak ov, S., Theis, F.J., Angerer, P ., W olf, F.A.: Anndata: Access and store annotated data matrices. Journal of Op en Source Softw are 9 (101), 4371 (2024) https://doi.org/10.21105/joss.04371 [114] Ritc hie, M.E., Phipson, B., W u, D., Hu, Y., Law, C.W., Shi, W., Smyth, G.K.: limma p o wers differential expression analyses for RNA-sequencing and microarra y studies. Nucleic acids researc h 43 (7), 47–47 (2015) [115] Ansel, J., Y ang, E., He, H., Gimelshein, N., Jain, A., V oznesensky , M., Bao, B., Bell, P ., Berard, D., Burovski, E., Chauhan, G., Chourdia, A., Constable, W., Desmaison, A., De Vito, Z., Ellison, E., F eng, W., Gong, J., Gsch wind, M., Hirsh, B., Huang, S., Kalam bark ar, K., Kirsc h, L., Lazos, M., Lezcano, M., Liang, Y., Liang, J., Lu, Y., Luk, C.K., Maher, B., Pan, Y., Puhrsc h, C., Reso, M., Saroufim, M., Siraic hi, M.Y., Suk, H., Zhang, S., Suo, M., Tillet, P ., Zhao, X., W ang, E., Zhou, K., Zou, R., W ang, X., Mathews, A., W en, W., Chanan, G., W u, P ., Chintala, S.: PyT orch 2: F aster Machine Learning Through Dynamic Python Byteco de T ransformation and Graph Compilation. In: Pro ceedings of the 29th ACM In ternational Conference on Architectural Supp ort for Program- ming Languages and Operating Systems, V olume 2. ASPLOS ’24, v ol. 2, pp. 929–947. Asso ciation for Computing Machinery , New Y ork, NY, USA (2024). h ttps://doi.org/10.1145/3620665.3640366 [116] P edregosa, F., V aro quaux, G., Gramfort, A., Michel, V., Thirion, B., Grisel, O., Blondel, M., Prettenhofer, P ., W eiss, R., Dubourg, V., V anderplas, J., P assos, A., Cournap eau, D., Bruc her, M., Perrot, M., Duc hesnay , É.: Scikit-learn: Mac hine Learning in Python. Journal of Machine Learning Research 12 (85), 2825–2830 (2011) [117] Ginestet, C.: Ggplot2: Elegan t Graphics for Data Analysis. Journal of the Roy al Statistical Society Series A: Statistics in So ciet y 174 (1), 245–246 (2011) h ttps: //doi.org/10.1111/j.1467- 985X.2010.00676_9.x 59 [118] Shaffer, A.L., Rosenw ald, A., Hurt, E.M., Giltnane, J.M., Lam, L.T., Pic keral, O.K., Staudt, L.M.: Signatures of the Immune Resp onse. Immunit y 15 (3), 375– 385 (2001) https://doi.org/10.1016/S1074- 7613(01)00194- 7 [119] Ziegenhain, C., Vieth, B., Parekh, S., Reinius, B., Guillaumet-Adkins, A., Smets, M., Leonhardt, H., Heyn, H., Hellmann, I., Enard, W.: Comparative Analysis of Single-Cell RNA Sequencing Metho ds. Molecular Cell 65 (4), 631–6434 (2017) h ttps://doi.org/10.1016/j.molcel.2017.01.023 60
Original Paper
Loading high-quality paper...
Comments & Academic Discussion
Loading comments...
Leave a Comment