IPatch: A Multi-Resolution Transformer Architecture for Robust Time-Series Forecasting
Accurate forecasting of multivariate time series remains challenging due to the need to capture both short-term fluctuations and long-range temporal dependencies. Transformer-based models have emerged as a powerful approach, but their performance dep…
Authors: Aymane Harkati, Moncef Garouani, Olivier Teste
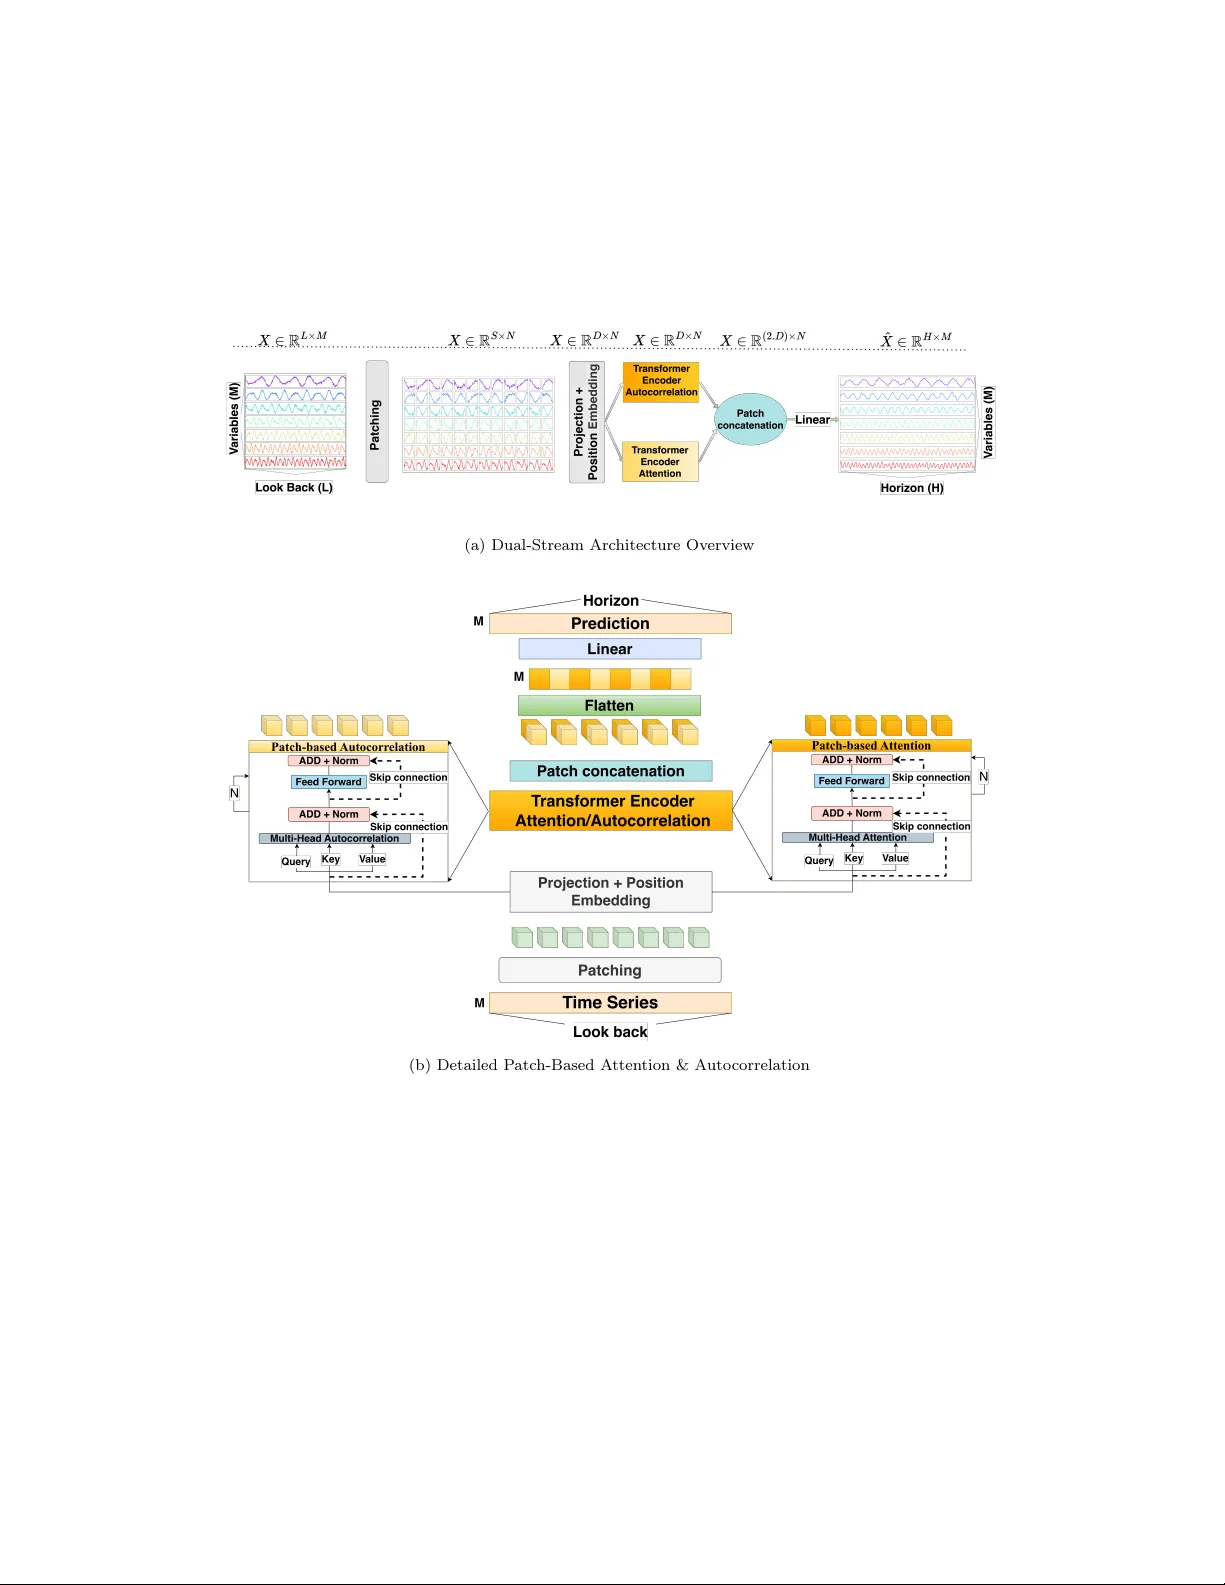
IP atc h: A Multi-Resolution T ransformer Arc hitecture for Robust Time-Series F orecasting A ymane Hark ati a , Moncef Garouani b , Olivier T este c , Julien Aligon b , Mohamed Hamlic h a a CCPS L ab or atory, ENSAM, Hassan II University, Casablanc a, 20670, Mor o c c o b IRIT, UMR 5505 CNRS, Université T oulouse Capitole, T oulouse, 31000, F r anc e c IRIT, UMR 5505 CNRS, Université T oulouse, UT2J, T oulouse, 31000, F r anc e Abstract A ccurate forecasting of multiv ariate time series remains c hallenging due to the need to capture both short-term fluctuations and long-range temp o- ral dep endencies. T ransformer-based mo dels ha ve emerged as a p o werful approac h, but their p erformance dep ends critically on the representation of temp oral data. T raditional p oint-wise represen tations preserv e individual time-step information, enabling fine-grained mo deling, y et they tend to b e computationally expensive and less effectiv e at mo deling broader contex- tual dep endencies, limiting their scalabilit y to long sequences. Patch-wise represen tations aggregate consecutiv e steps in to compact tok ens to impro ve efficiency and mo del lo cal temp oral dynamics, but they often discard fine- grained temp oral details that are critical for accurate predictions in v olatile or complex time series. W e prop ose IP atc h, a m ulti-resolution T ransformer arc hitecture that in tegrates both p oin t-wise and patch-wise tokens, mo deling temp oral information at m ultiple resolutions. Exp erimen ts on 7 b enc hmark datasets demonstrate that IP atch consisten tly improv es forecasting accuracy , robustness to noise, and generalization across v arious prediction horizons compared to single-represen tation baselines. Keywor ds: Time series forecasting, Data Representation, T ransformers, P atching, Auto correlation 1. In tro duction Time-series forecasting has increasingly adopted T ransformer arc hitec- tures, whose self-atten tion mec hanism enables the mo deling of long-range and heterogeneous temp oral dep endencies [1]. A cen tral design asp ect in adapting these mo dels to temporal data is the c hoice of input represen ta- tion (p oin t-wise[2] or patc h-wise[3]). T raditional p oint-wise encodings, in whic h each time step is treated as an individual tok en, preserve full temp oral resolution and allo w the mo del to capture fine-grained lo cal v ariations [4]. This prop erty is particularly imp ortan t in settings chara cterized by v olatility or rapid fluctuations. Ho wev er, point-wise represen tations incur substantial computational costs for long input sequences and offer limited capacit y to capture broader temp oral structure in the self-attention mec hanism [5]. This reduces their scalabilit y and effectiveness for long-horizon forecasting [2]. T o improv e scalability and incorp orate localized con textual information, recen t T ransformer-based architectures ha ve adopted p atch-wise represen- tations [3]. In this approac h, consecutive observ ations are aggregated into compact tok ens, effectively shortening the input sequence and enabling the mo del to capture short-range temp oral patterns more efficiently . P atch- based encodings ha v e demonstrated strong empirical performance and ha ve b een widely adopted, including in large-scale forecasting framew orks suc h as TimeLLM [6]. Nevertheless, aggregating m ultiple time steps within each patc h inevitably reduces temp oral resolution, p oten tially discarding subtle y et informative short-term dynamics[7]. This limitation b ecomes pronounced in irregular, noisy , or high-frequency environmen ts where lo cal fluctuations carry critical predictiv e v alue[8]. The resp ective limitations of p oint-wise and patc h-wise represen tations underscore their fundamen tally different mo deling capabilities. P oint-wise enco dings offer maximal temp oral fidelity but scale p o orly and lack the structural abstraction needed to capture broader temporal dep endencies[3]. P atch-wise enco dings provide efficient and con text-aw are summaries but ob- scure fine-grained patterns[7]. These characteristics indicate that the tw o represen tations capture complemen tary asp ects of temp oral dynamics and motiv ate the dev elopment of mo dels capable of join tly exploiting b oth gran- ular and con textual information within a unified arc hitecture. In this pap er w e in tro duce IP atch, a h ybrid T ransformer arc hitecture that in tegrates p oin t-wise and patc h-wise represen tations within a unified framew ork. The design incorp orates (i) a global in ter-patch atten tion mec h- anism that captures coarse temp oral dep endencies across segments, and (ii) an in tra-patch autocorrelation mo dule that preserv es fine-grained temp o- ral structure within eac h patc h. By join tly mo deling temp oral information at m ultiple resolutions, the architecture addresses the scaling limitations of 2 p oin t-wise enco dings while mitigating the loss of temp oral precision inheren t to patc h-wise aggregation. The remainder of this article is organized as follo ws. Section 2 reviews related w ork on T ransformer-based forecasting and representation strategies. Section 3 describes the prop osed IPatc h arc hitecture, highlighting its core comp onen ts and integration strategy . Section 4 rep orts the exp erimen tal setup and results, including ablation studies and comparisons with state- of-the-art baselines. Section 6 concludes with a summary and discussion of future researc h directions. 2. Researc h background and state of the art 2.1. Time series mo deling Time-series forecasting has ev olved from classical statistical methods to deep learning architectures [9]. T raditional mo dels, such as ARIMA [10] and Exp onen tial Smo othing (ETS) [11] provide interpretable solutions for linear trends and seasonal comp onents. While computationally efficient, they are limited in capturing nonlinear dynamics, multiv ariate interactions, and long- range dep endencies, whic h restricts their applicabilit y in complex real-w orld settings [12]. Neural net work-based models w ere in tro duced to ov ercome these limi- tations. Recurren t Neural Netw orks (RNNs) [13] and their gated v ariants LSTM and GR U [14] improv ed the ability to mo del sequential dep endencies. Hybrid architectures, suc h as CNN-LSTM [15], com bine con volutional lay ers for local feature extraction with recurren t la yers for temp oral mo deling, re- ducing input complexity and enabling more effectiv e short- to medium-term forecasting [16]. Despite these adv ances, recurrent models remain constrained b y v anishing gradien ts, limited parallelization, and difficult y in capturing v ery long-horizon dep endencies [17]. The introduction of the atten tion mechanism [18] mark ed a significan t step in addressing long-range dep endency c hallenges. By allowing the mo del to dynamically fo cus on relev ant parts of the input sequence, attention mit- igates the information b ottlenec k inherent in fixed-length context vectors of recurren t models. T ransformers [19], which rely entirely on self-atten tion, enable parallel processing and scalable modeling of long sequences. Sev eral T ransformer-based v ariants hav e b een developed for time-series forecasting, including Informer [2], Autoformer [20], FEDformer [21], and DLinear [5], 3 eac h prop osing mechanisms to address either computational complexity , p e- rio dicit y mo deling, or scalability . Despite these innov ations, most rely on p oin t-wise represen tations, enco ding eac h timestamp as an independent to- k en. While this preserv es temp oral granularit y , it often fails to capture lo cal con tinuit y and short-term v ariations within the series [2]. T o address the limitations of p oint-wise enco ding, patch-based represen- tations hav e b een in tro duced. Inspired by Vision T ransformers [22], mo dels suc h as P atchTST [3] segmen t the input sequence in to compact patches, whic h are em b edded and pro cessed b y atten tion lay ers. This approach re- duces sequence length, impro ves computational efficiency , and captures lo cal temp oral dependencies. Extensions suc h as TimesNet [23] and Crossformer [24] further incorporate m ulti-scale and cross-dimensional attention to en- hance represen tation capacity . While patching provides scalability and struc- tural abstraction, it inherently discards fine-grained temp oral details and in- tro duces sensitivity to patc h size. Ov erlapping patc hes ha v e been prop osed to mitigate this information loss [3], allowing eac h timestamp to app ear in m ultiple em b eddings and theoretically enric hing contextual represen tations. Ho wev er, it has b een demonstrated that ov erlapping do es not necessarily lead to an impro v ement in p erformance. In some situations, it can even result in a decline in outcomes (see Sec. 2.2). T o mitigate information loss from patc hing, an oversampling strategy is prop osed, where patches are extracted with ov erlap [25]. This design ensures that each timestamp ma y app ear in m ultiple patches, theoretically enriching its contextual em b edding [3]. Ho wev er, as shown in the next subsection, the b enefits of o verlapping are not as robust as expected and may even degrade p erformance in some scenarios. 2.2. R ese ar ch pr oblem P atch-based representations ha ve emerged as a p opular strategy in transformers-based time series forecasting. How ever, despite their effectiv e- ness at capturing global temp oral dep endencies, patch-based represen tations inheren tly lose fine-grained information within eac h segment[7]. This limi- tation b ecomes particularly problematic for highly v olatile or irregular time series, where subtle short-term v ariations are critical for accurate forecasting. A common solution is the use of overlapping patc hes, inspired by n-grams in natural language pro cessing, where each timestamp is included in m ultiple patc hes[26]. This redundancy is in tended to enhance the mo del’s abilit y to main tain lo cal con tinuit y and integrate long-range temp oral in teractions. 4 While in tuitive, o verlapping patc hes do not consistently translate in to substan tial p erformance gains. Our empirical ev aluation, detailed in T able 1, across 7 b enc hmark datasets [2] and multiple forecasting horizons reveal that o verlapping patc hes provide only marginal improv ements. On a verage, the gain in Mean-Squared Error (MSE) and Mean-Absolute Error (MAE) is less than 0.01 and 0.005, resp ectiv ely . In some s cenarios, such as sp ecific horizons of ILI and ETTh1 datasets, the non-o verlapping performs equally well or ev en b etter. These results show that ov erlapping patc hes add minimal b enefit, and in some scenarios, it ma y even blur short-term v ariations. T able 1: Performance of Patc hTST with/without ov erlapping patc hes across v arious datasets and horizons. Best scores are in bold blue, underlined v alues denote equal per- formance. Blue indicates gains, and red indicates losses relative to baseline. Datasets Horizon Patc hTST (with ov erlapping) Patc hTST (w/o ov erlapping) MSE MAE MSE MAE ILI 24 1.963( ▲ + 6 . 72% ) 0.878( ▲ + 6 . 50% ) 2.095 0.939 36 1.981( ▼ − 1 . 00% ) 0.898( ▲ + 0 . 33% ) 1.961 0.901 48 2.022( ▲ + 0 . 19% ) 0.935( ▲ + 1 . 54% ) 2.026 0.949 60 1.991( ▼ − 3 . 61% ) 0.924( ▼ − 0 . 86% ) 1.919 0.916 Electricity 96 0.200( ▲ + 2% ) 0.288( ▲ + 1 . 73% ) 0.204 0.293 192 0.203( ▲ + 1 . 97% ) 0.293( ▲ + 1 . 70% ) 0.207 0.298 336 0.194( ▲ + 1 . 03% ) 0.284( ▲ + 1 . 40% ) 0.196 0.288 720 0.260( ▲ + 1 . 92% ) 0.340( ▲ + 1 . 47% ) 0.265 0.345 W eather 96 0.174( ▲ + 1 . 14% ) 0.213( ▲ + 1 . 40% ) 0.176 0.216 192 0.228( ▲ + 0 . 87% ) 0.260( ▲ + 0 . 38% ) 0.230 0.261 336 0.282( ▲ + 0 . 35% ) 0.298( ▲ + 0 . 33% ) 0.283 0.299 720 0.355( ▲ + 0 . 84% ) 0.347 ( ▶ +0 . 00% ) 0.358 0.347 ETTh1 96 0.377( ▼ − 0 . 53% ) 0.397 ( ▶ +0 . 00% ) 0.375 0.397 192 0.431( ▲ + 1 . 39% ) 0.427( ▲ + 0 . 23% ) 0.437 0.428 336 0.477( ▲ + 1 . 25% ) 0.450( ▲ + 0 . 22% ) 0.483 0.451 720 0.484( ▼ − 0 . 41% ) 0.477( ▼ − 0 . 83% ) 0.482 0.473 ETTh2 96 0.296( ▲ + 0 . 76% ) 0.343( ▲ + 0 . 58% ) 0.298 0.345 192 0.382( ▲ + 0 . 52% ) 0.395( ▲ + 0 . 50% ) 0.384 0.397 336 0.425( ▲ + 0 . 47% ) 0.434( ▲ + 0 . 23% ) 0.427 0.435 720 0.432( ▲ + 0 . 23% ) 0.448 ( ▶ +0 . 00% ) 0.433 0.448 ETTm1 96 0.332( ▼ − 0 . 60% ) 0.367( ▼ − 0 . 54% ) 0.330 0.365 192 0.367( ▲ + 1 . 63% ) 0.386( ▲ + 0 . 25% ) 0.373 0.387 336 0.410( ▲ + 0 . 97% ) 0.407 ( ▶ +0 . 00% ) 0.414 0.407 720 0.459( ▲ + 0 . 21% ) 0.440( ▼ − 0 . 22% ) 0.460 0.439 ETTm2 96 0.176( ▲ + 1 . 70% ) 0.261( ▲ + 1 . 14% ) 0.179 0.264 192 0.242 ( ▶ +0 . 00% ) 0.303 ( ▶ +0 . 00% ) 0.242 0.303 336 0.300( ▲ + 0 . 33% ) 0.339( ▲ + 0 . 29% ) 0.301 0.340 720 0.401( ▲ + 0 . 24% ) 0.398 ( ▶ +0 . 00% ) 0.402 0.398 5 These findings reveal that redundancy through o verlapping alone is in- sufficien t to preserve lo cal contin uity in patc h-based T ransformers. T o ad- dress this, it is essential to adopt an approach that explicitly integrates b oth global and local temp oral mo deling. By combining patch-lev el attention with p oint-wise in tra-patch represen tations, a hybrid framework can main- tain fine-grained temp oral details while capturing broader contextual dep en- dencies. This principle underlies our prop osed architecture, which unifies m ulti-resolution temp oral information to improv e b oth accuracy and robust- ness in b oth short- and long-term horizon forecasting. 3. Prop osed approac h W e formalize the m ultiv ariate time series forecasting task as follows. Let X = ( x i,j ) 1 ≤ i ≤ L, 1 ≤ j ≤ M denotes a multiv ariate time series with M v ari- ables and a lo okbac k window of length L , where each x • j ∈ R L repre- sen ts a v ariable. The ob jectiv e is to predict the future H steps, ˆ X = ( ˆ x i,j ) L +1 ≤ i ≤ L + H, 1 ≤ j ≤ M , based on the observ ed sequence X . 3.1. A r chite ctur e Overview Figure 1 illustrates the o verall architecture of the prop osed IP atch ap- proac h. The pro cess b egins with the segmentation of the input time series in to patc hes of uniform length, follo w ed b y the application of positional en- co ding to each patc h to retain temp oral information (Figure 1-a). These en- co ded patches are then pro cessed through an Enco der lay er, which leverages the atten tion mec hanism to capture con textual relationships across patc hes, allo wing each patc h to integrate con textual insigh ts from others (Figure 1-b, Patch-b ase d A ttention ). T o address lo cal dep endencies within individual patc hes, an Auto corre- lation Atten tion blo c k is incorp orated (Figure 1-b, Patch-b ase d Auto c orr ela- tion ). Th is blo ck employs frequency-domain analysis to detect p eriodic pat- terns within each patc h (p oin t-wise), with the relativ ely compact patch size enhancing the efficacy of p erio dicit y detection. The outputs from the En- co der and Auto correlation A ttention la yers are subsequently concatenated, yielding enric hed representations that synergistically combine inter-patc h con textual information with a rolled intra-patc h lo cal details. 6 (a) Dual-Stream Arc hitecture Ov erview (b) Detailed P atc h-Based A tten tion & Auto correlation Figure 1: (a) The prop osed dual-stream a rc hitecture. The input s equence X = ( x i,j ) 1 ≤ i ≤ L, 1 ≤ j ≤ M is fi r s t divided in to N patc hes and com bined with p ositional enco d- ing. It is then passed in to a T ransformer Enco der blo c k for patc h atten tion and an Auto correlation blo c k for inner-patc h auto correlation. The outputs of b oth blo c ks are concatenated and flattened, then passed through a Linear la y er to generate the final prediction ˆ X = ( ˆ x i,j ) L +1 ≤ i ≤ L + H , 1 ≤ j ≤ M . (b) Detailed view of the T ransformer Enco der atten tion and the Auto correlation blo c k. 7 Figure 1: (a) The prop osed dual-stream arc hitecture. The input sequence X = ( x i,j ) 1 ≤ i ≤ L, 1 ≤ j ≤ M is fi rst divided in to N patches and com bined with p ositional enco d- ing. It is then passed in to a T ransformer Enco der blo c k for patc h attention and an Auto correlation blo c k for inner-patch auto correlation. The outputs of b oth blo c ks are concatenated and flattened, then passed through a Linear lay er to generate the final prediction ˆ X = ( ˆ x i,j ) L +1 ≤ i ≤ L + H, 1 ≤ j ≤ M . (b) Detailed view of the T ransformer Encoder atten tion and the Auto correlation blo ck. 7 F ormally , the input m ultiv ariate time series X is segmen ted in to N patc hes of length S , with O as the o verlapping/non-o verlapping part b et ween patches, suc h that N = ⌊ L − S O ⌋ + 1 , with 1 ≤ O ≤ S < L . The patc hes are defined as: X patched = ( P k,j ) 1 ≤ k ≤ N , 1 ≤ j ≤ M (1) where P k,j ∈ R S × N in the k th patc h of the v ariable x • j . W e use a v anilla T ransformer encoder that maps the observ ed signals to the latent representations [3]. The patches are mapp ed to the T ransformer laten t space of dimension D mapping the length of patches via a linear pro jec- tion, W pro j ∈ R D × S , with the addition of a p osition enco ding, W pos ∈ R D × N to retain temp oral ordering b et ween patc hes, and thus enabling the mo del to capture medium- and long-term trends. Each patc h is pro jected into a higher-dimensional em b edding using a learnable linear transformation: P ′ k,j = W pro j P k,j + W pos , k ∈ [1 ..N ] , (2) with P ′ k,j ∈ R D × N , W pro j ∈ R D × S , and W pos ∈ R D × N . These embeddings are fed into a T ransformer Enco der, where self-attention is calculated betw een these patc hes, allo wing eac h patch to attend to other patc hes, capturing global inter-patc h dep endencies: Z 1 ( P ′ k,j ) = Enco der attention ( P ′ k,j ) (3) Z 2 ( P ′ k,j ) = Enco der autocorr elation ( P ′ k,j ) (4) with Z 1 ( P ′ k,j ) ∈ R D × N and Z 2 ( P ′ k,j ) ∈ R D × N . 3.1.1. Patch-b ase d A ttention T o ac hieve global patch-wise dep endencies, w e use the enco der attention blo c k from a v anilla T ransformer encoder [19]. The set of patc hes P ′ k,j is represen ted b y query Q , k ey K , and v alue V matrices, in the m ulti-head atten tion, with H n as num b er of heads and d h = D /H n as the dimension of eac h head. Q h = W Q h P ′ k,j , K h = W K h P ′ k,j , V h = W V h P ′ k,j , h = 1 , . . . , H n (5) where W Q h , W K h , W V h ∈ R d h × D , are resp ectiv ely the w eight matrices of Q h , K h , V h ∈ R d h × N . 8 The atten tion weigh ts are deriv ed by computing the scaled dot-pro duct b et w een the Query matrix Q h and the transp osed Key matrix K ⊤ h , follo wed b y normalization using the softmax function across the k ey dimension. F or- mally , the atten tion matrix A h is giv en by : A h = softmax Q h K ⊤ h √ d k , h = 1 , . . . , H n (6) where A h ∈ R N × N . The resulting attention distribution is then applied to the V alue matrix V h to yield the final w eighted representation: A ttention h ( Q h , K h , V h ) = A h V h , h = 1 , . . . , H n (7) The outputs from the H atten tion heads are concatenated and linearly pro- jected to form the final multi-head attention represen tation. The head- sp ecific outputs are first computed and then com bined for eac h input patc h P ′ k,j , according to the follo wing formula: Z 1 ( P ′ k,j ) = Enco der attention ( P ′ k,j ) = concat A ttention h ( Q h , K h , V h ) , h = 1 , . . . , H n (8) 3.1.2. Patch’s Point-wise Auto c orr elation T o comp ensate the loss of fine-grained details in patching, w e incorp orate a p oint-wise Auto c orr elation blo ck . This blo c k pro cesses each patch indep en- den tly , capturing intra-patc h temp oral dep endencies. F ormally , the set of patches P ′ k,j is transformed into query Q , k ey K , and v alue V matrices, in the multi-head attention, with H n as n umber of heads and d h = D /H n as the dimension of eac h head. Q h,k = W Q h P ′ k,j , K h,k = W K h P ′ k,j , V h,k = W V h P ′ k,j , h = 1 , . . . , H n (9) where W Q h , W K h , W V h ∈ R d h × D , are resp ectiv ely the w eight matrices of Q h,k , K h,k , V h,k ∈ R d h × N . F ast F ourier T ransform (FFT) [27] is then applied to eac h patch: ˆ Q h,k = F ( Q h,k ) , ˆ K h,k = F ( K h,k ) , h = 1 , . . . , H n (10) where F ( • ) denotes a 1-D F ast F ourier T ransform applied within each patch. T o exploit the efficiency of frequency-domain op erations, we define the trans- formed represen tations: ˆ A h,k = ˆ Q h,k ⊙ ˆ K ∗ h,k , (11) 9 where ⊙ denotes element-wise multiplication and ( · ) ∗ is the complex conju- gate 1 . The attention map in the spatial domain can then b e reco v ered by the in verse F ourier transform: A h,k = F − 1 ( ˆ A h,k ) . (12) Applying the FFT pro jects the query and key representations in to the fre- quency domain, where correlations b et w een elements becomes more promi- nen t [28]. Rep etitiv e or structured patterns in the input sequence are easily captured in this domain, as frequency-domain representations simplify the temp oral signal. A set of detected p eriods { τ 1 ,k . . . τ l,k } with their corresp onding weigh ts { w 1 ,k . . . w l,k } are used to roll the v alues V , pro ducing temp orally shifted sub-series that represen t rep eated patterns: V ′ h,k = Roll ( V h,k , τ l ) , h = 1 . . . H n (13) The state-of-the-art softmax-based autocorrelation [20] introduces non- negativ e weigh ts enabling the rejection of an ti-correlated dep endencies that- suppress ra w frequency-domain correlations. Instead, w e employ F ourier- KAN (FKAN) la yers [29], which extend the original K olmogorov-Arnold Net work (KAN) [30] b y parameterizing the univ ariate functions with learn- able p erio dic F ourier basis functions. This design yields significan tly greater expressiv eness than spline-based KANs, enables b oth p ositiv e and negativ e con tributions through sin usoidal terms, and offers more adaptiv e control o ver p eriodicity . This approach yielded b etter results, see ablation study (Sec 5.3). Auto corr h ( Q h,k , K h,k , V h,k ) = J X ℓ =1 Roll V h,k , τ ℓ,k ⊙ FKAN( w ℓ,k ) (14) with Auto corr h,k ∈ R d h × N . After pro cessing eac h head, we obtain the rolled version of each patc h. The outputs of all auto correlation blo c ks are then concatenated to form the final represen tation. 1 F or a complex num b er z = a + bi (where a, b ∈ R and i = √ − 1 ), its complex conjugate is z ∗ = a − bi . 10 Z 2 ( P ′ k,j ) = Enco der autocorr elation ( P ′ k,j ) = concat(Auto corr h ( Q h,k , K h,k , V h,k )) , h = 1 , . . . , H n (15) 3.1.3. Patch c onc atenation Outputs from the Z 1 ( P ′ k,j ) patc h-based T ransformer and the Z 2 ( P ′ k,j ) Au- to correlation blo ck are concatenated along the embedding dimension: C k,j = concat( Z 1 ( P ′ k,j ) , Z 2 ( P ′ k,j )) (16) with , C k,j ∈ R 2 D × N . The concatenated tensor is then flattened across patches and pro jected to the forecasting horizon H : ˆ X L +1: L + H = W out Flatten ( C k,j ) + b out (17) where ˆ X L +1: L + H ∈ R H × M , W out ∈ R H × 2 D N is the weigh t matrix of the final linear lay er that pro jects Flatten ( C k,j ) ∈ R 2 DN × M in to the horizon H , and b out ∈ R H × M is the bias term. This dual-stream design allo ws the mo del to retain global con text through patc h-based em b eddings and lo cal precision through point-wise Auto correlation, effectiv ely mitigating the shortcomings of single-represen tation approaches. 4. Exp erimen tal Study T o ev aluate the effectiveness of the prop osed approach, extensive exp er- imen ts hav e b een p erformed on widely adopted b enchmark datasets. All implemen tations were conducted using the TFB p ac k age [31], whic h ensures repro ducibilit y and consistency in prepro cessing, environmen t setup, and data splits across mo dels and baselines. F or eac h mo del, dataset and fore- casting horizon, w e p erformed an indep enden t hyperparameter optimization pro cedure, ensuring that every mo del is ev aluated under its b est-performing configuration. The source co de of the prop osed IP atch is av ailable on 2 . 2 https://anonymous.4open.science/r/TFB_IPatch- 3132/README.md 11 4.1. Datasets W e ev aluate the prop osed architecture on 7 widely used multiv ariate time- series datasets from the forecasting literature [2]. These datasets span div erse real-w orld domains and exhibit substan tial heterogeneity in their temp oral structures, co vering stationary dynamics, strong seasonal patterns, and long- term monotonic trends. • Electricit y T ransformer T emp erature collection comprises 4 sub- sets ETTh1 , ETTh2 , ETTm1 , and ETTm2 capturing oil temp era- ture and load dynamics of electricit y transformers. ETTh subsets are sampled hourly , while ETTm subsets offer 15-min ute resolution. Eac h subset contains 7 v ariables, where b oth short-term fluctuations and long-term seasonalit y co exist. • Electricit y T ransformer T emp erature (ETT) dataset consists of hourly electricity consumption records from 321 customers. It is a high- dimensional dataset (321 v ariables), widely used to test the scalabilit y of forecasting mo dels. The series exhibit strong daily and weekly sea- sonal patterns, as w ell as o ccasional abrupt changes caused by external ev ents such as holidays and weather anomalies. • W eather dataset is collected from 21 meteorological stations and in- cludes v ariables such as temp erature, h umidit y , wind sp eed, and solar radiation. It contains ov er 52,000 hourly observ ations. Its complex temp oral dynamics arises from both short-term v ariability (e.g., diur- nal cycles) and long-term trends (e.g., seasonal climate effects). • Influenza-Lik e Illness (ILI) dataset records the p ercen tage of patient visits for influenza-like symptoms across 7 regions in the United States. Unlik e the other datasets, it has a w eekly resolution with a relativ ely short history (966 timesteps). Its irregular dynamics, high noise level, and small data size make it particularly challenging, providing a strong ev aluation ground for long-range generalization. 4.2. Baselines T o assess the efficiency of the prop osed approac h, it is compared against a comprehensive set of state-of-the-art baselines that span differen t metho d- ological families. The compared mo dels include T ransformer-based architec- tures such as P atc hTST [3], FEDformer [21], Autoformer [20], Informer [2], 12 Datasets W eather Electricity ILI ETTh1 ETTh2 ETTm1 ETTm2 F eatures (M) 21 321 7 7 7 7 7 Timesteps 52696 26304 966 17420 17420 69680 69680 T able 2: Description of the datasets used in the exp erimen ts. and Crossformer [24]; con v olutional and sp ectral approac hes suc h as Times- Net [23] and MICN [32]; linear mo dels such as DLinear [5] and TimeMixer [33]; as w ell as decomp osition-based metho ds includin g FiLM [34] and Station- ary [35]. This collection cov ers the dominan t paradigms in mo dern time series forecasting, ranging from attention-based sequence mo dels to light weigh t lin- ear forecasters and decomp osition-driv en designs. Some baselines previously rep orted in the literature such as P AREformer [36], could not b e included in our exp erimental study due to the una v ailabilit y of their source co de, lack of resp onse from the authors, or the imp ossibilit y of faithfully re-implemen ting their architectures given missing implementation details and hyperparame- ters. All models are trained and ev aluated under the same exp erimen tal con- figuration, ensuring a fair and consistent comparison across methods. MSE and MAE ev aluations metrics are used : MAE = 1 n n X i =1 | y i − ˆ y i | MSE = 1 n n X i =1 ( y i − ˆ y i ) 2 (18) 4.3. F or e c asting Setup F or all datasets, the time series are segmen ted in to batc hes of size B , eac h con taining a sequence of length T = L + H . W e use a fixed lo ok-bac k windo w of L = 96 time steps across all models, resulting in input tensors of shap e ( B , T , M ) , where M denotes the n um b er of v ariables in eac h dataset. F or the ETT , Ele ctricity , and W e ather datasets, the forecasting horizons H are set to { 96 , 192 , 336 , 720 } , follo wing established exp erimen tal proto cols in prior w ork [20]. F or the ILI dataset, whic h is shorter and sampled at a coarser temp oral resolution, we adopt horizons of { 24 , 36 , 48 , 60 } , consistent with standard practice in the literature [20]. This configuration enables a systematic ev aluation of forecasting p erformance across b oth short-term and long-horizon prediction scenarios. 13 5. Results and discussion 5.1. Effe ctiveness of IPatch T able 3 provides a detailed comparison of the proposed IP atch model against a range of state-of-the-art forecasting mo dels across multiple datasets and v arying prediction horizons. Several imp ortan t observ ations can b e dra wn: First, IPatc h demonstrates a consisten tly robust p erformance across all datasets and horizons, ac hieving eith er the b est results in the v ast ma jor- it y of cases. On short-horizon forecasting tasks, suc h as ILI with horizons { 24 , 36 , 48 , 60 } , our approach clearly dominates: it ac hieves the low est MSE and MAE in all configurations, outp erforming recent strong baselines such as TimeMixer[33] and Patc hTST[3] b y a significan t margin. This highligh ts the abilit y of our hybrid patch–point design to capture b oth fine-grained lo cal v ariations and global seasonal effects, whic h are especially critical in sparse and noisy health-related data. Second, in large-scale industrial benchmarks such as Electricit y and W eather, IP atch is not only competitive but also consisten tly among the top t wo performers across horizons { 96 , 192 , 336 , 720 } . Notably , it achiev es the b est o verall accuracy in most short- and mid-range horizons (96, 192, 336), while main taining comp etitiv e robustness at the longest horizon of 720 steps. This stabilit y across horizons suggests that the mo del do es not suffer from degradation as the forecasting windo w increases—a challenge commonly observ ed in T ransformer-based baselines such as Informer or Autoformer. Third, for the ETT datasets ETTh1, ETTh2, ETTm1, ETTm2, whic h are known for their p erio dic yet non-stationary b eha viors, IPatc h consisten tly outp erforms or matc hes strong baselines like TimeMixer and P atc hTST. The impro vemen ts are most pronounced at longer horizons (e.g., 336 and 720), where man y mo dels struggle to main tain accuracy . This underlines the ro- bust long-range dependency mo deling ac hieved b y integrating patc h-level represen tations with p oin t-wise refinement. When results are aggregated across all b enc hmarks, IP atc h ac hieves the b est score on 26 out of 28 configurations for MAE and 21 out of 28 for MSE. This frequency highlights not only p eak p erformance but also the robustness of our approac h across div erse domains, ranging from epidemiological series (ILI) to high-dimensional industrial data (Electricit y , W eather) and p erio dic y et non-stationary b eha viors (ETT). 14 T able 3: Long-term F orcasting : Unified Lo ok-back of 96, with horizon ∈ { 96 , 192 , 336 , 720 } for Electricity , W eather & ETT, ILI horizon is set ∈ { 24 , 36 , 48 , 60 } Bold results are the b est outcomes, underlined are second b est. Model IPatc h (Ours) TimeMixer Patc hTST TimesNet Crossformer MICN FiLM DLinear FEDformer Stationary Autoformer Informer Metric MSE MAE MSE MAE MSE MAE MSE MAE MSE MAE MSE MA E MSE MAE MSE MAE MSE MAE MSE MAE MSE MAE MSE MAE ILI 24 1.604( ▲ + 9 , 17% ) 0.751( ▲ + 12 , 38% ) 1.766 0.844 1.963 0.878 2.616 1.079 3.197 1.149 2.341 1.038 2.223 0.986 2.203 1.036 2.565 1.080 2.301 1.035 2.651 1.114 3.179 1.278 36 1.689( ▲ + 5 , 50% ) 0.799( ▲ + 9 , 38% ) 1.782 0.874 1.981 0.898 2.030 0.945 3.653 1.264 2.339 1.052 2.155 0.997 2.323 1.076 3.099 1.227 2.109 1.004 2.651 1.114 2.788 1.125 48 1.562( ▲ + 19 , 91% ) 0.783( ▲ + 15 , 58% ) 1.873 0.905 2.022 0.935 2.032 0.917 3.903 1.317 2.437 1.068 2.144 1.011 2.436 1.146 3.183 1.239 2.477 1.094 2.846 1.146 2.942 1.160 60 1.445( ▲ + 24 , 84% ) 0.783( ▲ + 12 , 26% ) 1.804 0.910 1.991 0.924 1.836 0.879 4.695 1.451 2.260 0.996 2.003 0.936 2.305 1.088 2.706 1.109 2.429 1.086 2.716 1.128 3.024 1.166 Electricity 96 0.153( ▶ +0% ) 0.239( ▲ + 3 , 34% ) 0.153 0.247 0.200 0.288 0.168 0.272 0.219 0.314 0.180 0.293 0.198 0.274 0.210 0.302 0.193 0.308 0.169 0.273 0.201 0.317 0.274 0.368 192 0.163( ▲ + 1 , 84% ) 0.248( ▲ + 3 , 22% ) 0.166 0.256 0.203 0.293 0.184 0.322 0.231 0.322 0.189 0.302 0.198 0.278 0.210 0.305 0.201 0.315 0.182 0.286 0.222 0.334 0.296 0.386 336 0.182( ▲ + 1 , 64% ) 0.268( ▲ + 3 , 35% ) 0.185 0.277 0.194 0.284 0.198 0.300 0.246 0.337 0.198 0.312 0.217 0.300 0.223 0.319 0.214 0.329 0.200 0.304 0.231 0.443 0.300 0.394 720 0.215( ▲ + 4 , 65% ) 0.296( ▲ + 4 , 73% ) 0.225 0.310 0.260 0.340 0.220 0.320 0.280 0.363 0.217 0.330 0.278 0.356 0.258 0.350 0.246 0.355 0.222 0.321 0.254 0.361 0.373 0.439 W eather 96 0.164( ▼ − 0 , 60% ) 0.202( ▲ + 3 , 46% ) 0.163 0.209 0.174 0.213 0.172 0.220 0.195 0.271 0.198 0.261 0.195 0.236 0.195 0.252 0.217 0.296 0.173 0.223 0.266 0.336 0.300 0.384 192 0.210( ▼ − 0 , 95% ) 0.245( ▲ + 2 , 04% ) 0.208 0.250 0.228 0.260 0.219 0.261 0.209 0.277 0.239 0.299 0.239 0.271 0.237 0.295 0.276 0.336 0.245 0.285 0.307 0.367 0.598 0.544 336 0.266( ▼ − 7 , 51% ) 0.286( ▲ + 0 , 34% ) 0.251 0.287 0.282 0.298 0.246 0.337 0.273 0.332 0.285 0.336 0.289 0.306 0.282 0.331 0.339 0.380 0.321 0.338 0.359 0.395 0.578 0.523 720 0.350( ▼ − 3 , 14% ) 0.341( ▶ +0% ) 0.339 0.341 0.355 0.347 0.365 0.359 0.379 0.401 0.351 0.388 0.361 0.351 0.345 0.382 0.403 0.428 0.414 0.410 0.419 0.428 1.059 0.741 ETTh1 96 0.376( ▼ − 0 , 26% ) 0.391( ▲ + 2 , 30% ) 0.375 0.400 0.377 0.397 0.384 0.402 0.423 0.448 0.426 0.446 0.438 0.433 0.397 0.412 0.395 0.424 0.513 0.491 0.449 0.459 0.865 0.713 192 0.418( ▲ + 2 , 63% ) 0.419( ▲ + 0 , 47% ) 0.429 0.421 0.431 0.427 0.436 0.429 0.471 0.474 0.454 0.464 0.493 0.466 0.446 0.441 0.469 0.470 0.534 0.504 0.500 0.482 1.008 0.792 336 0.452( ▲ + 7 , 07% ) 0.439( ▲ + 4 , 32% ) 0.484 0.458 0.477 0.450 0.638 0.469 0.570 0.546 0.493 0.487 0.547 0.495 0.489 0.467 0.530 0.499 0.588 0.535 0.521 0.496 1.107 0.809 720 0.456( ▲ + 9 , 21% ) 0.466( ▲ + 3 , 43% ) 0.498 0.482 0.484 0.477 0.521 0.500 0.653 0.621 0.526 0.526 0.586 0.538 0.513 0.510 0.598 0.544 0.643 0.616 0.514 0.512 1.181 0.865 ETTh2 96 0.284( ▲ + 1 , 76% ) 0.333( ▲ + 2 , 40% ) 0.289 0.341 0.296 0.343 0.340 0.374 0.745 0.584 0.372 0.424 0.322 0.364 0.340 0.394 0.358 0.397 0.476 0.458 0.346 0.388 3.755 1.525 192 0.355( ▲ + 4 , 78% ) 0.382( ▲ + 2 , 61% ) 0.372 0.392 0.382 0.395 0.402 0.414 0.877 0.656 0.492 0.492 0.404 0.414 0.482 0.479 0.429 0.439 0.512 0.493 0.456 0.452 5.602 1.931 336 0.406( ▼ − 4 , 92% ) 0.418( ▼ − 0 , 95% ) 0.386 0.414 0.425 0.434 0.452 0.452 1.043 0.731 0.607 0.555 0.435 0.445 0.591 0.541 0.496 0.487 0.552 0.551 0.482 0.486 4.721 1.835 720 0.410( ▲ + 0 , 48% ) 0.431( ▲ + 0 , 69% ) 0.412 0.434 0.432 0.448 0.462 0.468 1.104 0.763 0.824 0.655 0.447 0.458 0.839 0.661 0.463 0.474 0.562 0.560 0.515 0.511 3.647 1.625 ETTm1 96 0.304( ▲ + 5 , 26% ) 0.341( ▲ + 4 , 69% ) 0.320 0.357 0.332 0.367 0.338 0.375 0.404 0.426 0.365 0.387 0.353 0.370 0.346 0.374 0.379 0.419 0.386 0.398 0.505 0.475 0.672 0.571 192 0.352( ▲ + 2 , 55% ) 0.369( ▲ + 3 , 25% ) 0.361 0.381 0.367 0.386 0.374 0.387 0.450 0.451 0.403 0.408 0.389 0.387 0.382 0.391 0.426 0.441 0.459 0.444 0.553 0.496 0.795 0.669 336 0.380( ▲ + 2 , 63% ) 0.392( ▲ + 3 , 06% ) 0.390 0.404 0.410 0.407 0.410 0.411 0.532 0.515 0.436 0.431 0.421 0.408 0.415 0.415 0.445 0.459 0.495 0.464 0.621 0.537 1.212 0.871 720 0.436( ▲ + 4 , 12% ) 0.424( ▲ + 4 , 00% ) 0.454 0.441 0.459 0.440 0.478 0.450 0.666 0.589 0.489 0.462 0.481 0.441 0.473 0.451 0.543 0.490 0.585 0.516 0.671 0.561 1.166 0.823 ETTm2 96 0.170( ▲ + 2 , 94% ) 0.250( ▲ + 3 , 20% ) 0.175 0.258 0.176 0.261 0.187 0.267 0.287 0.366 0.197 0.296 0.183 0.266 0.193 0.293 0.203 0.287 0.192 0.274 0.255 0.339 0.365 0.453 192 0.237( ▶ +0% ) 0.296( ▲ + 1 , 01% ) 0.237 0.299 0.242 0.303 0.249 0.309 0.414 0.492 0.284 0.361 0.248 0.305 0.284 0.361 0.269 0.328 0.280 0.339 0.281 0.340 0.533 0.563 336 0.297( ▲ + 0 , 33% ) 0.366( ▼ − 7 , 10% ) 0.298 0.340 0.300 0.339 0.321 0.351 0.597 0.542 0.381 0.429 0.309 0.343 0.382 0.429 0.325 0.366 0.334 0.361 0.339 0.372 1.363 0.887 720 0.396( ▼ − 1 , 26% ) 0.392( ▲ + 1 , 02% ) 0.391 0.396 0.401 0.398 0.408 0.403 1.730 1.042 0.549 0.522 0.410 0.400 0.558 0.525 0.421 0.415 0.417 0.413 0.433 0.432 3.379 1.338 15 Figure2 illustrates an in depth qualitative comparison on one of the rep- resen tative c hannels of the Electricity dataset. IPatc h is close to the ground- truth sequence in the whole prediction windo w (96), and it is accurate in repro ducing sharp oscillations, deep troughs and complex oscillations. By con trast, TimeMixer, Crossformer, DLinear, and Patc hTST are systemati- cally deviant, and they sho w phase shifts, damp ed resp onses, or smo othed w av eforms which are unable to reflect the ric h temp oral dynamics. This fur- ther highlights the greater strength and faithfulness of IP atc h on non-trivial time series that are greatly v olatile in the real world. A dditional illustrations on other datasets are pro vided in the app endix. Figure 2: Visual comparison of 96-step forecasts on the Electricit y dataset. IPatc h (red) trac ks the ground truth (black) with mark edly higher fidelity than Patc hTST, TimeMixer, Crossformer, and DLinear. 5.2. Efficiency of IPatch Figure 3 reports the efficiency of IPatc h on the ILI dataset, comparing training time (log scale) and forecasting accuracy (MSE) across a represen- tativ e set of state-of-the-art baselines. Although light w eight linear mo dels ac hieve fast training time, their sp eed comes at the cost of significan tly de- graded predictiv e effectiveness (see T able 3). In particular, the DLinear base- lines remain far from comp etitiv e on all the studied datasets. 16 IP atch, b y con trast, ac hieves a more desirable balance: it delivers the lo west MSE among all comp etitors while maintaining low-latency training times. Compared with state-of-the-art T ransformer-based approaches such as FEDformer, Autoformer, and Crossformer whic h often require one to tw o orders of magnitude more computation. IPatc h offers a substantially more fa vorable effectiveness–efficiency trade-off. This adv antage stems from its m ulti-resolution tokenization scheme, which integrates p oint-wise and patch- wise representations within a unified T ransformer arc hitecture. Poin t-wise tok ens preserv e the fine-grained temporal fluctuations essen tial for accurate short-term mo deling, while patch-wise tok ens enco de broader temp oral struc- tures efficien tly . Their joint use enables IPatc h to capture b oth lo cal and long-range dep endencies without incurring the computational burden of full- resolution atten tion (w.r.t P atc hTST). While Figure 3 fo cuses on the ILI dataset, the same trend is consisten tly observ ed across all other b enchmark datasets: IPatc h sustains high predictive accuracy with significan tly lo wer computational ov erhead than recent T rans- former architectures, while also outp erforming fast-but-w eak linear baselines in predictiv e effectiveness. Figure 3: Predictiv e effectiveness vs efficiency on ILI dataset (forecast horizon 60). IP atch (red circle) offers the b est p erformance-efficiency tradeoff among all ev aluated architectures 17 5.3. A blation Study T o ev aluate the con tributions of the patc hing and p oin t-wise auto correla- tion comp onents in the IP atch arc hitecture, comprehensiv e ablation studies ha ve b een conducted, isolating the patching mechanism and auto correlation information, as well as comparing the prop osed F ourier-based activ ation func- tion against the state-of-the-art softmax-based v arian t. These exp erimen ts pro vide insigh ts into the roles of each comp onen t and the effectiveness of our design c hoices across the diverse datasets and prediction horizons. 5.3.1. IPatch c omp onent c omplementarity T able 4 compares three v ariants of IPatc h: (1) the full IPatc h mo del (in tegrating b oth patching and auto correlation mechanisms), (2) P atch only 3 , and (3) auto correlation only . The results demonstrate that the full IPatc h mo del consisten tly outp erforms b oth ablated comp onents across all datasets and horizons, as measured by Mean Squared Error and Mean Absolute Error. On the ILI dataset, IP atch achiev es the low est errors across all horizons (e.g., MSE 1.445 and MAE 0.789 at horizon 60), significan tly surpassing P atch only (MSE 1.839, MAE 0.952) and Auto correlation only (MSE 1.711, MAE 0.870). Similar trends are observ ed in W eather and ETTh1, where the full mo del yields impro vemen ts of up to 38% in MSE for ETTh1 at horizon 720 (0.456 vs. 0.633 (38%) for Patc h only and 0.545(19%) for Auto correlation only). The Auto correlation only v arian t generally outp erforms the P atch only one, particularly at longer horizons. F or example, on ETTh1 at horizon 336, Auto correlation only ac hiev es an MSE of 0.515 compared to 0.539 for Patc h only , suggesting that auto correlation information is more effective at cap- turing long-term dep endencies. Ho w ever, b oth v arian ts fall short of the full mo del, indicating that the patching mechanism enhances the mo del’s ability to pro cess lo cal temp oral patterns, whic h, when com bined with auto correla- tion information, maximizes forecasting accuracy . The consisten t sup eriorit y of the full IP atch mo del underscores the com- plemen tary nature of patching and auto correlation mechanism. F or instance, on the W eather dataset at horizon 720, IP atc h ac hieves an MSE of 0.350, compared to 0.364 for Patc h only and 0.373 for auto correlation only , high- 3 T o ensure greater flexibility , and seamless in tegration with the ov erall architecture, w e implemen ted the patch enco der from scratch. 18 ligh ting how the in tegration of both comp onents captures both lo cal and global temp oral dynamics effectively . T able 4: Ablation study of patching and p oin t-wise auto correlation integration. Blue b old results are the b est outcomes, underlined are second b est. Datasets Horizon IP atch (Ours) Patc h only Auto correlation only MSE MAE MSE MAE MSE MAE ILI 24 1.604 0.751 1.977 0.873 1.790 0.805 36 1.689 0.799 1.886 0.882 1.875 0.848 48 1.562 0.783 1.662 0.809 1.636 0.800 60 1.445 0.789 1.839 0.952 1.711 0.870 Electricity 96 0.153 0.239 0.162 0.246 0.154 0.241 192 0.163 0.248 0.164 0.250 0.165 0.250 336 0.182 0.268 0.186 0.271 0.184 0.272 720 0.215 0.296 0.217 0.298 0.218 0.299 W eather 96 0.164 0.202 0.181 0.207 0.181 0.207 192 0.210 0.245 0.228 0.249 0.231 0.249 336 0.266 0.286 0.287 0.293 0.282 0.289 720 0.350 0.341 0.364 0.344 0.373 0.346 ETTh1 96 0.376 0.391 0.438 0.407 0.410 0.395 192 0.418 0.419 0.537 0.458 0.489 0.438 336 0.452 0.439 0.539 0.460 0.515 0.452 720 0.456 0.466 0.633 0.522 0.545 0.488 ETTh2 96 0.284 0.333 0.293 0.338 0.286 0.333 192 0.355 0.382 0.367 0.390 0.360 0.383 336 0.406 0.418 0.420 0.427 0.413 0.420 720 0.410 0.431 0.427 0.442 0.415 0.435 ETTm1 96 0.304 0.341 0.318 0.346 0.309 0.343 192 0.352 0.369 0.365 0.375 0.364 0.371 336 0.380 0.392 0.387 0.392 0.392 0.392 720 0.436 0.424 0.459 0.427 0.459 0.429 ETTm2 96 0.170 0.250 0.175 0.258 0.181 0.259 192 0.237 0.296 0.253 0.311 0.246 0.300 336 0.297 0.366 0.301 0.337 0.306 0.337 720 0.396 0.392 0.402 0.397 0.407 0.394 5.3.2. A ctivation function T able 5 demonstrates the impact of the F ourier-based learnable activ ation function against the classical softmax-based v arian t. 19 T able 5: Ablation study of the final activ ation function. Blue bold results are the best outcomes. Datasets Horizon IP atch (F ourrier) IP atch (softmax) MSE MAE MSE MAE ILI 24 1.604 0.751 1.739 0.806 36 1.689 0.799 1.644 0.798 48 1.562 0.783 1.635 0.806 60 1.445 0.789 1.569 0.788 Electricit y 96 0.153 0.239 0.153 0.245 192 0.163 0.248 0.164 0.251 336 0.182 0.268 0.184 0.270 720 0.215 0.296 0.218 0.298 W eather 96 0.164 0.202 0.164 0.202 192 0.210 0.245 0.209 0.245 336 0.266 0.286 0.264 0.286 720 0.350 0.341 0.341 0.336 ETTh1 96 0.376 0.391 0.379 0.391 192 0.418 0.419 0.438 0.428 336 0.452 0.439 0.477 0.443 720 0.456 0.466 0.554 0.502 ETTh2 96 0.284 0.333 0.285 0.333 192 0.355 0.382 0.368 0.384 336 0.406 0.418 0.412 0.421 720 0.410 0.431 0.413 0.432 ETTm1 96 0.304 0.341 0.308 0.242 192 0.352 0.369 0.371 0.374 336 0.380 0.392 0.392 0.393 720 0.436 0.424 0.450 0.428 ETTm2 96 0.172 0.254 0.174 0.254 192 0.237 0.296 0.238 0.299 336 0.297 0.366 0.293 0.333 720 0.396 0.392 0.389 0.289 In long-horizon settings, such as ETTh1 at horizon 720, the F ourier-based IP atch ac hieves an MSE of 0.456 and MAE of 0.466, compared to 0.554 and 0.502 for the softmax v arian t, represen ting a s ubstan tial impro vemen t of ap- pro ximately 21% in MSE. Similarly , on W eather at horizon 720, the F ourier v arian t yields an MSE of 0.350, sligh tly higher than the softmax v arian t’s 0.341, but main tains comp etitiv e MAE (0.341 vs. 0.336). These results 20 highligh t the F ourier activ ation’s ability to mo del n uanced frequency dep en- dencies in the sp ectral domain, which is critical for long-range forecasting. F or shorter horizons, such as ILI at horizon 24, the F ourier activ ation ac hieves an MSE of 1.604 and MAE of 0.751, outp erforming the softmax v arian t (MSE 1.739, MAE 0.806). In cases where p erformance is comparable (e.g., W eather at horizon 96, with iden tical MSE of 0.164 and MAE of 0.202), the F ourier activ ation sho ws no degradation, demonstrating its robustness across v arying forecasting lengths. Unlik e the softmax activ ation, whic h ma y compress information and lose fine-grained details, the F ourier-based activ ation excels at capturing frequency- based dep endencies, making it particularly suited for datasets with complex temp oral patterns (e.g., ETTh1, ETTh2). This is evident in ETTh1 at hori- zon 192, where the F ourier v ariant achiev es an MSE of 0.418 compared to 0.438 for softmax, indicating b etter mo deling of long-term trends. 6. Conclusion This pap er in tro duces IP atch, a nov el T ransformer-based framew ork for time series forecasting. IP atc h in tegrates tw o key comp onen ts: patching and a p oin t-wise auto correlation structure. This hybrid design enables the mo del to capture lo cal semantic information and lev erage long-range temp oral de- p endencies simultaneously , thus addressing one of the cen tral c hallenges in m ultiv ariate forecasting. Unlike previous approaches, whic h usually priori- tize either short-term lo cal dynamics or global structures, IP atch achiev es a balanced and complemen tary mo deling of b oth. Extensiv e exp eriments were conducted on datasets with v arying temp oral prop erties, ranging from complex seasonalit y to linear trends, demonstrating the mo del’s robustness and versatilit y . IPatc h achiev es consisten t perfor- mance gains, with relativ e improv ements of up to 24% in MSE and 12% in MAE compared to the strongest baseline, TimeMixer, in div erse datasets and forecasting horizons. The ablation studies pro vide further insights into the ef- fectiv eness of the design. They reveal that the combined interaction b etw een patc hing and p oin t-wise auto correlation is cen tral: while the auto correlation- only v ariant outp erforms the patch-only v arian t, underscoring the imp or- tance of global temp oral dep endencies, the full integration of b oth comp o- nen ts consistently yields the b est results, particularly on complex datasets suc h as ETTh1 and ETTh2. Moreo ver, the use of the F ourier-based activ a- tion function enhances the mo del’s ability to capture frequency-dep enden t 21 structures, leading to substantial improv emen ts ov er softmax-based formu- lations, especially for long-horizon forecasting (e.g., up to 21% reduction in MSE on ETTh1 at horizon 720). One promising direction for further researc h is the developmen t of adap- tiv e patc hing strategies, where patch lengths and p ositions are dynamically learned from the data. Such strategies could further enhance the mo del’s abilit y to capture b oth lo cal and global dep endencies. Another p oten tial direction is to explore explainabilit y metho ds that leverage the synergy be- t ween patc h-based and p oin t-wise auto correlation comp onen ts, enabling the extraction of in terpretable insigh ts from forecasts and pro viding actionable guidance to domain exp erts b eyond raw forecasts. References [1] L. Su, X. Zuo, R. Li, X. W ang, H. Zhao, B. Huang, A systematic review for transformer-based long-term series forecasting, Artificial Intelligence Review 58 (3) (2025) 80. doi:10.1007/s10462- 024- 11044- 2 . [2] H. Zhou, J. Li, S. Zhang, S. Zhang, M. Y an, H. Xiong, Expanding the prediction capacit y in long sequence time-series forecasting, Artificial In telligence 318 (2023) 103886. doi:10.1016/j.artint.2023.103886 . [3] Y. Nie, N. H. Nguy en, P . Sin thong, J. Kalagnanam, A time series is w orth 64 w ords: Long-term forecasting with transformers, in: In terna- tional Conference on Learning Represen tations, 2023. doi:10.48550/ arXiv.2211.14730 . [4] J. G. De Go oijer, R. J. Hyndman, 25 y ears of time series forecasting, In ternational Journal of F orecasting 22 (3) (2006) 443–473, t wen t y fiv e y ears of forecasting. doi:10.1016/j.ijforecast.2006.01.001 . [5] A. Zeng, M. Chen, L. Zhang, Q. Xu, Are transformers effective for time series forecasting?, AAAI’23/IAAI’23/EAAI’23, AAAI Press, 2023. doi:10.1609/aaai.v37i9.26317 . [6] M. Jin, S. W ang, L. Ma, Z. Chu, J. Y. Zhang, X. Shi, P .-Y. Chen, Y. Liang, Y.-F. Li, S. Pan, Q. W en, Time-llm: Time series forecasting b y reprogramming large language mo dels (2024). doi:10.48550/arXiv. 2310.01728 . 22 [7] J. Zhang, L. Guo, L. Song, S. Gao, C. Hao, X. Li, Patc htcn: P atch- based transformer conv olutional netw ork for times series analysis, in: Pro ceedings of the 2024 3rd In ternational Symp osium on Computing and Artificial Intelligence, ISCAI ’24, Asso ciation for Computing Machinery , New Y ork, NY, USA, 2025, p. 1–9. doi:10.1145/3711507.3711508 . [8] X. Piao, Z. Chen, T. Mura yama, Y. Matsubara, Y. Sakurai, F redformer: F requency debiased transformer for time series forecasting, in: Pro ceed- ings of the 30th ACM SIGKDD Conference on Kno wledge Disco v ery and Data Mining, KDD ’24, Asso ciation for Computing Mac hinery , New Y ork, NY, USA, 2024, p. 2400–2410. doi:10.1145/3637528.3671928 . [9] B. Lim, S. Zohren, Time-series forecasting with deep learning: a sur- v ey , Philosophical T ransactions of the Roy al So ciety A: Mathemati- cal, Physical and Engineering Sciences 379 (2194) (2021) 20200209. doi:10.1098/rsta.2020.0209 . [10] M. A. Din, ARIMA by Bo x Jenkins Metho dology for Estimation and F orecasting Mo dels in Higher EducationPublisher: Unpublished (2015). doi:10.13140/RG.2.1.1259.6888 . [11] R. J. Hyndman, A. B. Koehler, R. D. Sn yder, S. Grose, A state space framework for automatic forecasting using exp onen tial smo othing metho ds, International Journal of F orecasting 18 (3) (2002) 439–454. doi:10.1016/S0169- 2070(01)00110- 8 . [12] S. Makridakis, E. Spiliotis, V. Assimak op oulos, The m4 comp etition: 100,000 time series and 61 forecasting metho ds, In ternational Journal of F orecasting 36 (1) (2020) 54–74, m4 Comp etition. doi:10.1016/j. ijforecast.2019.04.014 . [13] J. L. Elman, Finding Structure in Time, Cognitive Science 14 (2) (1990) 179–211, publisher: Wiley . doi:10.1207/s15516709cog1402_1 . [14] R. Y unita, D. Sari, N. Ahmad, P erformance analysis of neural net work arc hitectures for time series forecasting: A comparativ e study of rnn, lstm, gru, and hybrid mo dels, PLOS ONE 20 (4) (2025) e12329085. doi:10.1371/journal.pone.12329085 . 23 [15] I. E. Livieris, E. Pintelas, P . Pin telas, A cnn–lstm mo del for gold price time-series forecasting, Neural Comput. Appl. 32 (23) (2020) 17351–17360. doi:10.1007/s00521- 020- 04867- x . [16] X. Shi, Z. Chen, H. W ang, D.-Y. Y eung, W.-k. W ong, W.-c. W o o, Con- v olutional lstm net work: a machine learning approach for precipita- tion no wcasting, in: Pro ceedings of the 29th In ternational Conference on Neural Information Pro cessing Systems - V olume 1, NIPS’15, MIT Press, Cam bridge, MA, USA, 2015, p. 802–810. doi:10.48550/arXiv. 1506.04214 . [17] R. Pascan u, T. Mik olo v, Y. Bengio, On the difficult y of training recur- ren t neural netw orks, in: S. Dasgupta, D. McAllester (Eds.), Pro ceed- ings of the 30th International Conference on Machine Learning, V ol. 28 of Pro ceedings of Mac hine Learning Research, PMLR, Atlan ta, Georgia, USA, 2013, pp. 1310–1318. doi:10.48550/arXiv.1211.5063 . [18] D. Bahdanau, K. Cho, Y. Bengio, Neural mac hine translation b y jointly learning to align and translate, CoRR abs/1409.0473 (2014). doi:10. 48550/arXiv.1409.0473 . [19] A. V aswani, N. Shazeer, N. P armar, J. Uszk oreit, L. Jones, A. N. Gomez, L. Kaiser, I. Polosukhin, A tten tion is all you need, in: Pro ceedings of the 31st International Conference on Neural Information Pro cessing Systems, NIPS’17, Curran Asso ciates Inc., Red Ho ok, NY, USA, 2017, p. 6000–6010. doi:10.48550/arXiv.1706.03762 . [20] H. W u, J. Xu, J. W ang, M. Long, Autoformer: Decomp osition trans- formers with Auto-Correlation for long-term series forecasting, in: A d- v ances in Neural Information Pro cessing Systems, 2021. doi:10.48550/ arXiv.2106.13008 . [21] T. Zhou, Z. Ma, Q. W en, X. W ang, L. Sun, R. Jin, FEDformer: F re- quency enhanced decomp osed transformer for long-term series fore- casting, in: Pro c. 39th International Conference on Mac hine Learning (ICML 2022), 2022. doi:10.48550/arXiv.2201.12740 . [22] A. Doso vitskiy , L. Bey er, A. Kolesnik ov, D. W eissenborn, X. Zhai, T. Un terthiner, M. Dehghani, M. Minderer, G. Heigold, S. Gelly , 24 J. Uszk oreit, N. Houlsby , An image is w orth 16x16 words: T ransform- ers for image recognition at scale, ICLR (2021). doi:10.48550/arXiv. 2010.11929 . [23] H. W u, T. Hu, Y. Liu, H. Zhou, J. W ang, M. Long, Timesnet: T emp oral 2d-v ariation mo deling for general time series analysis, in: International Conference on Learning Represen tations, 2023. doi:10.48550/arXiv. 2210.02186 . [24] Y. Zhang, J. Y an, Crossformer: T ransformer utilizing cross-dimension dep endency for multiv ariate time series forecasting, in: The Eleven th In ternational Conference on Learning Representations, 2023. [25] Z. Liu, Y. Lin, Y. Cao, H. Hu, Y. W ei, Z. Zhang, S. Lin, B. Guo, Swin transformer: Hierarc hical vision transformer using shifted windo ws, in: 2021 IEEE/CVF International Conference on Computer Vision (ICCV), 2021, pp. 9992–10002. doi:10.1109/ICCV48922.2021.00986 . [26] D. Jurafsky , J. H. Martin, Speech and Language Pro cessing: An In- tro duction to Natural Language Pro cessing, Computational Linguistics, and Sp eec h Recognition, 1st Edition, Prentice Hall PTR, USA, 2000. doi:10.5555/555733. [27] H. J. Nussbaumer, The F ast F ourier T ransform, Springer Berlin Heidelb erg, Berlin, Heidelb erg, 1981, pp. 80–111. doi:10.1007/ 978- 3- 662- 00551- 4_4 . [28] J. F ein-Ashley , N. Gupta, R. Kannan, V. Prasanna, Sp ectre: An fft- based efficien t drop-in replacemen t to self-atten tion for long con texts (2025). . [29] A. A. Imran, M. F. Ishmam, F ourierKAN outperforms MLP on text classification head fine-tuning, in: NeurIPS 2024 W orkshop on Fine- T uning in Modern Machine Learning: Principles and Scalabilit y , 2024. doi:10.48550/arXiv.2408.08803 . [30] Z. Liu, Y. W ang, S. V aidy a, F. Ruehle, J. Halverson, M. Soljacic, T. Y. Hou, M. T egmark, KAN: Kolmogoro v–arnold net works, in: The Thirteen th International Conference on Learning Representations, 2025. doi:10.48550/arXiv.2404.19756 . 25 [31] X. Qiu, J. Hu, L. Zhou, X. W u, J. Du, B. Zhang, C. Guo, A. Zhou, C. S. Jensen, Z. Sheng, B. Y ang, Tfb: T o wards comprehensiv e and fair b enc hmarking of time series forecasting metho ds, Pro c. VLDB Endo w. 17 (9) (2024) 2363–2377. doi:10.14778/3665844.3665863 . [32] F. Li, S. Guo, F. Han, J. Zhao, F. Shen, Multi-scale dilated conv olu- tion net work for long-term time series forecasting, CoRR abs/2405.05499 (2024). doi:10.48550/arXiv.2405.05499 . [33] S. W ang, H. W u, X. Shi, T. Hu, H. Luo, L. Ma, J. Y. Zhang, J. Zhou, Timemixer: Decomp osable multiscale mixing for time series forecasting (2024). doi:10.48550/arXiv.2405.14616 . [34] T. Zhou, Z. Ma, X. W ang, Q. W en, L. Sun, T. Y ao, W. Yin, R. Jin, Film: frequency improv ed legendre memory mo del for long-term time series forecasting, in: Proceedings of the 36th International Conference on Neural Information Pro cessing Systems, NIPS ’22, Curran Asso ciates Inc., Red Ho ok, NY, USA, 2022. doi:10.48550/arXiv.2205.08897 . [35] Y. Liu, H. W u, J. W ang, M. Long, Non-stationary transformers: Explor- ing the stationarity in time series forecasting, in: A. H. Oh, A. Agarw al, D. Belgrav e, K. Cho (Eds.), A dv ances in Neural Information Pro cessing Systems, 2022. doi:0.48550/arXiv.2205.14415 . [36] S. T ong, J. Y uan, P areformer: p ositional adaptive and recurren t en- hanced transformer for time series forecasting, Information F usion 128 (2026) 103967. doi:10.1016/j.inffus.2025.103967 . 26 App endix A. Plots T o further demonstrate the robustness of IP atch, Figure A.4 presen ts qualitativ e forecasting results on representativ e c hannels from the Electricity , ETTm2, and ILI datasets, which exhibit mark edly different characteristics (strong p erio dicit y , quasi-p erio dic trends, and spiky non-stationary b eha v- ior, resp ectively). Across all cases, IPatc h closely tracks the ground truth with significantly higher fidelit y than TimeMixer, Crossformer, DLinear, and P atchTST, esp ecially in capturing sharp p eaks, sudden drops, and long-range trends. These visualizations confirm that IP atch delivers consistently sup e- rior temporal mo deling and generalization capabilit y across div erse time- series regimes. (a) Electricit y (feature 35) (b) Electricit y (feature 13) (c) ETTm2 dataset (d) ILI dataset Figure A.4: Qualitativ e comparison of forecasting mo dels (IP atc h, TimeMixer, Cross- former, DLinear, and P atchTST) on different datasets. IPatc h shows consisten tly stronger temp oral mo deling across diverse time series characteristics. 27
Original Paper
Loading high-quality paper...
Comments & Academic Discussion
Loading comments...
Leave a Comment