Aitchison Geometry on the Simplex for Uncertainty Quantification in Bayesian Hyperspectral Image Unmixing
Most algorithms for hyperspectral image unmixing produce point estimates of fractional abundances of the materials to be separated. However, in the absence of reliable ground truth, the ability to perform abundance uncertainty quantification (UQ) sho…
Authors: Hector Blondel, Lucas Drumetz, Thierry Chonavel
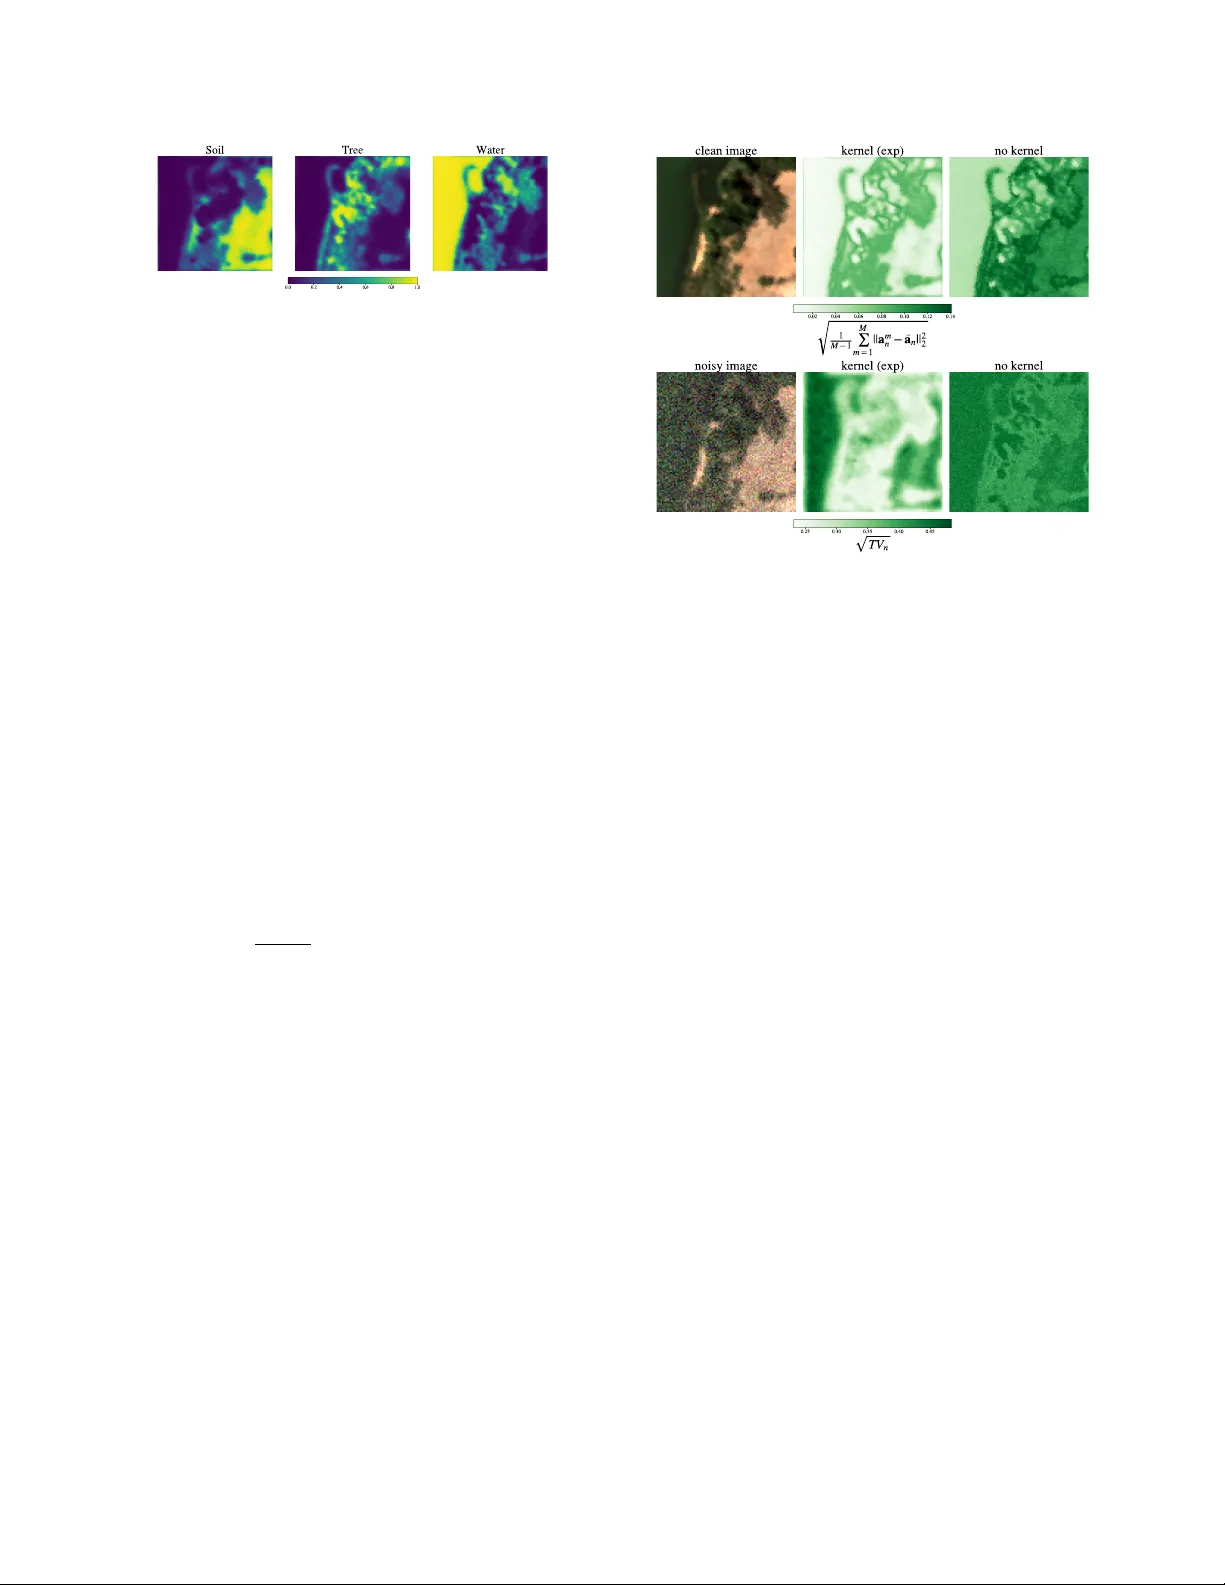
AITCHISON GEOMETR Y ON THE SIMPLEX FOR UNCER T AINTY QU ANTIFICA TION IN B A YESIAN HYPERSPECTRAL IMA GE UNMIXING Hector Blondel 1 , Lucas Drumetz 1,2 , Thierry Chonavel 1 1 IMT Atlantique, Lab-STICC, UMR CNRS 6285, Plouzan ´ e, France 2 INRIA OD YSSEY team-project, Brest, France ABSTRA CT Most algorithms for hyperspectral image unmixing produce point estimates of fractional abundances of the materials to be separated. Howe ver , in the absence of reliable ground truth, the ability to perform abundance uncertainty quantifica- tion (UQ) should be an important feature of algorithms, e.g. to ev aluate ho w hard the unmixing problem is and how much the results should be trusted. The usual modeling assumptions in Bayesian unmixing rely heavily on the Euclidean geometry of the simplex and typically disregard spatial information. In addition, to our knowledge, ab undance UQ is close to nonex- istent in the literature. In this paper , we propose to leverage Aitchison geometry used in compositional data analysis to provide practitioners with alternati ve tools for modeling prior abundance distrib utions. In particular, we show ho w to design simplex-v alued Gaussian Process priors using this geometry . Then we link Aitchison geometry to constrained optimization and sampling algorithms, and propose UQ diagnostics that comply with the constraints on abundance vectors. W e illus- trate these concepts on real and simulated data. Index T erms — Hyperspectral unmixing, Bayesian esti- mation, uncertainty quantification, compositional geometry 1. INTR ODUCTION Hyperspectral image unmixing is a classical source separa- tion problem in remote sensing [1], wherein the spectral sig- natures of the materials present in the image (endmembers) and their relative proportions in each pixel (ab undances) ha ve to be estimated, with numerous applications in e.g. environ- mental monitoring [2], urban planning [3], planetology and astrophysics [4]. In spite of a plethora of algorithms taking into account dif ficulties such as the nonlinearity of the mix- ing phenomena [5] or the intra class variability of the end- members [6], the domain is plagued by the difficulty of rig- orously validating algorithms on real data, due to the lack of reliable ground truth [7]. Simply assessing the dif ficulty of a specific instance of the problem performing uncertainty quantification (UQ) in the estimated quantities depends on This work was supported by France 2030 and ClusterAI SequoIA through AI Chair GENESIS. many factors, ranging from the spatial and spectral resolu- tions, the granularity of the “pure” materials to separate, or the observation conditions. Even though a recent trend is to use data-dri ven probabilistic models to capture the v ariabil- ity of the endmembers (see e.g. [8, 9]), to our kno wledge, the associated uncertainty on the ab undances has not been ex- plored or quantified e xtensively . The reasons for this may be that 1) Abundances are subject to constraints, making it harder to interpret uncertainty . Indeed, typically abundances belong to the unit simplex (though this can be relaxed in se v- eral ways) 2) The abundances are a 2D field, i.e. it is desir- able and sometimes necessary (for noisy or incomplete data) to account for spatial information, which is not straightfor- ward 3) Handling the posterior distrib ution is typically in- tractable and requires sophisticated sampling algorithms, in particular in the presence of constraints [10, 11]. Thus, in this paper , we focus on modeling and representing the spatial and material-wise uncertainty of the abundances p ( A ) , where A ∈ R P × N with P the number of materials and N the num- ber of pix els. Each column a n of A belongs to the probability ( P − 1) -simple x ∆ P − 1 = { a ∈ [0 , 1] P | P P k =1 a k = 1 } . W e work in an idealized Bayesian linear mixing model frame- work where we assume an endmember is represented by a single known signature: i.e. the likelihood of the observa- tions X ∈ R L × N with L the number of spectral bands is giv en by p ( X | A ) = N ( SA , σ 2 I L ) with S ∈ R L × P is the endmember matrix (containing the endmember signatures in its columns). W ith this setup, we aim to sample and represent the uncertainty of the posterior distribution: p ( A | X ) ∝ p ( X | A ) p ( A ) (1) Dirichlet distributions are classically used as a natural model for the prior distribution of abundance vectors [12]. In com- positional data analysis [13], ho wev er , another geometry , so-called Aitchison geometry , is used because of favorable properties and natural handling of the constraints. T o our knowlede ge, this geometry has not been considered in hy- perspectral image unmixing: hence this paper in vestigates the potential benefits of such a geometry with a focus on a Bayesian vie w of the problem. W e first revie w the basics of Aitchison geometry in a unmixing context. Then we show how it 1) allo ws to le verage bijections between R P − 1 and the interior of the simplex to define a new geometry that 2) can be used to extend Gaussian Processes (GP) to simplex-v alued random fields by pushing forward Euclidean GP so that they respect the constraints. The resulting GP make for spatial- ized geometric priors allo wing closed-form interpolation of abundance maps and provide sensible priors for spatialized Bayesian unmixing. 3) may be le veraged in optimization or sampling algorithms. 4) provide principled tools to define constraint-aware ways to represent and visualize abundance uncertainty at the pixel and image le vels. 2. AITCHISON GEOMETR Y In this section, we recall how diffeomorphic transformations ψ : int ∆ P − 1 → R P − 1 from compositional data analysis turn the interior of the simplex into a flat Riemannian manifold with a pullback Euclidean metric. This allo ws to design prior distributions on the simplex that are pushforwards of Gaus- sian distributions on R P − 1 . A straightforward choice for such a ψ is the alr transforma- tion [13] alr ( a ) := [log a k − log a P ] 1 ≤ k ≤ P − 1 , which remov es one coordinate of a to get rid of the sum-to-one constraint, and then takes the logarithm to alle viate the positivity con- straint. Ho wev er, the choice of the coordinate to remo ve is arbitrary , introducing symmetry-breaking artifacts in the rep- resentation. A way to symmetrize the previous transformation is the Centered Log Ratio (clr) [13]: w = ψ ( a ) ≜ clr ( a ) := h log a p − 1 P P P k =1 log a k i p =1 ,...,P (2) clr : int ∆ P − 1 → R P − 1 is not a bijection, but the restriction onto its image, the h yperplane H with normal v ector 1 ∈ R P , is a diffeomorphism. For numerical computations, choosing an orthonormal basis H ∈ R P × P − 1 of H allows to work in R P − 1 , and the resulting transformation is called the Isometric Log Ratio (ilr) z = ilr ( a ) ≜ H T w . The in verse transforma- tion is the softmax function: ilr − 1 ( z ) = softmax ( Hz ) = " exp w p P P k =1 exp( w k ) # p =1 ,...,P . (3) W ith a slight abuse of notation, we still refer to ilr ( a ) as ψ ( a ) . W e note that ψ (as any diffeomorphism int ∆ P − 1 → R P − 1 ) turns int ∆ P − 1 into a flat Riemannian manifold with at metric that is the pullback ψ ∗ g of the Euclidean metric g on R P − 1 . In other words, ( int ∆ P − 1 , ψ ∗ g ) is isometric to ( R P − 1 , g ) by construction. The associated geodesic distance is giv en by the Euclidean distance in ilr space: d ψ ( a , a ′ ) = || ilr ( a ) − ilr ( a ′ ) || 2 (4) In particular , geodesics are obtained in the simplex by ap- plying ilr − 1 to straight lines in R P − 1 . This is a crucial differ- ence from the usual Euclidean metric on ∆ P − 1 that is induced Fig. 1 : ilr-gaussian pdf on the 3-simplex : ilr ( a ) ∼ N ( 0 , σ 2 a I 2 ) , σ 2 a = 0 . 25 and geodesics between two points under the Euclidean (purple) and Aitchison metrics (red). from the Euclidean metric on R P . For the Euclidean metric, the geodesics are straight lines in the simplex. T o illustrate the fundamental dif ferences between both metrics, see Fig. 1, where we plot both geodesics to joint two points of the sim- plex (P and Q) that correspond to the same abundances, up to a permutation of two of their components, and the other fixed. The Euclidean geodesic (in purple) is a straight line, and all abundances on the way will retain the same fraction of ma- terial (1 , 0 , 0) , mixing linearly the two remaining materials. By constrast, the Aitchison geodesic (in red) first removes the excess of material (0 , 1 , 0) (getting closer to the v ertex corre- sponding to pure material (1 , 0 , 0) ), before gradually adding the missing contribution of material (0 , 0 , 1) . In fact, the in- terpolation is linear in ilr space. W e can define an uninformative prior for abundance vectors using ilr . A minimal requirement for such prior densities p ( a ) is to be in variant by permutation of the coordinates whene ver the distribution on z = ilr ( a ) is zero mean and rotation in v ari- ant. W e will call this property “isotropy” hereafter . The most natural is to consider isotropic Gaussian latent distributions ψ ( a ) = z ∼ N ( 0 , σ 2 a I P − 1 ) (5) The resulting prior in the simplex can be easily shown to be isotropic using the change of variables formula for probability densities. Indeed, the pdf writes in the simplex : p ( a ) ∝ 1 Q P k =1 a k exp − 1 2 σ 2 a ∥ ψ ( a ) ∥ 2 2 , (6) and is unchanged when permuting the components of vector a . A visual representation of this density is gi ven in Figure 1, for σ 2 a = 0 . 25 . Note that the distribution becomes multimodal (but remains permutation inv ariant) for large enough v alues of σ 2 a . Shifting the mean of the Gaussian latent can bias the prior tow ards a v ertex or an edge, while arbitrary cov ariance matri- ces lead to more intricate behavior , providing a rich class of priors. While not ob vious from Eq. (6) due to the Jacobian term, the density goes to 0 when a tends to the boundary of the simplex: the prior forbids abundances with strictly zero components. In numerical computations, we can get suf fi- ciently close to the boundary so that this does not matter in practice. Finally , let us point out that Dirichlet priors (and in particular a uniform prior), which are intrinsically tied to the Euclidean geometry , do put nonzero mass to the boundary . A consequence is that the posterior distribution for a Gaus- sian likelihood will be a truncated Gaussian on the simplex, which requires renormalization and does not correspond to physically realistic abundance variations. By contrast, pos- terior distributions with an ilr-Gaussian prior will naturally approach the simplex boundary due to the log-barrier . 3. SIMPLEX-V ALUED GA USSIAN PROCESSES 3.1. Spatializing a pushforward Gaussian prior In this section, we use the ilr transformation to design a simplex-v alued spatialized prior on the abundance image us- ing latent GP , which we call pushforward GP . For a spatial process with values on the simplex a ( u ) , where u = ( x, y ) ∈ R 2 are the spatial coordinates of a pixel, we want u 7→ ψ ( a ( u )) to follow a vector -valued GP [14]. Giv en N points u 1 , . . . , u N , the vectorized version of latent space coefficients Z = ψ ( A ) ≜ [ ψ ( u 1 ) , . . . , ψ ( u N )] ∈ R ( P − 1) × N is a multi variate Gaussian with a ( P − 1) N × ( P − 1) N block cov ariance matrix K Z = K ( u 1 , u 1 ) . . . K ( u 1 , u N ) . . . . . . K ( u N , u 1 ) . . . K ( u N , u N ) . (7) Each K ( u i , u j ) ∈ R ( P − 1) × ( P − 1) is a positive definite ma- trix. T o be able to fix the global covariance structure of the GP in an intuitiv e and tractable way , we make the separabil- ity assumption , by e xpressing the ov erall kernel matrix as a Kronecker product K Z = K P ⊗ K U where K U ∈ R N × N is the Gram matrix coming from the discretization of a real- valued spatial kernel, and K P ∈ R ( P − 1) × ( P − 1) is a positiv e definite matrix encoding correlations between entries of the latent vector (see [14]). In the absence of further informa- tion, the latent space representation is made isotropic in e very pixel: K P = σ 2 a I P − 1 . The latent space coefficients ψ ( A ) then follow a centered matrix normal distrib ution: ψ ( A ) ∼ MN ( 0 ( P − 1) × N , σ 2 a I P − 1 , σ 2 k K U ) . (8) σ 2 k (fixed to 1 throughout our experiments) scales the spa- tial kernel in latent space. For K U , we use the exponen- tial kernel, with characteristic length-scale l : k ( u , u ′ ) = exp − 1 l ∥ u − u ′ ∥ 2 . This kernel (among other edge pre- serving choices that are out of scope of this paper) is better suited (and numerically more stable [15]) than the Gaussian kernel for spectral unmixing, where abundance maps present discontinuities. With the change of variable formula, the pdf of A is: p ( A ) = | det ∇ ψ ( A ) | p ψ ( a ) ( ψ ( A )) ∝ 1 Q N l =1 Q P k =1 a kl exp − 1 2 ψ ( A ) K U − 1 2 2 F (9) where ∥ . ∥ F is the Frobenius norm. 3.2. Interpolating partial and noisy ab undance maps As in the unconstrained case, the pushforward GP allows us to interpolate partially observed abundance maps (e.g. in the presence of clouds or from discrete in situ measurements as in the geostatistics literature [16]) in closed form. W ithout going into details, this simply amounts to fitting a Euclidean GP after moving the abundances to ilr space, before moving back to ab undance space using the softmax function. In other words, conjugacy properties of the Gaussian distribution in latent space carry ov er to simplex-v alued interpolation. 3.3. Sampling the unmixing posterior: Mirror Lange vin Our pushforward GP can also be used as a spatial prior for the abundance maps in Bayesian spectral unmixing, as in Eq. (1). As we will see, the problem is more challenging than inter- polating spatialized abundances, since now the observations do not live on the simplex, due to the mixture induced by the endmember matrix S . As a result, the posterior expres- sion will be intractable in general: the observation likelihood p ( X | S , A ) is (matrix) Gaussian distribution in the Euclidean space R L × N , but the prior is (matrix) Gaussian in the latent ilr space, breaking the conjugacy properties of classical GP regression: p ( A | X , S ) ∝ 1 Q N l =1 Q P k =1 a kl exp − 1 2 ψ ( A ) K U − 1 2 2 F exp − 1 2 σ 2 X − SA 2 F (10) W e must then resort to sampling algorithms (or variational inference) in order to manipulate the posterior , compute esti- mators and perform UQ. A well-kno wn sampling technique among Markov Chain Monte Carlo (MCMC) methods is the Unajusted Langevin Algorithm (ULA), which can be seen as the sampling counterpart to the MAP point estimate that gra- dient descent on the negati ve log posterior targets. Howe ver , as our search space (the simplex) is constrained, the latter method cannot be used as is. “Euclidean fixes” are projected gradient/Langevin algorithms that use the Euclidean projec- tion on the simplex [17]. Alternatively , when provided with a con ve x potential φ whose gradient is a bijection match- ing a constrained space that is a con vex subset of Euclidean space to a new latent Euclidean space, the mirror descent al- gorithm [18] allows to handle the constraint seamlessly in this new domain. Similarly to ULA, a sampling version of mirror - descent, so-called “Mirror Langevin” was first proposed in [11], and adapts the Mirror Descent algorithm to sample in a constrained space thanks to the mirror map ∇ φ . W e refer to [11] for details on the update rules. Mirror Langevin can then be seen as a kind of ULA in a different geometry induced by the mirror map. In the original mirror Langevin paper [11], alr is shown to be a valid mirror map and is proposed for sampling on the simplex. Instead, we recommend to use the previously defined ilr transforma- tion we used for defining our isotropic prior , as it is also the gradient ilr = ∇ h of the scalar con vex potential function (the entropy) h : a ∈ ∆ P − 1 7→ P P k =1 a k log a k . This choice is again motiv ated by the isotropy of the ilr function and also allows to use the same underlying geometry for sampling as the one used for the prior (contrary to, say , a projected ULA algorithm), which may be favorable for con v ergence. W e use this algorithm to obtain posterior samples hereafter . 4. REPRESENTING UNCER T AINTY : CONFIDENCE REGIONS AND TO T AL V ARIANCE In this section, we show ho w to perform UQ on the ab un- dances in practice for the unmixing problem, giv en samples from the posterior from the previous section. First, we deal with defining the posterior mean and uncertainty measures, and visualizing them (up to P = 4 , which covers many cases of practical interest, gi ven that that more than 4 materials sig- nificantly contribute to a pixel’ s signature is rare) at the lev el of a single pixel. Then we show how to visualize the posterior mean and different notions of v ariance at the image level. Af- ter sampling, in a classical Euclidean space, the usual point- wise estimator for the parameters is gi ven by the posterior Euclidean mean as it is the minimum mean square estimator of A given X . The pullback Euclidean geometry defined by ilr suggests defining the mean in the latent space [19], which corresponds to the geodesic mean (which is in fact the min- imum squared geodesic distance estimator). For M samples A 1 , . . . , A M of a simplex-valued image the geodesic mean in pixel n , ¯ a n , is the softmax of the Euclidean mean in ilr space: ¯ a n ≜ ψ − 1 1 M M X m =1 ψ ( a m n ) ! (11) 4.1. Pixelwise UQ: confidence regions in the simplex As the posterior distrib ution is no longer Gaussian (neither in latent nor simplex space), the marginal densities on indi vid- ual pixels a n are not known in closed form due to the spatial correlations introduced by the GP prior . Hence, samples are necessary to visualize the posterior . A naive way to define confidence regions would be to make a Gaussian approxi- mation of the posterior, using the classical cov ariance, and reporting confidence ellipsoids. Howe ver , in addition to poor approximations for complex posteriors, the regions may not Fig. 2 : Unmixing abundances [0 . 59 , 0 . 01 , 0 . 4] (red), SNR = 8 dB with a multimodal posterior , sampled 10000 times. Y el- low dot : geodesic mean ¯ a ; purple dot : Euclidean mean. be entirely in the simple x (e ven if all samples are), which makes the geometric interpretation meaningless. A geometry compliant strategy would be to define a Gaussian approxima- tion of the posterior in latent space, so that latent confidence ellipses may be transformed back using the softmax function. Still, the target distribution might be complex or even multi- modal in latent space, making the approximation poor , whilst capturing these effects is important in UQ. For visualizing uncertainty , we propose a method for esti- mating confidence regions on indi vidual pix els. A confidence region of threshold α for the the random variable a | X is a region I α ⊂ ∆ P − 1 such that P ( a ∈ I α | X ) ≥ 1 − α . Such regions are not unique in general, so we opt for the minimum volume region, which can be pro ven to be the set of all points for which the density is greater than a certain threshold [20], called highest density re gion (HDR). By con- struction, this set, for a suitable α rev eals the presence of different modes through several connected regions. For an y a , a conv ergent estimator of the HDR can be found as fol- lows: we estimate the density via the M samples a 1 , . . . , a M through a histogram in the simplex (or any density estima- tor). Then, we sort them by increasing order of their densities ( p ( a = a 1 ) ≤ · · · ≤ p ( a = a M ) ), and take the ⌊ αM ⌋ -s smallest, p ( a ⌊ αM ⌋ ) , where ⌊·⌋ is the floor function. W e illustrate the usefulness of this construction by simulat- ing data using three endmembers extracted from the Samson dataset (see Section 4.2 for a description): soil, ve getation and water and respectiv e GT abundances [0 . 59 , 0 . 01 , 0 . 4] . W e model the abundances from a multimodal isotropic ilr- Gaussian prior ( σ 2 a = 5 ) (this is not a realistic modeling choice but results in a multimodal posterior for illustrative purposes), and add Gaussian noise (SNR = 8dB) to the mix- ture. Fig. 2 sho ws the posterior distribution and correspond- ing samples. The posterior distribution tends to incorporate ve getation in the mixture due to noise and a badly specified prior , and presents two modes and a plateau of likely abun- dances under the posterior . First, we note that a large enough Fig. 3 : Geodesic abundance maps for a pushforward GP prior . Gaussian confidence ellipse would lea ve the simplex. The pullback of a latent confidence ellispe (while contained in the simplex) is not able to reach edges of the simplex, which hav e high density . W e see that the HDR region captures the multimodal nature of the distribution by construction. 4.2. UQ at the image level: geodesic mean and variance W e now propose ways to represent the uncertainty at the image le vel, using a single scalar value representing the to- tal variability in each pixel. T otal variance (the trace of the Euclidean covariance matrix for the marginal distribu- tion) is classically used as a scalar estimate of the variability around the mean in ev ery pixel. As noted above, the Eu- clidean covariance matrix is not directly interpretable due to the constraints. In particular , the diagonal elements measure variances along the coordinate axes, ignoring that the simplex is a conv ex subset of a hyperplane inside R P . In ilr geometry , the sample geodesic total variance in pixel n , TV n is the classical total v ariance in latent space (i.e. the trace of the empirical latent cov ariance matrix), and corresponds to the mean squared geodesic distance to ¯ a n : TV n ≜ 1 M − 1 M X m =1 || ψ ( a m n ) − ψ ( ¯ a n ) || 2 2 (12) Componentwise variances at the pixel lev el (diagonal el- ements of the Euclidean cov ariance matrix) are used as marginal measures of variability . These can become mislead- ing for abundance vectors, due to the sum-to-one constraint. Howe ver , these quantities make sense in ilr space, and reflect the dispersion in the log-ratio between pairwise abundances. W e illustrate these notions on the Samson dataset. It con- sists in 95 × 95 pixels containing the reflectance measured on L = 195 wav elengths spreading from 401 nm to 889 nm. A RGB composition is shown in Fig. 4. W e have artificially added 15 dB noise to highlight differences between kernel- based and pixelwise algorithms. W e use same 3 endmem- bers as in Section 4.1. W e compare a pushforward GP prior , with l = 10 pixels and σ 2 a = 0 . 25 and a non-spatialized prior (using a dirac kernel in space), drawing 1000 samples. The geodesic mean ab undance maps for the GP prior are shown in Fig. 3 (the Euclidean means are visually similar and are not shown). Geodesic and Euclidean total standard deviations are shown in Fig. 4 for both models. The first and main ob- Fig. 4 : Euclidean (top) and Aitchison (bottom) standard devi- ations maps for spatial and non spatial priors. servation is that Euclidean variance is low in close to pure areas and high in more mixed regions, while Aitchison vari- ance shows opposite behavior . The noise in the observations causes small absolute fluctuations in each component: this is reflected by a relati vely low total standard deviation. These small variations have a larger impact on the relati ve impor- tance between the materials (the ratios between components), which explains the larger Aitchison variance. This behavior is expected near the boundaries of the simplex, where Aitchi- son geometry is more sensitiv e due to the log barrier . On the other hand, in more mixed areas, larger absolute variations in the components reflect in Euclidean variance, b ut tend to change the ratios between materials less (the relative impor- tance of the materials changes less), leading to smaller Aitchi- son variance. Both notions of variance bring complementary information. W e also see the interest of ha ving a spatial prior: beyond just obtaining smoother abundance maps, uncertainty is also smoother (it should not be independent from one pix el to the next), and is comparatively smaller in the k ernel version of the models, eliminating the perturbations due to noise. 5. CONCLUSION In this paper, we ha ve presented how to endow the simplex with a non Euclidean geometry that complements usual tools for spectral unmixing implicity on Euclidean geometry . W e hav e sho wn in particular how this geometry allows to define simplex-v alued Gaussian Processes to design spatialized pri- ors in Bayesian models. W e have also shown the potential of this geometry to perform uncertainty quantification in unmix- ing, both at the pixel level and for the whole image. Future work will include exploring other UQ diagnostics and using Aitchison geometry to define probabilistic ev aluation metrics to validate Bayesian algorithms. 6. REFERENCES [1] Jos ´ e M Bioucas-Dias, Antonio Plaza, Nicolas Dobi- geon, Mario Parente, Qian Du, Paul Gader, and Joce- lyn Chanussot, “Hyperspectral unmixing ov erview: Ge- ometrical, statistical, and sparse regression-based ap- proaches, ” IEEE journal of selected topics in applied earth observations and r emote sensing , vol. 5, no. 2, pp. 354–379, 2012. [2] Richard J Ellis and Peter W Scott, “Evaluation of hy- perspectral remote sensing as a means of en vironmental monitoring in the st. austell china clay (kaolin) region, cornwall, uk, ” Remote sensing of en vir onment , vol. 93, no. 1-2, pp. 118–130, 2004. [3] Andrea Marinoni and P aolo Gamba, “ Accurate detec- tion of anthropogenic settlements in hyperspectral im- ages by higher order nonlinear unmixing, ” IEEE Jour - nal of Selected T opics in Applied Earth Observations and Remote Sensing , vol. 9, no. 5, pp. 1792–1801, 2015. [4] Xavier Ceamanos, Sylvain Dout ´ e, Bin Luo, Fr ´ ed ´ eric Schmidt, Gwena ¨ el Jouannic, and Jocelyn Chanussot, “Intercomparison and validation of techniques for spec- tral unmixing of h yperspectral images: A planetary case study , ” IEEE T ransactions on Geoscience and Remote Sensing , vol. 49, no. 11, pp. 4341–4358, 2011. [5] Rob Heylen, Mario Parente, and Paul Gader , “ A revie w of nonlinear hyperspectral unmixing methods, ” IEEE Journal of Selected T opics in Applied Earth Observa- tions and Remote Sensing , vol. 7, no. 6, pp. 1844–1868, 2014. [6] Ricardo Augusto Borsoi, T ales Imbiriba, Jos ´ e Car- los Moreira Bermudez, C ´ edric Richard, Jocelyn Chanussot, Lucas Drumetz, Jean-Yves T ourneret, Alina Zare, and Christian Jutten, “Spectral variability in hy- perspectral data unmixing: A comprehensive re view , ” IEEE geoscience and r emote sensing magazine , vol. 9, no. 4, pp. 223–270, 2021. [7] Rosa Maria Cav alli, “Spatial validation of spectral un- mixing results: A systematic revie w , ” Remote Sensing , vol. 15, no. 11, pp. 2822, 2023. [8] Y imin Zhu and Lincoln Linlin Xu, “Diffusion posterior sampler for hyperspectral unmixing with spectral v ari- ability modeling, ” arXiv pr eprint arXiv:2512.09871 , 2025. [9] Shuaikai Shi, Min Zhao, Lijun Zhang, Y oann Altmann, and Jie Chen, “Probabilistic generativ e model for hy- perspectral unmixing accounting for endmember vari- ability , ” IEEE T ransactions on Geoscience and Remote Sensing , vol. 60, pp. 1–15, 2021. [10] Nicolas Brosse, Alain Durmus, ´ Eric Moulines, and Marcelo Pereyra, “Sampling from a log-concav e dis- tribution with compact support with proximal lange vin monte carlo, ” in Confer ence on learning theory . PMLR, 2017, pp. 319–342. [11] Y a-Ping Hsieh, Ali Kavis, Paul Rolland, and V olkan Cevher , “Mirrored langevin dynamics, ” Advances in Neural Information Pr ocessing Systems , vol. 31, 2018. [12] Jos ´ e MP Nascimento and Jos ´ e M Bioucas-Dias, “Hyper - spectral unmixing based on mixtures of dirichlet compo- nents, ” IEEE T r ansactions on Geoscience and Remote Sensing , vol. 50, no. 3, pp. 863–878, 2011. [13] John Aitchison, “The statistical analysis of composi- tional data, ” J ournal of the Royal Statistical Society Series B: Statistical Methodology , vol. 44, no. 2, pp. 139–160, Jan. 1982. [14] Mauricio A Alvarez, Lorenzo Rosasco, Neil D Lawrence, et al., “Kernels for vector-v alued functions: A revie w , ” F oundations and T r ends® in Machine Learn- ing , vol. 4, no. 3, pp. 195–266, 2012. [15] Michael L Stein, Interpolation of spatial data: some theory for kriging , Springer Science & Business Media, 1999. [16] Lucia Clarotto, Denis Allard, and Alessandra Menafoglio, “ A new class of α -transformations for the spatial analysis of compositional data, ” Spatial Statistics , vol. 47, pp. 100570, 2022. [17] Laurent Condat, “Fast projection onto the simplex and the l 1 ball, ” Mathematical Pr ogramming , vol. 158, no. 1, pp. 575–585, 2016. [18] David Borisovich Y udin, Pr oblem complexity and method efficiency in optimization , W iley , 1983. [19] V . P awlo wsky-Glahn and J. J. Egozcue, “Geometric ap- proach to statistical analysis on the simplex, ” Stochastic En vir onmental Researc h and Risk Assessment , v ol. 15, no. 5, pp. 384–398, Oct. 2001. [20] Rob J. Hyndman, “Computing and Graphing Highest Density Regions, ” The American Statistician , vol. 50, no. 2, pp. 120–126, 1996, Publisher: [American Statis- tical Association, T aylor & Francis, Ltd.].
Original Paper
Loading high-quality paper...
Comments & Academic Discussion
Loading comments...
Leave a Comment