Minimal Sufficient Representations for Self-interpretable Deep Neural Networks
Deep neural networks (DNNs) achieve remarkable predictive performance but remain difficult to interpret, largely due to overparameterization that obscures the minimal structure required for interpretation. Here we introduce DeepIn, a self-interpretab…
Authors: Zhiyao Tan, Liu Li, Huazhen Lin
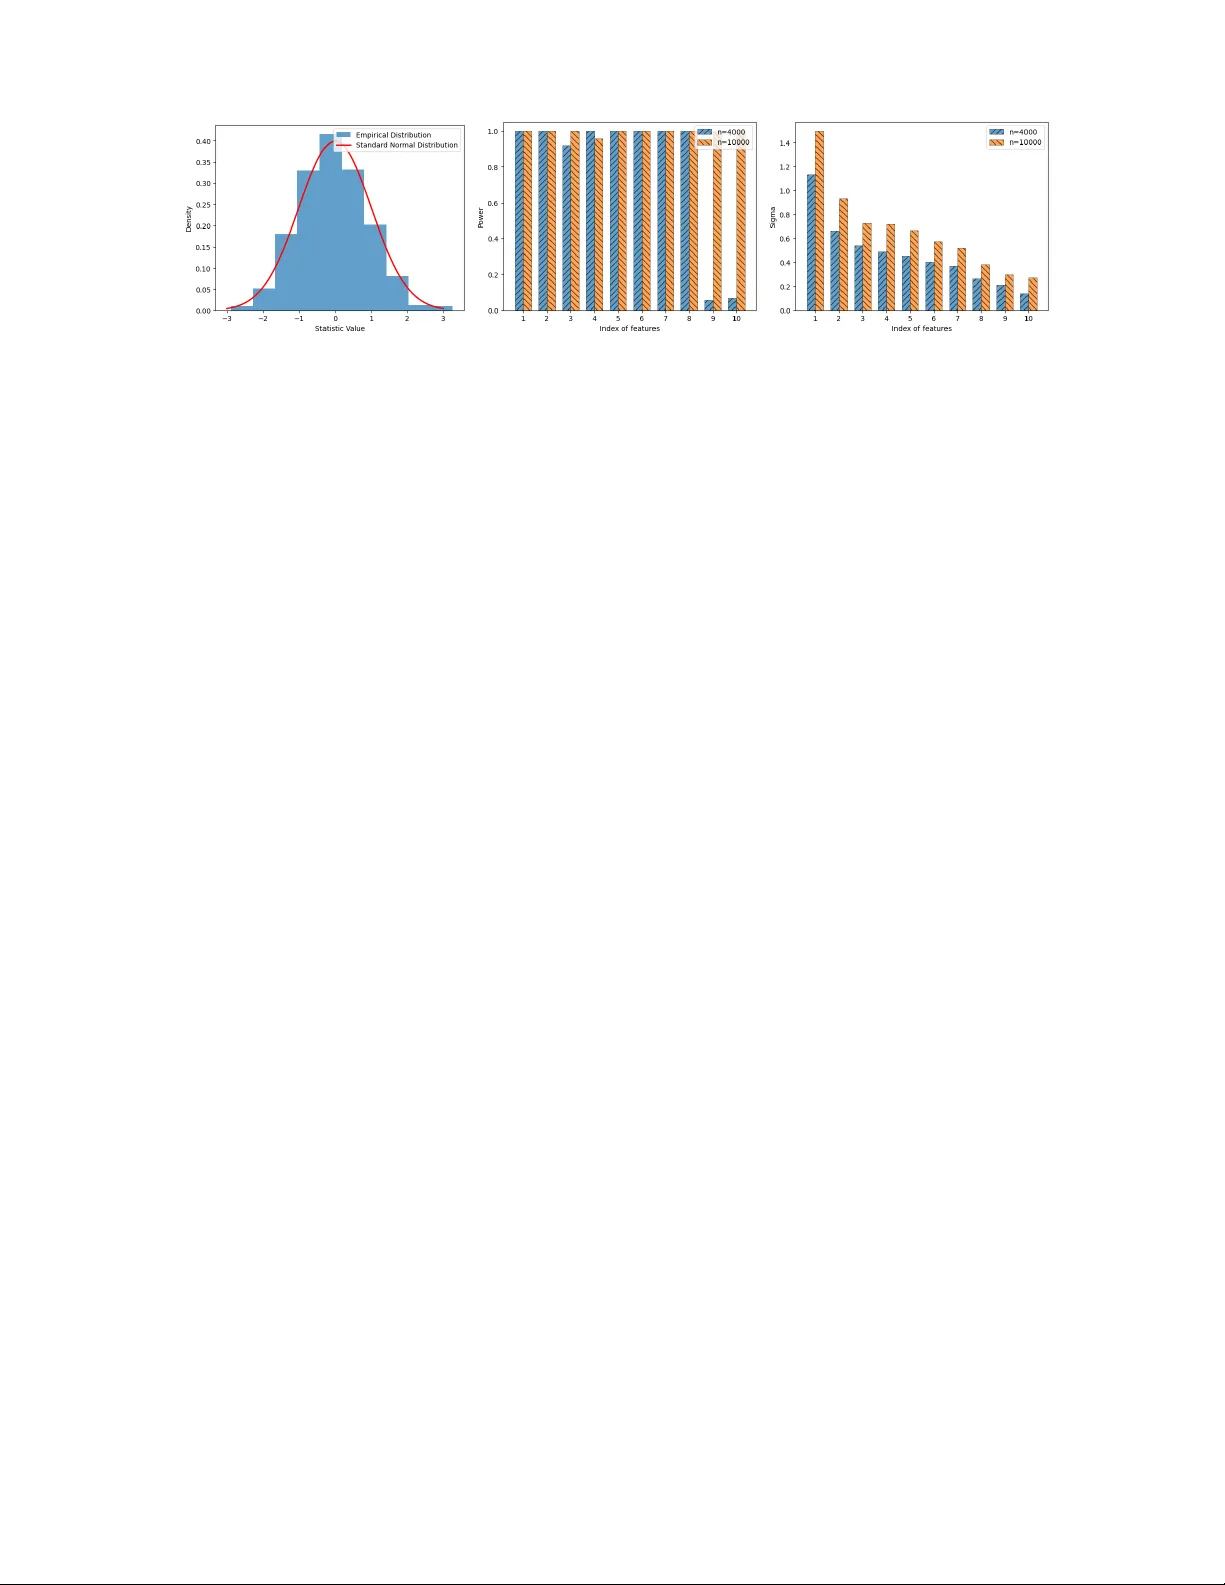
Minimal Sufficien t Represen tations for Self-in terpretable Deep Neural Net w orks ∗ Zhiy ao T an 1 † , Li Liu 3 † and Huazhen Lin 1 , 2 ‡ 1 Cen ter of Statistical Researc h, Sc ho ol of Statistics, and 2 New Cornerstone Science Lab oratory , South w estern Univ ersit y of Finance and Economics, Chengdu, China 3 Sc ho ol of Mathematics and Statistics, W uhan Univ ersity , W uhan, China Abstract Deep neural net works (DNNs) achiev e remarkable predictiv e performance but remain difficult to in terpret, largely due to ov erparameterization that obscures the minimal structure required for interpretation. Here we in tro duce DeepIn, a self- in terpretable neural netw ork framework that adaptively iden tifies and learns the minimal represen tation necessary for preserving the full expressiv e capacity of stan- dard DNNs. W e sho w that DeepIn can correctly identify the minimal represen tation dimension, select relev an t v ariables, and reco ver the minimal sufficient net work ar- c hitecture for prediction. The resulting estimator ac hieves optimal non-asymptotic error rates that adapt to the learned minimal dimension, demonstrating that re- co vering minimal sufficien t structure fundamentally improv es generalization error. Building on these guaran tees, we further dev elop hypothesis testing pro cedures for b oth selected v ariables and learned represen tations, bridging deep represen tation learning with formal statistical inference. Across biomedical and vision benchmarks, DeepIn impro ves both predictive accuracy and in terpretability , reducing error b y up to 30% on real-w orld datasets while automatically unco vering h uman-interpretable discriminativ e patterns. Our results suggest that in terpretabilit y and statistical rigor can b e em b edded directly into deep architectures without sacrificing p erformance. K eywor ds: In terpretable DNNs, High-dimensional learning, Representation learning, V ariable selection, Hyp othesis testing, A daptiv e net work arc hitecture ∗ The researc h was supported b y National Key R&D Program of China (No.2022YF A1003702), National Natural Science F oundation of China (Nos.12426309, 12171374, 12371275), Sic huan Science and T ec hnology Program, China (Grant No. 2025JDDJ0007), Op ening Pro ject F und of National F acilit y for T ranslational Medicine (Shanghai), New Cornerstone Science F oundation, and Guanghua T alen t Pro ject of SWUFE. † Co-first authors. ‡ Corresp onding author. Email address: linhz@swufe.edu.cn. 1 1 In tro duction Mo dern deep neural netw orks (DNNs) are t ypically hea vily o v erparameterized, con taining far more degrees of freedom than are strictly necessary for prediction. Suc h redundancy can lead to unstable estimation, inflated v ariance, substantial computational inefficiency , and hea vy reliance on enormous amounts of training data, while obscuring the minimal structural comp onen ts truly resp onsible for predictiv e p erformance. As a result, deep mo dels often b eha ve as black b o xes: the in trinsic represen tation dimension underlying their decisions remains unknown, irrelev ant features ma y b e en tangled with informative ones, and principled uncertain t y quantification is rarely a v ailable. These limitations p ose substantial challenges for deploying deep learning systems in high-stak es scien tific and societal applications, for example, medical diagnosis, financial risk assessmen t, and public p olicy ev aluation, where transparency , interpretabilit y , and statistical reliabilit y are essen tial. A fundamen tal questions therefore arises: Can we recov er the minimal sufficient represen tations in DNNs so that interpretabilit y and statistical rigor can b e incorp orated into deep architectures without degrading predictive accuracy? Recen tly , there has b een growing interest in in terpreting DNNs. A common strategy relies on p ost-hoc in terpretabilit y metho ds ( Rib eiro et al. 2016 , Lundb erg & Lee 2017 ), which employ surrogate in terpretable mo dels, suc h as linear mo dels or decision trees, to lo cally appro ximate the b eha vior of trained DNNs. Ho wev er, these metho ds often pro duce inconsisten t or ev en misleading explanations, as they capture only lo cal appro ximations rather than the mo del’s true in ternal mechanisms ( Ghorbani et al. 2019 ). Moreo ver, p ost-hoc explanations are detac hed from the mo del training pro cess, implying that interpretabilit y cannot guide the mo del tow ard learning more transparent representations ( Rudin 2019 ). T o address the limitations of p ost-hoc in terpretabilit y , self-interpretable DNNs ha v e b een prop osed ( Ji et al. 2025 ), whic h integrate interpretabilit y directly in to the mo del architecture 2 or learning ob jectiv e. Typical approaches include (1) designing sparse or disentangled represen tations ( Lemhadri et al. 2021 , Chen et al. 2021 , Luo & Halabi 2023 , W ang et al. 2024 , Lemhadri et al. 2021 , Chen et al. 2021 , Li et al. 2016 , Lu et al. 2018 ), (2) imp osing structural constrain ts suc h as modular la y ers or atten tion mec hanisms ( Liu et al. 2024 , V aswani et al. 2017 ), and (3) introducing in terpretable intermediate comp onen ts, for example concept b ottlenec ks or protot yp e lay ers ( K oh et al. 2020 , Li et al. 2018 ). By embedding in terpretabilit y into the netw ork, these mo dels allow explanations to emerge naturally from the learned represen tations rather than relying on external surrogate mo dels. Despite their adv an tages, existing self-in terpretable DNNs still face sev eral c hallenges. First, approac hes that imp ose arc hitectural constrain ts or introduce in terpretable in termediate comp onen ts often achiev e interpretabilit y at the exp ense of predictive accuracy or mo del flexibility , as suc h designs may restrict the net w ork’s expressiv e p o wer ( Y uksekgon ul et al. 2022 ). Second, man y metho ds, such as those based on attention w eights, fo cus on lo cal interpretabilit y without pro viding a coheren t global understanding of the mo del’s decision pro cess ( Jain & W allace 2019 ). Third, metho ds based on sparsit y assumptions for v ariable selection assume that only a few strong-signal co v ariates influence the resp onse. In practice, how ever, the effects of individual v ariables are often weak, and v ariables tend to influence the resp onse through joint or synergistic effects. Under sparsity assumptions, such joint influen tial patterns ma y b e missed, p oten tially leading to degraded mo del p erformance. Finally , b oth p ost-hoc in terpretabilit y and self-interpretabilit y are often ac hiev ed heuristically rather than through statistically principled mec hanisms, none of the existing DNN-based metho ds conduct significance testing on individual input v ariables or their combined represen tations, which limits their applicability in fields such as medicine and p olicy-making, where rigorous evidence is essential ( Lemhadri et al. 2021 , F arrell et al. 2021 ). Our k ey strategy for addressing the aforemen tioned c hallenges is to incorp orate a learnable 3 d × d matrix B in to standard DNNs, where d is the dimensionalit y of the input X . Sp ecifically , w e adopt the following Deep In terpretable neural net w ork (DeepIn) framew ork: Y ∼ g ( B X ) . (1) where g is appro ximated b y DNNs. Unlike classical index mo dels that pre-sp ecify a low- dimensional b ottlenec k, the DeepIn framew ork allo ws B to b e of size up to d × d , so that the identit y matrix is included as a sp ecial case. Consequently , when B equals the iden tity matrix, the prop osed framework ( 1 ) reduces to the general mo del Y ∼ g ( X ) , imp osing no structural restriction on the relationship b et w een X and Y . Therefore, the full represen tational capacit y of standard DNNs is preserved in ( 1 ). Imp ortan tly , the matrix B enables simultaneous feature identification and representation learning b y explicitly capturing effect patterns among high-dimensional cov ariates. In particular, the representation B X admits an in terpretation analogous to that of a linear mo del, providing explicit expressions of how X influences Y . Moreo v er, b y identifying and excluding the zero rows of B , the effectiv e dimension of the represen tation B X can b e determined automatically , yielding lo w-dimensional features derived from X . V ariables corresp onding to zero columns B [ ,j ] are sim ultaneously excluded, thereby achieving v ariable selection. As a result, b y imp osing the group LASSO p enalties on b oth the ro ws and columns of B , we can implemen t low-dimensional representation learning and v ariable selection automatically . Mean while, we incorp orate architecture-a w are p enalt y into neural net w orks for g , which can adaptiv ely compress the net work based on the learned represen tation dimension, thereby significan tly reducing statistical error while retaining the approximation error, as detailed in Section 2 . Finally , we dev elop a nov el hypothesis testing metho d to examine the significance of the selected v ariables and the learned representations. Rigorous theoretical guarantees for the prop osed test are provided in Theorems 3 and 5 . Extensiv e exp erimen ts on sim ulated datasets and four real datasets, including ADNI, 4 BlogF eedback, MNIST, and F ashionMNIST, demonstrate the sup erior effectiv eness of our metho d in representation learning, v ariable selection, and netw ork iden tification, leading to significant improv ements in b oth accuracy and stability , as shown in T ables 1 , 2 , 4 and Supplementary T ables G1 - G3. In particular, compared with off-the-shelf metho ds suc h as DFS ( Chen et al. 2021 ), LassoNet ( Lemhadri et al. 2021 ), and GCRNet ( Luo & Halabi 2023 ), our approach reduces predictiv e error by 30.26% on ADNI and 19.65% on BlogF eedback. A dditionally , as shown in Figures 3 and 4 , our metho d automatically iden tifies human-in tuitive discriminative patterns, suc h as c haracteristic strokes in digit recognition and garment-specific regions in fashion classification, thereb y ac hieving mo del in terpretabilit y . Finally , as shown in Figures 1 and 2 , and Supplementary Figures G1 and G3, our h yp othesis testing pro cedure reliably distinguishes informativ e v ariables and represen tations from noise, ac hieving near-p erfect p o wer for informative v ariables and o v er 0.8 for the learned representations, while main taining the nominal significance level. In theory , we establish the selection consistency of our estimators. This prop ert y provides theoretical guaran tees for the identification of imp ortan t v ariables, the determination of the minimal num b er of sufficient representations required to minimize generalization error, and the discov ery of efficient sub-netw ork architectures. The selection consistency holds in high-dimensional settings where log d = o ( n α ) for some 0 < α < 1 , sim ultaneously allo wing the n umber of original net work parameters to gro w exp onen tially with the sample size, and the num b er of selected parameters to diverge as n → ∞ . These results ensure effectiv e recov ery of b oth informative inputs and representations in high-dimensional regimes without the need for explicit architectural tuning. F urthermore, w e deriv e optimal non- asymptotic error b ounds for the estimates of the function g , which has the order of ˆ d β ∨ 1+ ⌊ β ⌋ ( n/ log c n ) − 2 β / ( ˆ d +2 β ) , where ˆ d is the learned representation dimension. This finding underscores the critical imp ortance of selecting lo w-dimensional representations. Building 5 on the established selection consistency and non-asymptotic error b ounds, we pro v e the asymptotic normalit y of the representation matrix estimator and the functional asymptotic normalit y of the estimated function. These results hold ev en when the num b er of selected represen tations and imp ortan t v ariables diverges. T ogether, they form the theoretical foundation for constructing rigorous statistical inference to test the effects of b oth selected v ariables and learned representations. The remainder of this pap er is organized as follows. Section 2 in tro duces the proposed metho d in detail. Theoretical prop erties of the estimators, including the non-asymptotic error b ound and the selection consistency are established in Section 3 . In Section 4 , we dev elop a no vel h yp othesis testing procedure to assess the significance of v ariables and represen tations. The implementation details are pro vided in Section 5 . Section 6 presen ts extensiv e sim ulation studies, and Section 7 applies our metho d to the ADNI, BlogF eedback, MNIST, and F ashionMNIST datasets. Finally , Section 8 concludes the pap er. Additional tec hnical pro ofs and n umerical results are included in the Supplemen tary Materials. Notations. Let β = q + r , r ∈ (0 , 1] and q = ⌊ β ⌋ ∈ N 0 , where ⌊ β ⌋ denotes the largest in teger strictly smaller than β and N 0 represen ts the set of non-negative in tegers. F or a finite constan t B > 0 , the Hölder class H β ([0 , 1] d , B ) is defined as H β ([0 , 1] d , B ) = ( g : [0 , 1] d 7→ R , max | α |
0 and B > 0 . F or v ∈ [1 , ∞ ) , we define the L v -norms ∥ g ∥ v L v ([0 , 1] d ) = R [0 , 1] d g v ( x ) d x , the v -norm ∥ g ∥ v v = R g v ( x ) dP ( x ) , and the sup erm um norm ∥ g ( x ) ∥ L ∞ ([0 , 1] d ) = ∥ g ∥ ∞ = sup x | g ( x ) | . The same notation ∥ · ∥ v applies to the v -norm of v ectors and matrices. 6 2 Metho d Theoretical analysis sho ws that our statistical inference, detailed in Section 4 , inv olves estimating b oth the target functions and their deriv atives. Deriv ativ e estimation requires the use of deep neural netw orks (DNNs) with Rectified P o wer Unit (RePU) activ ations of order p ≥ 2 , as established in Supplemen tary Corollary 2. Accordingly , w e consider a class of RePU- activ ated neural netw orks G to approximate the target function, where eac h g n ∈ G tak es the form g n ( x ) = W ⊤ D σ W ⊤ D− 1 σ ( W ⊤ D− 2 σ ( W ⊤ D− 3 . . . σ ( W ⊤ 0 x + a 0 )) + a D− 2 ) + a D− 1 + a D , with σ ( x ) = { max ( x, 0) } p denoting the RePU activ ation, applied elemen twise for p ≥ 2 . The net w ork architecture is c haracterized b y depth D , width W , size S , and numb er of neur ons U . Let d j denote the width of lay er j for j = 1 , · · · , D + 1 , where the input and output dimensions are d and d D +1 = 1 . Then W = max { d 1 , d 2 , . . . , d D } , S = P D i =0 d i +1 ( d i + 1) , and U = P D i =1 d i . Denote b y θ = { ( W j , a j ) , j = 0 , . . . , D } the collection of net w ork w eights. Accordingly , w e parametrize g n ∈ G as g θ , and define the estimation space as G B := G × R d × d for ( g , B ) defined in mo del ( 1 ). T o automatically p erform representation learning and v ariable selection, w e adopt a group lasso p enalt y on b oth the rows and columns of B . F urthermore, based on the n umber of learned representations, we incorp orate an additional net w ork p enalt y on g θ to ensure that the netw ork arc hitecture aligns with the identified represen tation dimensionalit y . Then the estimator for the parameter µ := ( θ , B ) is obtained as ˆ µ = arg min µ :( g θ , B ) ∈G B R n ( g θ , B ) := arg min µ :( g θ , B ) ∈G B 1 n n X i =1 L ( g θ , B ; S i ) + λρ ( µ ) , (2) where L ( g θ , B ; S i ) ˆ = ˜ L ( g θ ( B X i ) , Y i ) , ˜ L ( · , · ) is a loss function, suc h as the least squared (LS) loss for regression or the cross-en tropy loss for classification, S i = ( X i , Y i ) , ρ ( µ ) = ( ρ 1 ( µ ) , ρ 2 ( µ ) , ρ 3 ( µ )) = P d k =1 ∥ B [ k, ] ∥ 2 , P d k =1 ∥ B [ ,k ] ∥ 2 , ∥ θ ∥ 1 , λρ ( µ ) = 3 P j =1 λ j ρ j ( µ ) , and B [ k, ] and B [ ,k ] denote the k -th row and k -column of the matrix B resp ectiv ely . Here the first p enalt y iden tifies the n um b er of representations b y detecting and excluding zero rows 7 of B . Since column j of B represen ts the effect of v ariable j , a zero column indicates that v ariable j has no impact on Y . Therefore, the second p enalt y on columns is used for v ariable selection, while the third p enalt y con trols the netw ork complexit y to match the effectiv e dimension of the function g , i.e., the n um b er of selected representations. F urther details regarding ρ 3 ( µ ) and the implemen tation of the prop osed metho d are pro vided in Section 5 . 3 Selection consistency and error analysis Throughout the pap er, the subscript “ 0 " is used to denote the true v alue or the corresp onding minimal quantit y . Due to the inheren t uniden tifiability of neural netw orks, w e define the parameter set required to achiev e the smallest appro ximation error by Υ 0 := { µ : µ ∈ arg min µ :( g θ , B ) ∈G B ∥ g θ ( B X ) − g 0 ( B 0 X ) ∥ L v ([0 , 1] d ) } for some v ∈ [1 , ∞ ] . Because multiple represen tation dimensions may b e capable of appro ximating the target function g 0 ( B 0 X ) , w e in tro duce the following definition of the minimal representation dimension. Definition 1. The minimal r epr esentation dimension (MRD) is define d as d 0 := min d { d | µ = ( θ , B ) ∈ Υ 0 , wher e the numb er of nonzer o r ows of B is d } . Without loss of generalit y , we assume that only the first d 0 ro ws and the first s 0 columns of B 0 ∈ R d × d are nonzero, while all other entries are zero, where s 0 is the num b er of imp ortan t v ariable in X . W e further in tro duce S net 0 := min µ ∈ Υ 0 ∥ θ ∥ 0 as the minimal net work size required to ac hieve optimal approximation. Denote S 0 := ( d 0 , s 0 , S net 0 ) , and let Υ min = { µ : µ ∈ Υ 0 , S µ = S 0 } b e the set of parameters ac hieving the smallest approximation error with a minimal netw ork under the MRD framew ork. Then the minimal n umber of parameters required to ac hieve the smallest appro ximation error is T 0 = S net 0 + d 0 s 0 . W e regard µ 0 = ( θ 0 , B 0 ) ∈ Υ min as the true v alues. Definition 2 (Selection consistency) . A n estimator ˆ µ achieves sele ction c onsistency if P ( S ˆ µ = S 0 ) → 1 as n → ∞ , wher e S µ := d P k =1 I ( ∥ B [ k, ] ∥ = 0) , d P k =1 I ( ∥ B [ ,k ] ∥ = 0) , ∥ θ ∥ 0 8 denotes the triplet c onsisting of the numb er of active r epr esentations, the numb er of imp ortant variables, and the numb er of nonzer o neur al network weights. T o establish the selection consistency , we define the oracle estimation class Υ org := { µ : µ ∈ arg min µ :( g θ , B ) ∈G B R n ( g θ , B ) , S µ = S 0 } , where S µ = S 0 implies that ( d 0 , s 0 , S net 0 ) are kno wn. If w e can show that P ( ˆ µ ∈ Υ org ) → 1 , then selection consistency is established. A ccording the definition of B 0 , the activ e index sets for non-zero represen tations and imp ortan t v ariables are A 1 = { 1 , · · · , d 0 } and A 2 = { 1 , · · · , s 0 } , resp ectiv ely . The index set of non-zero net work w eigh ts for θ 0 within a minimal netw ork is defined as A 3 ( θ 0 ) = { k : θ 0 k = 0 , µ 0 = ( θ 0 , B 0 ) ∈ Υ min } , where θ 0 k denotes the k -th element of the v ectorized θ 0 . The half minimal signal strength among these effects is then l n = min n min k ∈A 1 ∥ B 0[ k, ] ∥ 2 , min k ∈A 2 ∥ B 0[ ,k ] ∥ 2 , min k ∈A 3 ( θ 0 ) | θ 0 k | o / 2 . As shown in Supplemen tary Prop o- sition C2, we denote the appro ximation error as η net := c 1 B d ( β ∨ 1+ ⌊ β ⌋ ) / 2 0 ( M N ) − 2 β /d 0 , where M and N are p ositiv e in tegers related to depth and width resp ectiv ely , and c 1 is a constant dep ending on β . Theorem 1 (Selection consistency) . F or some 0 ≤ ν 2 < ν 1 ≤ 1 / 2 , define ∆ net,n := C n − 1 / 2 + D log n · η 2 net T 1 − 2 ν 2 0 , wher e C and D ar e p ositive c onstants. Under Supplementary A ssumptions 1-5, if for some c onstants C 1 , C 2 and C , min n λ ◦ ρ m ( ˆ µ A c ) o ≥ I min n ρ m ( ˆ µ A c ) o = 0 ∆ net,n , C 1 η net / T ν 1 0 ≤ λ m ≤ C 2 η net / T ν 2 0 , l n > C λ m T 0 , N ( δ 1 , δ 2 ) 3 X j =1 exp( − nr 2 j n t 2 ) + exp( − C nη 2 net ) → 0 , (3) wher e λ m := λ 1 ∨ λ 2 ∨ λ 3 with λ j = R j ( t ) , ρ m ( ˆ µ A c ) := P k ∈A c 1 ∥ ˆ B [ k, ] ∥ 2 , P k ∈A c 2 ∥ ˆ B [ ,k ] ∥ 2 , min k ∈A c 3 ( θ 0 ) | ˆ θ k | , the ◦ denotes the elementwise multiplic ation op er ator, and N ( δ 1 , δ 2 ) , r j n and R j ( t ) ar e define d in Supplementary, then P ( ˆ µ ∈ Υ org ) → 1 as n → ∞ . 9 In ( 3 ), ∆ net,n represen ts an upp er b ound on the empirical excess risk b et ween the estimated net work ˆ µ ∈ R d µ and its pro jection ˜ µ on to a minimal net work. Specifically , w e hav e | P n ( L ( g ˆ θ , ˆ B ; S ) − L ( g ˜ θ , ˜ B ; S )) | ≤ ∆ net,n . When the elements of tuning parameter λ are large enough so that min n λ ◦ ρ m ( ˆ µ A c ) o ≥ I min n ρ m ( ˆ µ A c ) o = 0 ∆ net,n , the redundant net work parameters, irrelev ant representations, and unimp ortan t v ariables of X can b e effectiv ely eliminated. The second condition C 1 η net / T ν 1 0 ≤ λ m ≤ C 2 η net / T ν 2 0 in ( 3 ) requires the tuning parameter λ m to b e of order O ( η net / T ν 0 ) for some ν ∈ ( ν 2 , ν 1 ) . The third condition implies that the minim um signal strength must exceed the threshold λ m T 0 , whic h dep ends on b oth the minimal size T 0 and the choiced tuning parameter λ m . These conditions ensure the iden tifiabilit y of significant represen tations, imp ortan t v ariables and sub-netw orks of minimal size. When N ( δ 1 , δ 2 ) is finite, the final condition in ( 3 ) is satisfied provided that 1 / ( r 2 j n t 2 ) = o ( n ) for j = 1 , 2 , 3 and 1 /η net = o ( √ n ) . By the definition of r j n in Supplemen tary , the condition 1 / ( r 2 j n t 2 ) = o ( n ) can b e satisfied when the cov ariate dimension d gro ws at an exp onen tial rate and the dimension of selected v ariables s 0 gro ws p olynomially with sample size, giv en an appropriately c hosen tuning parameter t . The second condition 1 /η net = o ( √ n ) requires the appro ximation error η net to deca y more slo wly than n − 1 / 2 . Th us, Theorem 1 demonstrates that with suitable λ and sufficien tly strong signals in b oth the netw ork and representation matrix, we can achiev e effective signal reco very , ensuring selection consistency with high probabilit y . Next, w e establish b oth estimation consistency and non-asymptotic error b ounds. Theorem 2 (Non-asymptotic error b ound) . F or inte gers M and N , we c an obtain a R ePU DNN estimator ( g ˆ θ , ˆ B ) with width at most p ( ⌊ β ⌋ + 1) 2 d ⌊ β ⌋ +1 N ⌈ log 2 (4 N ) ⌉ , depth D at most 13 M ⌈ log 2 (4 M ) ⌉ + max { 0 , ⌈ log p ( ⌊ β ⌋ ) ⌉ − 1 } , and size at most 184 pN 2 M ( ⌊ β ⌋ + 10 1) 4 d ⌊ β ⌋ +1 ⌈ log 2 (8 N M ) ⌉ . Under the c onditions of The or em 1 , supp ose that B d β ∨ 1+ ⌊ β ⌋ 0 ( N M ) − 4 β /d 0 → 0 , ι net,n → 0 , and min µ 0 ∈ Υ min λρ ( µ 0 ) ≤ ι net,n / 2 , (4) wher e the ι net,n is sto chastic err or, define d as ι net,n := 3 2 2 24 max { B 2 7 n , 4 B 2 8 }D 2 (log n ) T 0 log( p T 0 ) /n with B 7 n and B 8 b eing define d as in Supplementary A ssumption 5. Then (1) (Estimation c onsistency) The estimator satisfies E ∥ g ˆ θ ( ˆ B X ) − g 0 ( B 0 X ) ∥ 2 2 → 0 . (2) (Non-asymptotic err or b ound) The err or b ound for lar ge n satisfies E ∥ g ˆ θ ( ˆ B X ) − g 0 ( B 0 X ) ∥ 2 2 ≤ 2 c 2 1 B 5 B 4 B 2 d β ∨ 1+ ⌊ β ⌋ 0 ( N M ) − 4 β /d 0 + 3 ι n,net B 4 . The first condition in ( 4 ) requires the original net w ork to b e sufficien tly large, while the second condition necessitates prop er con trol of the minimal size T 0 and the original depth D . When the p enalt y term is properly con trolled, the third condition min µ 0 ∈ Υ min 2 λ ρ ( µ 0 ) ≤ ι net,n holds. The error b ound in Theorem 2 decomp oses into t wo comp onen ts: an appro xi- mation error of order d β ∨ 1+ ⌊ β ⌋ 0 ( N M ) − 4 β /d 0 , and the stochastic error ι net,n of order max { B 2 7 n , 4 B 2 8 } ( log n ) D 2 T 0 log ( p T 0 ) /n . Theorem 2 reveals the appro ximation error is driven b y the MRD d 0 , while the sto c hastic error scales with D 2 T 0 . These results emphasize the imp ortance of selecting the MRD and a minimal netw ork that achiev es the optimal appro ximation error, as these factors directly determine the generalization p erformance. Corollary 1 (Optimal non-asymptotic error b ound) . Under the c onditions of The or em 2 , when N = ( n/ log c n ) d 0 / 2( d 0 +2 β ) and M is a finite c onstant, the DNN estimator achieves the optimal err or b ound E ∥ g ˆ θ ( ˆ B X ) − g 0 ( B 0 X ) ∥ 2 2 ≤ C B 2 d β ∨ 1+ ⌊ β ⌋ 0 ( n/ log c n ) − 2 β / ( d 0 +2 β ) 11 for sufficiently lar ge n , wher e C is a p ositive c onstant. The exp onent c e quals 3 when B 7 n is finite and 5 when B 7 n is diver gent. Corollary 1 implies the optimal non-asymptotic error b ound is ac hiev ed by a net work with a fixed-depth, width not exceeding 38 p ( ⌊ β ⌋ + 1) 2 d ⌊ β ⌋ +1 0 ⌈ n d 0 / 2( d 0 +2 β ) c log 2 { 4 n d 0 / 2( d 0 +2 β ) c }⌉ and size b ounded b y 2( ⌊ β ⌋ + 1) 4 d ⌊ β ⌋ +1 0 ⌈ log 2 { 8 M n d 0 / 2( d 0 +2 β ) c }⌉{ 52 M n d 0 / ( d 0 +2 β ) c +40 pM } , where n c = n/ log c n . The term B 7 n is determined by the mo del and the loss function. F or instance, B 7 n = O ( log n ) for least squares loss in a regression mo del with an unbounded resp onse, while it is finite for the negativ e log-lik eliho od loss in logistic regression. While data are often observed in a high-dimensional ambien t space, the essential v ariation of the target function t ypically lies on a muc h low er-dimensional structure. Manifold learning theory ( Belkin & Niy ogi 2004 , F efferman et al. 2016 ) formalizes this idea, sho wing that the complexit y of learning is determined b y the in trinsic, rather than ambien t, dimension. P articularly , when the predictor X is supp orted on M ρ , a neighborho o d of a compact d M -dimensional Riemannian manifold M ⊂ [0 , 1] d with condition n umber 1 /τ ( Hubbard & Hubbard 2015 ), the conv ergence rates adapt to the in trinsic manifold dimension. F or instance, Theorem 6.2 in Jiao et al. ( 2023 ) shows that under exact manifold assumptions, the ReLU DNN estimator satisfies E | g ˆ θ ( X ) − g 0 ( X ) | 2 ≤ C B 5 ( ⌊ β ⌋ + 1) 9 (6 /τ ) 2 d M d 3 ⌊ β ⌋ +6 M d (log n ) 8 n − 2 β / ( d M +2 β ) . (5) The manifold rate n − 2 β / ( d M +2 β ) and the optimal rate n − 2 β / ( d 0 +2 β ) established in Corollary 1 exhibit similar conv ergence b eha vior, indicating that the selected dimension d 0 effectiv ely serv es as the intrinsic dimension d M . An imp ortan t distinction, how ever, is that the error b ound under manifold assumptions still scales linearly with the am bien t dimension d , our optimal rate dep ends solely on the identified in trinsic dimension d 0 , which is typically m uch smaller than d . This highlights the effective dimension reduction achiev ed by our estimators and demonstrates that our metho d can efficiently handle high-dimensional problem. 12 In addition, the manifold rate alone pro vides limited guidance in practice. F or example, as seen in T ables 1 and Supplementary G1-G3, even when the underlying netw ork has a lo w- dimensional structure, conv entional DNN training yields considerably low er accuracy than our metho d that fully explores and exploits the intrinsic dimensionality . The main reason is that, without prior knowledge of task complexit y , net work arc hitectures are t ypically selected heuristically or with only limited manual tuning, making it difficult to ac hiev e the theoretical optim um. In contrast, our metho d adapts to the intrinsic geometry of the data and thus achiev es optimal p erformance in b oth theory and practice. It therefore bridges the gap b et ween minimax theory and practical implementation. 4 Hyp othesis testing Our analysis b egins in the oracle space G org B = { ( g θ , B ) : ( g θ , B ) ∈ G B , S µ = S 0 } , where w e establish the asymptotic normalit y of ˆ B and the functional normalit y of g ˆ θ . Theorem 1 , which guarantees selection consistency , allows us to generalize these results to the full space G B . Therefore, for notational simplicit y , w e hereafter let X ≡ X A 2 represen t the activ e set of predictors and, with slight abuse of notation, tak e G B to b e the oracle subspace G × R d 0 × s 0 . Since the MRD d 0 is typically smaller than the num b er of cov ariates, we assume that the representation extractor B ∈ R d 0 × s 0 has full row rank. 4.1 T esting for individual co v ariate effects B 0[ ,j ] = 0 implies that cov ariate j has no effect on Y . Hence, significan t v ariables in X can b e iden tified by testing the hypotheses H 0 : ∥ B 0[ ,j ] ∥ 2 = 0 v.s. H 1 : ∥ B 0[ ,j ] ∥ 2 = 0 for each predictor comp onen t j = 1 , . . . , s 0 . How ever, since B in the mo del ( 1 ) is not iden tifiable, directly testing these h yp otheses is infeasible. T o o vercome this issue, we introduce an iden tifiable represen tation matrix ˜ B 0 ∈ R d 0 × s 0 satisfying the following condition: 13 Condition 1. The matrix ˜ B 0 has ful l r ow r ank and satisfies g 0 ( B 0 X ) = ˜ g 0 ( ˜ B 0 X ) for any X . F urthermor e, ˜ B 0 is c onstr aine d such that (i) the first nonzer o element in e ach r ow is strictly p ositive, (ii) e ach r ow is normalize d to have unit ℓ 2 -norm, i.e., ∥ ˜ B 0[ j, ] ∥ 2 = 1 , and (iii) its singular value de c omp osition (SVD) pr o duc es a se quenc e of p ositive and monotonic al ly de cr e asing singular values. F ollowing Y uan ( 2011 ), it can b e sho wn that ˜ B 0 is iden tifiable. W e estimate ˜ B 0 using the prop osed metho d with an additional normalization step to ensure that the resulting estimator ˆ ˜ B satisfies Condition 1 . Define L ( l ) ( u ; S ) = ∂ l L ( u ; S ) /∂ u l for l ≥ 1 . Let Λ 1 = Λ max ( J ⊤ ( ˜ B 0 ) V − 2 1 J ( ˜ B 0 )) , Λ 2 = Λ max ( V 3 ) and Λ 3 = Λ min ( V 3 ) , where Λ max and Λ min denote the largest and smallest eigenv alues of a matrix resp ectiv ely . The matrices J ( ˜ B 0 ) and V k , k = 1 , 2 , 3 are defined in Supplementary A. In Theorem 3 , we first establish the asymptotic normalit y of ˆ ˜ B , and then demonstrate the asymptotic equiv alence of test statistics constructed from ˆ B and ˆ ˜ B . These results provide a theoretical foundation for testing the significance of each predictor X [ j ] using an y estimator for B obtained from ( 2 ). Theorem 3. L et α n = d β 0 ( n/ log c n ) − ( β − 1) / ( d 0 +2( β − 1)) , wher e c is the c onstant fr om Cor ol lary 1 . Under the assumptions of Cor ol lary 1 and c ondition (D3) in Supplementary D with r ≥ 1 , supp ose the Lipschitz c ondition holds for the l -th derivative of L ( · , · ) for l ≥ 1 , namely, | L ( l ) ( g θ 1 , B 1 ; S ) − L ( l ) ( g θ 2 , B 2 ; S ) | ≤ C S | g θ 1 ( B 1 X ) − g θ 2 ( B 2 X ) | , (6) wher e C S may dep end on S with E e aC S < ∞ for some c onstant a > 0 . Mor e over, we supp ose that E [ L (1) ( ˜ g 0 , ˜ B 0 ; S ) | B 0 X ] = 0 and E [ L (1)2 ( ˜ g 0 , ˜ B 0 ; S ) | B 0 X ] = ς 2 1 . F urther, we assume d 0 s 0 Λ 1 n → 0 , nd 0 s 0 Λ 1 Λ 2 α 4 n → 0 , Λ 1 Λ 2 n → 0 , d 0 s 0 n Λ 2 3 → 0 , n ( d 0 + s 0 )( λ 1 ∨ λ 2 ) 2 Λ 2 ∧ (Λ 3 / Λ 1 ) → 0 . (7) Then for β > 1 : (1) (A symptotic normality) √ n u ⊤ Σ − 1 ˆ ˜ B − ˜ B 0 d − → N (0 , 1) . Her e u is any unit ve ctor in R d 0 ( s 0 − 1) , ˜ B is the ve ctorization of ˜ B ⊤ , and Σ − 1 = ς − 1 1 V − 1 / 2 3 . 14 (2) (Hyp othesis testing) Under the nul l hyp othesis H 0 : ∥ B 0[ ,j ] ∥ 2 = 0 , for any unit ve ctor u j ∈ R d 0 , √ nς − 1 u ⊤ j ¯ V − 1 / 2 3 ˆ B [(1: d 0 ) s 0 + j − s 0 ] = √ nς − 1 u ⊤ j V − 1 / 2 3 ˆ ˜ B [(1: d 0 ) s 0 + j − s 0 ] , wher e [(1 : d 0 ) s 0 + j − s 0 ] indexes the ve ctor c orr esp onding to B 0[ ,j ] , and ¯ V 3 is define d in Supplementary A. When Λ j , j = 1 , 2 , 3 are finite, condition ( 7 ) holds if d 0 s 0 = o ( n ) , d 0 s 0 α 4 n = o ( n − 1 ) and λ 1 ∨ λ 2 is sufficien tly small. These requiremen ts are satisfied, for instance, if d 0 s 0 = O ( n α 4 ) and α n = o ( n − (1+ α 4 ) / 4 ) for some α 4 < 1 . Consequently , asymptotic normality and v alid h yp othesis testing remain attainable even when the intrinsic dimension d 0 and the sparsit y lev el s 0 div erge. F urthermore, under the null h yp othesis, the equiv alence of statistics related to ˆ B and ˆ ˜ B implies that √ nς − 1 u ⊤ j ¯ V − 1 / 2 3 ˆ B [(1: d 0 ) s 0 + j − s 0 ] d − → N (0 , 1) . Consequen tly , the follo wing testing pro cedure remains v alid within the estimation space G B ev en when the true parameter B 0 is not uniquely identifiable. • The conditional exp ectation E ( X | B 0 X ) is estimated nonparametrically via a neural net w ork, where the unkno wn matrix B 0 is replaced by ˆ B . • The matrices ˆ V 1 and ˆ V 2 are obtained by replacing B 0 and g (1) 0 with their resp ectiv e estimators, ˆ B and g (1) ˆ θ , in the empirical counterparts of V 1 and V 2 . • W e estimate the error v ariance as ˆ ς 2 1 = P n L (1)2 ( g ˆ θ , ˆ B ; S ) , and obtain ˆ ¯ V 3 = ¯ J ⊤ ( ˆ B ) ˆ V − 1 1 ˆ V 2 ˆ V − 1 1 ¯ J ( ˆ B ) . • F or each predictor comp onen t X [ j ] , w e compute the test statistic U [ j ] = √ n ˆ ς − 1 ˆ ¯ V − 1 / 2 3 ˆ B [(1: d 0 ) s 0 + j − s 0 ] . • The corresp onding p -v alue is obtained by P ( χ 2 ≥ ∥ U [ j ] ∥ 2 2 ) , where χ 2 follo ws a χ 2 - distribution with d 0 degrees of freedom. 15 4.2 T esting for the effects of com bined represen tations Let z = ( z 1 , · · · , z d 0 ) T := B 0 x , where z i = B ⊤ 0[ i, ] x denotes the i th combination repre- sen tation in g 0 for i = 1 , . . . , d 0 . F or a given index set I ⊆ [1 : d 0 ] with complement I c = [1 : d 0 ] \ I , w e define z I = ( z I , 1 , · · · , z I ,d 0 ) T suc h that z I ,j = z j for j ∈ I and z I ,j = 0 for j ∈ I c . If g 0 ( z ) = g 0 I ( z I ) , then the com bination represen tations B ⊤ 0[ i, ] X for i ∈ I c are not statistically significan t. Hence, testing whether the combination representations B ⊤ 0[ i, ] X , i ∈ I , hav e significant effects on Y is equiv alent to testing the hypothesis H 0 : g 0 ( z ) = g 0 I ( z I ) v .s. H 1 : g 0 ( z ) = g 0 I ( z I ) , where the test statistics are constructed based on the follo wing functional asymptotic normalit y . Theorem 4 (F unctional normality) . Under the c onditions of The or em 3 , assuming ( 6 ) holds for l ≥ 2 , then we have √ n Z L (2) ( g 0 , B 0 ; s ) nh g ˆ θ ( B 0 x ) − g 0 ( B 0 x ) i + h g 0 ( ˆ B x ) − g 0 ( B 0 x ) io dP ( s ) d − → N (0 , ς 2 2 ) , wher e P ( s ) = P ( x , y ) is the pr ob ability me asur e of S = ( X , Y ) and ς 2 2 = E m 2 1 ( g 0 , B 0 ; S ) , wher e m 1 is define d in Supplementary A. T o lev erage this theorem for constructing test statistics, we split the dataset S in to tw o indep enden t subsets S 1 and S 2 , with sample size n 1 and n 2 resp ectiv ely . Let P n j denote the empirical measure of S j for j = 1 , 2 . F or subset j , we obtain the estimators ˆ g [ j ] µ := g [ j ] ˆ θ , ˆ B [ j ] for g 0 ( B 0 x ) , and ˆ g [ j ] µ I := g [ j ] ˆ θ I , ˆ B [ j ] I for g 0 I ( B 0 I x ) . Here B 0 I is the matrix obtained from B 0 b y keeping its i th ro w if i ∈ I and replacing it with the zero vector otherwise. W e assume that, b oth ˆ B [ j ] and the submatrix of ˆ B [ j ] I formed b y the rows i ∈ I , satisfy Condition 1, ensuring that the estimators of ( g 0 , B 0 ) and ( g 0 I , B 0 I ) are w ell-defined on b oth subsets S 1 16 and S 2 . The test statistic for H 0 : g 0 ( z ) = g 0 I ( z I ) is constructed as T n = √ n ( T [1] n + T [2] n ) , where for j, k = 1 , 2 and k = j , T [ j ] n := n j n P n j u ( ˆ g [ j ] µ I , ˆ g [ k ] µ ; S j ) , and u ( ˆ g [ j ] µ I , ˆ g [ k ] µ ; S j ) := L (2) ˆ g [ j ] µ I ; S j g [ k ] ˆ θ ˆ B [ j ] I X j − g [ j ] ˆ θ I ˆ B [ j ] I X j + g [ j ] ˆ θ I ˆ B [ k ] X j − g [ j ] ˆ θ I ˆ B [ j ] I X j . Ob viously , T n is the empirical coun terpart of the statistic discussed in Theorem 4 . As a result, w e ha v e the follo wing theorem. Theorem 5 (Asymptotic normality of test statistic) . A ssume the c onditions of The or em 4 hold, and let n 1 /n → p as n → ∞ with 0 < p < 1 . Then under H 0 : g 0 ( z ) = g 0 I ( z I ) , the fol lowing r esults hold: (1) The test statistic T n c onver ges in distribution to N (0 , ς 2 2 ) . (2) The asymptotic varianc e ς 2 2 c an b e c onsistently estimate d by ˆ ς 2 2 = 2 P j =1 P n j ( L (1) ( ˆ g [ j ] µ I ; S j )) 2 / 2 . Theorem 5 requires the tw o split datasets to ha v e sample sizes of the same asymptotic order. Based on this result, w e construct the test statistic T n / ˆ ς 2 , whic h asymptotically follo ws a standard normal distribution. This provides a rigorous foundation for testing the significance of the combination effects B ⊤ [ i, ] X for i ∈ I , under the null hypothesis H 0 : g 0 ( z ) = g 0 I ( z I ) . 5 Implemen tations In this section, w e detail the implementation of the prop osed metho d. W e use a mini-batch sto c hastic gradien t descen t algorithm ( Bottou 2010 ) to solve ( 2 ) . Directly optimizing ( 2 ) with gradient-based metho ds is c hallenging because the p enalt y terms ∥·∥ 2 and ∥·∥ 1 are nondifferen tiable at zero. T o address this issue, w e adopt a subgradien t descen t algorithm ( Bo yd et al. 2004 ) combined with parameter truncation. Three thresholding 17 h yp erparameters, τ 1 , τ 2 , and τ 3 , are used to truncate ro ws and columns of ˆ B with small L 2 norms, and elements of ˆ θ with small absolute v alues, resp ectiv ely . Algorithm 1 illustrates the truncation pro cedure for the ro w-wise op eration with threshold τ 1 . The same idea applies to column-wise truncation using τ 2 and elemen t-wise truncation of θ using τ 3 . The complete training pip eline of the prop osed metho d is summarized in Algorithm 2 . Additional details on the subgradien t computation and the selection of τ 1 , τ 2 , and τ 3 are provided in Supplemen tary E. There are several technical considerations in implementing the algorithm. First, Corollary 1 sho ws that the optimal error b ound is ac hieved when the netw ork depth is fixed. T o main tain go o d p erformance, w e therefore regulate the netw ork depth when controlling net w ork complexity so that it aligns with the n um b er of selected representations. Sp ecifically , if a la y er l is redundan t, the affine transformation T l ( x ) = W l x + a l b ecomes unnecessary; that is, the information carried by T l ( x ) is equiv alent to that of x . This implies W l can be replaced b y the iden tit y matrix and a l = 0 , whic h motiv ates the depth p enalt y ρ 31 ( µ ) = P D l =1 ∥ W l − I ∥ + ∥ a l ∥ , where I is the identit y matrix with the same dimensions as W l . A ccordingly , the o v erall net work p enalt y is refined as ρ 3 ( µ ) = ρ 31 ( µ ) + λ 4 ∥ θ ∥ 1 . As a result, four p enalt y parameters need to b e tuned. Conducting a direct grid search o ver all parameters sim ultaneously can b e computationally burdensome. Since v ariable selection is based on the extracted representations and the netw ork complexity also should matc h the n um b er of selected representations, we hence first determine the n umber of representations b y tuning λ 1 . Because we prefer netw orks with shallo w er structures, we then select λ 3 b efore tuning λ 4 . Consequen tly , we adopt a sequential grid search for λ 1 , λ 2 , λ 3 , and λ 4 in a region around zero: (1) select λ 1 with ( λ 2 , λ 3 , λ 4 ) fixed at 0; (2) select λ 2 with λ 1 fixed at its chosen v alue and ( λ 3 , λ 4 ) fixed at 0; (3) select λ 3 with ( λ 1 , λ 2 ) fixed at their chosen v alues and λ 4 = 0 ; and (4) select λ 4 with ( λ 1 , λ 2 , λ 3 ) fixed at their chosen v alues. 18 Algorithm 1: Parame- ter truncation algorithm Input: τ 1 , B Output: B trunc 1 Initialization B trunc ← B ; 2 for i=1:d do 3 if ∥ B trunc [ i, ] ∥ 2 ≤ τ 1 then 4 B trunc [ i, ] ← 0 ; 5 Return B trunc ; Algorithm 2: Minibatch sto c hastic gradient descent training of the prop osed metho d Input: { X i , Y i } n i =1 , λ 1 , λ 2 , λ 3 and λ 4 Output: ˆ θ , ˆ B 1 Initialization θ , B ; 2 for numb er of tr aining iter ations do 3 Sample mini-batch of b samples { X j , Y j } b j =1 from dataset; 4 Compute the loss by ( 2 ); 5 Up date θ and B b y descending its sto c hastic gradient: ∇ θ , B 1 b b X j =1 L ( g θ ( B X j ) , Y j ) + λρ ( µ ) , if trunc ating B and θ then 6 T runcating B and θ according to Algorithm 1 ; 7 Return ˆ θ , ˆ B ; 6 Sim ulation study W e conduct simulation studies to ev aluate the p erformance of the prop osed metho d by comparing it with sev eral state-of-the-art DNN-based approac hes: the v anilla feed-forw ard neural netw ork (DNN), deep representation selection with a selection lay er (DFS; Chen et al. 2021 ), LassoNet ( Lemhadri et al. 2021 ), and the group concav e regularization net work (GCRNet; Luo & Halabi 2023 ). The v anilla DNN do es not p erform v ariable selection, whereas DFS, LassoNet, and GCRNet incorp orate v ariable selection within the DNN framew ork. W e further consider multi-index mo dels with either more, fewer, or the same n umber of indices as the true mo del, where the link function is approximated by a DNN to alleviate the curse of dimensionality . A multi-index mo del with k indices is refered to as index-mo del( k ). When k equals the true n um b er of indices, the corresp onding mo del represen ts the oracle case, denoted as index-mo del( k ∗ ). W e adopt the ReQU activ ation function with p = 2 for our metho d. F or regression problems, mo del p erformance is ev aluated using predictiv e error (PE) and mean square error (MSE) on the testing data, defined as: PE = P n i =1 ( ˆ Y i − Y i ) 2 P n i =1 Y 2 i and MSE = 1 n P n i =1 ( ˆ Y i − f 0 i ) 2 , where ˆ Y i and Y i denote the predicted and observed resp onses, rep ectiv ely , 19 f 0 i is the true regression function ev aluated at the corresp onding cov ariate, and n is the test sample size. F or binary classification, p erformance is assessed using accuracy (A CC) and the area under the ROC curve (AUC): A CC = P n i =1 1 ( ˆ Y i = Y i ) n and A UC = P n + i =1 P n − j =1 1 ( p i >p j ) n + n − , where n + and n − are the num b ers of p ositiv e and negative samples, resp ectiv ely , p i is the predicted probability of the p ositiv e class for the i th sample, and 1 ( · ) is the indicator function. Mo del complexity is quan tified by the extracted represen tation dimension (Dims.) and the prop ortion of zero elements (Prop.0). V ariable selection p erformance is ev aluated using the true p ositiv e rate (TPR) and false p ositiv e rate (FPR), defined as TPR = | ˆ S ∩ S ∗ | | S ∗ | and FPR = | ˆ S ∩ S c | | S c | , where ˆ S represen ts the set of selected v ariables, S ∗ the set of truly imp ortan t v ariables, S c the set of truly unimp ortan t v ariables, and | · | denotes set cardinality . F or eac h metric, w e rep ort the mean and standard deviation (SD) by rep eating the exp erimen t 50 times. W e consider four sim ulation settings in which data are generated from an additive regression mo del (Setting 1), an interactiv e regression mo del (Setting 2), an interactiv e regression mo del induced by a fully connected net w ork (Setting 3), and an in teractive classification mo del (Setting 4). F urther details on the data generation pro cess and exp erimen tal setup are pro vided in Supplementary F.1. 6.1 Prediction and Selection Results The prediction and selection results are summarized in T ables 1 and Supplementary T ables G1, G2 and G3, which show that the prop osed metho d has sup erior p erformance in prediction accuracy , representation dimension selection and v ariable selection across all four settings. Sp ecifically , (1) The estimated dimension of the prop osed metho d is approximately 5 in Settings 1, 2, and 4, and around 10 in Setting 3, closely matching the true dimension. In con trast, except for 20 T able 1: Simulation results for prediction, mo del complexit y and v ariable selection for Setting 1. Predictive error (PE) and mean square error (MSE) are the mo del p erformance metrics. Dimension (Dims.) and prop ortion of zero elements in mo del parameters ˆ θ (Prop.0) are the metrics for mo del complexity . The true p ositiv e rate (TPR) and false p ositiv e rate (FPR) are the metrics for v ariable selection. All metrics are rep orted by the means with standard deviations in parentheses. ρ Methods PE MSE Dims. Prop.0 TPR FPR 0 DNN 0.3559(0.0123) 2.8494(0.0984) 200 0.0392(0.0004) 1 1 Index mo del(1) 0.3242(0.0037) 2.6126(0.0315) 1 0.0396(0.0004) 1 1 Index mo del(5 ∗ ) 0.1665(0.0111) 1.2747(0.0911) 5 0.0390(0.0005) 1 1 Index mo del(10) 0.1921(0.0124) 1.4854(0.1043) 10 0.0388(0.0004) 1 1 DFS 0.3144(0.0517) 2.4939(0.4316) 102.8000(61.4505) 0.6972(0.0295) 0.6770(0.2874) 0.3510(0.3463) LassoNet 0.3578(0.0967) 2.8710(0.8036) 107.2600(28.5950) 0.1766(0.0016) 0.8642(0.0957) 0.2084(0.2004) GCRNet 0.2752(0.0066) 2.1778(0.0568) 131.0500(16.6508) 0.7659(0.0170) 0.9295(0.0343) 0.3810(0.1356) DeepIn (Ours) 0.1557(0.0133) 1.1805(0.1126) 4.3600(0.8890) 0.6586(0.2573) 0.9556(0.0313) 0.0100(0.0100) 0.1 DNN 0.3656(0.0146) 3.7708(0.1567) 200 0.0388(0.0003) 1 1 Index mo del(1) 0.3734(0.0928) 3.8212(1.0132) 1 0.0387(0.0006) 1 1 Index mo del(5 ∗ ) 0.2293(0.0186) 2.2886(0.2050) 5 0.0386(0.0004) 1 1 Index mo del(10) 0.2475(0.0241) 2.4780(0.2593) 10 0.0385(0.0003) 1 1 DFS 0.4071(0.0535) 4.1995(0.5655) 120.4000(54.0355) 0.6781(0.0352) 0.7498(0.2245) 0.4542(0.3351) LassoNet 0.2939(0.0435) 3.0041(0.4833) 154.7800(18.7417) 0.1765(0.0009) 0.9714(0.0462) 0.5764(0.1470) GCRNet 0.4286(0.0168) 4.4476(0.1880) 178.3500(23.6120) 0.6119(0.2470) 0.9610(0.0512) 0.8225(0.1869) DeepIn (Ours) 0.1724(0.0124) 1.6536(0.1328) 5.2800(0.9600) 0.7789(0.1126) 0.9074(0.0207) 0.0902(0.0463) 0.2 DNN 0.5282(0.0120) 6.3029(0.1523) 200 0.0392(0.0003) 1 1 Index mo del(1) 0.4919(0.0221) 5.8272(0.2804) 1 0.0399(0.0004) 1 1 Index mo del(5 ∗ ) 0.3029(0.0179) 3.4996(0.2177) 5 0.0390(0.0003) 1 1 Index mo del(10) 0.3348(0.0197) 3.8919(0.2425) 10 0.0389(0.0003) 1 1 DFS 0.4853(0.0356) 5.7900(0.4460) 111.2000(60.6841) 0.6880(0.0366) 0.7340(0.2700) 0.3780(0.3708) LassoNet 0.5413(0.0706) 6.4769(0.8778) 102.7600(26.6845) 0.1770(0.0005) 0.8244(0.0920) 0.2032(0.1804) GCRNet 0.4571(0.0097) 5.4194(0.1131) 139.5500(13.0402) 0.7676(0.0135) 0.9260(0.0206) 0.4695(0.1145) DeepIn (Ours) 0.2865(0.0146) 3.3098(0.1811) 4.2608(0.7922) 0.8009(0.0002) 0.9590(0.0267) 0.0628(0.1927) m ulti-index mo dels, the other comp eting metho ds do not incorp orate dimension reduction, resulting in estimated dimensions nearly equal to the full num b er of v ariables. On the other hand, the p erformance of the m ulti-index mo del is highly sensitiv e to the c hoice of the n umber of indices; b oth o v er-sp ecification and under-sp ecification can lead to significant p erformance degradation. Remarkably , our metho d is still sup erior to multi-index mo del with the oracle dimension. This is b ecause our metho d not only reduces the dimension but also adaptiv ely adjusts the netw ork structure according to the selected dimension. (2) While DFS and GCRNet exhibit go o d sparsit y , our metho d attains substantially sup erior sparsit y b y jointly leveraging dimension reduction and adaptive netw ork compression. This leads to a higher prop ortion of zero elements, thereby reducing statistical error and enhancing predictiv e accuracy . As sho wn in T able 1 and Supplemen tary T ables G1 - G3 for Settings 1–4, substantial dimension reduction or architectural compression consisten tly yields notable gains in prediction p erformance. 21 (3) Regarding v ariable selection, our metho d ac hiev es the b est p erformance in remo ving noisy v ariables, as evidenced b y its substantially low er FPR compared with DFS, LassoNet, and GCRNet. This effectiv e noise reduction directly contributes to improv ed predictive accuracy across all settings. Moreo v er, although LassoNet and GCRNet attain higher TPR than DFS in iden tifying informativ e v ariables, our metho d consisten tly outp erforms all three comp etitors on this criterion as well. In summary , the results in T able 1 and Supplement ary T ables G1, G2, and G3 highligh t the strong dep endence of predictive error on representation dimensionalit y , v ariable selection, and netw ork arc hitecture. By join tly optimizing these three comp onen ts, our method ac hiev es consistently sup erior p erformance across all four settings. In particular, relative to DNN, multi-index mo dels, DFS, LassoNet, and GCRNet, it ac hieves a v erage reductions in PE of 39.87%, 42.84%, and 88.16%, and in MSE of 42.03%, 46.23%, and 91.24% for regression tasks in Settings 1–3, resp ectiv ely . F or the classification task in Setting 4, it impro v es A CC and A UC b y 14.82% and 11.45% on av erage. 6.2 Hyp othesis test W e first ev aluate the p erformance of statistical inference for individual cov ariates. F ollowing v ariable selection, w e compute the statistics { U [ j ] } ˆ s j =1 500 times b y b ootstrap and Figure 1 rep orts the test p o wer for the selected informative v ariables and the empirical size for the selected noisy v ariables under Settings 1-4 with ρ = 0 . 2 at the significance level α = 0 . 05 . The p o wer for detecting informativ e v ariables consisten tly approaches 1 across all settings, confirming the metho d’s high sensitivity to true effects. Mean while, the size for most noisy v ariables remains close to 0.05, demonstrating effectiv e control of false p ositiv es and reflecting the consistency of the test. T ogether, these results v alidate the prop osed h yp othesis test in accurately distinguishing informative v ariables from noise. Similar results 22 for Settings 1-4 under correlation lev els ρ = 0 , 0 . 1 are rep orted in Supplementary G.2. (a) Setting 1 ( ρ = 0 . 2 ) (b) Setting 2 ( ρ = 0 . 2 ) (c) Setting 3 ( ρ = 0 . 2 ) (d) Setting 4 ( ρ = 0 . 2 ) Figure 1: T est p o wer for informative v ariables and empirical size for noisy v ariables in Settings 1–4 under correlation levels ρ = 0 . 2 . Next, we ev aluate the p erformance of statistical inference for representations, whic h are com binations of co v ariates. W e first v erify whether the prop osed statistic follo ws a normal distribution under the null hypothesis, as established in Theorem 5 . Let I = { 1 , . . . , ˆ d } and compute the statistic T n / ˆ ς 2 1000 times under Setting 3 with ρ = 0 . 2 . Figure 2 (a) sho ws that the empirical distribution of the statistic aligns closely with the standard normal distribution. Moreo ver, the empirical size of the test at the α = 0 . 05 significance level is 0.031, close to the nominal lev el. W e test the significance of each learned represen tation. F or each represen tation j ∈ { 1 , . . . , ˆ d } with ˆ d = 10 , we define I = { 1 , . . . , j − 1 , j + 1 , . . . , ˆ d } and I c = j . The resulting p o wer under Setting 3 with ρ = 0 . 2 , based on 1000 replicates of 4000 samples, is shown by the blue bars in Figure 2 (b). A t the α = 0 . 05 lev el, the p o wer exceeds 0.9 for the first eight representations, 23 (a) (b) (c) Figure 2: The distribution under H 0 and the p o wer of different representations with their singular v alue in Setting 3 ( ρ = 0 . 2 ): (a) The distribution under H 0 ; (b) The p o wer of representations; (c) The singular v alue of representations. drops to ab out 0.1 for the nin th and ten th. Figure 2 (c) presents the corresp onding normalized singular v alues (blue bars). The low p o wer of the last tw o represen tations is consistent with their small singular v alues, which is expected since remo ving represen tations with negligible singular v alues has little effect on the resulting function. Increasing the sample size enhances their signals: as sho wn b y the orange bars in Figures 2 (b) and 2 (c), raising the sample size to 10000 substantially improv es b oth the p o wer and singular v alues of these represen tations. Similar results on the empirical distribution and the p o w er of the statistic under other settings are rep orted in Supplementary G.2. 7 Real data example In this section, we ev aluate the p erformance of the prop osed metho d on four real datasets: ADNI, BlogF eedback, MNIST, and F ashionMNIST. During implemen tation, w e adopt the same net work architecture across all metho ds in each dataset. F or the prop osed metho d, the h yp er-parameters λ are tuned by the pro cedure describ ed in Section 5 and are selected b y minimizing MSE or A CC on the v alidation set. The detailed settings of all h yp er-parameters are pro vided in Supplementary F.2. F or eac h metric, w e rep ort the mean and standard deviation (SD) by rep eating the exp erimen t 10 times. 24 7.1 ADNI dataset Alzheimer’s disease (AD) is a prev alent and irreversible neuro degenerativ e disorder in the elderly , characterized by progressive deficits in memory , cognition, language, and reasoning. The Alzheimer’s Disease Neuroimaging Initiativ e (ADNI) is a longitudinal, multicen ter study designed to develop and v alidate biomarkers for the early diagnosis and progression monitoring of AD. F ollowing standard qualit y control pro cedures, our analysis includes 295 samples from ADNI-GO and ADNI2, t wo phases of the ADNI study . ADNI-GO (2010–2011) fo cused on early mild cognitive impairmen t and am yloid PET imaging, whereas ADNI2 (2011–2016) expanded the cohort and incorp orated tau PET imaging to enable more comprehensiv e biomarker ev aluation. Our goal is to assess whether genetic factors can predict the progression of mild cognitive impairment and early-stage AD. After remo ving transcripts that could not b e annotated, we retained 48,157 gene expression profiles from an initial set of 49,293 transcripts. The Mini-Mental State Examination (MMSE), ranging from 0 to 30, serv es as the resp onse v ariable, with low er scores indicating greater cognitive impairmen t. F ollowing Chen et al. ( 2021 ), w e further applied marginal representation screening to reduce the num b er of genes to 192. The top blo c k of T able 2 summarizes the comparative results of the sev en methods for ADNI study . The prop osed metho d outp erforms all comp etitors in prediction accuracy , as indicated by lo wer PE and MSE, and attains these gains using substan tially few er represen tations and v ariables. Notably , the multi-index mo del with an appropriate num b er of indices still underp erforms the DNN. This is likely b ecause the limited sample size in the ADNI study is insufficient to learn the multi-index mo del. In contrast, our metho d in tegrates dimensionality learning, v ariable selection, and adaptive netw ork compression, whic h together substantially reduce the total n um b er of parameters and consequen tly the statistical error, while con trolling the appro ximation error, thereby ac hieving sup erior PE 25 and MSE p erformance ev en with a small sample size. W e selected 64 genes based on the intersection of repeated exp erimen ts, with their cor- resp onding p-v alues rep orted in T able 3 . Notably , sev eral of these genes are known to p oten tially ha v e an impact on AD pathogenesis. F or example, mutations in GBA impair lysosomal function, reducing the clearance of α -syn uclein and β -am yloid aggregates, thereb y p ossible promoting neurotoxicit y and accelerating AD progression ( Hüttenrauch et al. 2018 , Mata et al. 2016 ). EIF2AK3 (PERK) mediates the unfolded protein resp onse during endo- plasmic reticulum stress, leading to sustained eIF2 α phosphorylation that suppresses protein translation while increasing BA CE1 expression, thereby promoting β -am yloid pro duction and tau pathology ( W ong et al. 2019 ). Other genes, including ARSA, SCN1B, STIM1, and ALDO A, ma y influence AD through pathw ays suc h as my elination, neuronal excitability , and metab olic dysfunction ( Makarious et al. 2019 , Williams et al. 2024 , Tinsley et al. 2024 ). These genes are highligh ted in T able 3 , with all showing statistically significant asso ciations ( p < 0 . 05 ), pro viding strong evidence for their inv olvemen t in AD pathogenesis. T able 2: V ariable selection and prediction p erformance for the ADNI and BlogF eedback datasets. “#V ariables" indicates the n umber of selected v ariables. All metrics are rep orted b y the means with standard deviations in parentheses. Dataset Methods PE MSE Dims. #V ariables Prop.0 ADNI DNN 0.4314(0.1102) 5.5006(1.4050) 192 192 0.0390(0.0009) Index mo del(10) 0.7793(0.1749) 9.9376(2.2303) 10 192 0.0407(0.0023) Index mo del(100) 0.5390(0.1006) 6.8727(1.2824) 100 192 0.0341(0.0004) Index mo del(150) 0.5580(0.0832) 7.1163(1.0608) 150 192 0.0297(0.0008) DFS 0.8108(0.0586) 10.3398(0.7477) 170.6667(12.2701) 170.6667(12.2701) 0.4461(0.0350) LassoNet 0.6099(0.1651) 7.7778(2.1055) 163.4444(32.7960) 163.4444(32.7960) 0.1719(0.0733) GCRNet 0.4456(0.0552) 5.6829(0.7041) 192 192 0.3711(0.1384) DeepIn (Ours) 0.4164(0.0588) 5.3105(0.7495) 137.6000(46.1589) 138.7000(44.4906) 0.1045(0.0222) Blog DNN 0.4239(0.0107) 0.5368(0.0135) 280 280 0.0386(0.0011) Index mo del(10) 0.4009(0.0025) 0.5077(0.0031) 10 280 0.0386(0.0004) Index mo del(100) 0.4150(0.0070) 0.5255(0.0089) 100 280 0.0376(0.0011) Index mo del(150) 0.4171(0.0075) 0.5282(0.0095) 150 280 0.0375(0.0007) DFS 0.5652(0.0236) 0.7157(0.0299) 137.2000(86.2564) 137.2000(86.2564) 0.4738(0.0133) LassoNet 0.4924(0.0232) 0.6236(0.0293) 32.6000(10.7350) 32.6000(10.7350) 0.2259(0.0009) GCRNet 0.4615(0.0046) 0.5845(0.0058) 180.1000(84.8121) 180.1000(84.8121) 0.5002(0.1035) DeepIn (Ours) 0.3633(0.0039) 0.4601(0.0050) 11.0000(1.7889) 30.8000(4.0939) 0.7359(0.0189) 26 T able 3: The selected genes and their p-v alues for ADNI analysis. Gene p-v alue Gene p-v alue Gene p-v alue Gene p-value Gene p-v alue Gene p-v alue RAB3D 0.0000 NOP14 0.0000 TBX5 0.0000 KMT2C 0.087 XPO1 1.0000 RAB1B 0.5291 STIM1 0.0000 LANCL1 0.0043 CLPTM1 0.0000 FMO1 0.0029 ARSA 0.0000 DCAF8 0.0000 MICU1 0.3492 MTSS1 0.9971 MAPKAP1 0.0000 MAOB 0.0245 TSC22D4 0.0000 LOC ∥ RAB a 0.0000 TBPL1 0.0000 DIO2 0.0384 EIF2AK3 0.0000 GBA 0.0048 CHAC1 0.0000 AKAP11 0.4741 PRR13 0.0000 BT AF1 1.0000 SCN1B 0.0000 NAPEPLD 0.0000 A TP6AP1 0.0000 CLCN1 0.0000 TMEM127 0.0021 IFT74 0.0058 HAPLN2 0.0000 A CADM 0.0003 PLCH1 0.0000 EPS15L1 0.5907 PPP5C 0.0563 TMED2 0.0012 F ANCF 0.0018 ALAS1 0.9997 A TG13 0.0000 F AM160A1 0.0000 LIG3 0.0000 TMEM110 0.0000 PDLIM7 0.0682 TIRAP 0.0029 NRL 0.0029 FOXD2 0.0000 ARNT 0.4124 OR1C1 0.0000 FLOT1 0.0000 C15ORF48 0.0000 CEP57 0.0000 F AM69A 0.0316 TBCD 0.0000 TRABD 0.0000 AIDA 0.0146 NKRF 0.5566 MYT1L 0.0000 LILRB3 1.0000 RDM1 0.0000 SLC39A1 0.0000 P ACSIN2 0.0000 ALDOA 0.0000 a This is the abbreviation of gene LOC101929253 ∥ RAB40C. 7.2 BlogF eedbac k dataset The BlogF eedback dataset, obtained from the UCI Machine Learning Rep ository , con tains feature representations derived from blog p osts for predicting the num b er of commen ts each p ost receives. The resp onse v ariable records the num b er of comments generated within 24 hours after publication. The dataset includes 280 features (detailed in Supplementary F.3) and 52,397 samples in total. As sho wn in the b ottom blo c k of T able 2 , our metho d outp erforms all comp eting approaches. In particular, it achiev es the highest prediction accuracy while using the few est dimensions and v ariables as well as the sparsest netw ork, again highligh ting its capacity to unco ver a lo w-dimensional laten t space based on the selected appropriate v ariables and netw ork. T o assess the stabilit y of v ariable selection, w e compare the frequencies of the top-selected v ariables across 10 rep eated exp erimen ts. Supplemen tary T able G4 rep orts the 20 most frequen tly selected v ariables and their frequencies. Our metho d shows highest consistency in v ariable selection across rep etitions. In addition, w e test the significance of the learned 27 represen tations according to Theorem 5 . As sho wn in Supplemen tary Figure G4, the empirical p o w er based on 100 replicates is close to 1 for each represen tation, indicating that all learned representations play an imp ortan t role in predicting the resp onse. 7.3 MNIST and F ashionMNIST dataset Both the MNIST and F ashionMNIST datasets are 10-class classification problems. The MNIST dataset consists of grayscale images of handwritten digits (0–9). Each image is represen ted as a 28 × 28 pixel matrix, with pixel intensities normalized to v alues b et w een 0 and 1. The F ashionMNIST dataset, a more c hallenging alternative to MNIST, includes gra yscale images representing ten distinct clothing and accessory classes, suc h as T-shirts, dresses, sho es, and bags. Both the MNIST and F ashionMNIST training datasets contain 60,000 images while the testing datasets contain 10,000 images. W e split the training dataset in to 55,000 and 5,000 for training and v alidating sets. T o satisfy the input requirement of the framework of DNNs, w e flatten eac h 28 × 28 image pixel matrix into 784-dimensional vector. Since GCRNet is designed for binary classification and the multi-index mo del mainly for regression, we compare our metho d with v anilla DNN, DFS and LassoNet. T able 4: The v ariable selection and prediction p erformance of MNIST and F ashion MNIST dataset. “#V ariables" means the num b er of selected v ariables. All metrics are rep orted by the means with standard deviations in parentheses. Dataset Methods Acc. Dims. #V ariables Prop.0 MNIST DNN 0.9583(0.0045) 784 784 0.0360(0.0003) DFS 0.9526(0.0101) 430.8000(169.0330) 430.8000(169.0330) 0.5550(0.0226) LassoNet 0.9508(0.0092) 413.2000(171.1723) 413.2000(171.1723) 0.2818(0.1219) DeepIn (Ours) 0.9730(0.0011) 331.6000(62.6086) 457.4000(3.7736) 0.5916(0.0092) F ashionMNIST DNN 0.8874(0.0032) 784 784 0.0329(0.0007) DFS 0.8786(0.0071) 470.0000(240.4483) 470.0000(240.4483) 0.5022(0.0411) LassoNet 0.8408(0.0168) 540.7000(128.7929) 540.7000(128.7929) 0.2358(0.0904) DeepIn (Ours) 0.8920(0.0016) 460.6000(85.2282) 716.4000(4.5431) 0.3172(0.1360) As sho wn in T able 4 , our metho d achiev es the highest prediction accuracy while using the few est representations. Notably , b oth DFS and LassoNet p erform worse than a v anilla DNN. 28 This may b e b ecause DFS and LassoNet rely heavily on sparsit y assumptions. F or image data, ho wev er, individual pixels carry little information, and meaningful features typically arise from combinations of pixels (e.g., lines, shapes, textures). Under a strict sparsity assumption, such com bined effects tend to b e ignored, leading to sub optimal p erformance. In con trast, our metho d explicitly captures these joint effects through the matrix B . Although this results in selecting more v ariables, the learned represen tations are more informativ e, yielding sup erior predictiv e accuracy . T o further assess our method’s v ariable selection capabilit y , we use tw o binary subsets: digits 5 and 6 from MNIST, and T-shirts and sneakers from F ashionMNIST. Figure 3 illustrates v ariable selection results for digits 5 and 6. The first column presen ts the av erage images of these digits from the training set, while the second and third columns displa y the discriminativ e pixels iden tified by our metho d for distinguishing digits 5 and 6, resp ectiv ely . A dditional details regarding the implemen tation are pro vided in Supplemen tary F.4. F rom Figure 3 , w e observe that, for digit 5, the mo del primarily fo cuses on the head region at the upp er right, the neck area immediately ab o ve, and the horizontal stroke at the b ottom. All of these areas are blank regions in digit 6. Con v ersely , the classification of digit 6 relies on the connected region in the lo w er-left quadran t and the righ t-side curve, b oth of which are inactiv e in digit 5. This discriminativ e capabilit y is also evident in F ashionMNIST, as shown in Figure 4 . F or T-shirt iden tification, our metho d fo cuses on the sleev e and collar regions, which are absent in sneaker images. In contrast, sneaker classification emphasizes the heel region, whic h is inactiv e in T-shirt images. These m utually exclusiv e activ ation patterns across b oth datasets consistently demonstrate the effectiveness of our metho d in identifying class-sp ecific discriminativ e represen tations for image classification. 29 Figure 3: First column: The digit 5 and 6. Sec- ond column: Imp ortan t pixels for predicting digit 5. Last column: Imp ortan t pixels for predicting digit 6. Figure 4: First column: The image T-shirt and sneak er. Second column: Imp ortan t pixels for predicting T-shirt. Last column: Imp ortan t pixels for predicting sneaker. 8 Conclusion In this study , we introduce a nov el neural net w ork framew ork, DeepIn, for high-dimensional learning. The key inno v ation is the incorp oration of a matrix B in to v anilla DNNs. By imp osing group p enalties on the columns and rows of B , the framew ork sim ultaneously p erforms dimension reduction, representation learning, and v ariable selection. In addition, a tailored arc hitecture p enalt y compresses the netw ork according to the learned represen tation dimension, reducing statistical error and enhancing predictiv e p erformance. Rigorous theo- retical analysis establishes the consistency of DeepIn in terms of represen tation dimension, v ariable selection, and net work architecture. W e further derive optimal non-asymptotic error b ounds for the DeepIn estimator of order ˆ d β ∨ (1+ ⌊ β ⌋ ) ( n/ log c n ) − 2 β / ( ˆ d +2 β ) , where ˆ d is the n um b er of learned represen tations. This result highligh ts the critical imp ortance of selecting lo w-dimensional represen tations. Based on this selection consistency , we also dev elop a nov el h yp othesis testing pro cedure to ev aluate the significance of selected v ariables and learned represen tations. Extensiv e n umerical exp erimen ts on four b enc hmark datasets demonstrate the sup erior performance of DeepIn in dimension reduction, v ariable selection, net w ork iden tification, and statistical inference, resulting in substantial gains in b oth predictive accu- racy and interpretabilit y . Notably , the metho d automatically unco v ers human-in terpretable 30 discriminativ e patterns, such as characteristic strokes in digit recognition or garment-specific regions in fashion item classification. A v aluable extension of our metho d is domain-sp ecific v ariable selection, suc h as group-level selection, which is particularly imp ortan t in fields like biomedicine and so cial sciences, where prior kno wledge often defines meaningful v ariable sets ( Huang et al. 2012 , Buch et al. 2023 ). A natural wa y to incorp orate such knowledge is by grouping v ariables and applying p enalties to these groups of columns rather than to individual columns. Our framew ork can seamlessly accommo date suc h scenarios to ac hieve group-lev el v ariable selection. A dditionally , incorp orating a simple sparsit y-inducing p enalt y on eac h elemen t of B could further reduce the num b er of parameters in ultra-high-dimensional settings and help iden tify the meaning of each learned represen tation. Data a v ailabilit y The datasets used in this study are publicly accessible. Sp ecifically , ADNI dataset can b e found in h ttp://ww w.adni- info.org / , the BlogF eedback dataset can b e obtained from the UCI Machine Learning Rep ository at http s:// archiv e.ics .uci .edu/ , and MNIST and F ashionMNIST datasets can b e directly do wnloaded from PyT orch. A c kno wledgemen ts The researc h w as supp orted by National Key R&D Program of China (No.2022YF A1003702), National Natural Science F oundation of China (Nos.12426309, 12171374, 12371275), Sic huan Science and T echnology Program, China (Gran t No. 2025JDDJ0007), Op ening Pro ject F und of National F acilit y for T ranslational Medicine (Shanghai), New Cornerstone Science F oundation, and Guanghua T alent Pro ject of SWUFE. 31 References Belkin, M. & Niyogi, P . (2004), ‘Semi-sup ervised learning on riemannian manifolds’, Me chine L e aring 56 , 209–239. Bottou, L. (2010), Large-scale mac hine learning with sto c hastic gradient descen t, in ‘Pro- ceedings of COMPST A T’2010: 19th International Conference on Computational Statis- ticsP aris F rance, A ugust 22-27, 2010 Keynote, Invited and Con tributed P ap ers’, Springer, pp. 177–186. Bo yd, S., Boyd, S. P . & V andenberghe, L. (2004), Convex optimization , Cambridge univ ersity press. Buc h, G., Sc hulz, A., Schmidtmann, I., Strauc h, K. & Wild, P . S. (2023), ‘A systematic review and ev aluation of statistical metho ds for group v ariable selection’, Statistics in Me dicine 42 (3), 331–352. Chen, Y., Gao, Q., Liang, F. & W ang, X. (2021), ‘Nonlinear v ariable selection via deep neural net w orks’, Journal of Computational and Gr aphic al Statistics 30 (2), 484–492. F arrell, M. H., Liang, T. & Misra, S. (2021), ‘Deep neural net works for estimation and inference’, Ec onometric a 89 (1), 181–213. F efferman, C., Mitter, S. & Nara yanan, H. (2016), ‘T esting the manifold hypothesis’, Journal of the A meric an statistic al asso ciation 29 , 983–1049. Ghorbani, A., Abid, A. & Zou, J. (2019), Interpretation of neural netw orks is fragile, in ‘Pro ceedings of the AAAI Conference on Artificial In telligence’, V ol. 33, Asso ciation for the A dv ancemen t of Artificial Intelligence (AAAI), pp. 3681–3688. Huang, J., Breheny , P . & Ma, S. (2012), ‘A selectiv e review of group selection in high- 32 dimensional mo dels’, Statistic al scienc e: a r eview journal of the Institute of Mathematic al Statistics 27 (4), 10–1214. Hubbard, J. & Hubbard, B. (2015), V e ctor Calculus, Line ar Algebr a, and Differ ential F orms: a Unifie d Appr o ach , Matrix Editions. Hüttenrauc h, M., Ogorek, I., Klafki, H., Otto, M., Stadelmann, C., W eggen, S., Wiltfang, J. & Wirths, O. (2018), ‘Glycoprotein nm b: a nov el alzheimer’s disease asso ciated mark er expressed in a subset of activ ated microglia’, A cta neur op atholo gic a c ommunic ations 6 , 1–14. Jain, S. & W allace, B. C. (2019), Atten tion is not explanation, in ‘Pro ceedings of the 2019 Conference of the North American Chapter of the Asso ciation for Computational Linguistics: Human Language T ec hnologies, V olume 1 (Long and Short Papers)’, pp. 3543– 3556. Ji, Y., Sun, Y., Zhang, Y., W ang, Z., Zhuang, Y., Gong, Z., Shen, D., Qin, C., Zhu, H. & Xiong, H. (2025), ‘A comprehensive survey on self-in terpretable neural net w orks’, arXiv pr eprint arXiv:2501.15638 . Jiao, Y., Shen, G., Lin, Y. & Huang, J. (2023), ‘Deep nonparametric regression on approxi- mate manifolds: Nonasymptotic error b ounds with p olynomial prefactors’, The A nnals of Statistics 51 (2), 691–716. K oh, P . W., Nguy en, T., T ang, Y. S., Mussmann, S., Pierson, E., Kim, B. & Liang, P . (2020), Concept b ottlenec k mo dels, in ‘Pro ceedings of the 37th In ternational Conference on Mac hine Learning’, pp. 5338–5348. Lemhadri, I., R uan, F., Abraham, L. & Tibshirani, R. (2021), ‘Lassonet: A neural net work with feature sparsity’, Journal of Machine L e arning R ese ar ch 22 (127), 1–29. Li, O., Liu, H., Chen, C. & Rudin, C. (2018), Deep learning for case-based reasoning through 33 protot yp es: a neural net work that explains its predictions, in ‘Pro ceedings of the AAAI Conference on Artificial Intelligence’, pp. 3530–3537. Li, Y., Chen, C.-Y. & W asserman, W. W. (2016), ‘Deep feature selection: theory and application to iden tify enhancers and promoters’, Journal of Computational Biolo gy 23 (5), 322–336. Liu, Z., W ang, Y., V aidya, S., Ruehle, F., Halverson, J., Soljačić, M., Hou, T. Y. & T egmark, M. (2024), ‘Kan: Kolmogoro v-arnold net w orks’, arXiv pr eprint arXiv:2404.19756 . Lu, Y., F an, Y., Lv, J. & Stafford Noble, W. (2018), ‘Deeppink: repro ducible feature selection in deep neural net w orks’, A dvanc es in Neur al Information Pr o c essing Systems 31 . Lundb erg, S. M. & Lee, S.-I. (2017), A unified approac h to in terpreting mo del predictions, in ‘Pro ceedings of the 31st International Conference on Neural Information Pro cessing Systems’, pp. 4768–4777. Luo, B. & Halabi, S. (2023), ‘Sparse-input neural netw ork using group conca ve regularization’, arXiv pr eprint arXiv:2307.00344 . Makarious, M. B., Diez-F airen, M., Krohn, L., Blau w endraat, C., Bandres-Ciga, S., Ding, J., Pihlstrøm, L., Houlden, H., Sc holz, S. W. & Gan-Or, Z. (2019), ‘Arsa v ariants in α -syn ucleinopathies’, Br ain 142 (12), e70–e70. Mata, I. F., Leverenz, J. B., W eintraub, D., T ro jano wski, J. Q., Chen-Plotkin, A., V an Deer- lin, V. M., Ritz, B., Rausch, R., F actor, S. A., W o od-Siverio, C. et al. (2016), ‘Gba v ariants are asso ciated with a distinct pattern of cognitiv e deficits in p arkinson’s disease’, Movement Disor ders 31 (1), 95–102. Rib eiro, M. T., Singh, S. & Guestrin, C. (2016), " why should i trust y ou?" explaining the 34 predictions of any classifier, in ‘Pro ceedings of the 22nd ACM SIGKDD In ternational Conference on Knowledge Discov ery and Data Mining’, pp. 1135–1144. R udin, C. (2019), ‘Stop explaining blac k b o x machine learning mo dels for high stakes decisions and use in terpretable mo dels instead’, Natur e Machine Intel ligenc e 1 (5), 206– 215. Tinsley , E., Bredin, P ., T o omey , S., Hennessy , B. T. & F urney , S. J. (2024), ‘Km t2c and km t2d ab errations in breast cancer’, T r ends in Canc er . V aswani, A., Shazeer, N., Parmar, N., Uszkoreit, J., Jones, L., Gomez, A. N., Kaiser, Ł. & Polosukhin, I. (2017), ‘A ttention is all you need’, A dvanc es in neur al information pr o c essing systems 30 . W ang, T., Huang, J. & Ma, S. (2024), ‘P enalized generativ e v ariable selection’, arXiv pr eprint arXiv:2402.16661 . Williams, Z. J., Alv arez-Laviada, A., Hoagland, D., Jourdan, L. J., P o elzing, S., Gorelik, J. & Gourdie, R. G. (2024), ‘Developmen t and characterization of the mo de-of-action of inhibitory and agonist p eptides targeting the voltage-gated sodium c hannel scn1b b eta-subunit’, Journal of Mole cular and Cel lular Car diolo gy 194 , 32–45. W ong, T. H., v an der Lee, S. J., v an Ro oij, J. G., Meeter, L. H., F ric k, P ., Melhem, S., Seelaar, H., Ikram, M. A., Rozem uller, A. J., Holstege, H. et al. (2019), ‘Eif2ak3 v ariants in dutc h patien ts with alzheimer’s disease’, Neur obiolo gy of aging 73 , 229–e11. Y uan, M. (2011), ‘On the indentifiabilit y of additive index mo dels’, Statistic a Sinic a 21 , 1901– 1911. Y uksekgonul, M., W ang, M. & Zou, J. (2022), ‘Post-hoc concept b ottlenec k mo dels’, arXiv pr eprint arXiv:2205.15480 . 35
Original Paper
Loading high-quality paper...
Comments & Academic Discussion
Loading comments...
Leave a Comment