Array Layout Optimization in a 24-Element 38-GHz Active Incoherent Millimeter-Wave Imaging System
Active incoherent millimeter-wave (AIM) imaging is a recently developed technique that has been shown to generate fast millimeter-wave imaging using sparse apertures and Fourier domain sampling. In these systems, spatial frequency sampling is determi…
Authors: Jorge R. Colon-Berrios, Derek Luzano, Daniel Chen
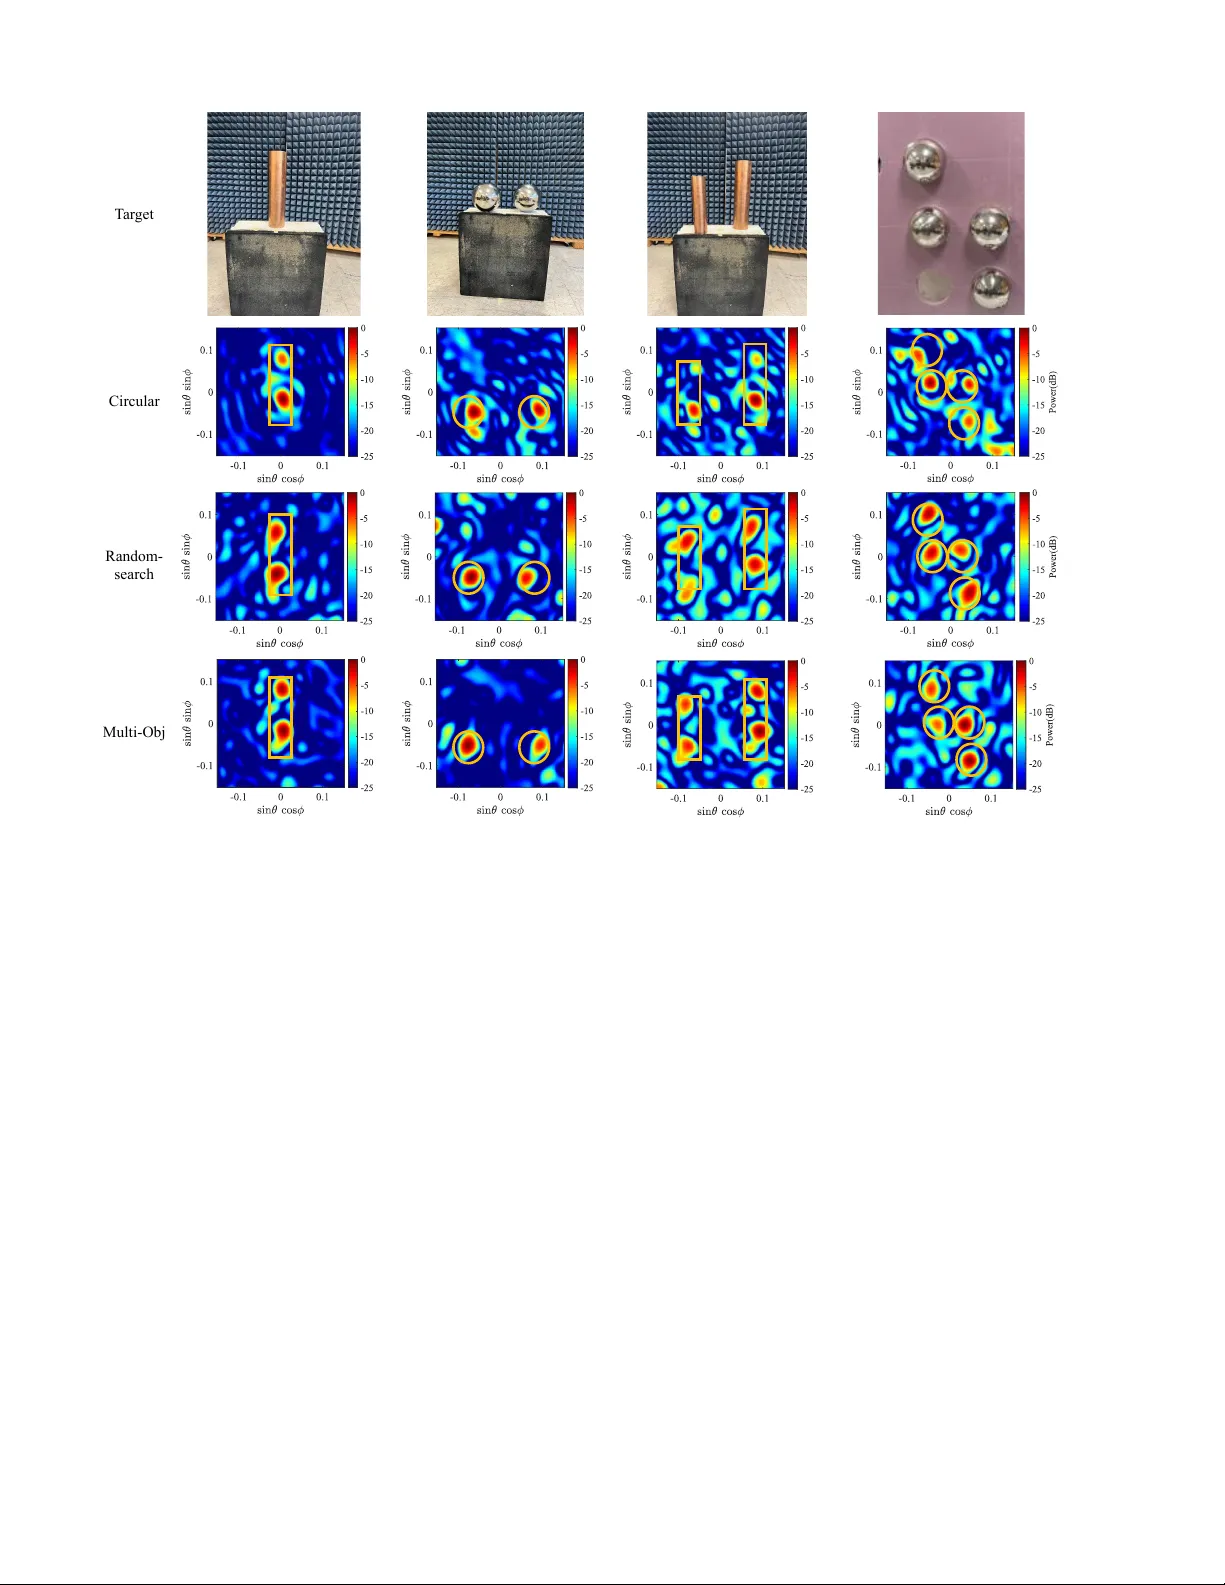
1 Array Layout Optimization in a 24-Element 38-GHz Acti v e Incoherent Millimeter -W a ve Imaging System Jorge R. Colon-Berrios, Graduate Student Member , IEEE , Derek Luzano, Graduate Student Member , IEEE , Daniel Chen, and Jeffrey A. Nanzer , Senior Member , IEEE Abstract —Active incoherent millimeter -wa ve (AIM) imaging is a recently developed technique that has been shown to generate fast millimeter-wa ve imaging using sparse apertures and Fourier domain sampling. In these systems, spatial frequency sampling is determined by cross-corr elation between antenna pairs, making array geometry an important aspect that dictates the field of view (FO V) and image quality . This work investigates the impact of array redundancy and spatial sampling diversity on AIM image reconstruction performance. W e present a comparative study of three receiv e array configurations, including one simple circular design and two arrays obtained through optimization strategies designed to maximize unique spatial samples while preser ving system resolution and FO V . Performance is evaluated using the image-domain metrics of structural similarity index (SSIM) and peak sidelobe level (PSL), enabling a quantitati ve assessment of r econstruction fidelity and artifact suppr ession. W e perform experimental validation using a 38-GHz AIM imaging system, implementing a 24-element recei ve array within a 48-position reconfigurable aperture. Results demonstrate that optimized array configurations impro ve spatial sampling efficiency and yield measurable gains in reconstruction quality compared to a con ventional circular array , highlighting the importance of array design for AIM imaging systems. Index T erms —Interfer ometric imaging, Antenna Array , Opti- mization, millimeter-wa ve imaging. I . I N T R O D U C T I O N Millimeter-w av e imaging has emerged as a promising sens- ing modality for applications ranging from security screen- ing [1] and remote monitoring [2] to autonomous perception and smart en vironments [3], driven by its ability to provide non-contact scene characterization under div erse operating conditions. As imaging systems ev olve tow ard wider deploy- ment and commercial pre valence, fundamental challenges arise in achie ving high-quality reconstruction while maintaining constraints on hardware complexity , calibration burden, and system scalability . Across array-based imaging architectures, these challenges are fundamentally linked to the ef ficiency with which spatial information describing a scene is sampled, as incomplete or redundant spatial frequenc y measurements can directly degrade reconstruction fidelity and limit achie v- able resolution. Although dynamic measurement strategies can provide additional scene information [4], array geometry and measurement div ersity [5]–[8] remain central design consider- ations in millimeter-w ave imaging systems. This has moti vated the de velopment of approaches to maximize spatial sampling efficienc y while av oiding increases in hardware complexity or resource requirements. Activ e incoherent millimeter-w av e (AIM) imaging is an approach for reducing hardware complexity while preserving the ability to reconstruct spatial information through array- based sensing. By employing noise transmissions and inter- ferometric processing, AIM systems form images through the cross-correlation of signals receiv ed across antenna pairs, enabling scene reconstruction without the need for fully coherent channel architectures [9], [10]. In this framework, each antenna pair contributes a measurement of the scene spatial frequency content, making the distribution of antenna baselines an important parameter for reconstruction quality . As a result, the geometry of the recei ve array directly determines the div ersity and quantity of spatial frequency samples, and thus the array design is a critical factor impacting image resolution, field of vie w , and artifact behavior in AIM imaging systems. Although interferometric imaging benefits from the av ail- ability of multiple antenna pairs [11], the resulting set of measurements often e xhibits significant redundanc y due to repeated baseline separations inherent to structured array ge- ometries. Such redundancy leads to duplicated spatial fre- quency samples that, while potentially improving measure- ment robustness, does not increase the div ersity of spatial information available for reconstruction. Imaging performance becomes constrained not only by the number of antenna elements but also by the distribution of unique baselines spanning the effecti ve aperture. Insufficient spatial sampling div ersity can manifest in the image as elev ated sidelobe levels and image artifacts, and degrading the image quality . These observations highlight a fundamental design tradeof f between measurement redundanc y and spatial frequency coverage [12], [13], motiv ating array design methodologies that explicitly consider spatial sampling efficienc y as a primary optimization objectiv e. Interferometric imaging is based on the van Cittert–Zernike theorem, which establishes that the cross-correlation of spatio- temporally incoherent signals recei ved by antenna pairs pro- vide samples of the scene visibility function in the spatial fre- quency domain. The distrib ution of antenna baselines defines the specific sampling of this F ourier space and directly impacts reconstruction performance. Antenna array optimization has been widely inv estigated across electromagnetic sensing ap- plications [14]–[16], with prior efforts focusing on objecti ves such as sidelobe reduction [17], [18], aperture gain improv e- ment [19], bandwidth enhancement, and multi-objecti ve design strategies [20] [21]. These studies show the importance of array design optimization for improving the quality of images. This presents an opportunity for array design methodologies that treat spatial sampling efficienc y in AIM imaging sys- 2 tems where sample div ersity strongly influences reconstruction quality . In this work, we in vestigate the impact of spatial sampling div ersity on AIM imaging through the design and e v aluation of optimized recei ve array configurations. W e consider three 24-element array geometries based on a defined grid of 48 possible element locations: one simple circular layout, and two layouts obtained via optimization strategies aimed at max- imizing the number of unique spatial frequency samples while preserving system resolution and field of view . The resulting arrays are analyzed in terms of baseline redundancy , spatial frequency coverage, and image reconstruction performance. Quantitativ e e valuation is performed using structural similarity index (SSIM) and peak sidelobe le vel (PSL) as metrics to characterize reconstruction fidelity and artifact beha vior . Ex- perimental validation using a 38-GHz AIM imaging platform implementing a 24-element reconfigurable recei ve array within a 48-position aperture is performed. The presented study demonstrates that constrained optimization of the array layout improv es spatial sampling efficienc y and leads to measurable gains in AIM imaging performance. I I . A I M I M AG I N G AIM imaging relies on interferometric processing to recon- struct the recei ved signals. In this approach, information is captured in the spatial frequency (Fourier) domain using an antenna array , and signals from each pair of antennas are cross- correlated. According to the V an Cittert–Zernike theorem, widely used in radio astronomy , if the signals arriving at a pair of antennas are spatio-temporally incoherent, their cross- correlation provides a sample of the scene visibility function, giv en by V ( u, v ) = E i ( t ) E ∗ j ( t ) (1) E i ( t ) E ∗ j ( t ) represents the correlation of the electric fields receiv ed at antennas i and j , located at ( x i , y i ) and ( x j , y j ) , respectiv ely . Each antenna pair contributes visibility samples at coordinates ( u, v ) = (( x i − x j ) /λ, ( y i − y j ) /λ ) in the Fourier domain, where λ is the wav elength. Due to the two-dimensional (2D) nature of the array , each pair provides multiple measurements: one along the baseline, its conjugate along the rev erse baseline, and the DC component corre- sponding to autocorrelation of elements. These measurements together populate the visibility plane and determine the spatial frequency information av ailable for reconstruction. The goal is to reconstruct the intensity distribution I ( α , β ) of the scene, where α = sin θ cos ϕ and β = sin θ sin ϕ are the 2D direction cosines. The Fourier transform of this intensity yields the visibility function, which contains all the spatial frequencies necessary for perfect reconstruction. Ho we ver , the number of spatial frequency samples that can be collected is limited by the number of antenna pairs (or baselines) in the array . Cross- correlating each pair forms a sampling function giv en by S ( u, v ) = M X m N X n δ ( u − u n ) δ ( v − v m ) (2) where N × M represents the total number of possible samples. Antenna pairs that are farther apart capture higher spatial fre- quencies, while closer pairs capture lo wer spatial frequencies. Because the sampling function is defined on a λ -scaled grid, two antenna pairs with the same separation and orientation produce the same visibility sample, which we refer to as a redundant sample. The sampled visibility acquired by the imaging system is giv en by V s = S × V (3) The reconstructed scene intensity can then be obtained via an in verse F ourier transform I r ( α, β ) = N X n =1 M X m =1 V s ( u n , v m ) e − j 2 π ( u n α + v m β ) (4) The reconstructed intensity can be interpreted in the spatial domain as the point spread function (PSF) of the imager con volved with the true intensity . The PSF is obtained with an inv erse Fourier transform of the sampling function PSF = F − 1 { S } (5) The PSF provides insight into the quality of the imaging system. In an ideal scenario, the PSF would be a perfect point (an impulse), corresponding to complete Fourier coverage and perfect reconstruction. In practice, because only a finite number of antenna pairs are av ailable, the PSF is broader and contains sidelobes. Millimeter-w av e Fourier domain imaging is a process imple- mented on the receiving array , and via the V an Cittert-Zernike theorem the signals generated by the scene must be spatially and temporally incoherent. Passiv e imaging systems thus rely on capturing intrinsic thermal radiation from the scene, which are inherently incoherent across space and time for natural objects. Thermal radiation in the millimeter-w av e region of the electromagnetic spectrum is exceedingly low in po wer , and thus passive imagers generally require significant recei ver gains, often on the order of 100 dB or more. In contrast, AIM imaging imparts spatial and temporal incoherence on the scene by illuminating the scene with noise transmitters [9]. The transmitting array consists of independent noise sources arranged at wider spacings than the receivers with suf ficient bandwidth to ensure spatial and temporal incoherence (see, e.g., [22]). Actively transmitting signals generates signals scattered from the scene that are significantly higher in power than intrinsic thermal radiation. Therefore, receiving arrays can be implemented with typical receiv er gains on the order of 20 dB, significantly reducing cost and receiver complexity . I I I . A R R A Y L AYO U T O P T I M I Z AT I O N A P P R OA C H The reconstructed image is highly dependent on the number of spatial frequency samples obtained by the array , and thus the array layout is a critical design aspect. Ideally , each antenna pair would contribute a unique spatial frequency sample; ho wever in practice it is challenging to obtain array layouts with minimal baseline redundanc y , particularly in two- dimensional layouts [23]. For any array , reduced redundancy can be achiev ed by implementing optimization algorithms. In this work we explore the optimization of an array layout using a constrained two-dimensional area commensurate with 3 Fig. 1. Possible spaces numbered for the multi-objecti ve optimization. This is a representation of the physical possible spaces in the bracket that was designed for the imaging system. Circles with diameter equal to wav eguide size are added around each possible placement, indicating the minimum inter- element distance constraint between elements constraint in the receive array . the array space available, minimum inter-element spacing of 26 mm and maximum of 202 mm. Prior AIM demonstrations used various numbers of elements, including 16-element ar- rays [24] and 24-element arrays [25]. T o facilitate the study in this work, an array optimization framew ork with 48 possible position constraints was de veloped. The framew ork enables the optimization of AIM array geometries while constraining min- imum and maximum baseline limits, which ensures physically realizable array layouts while improving the di versity of spatial frequency sampling. While this work focuses on a specific array configuration, the proposed approach is generalized and can easily be extended to other array formations. The array consists of 24 possible analog to digital con verters (ADC) channels connected to 15-dBi 3D-printed horn anten- nas that can be positioned across 48 possible locations, as illustrated in Fig. 1. Based on (2), the sampling function of the system is obtained through cross-correlation of antenna pairs. Antenna pairs with identical baseline distance and orientation produce redundant samples. The sampling space can be optimized by strategically placing the 24 antennas within the 48 av ailable positions to maximize sample cov erage while reducing redundancy . A 2D array with 24 elements can produce up to 24 2 = 576 unique samples. The antenna array design is optimized according to three criteria. First, sample redundancy is minimized to improv e cov erage of the visibility function in the spatial frequency domain, which corresponds to maximizing the number of unique samples in S . Second, the system resolution is optimized to enable clear image reconstruction with fine spatial detail. For an interferometric imager, the spatial resolution in the azimuth and elev ation directions can be expressed in terms of the half-power beamwidth θ HPBW of the sinc-squared response associated with the largest baselines D x and D y along the horizontal and vertical axes of the array , respecti vely , as gi ven by [26] ∆ θ α,β ≈ θ ( α,β ) HPBW ≈ 0 . 88 λ D x,y . (6) Minimizing (6) leads to improved spatial resolution. Finally , the unambiguous field of vie w (FO V) is maximized to allow imaging of a larger scene region. The FO V is determined by the smallest inter-element spacings d x and d y along the horizontal and vertical ax es and can be expressed in terms of the direction cosines α and β as F O V α 2 , β 2 = λ 2 d x,y . (7) For this problem, two optimization techniques were em- ployed. The first approach was a random-search method, which consisted of randomly selecting six million candidate array configurations and ev aluating the number of redundant samples for each case. The resulting array configuration is shown in Fig. 2. The second technique in volved the use of a genetic algorithm (GA) to perform multi-objectiv e opti- mization (MO). T o formulate the optimization problem, three objectiv e functions were defined as Maximize unique Samples( n ) Minimize Resolution( n ) = θ ( α,β ) HPBW ≈ 0 . 88 λ D x,y Maximize FO V( n ) = λ 2 d x,y Subject to Sum( n ) ≤ 24 , D x,y ≤ 202 mm , d x,y ≥ 26 mm , with 1 ≤ n ≤ 48 . The optimization algorithm operates on a vector of 24 ele- ments representing indices corresponding to antenna place- ment locations shown in Fig. 1. Each antenna is assigned a unique index, and the algorithm uses this index vector to ex- tract the corresponding spatial coordinates. These coordinates are then used to ev aluate the objective functions. T o determine the number of unique samples, the sampling function is computed and visualized, and each distinct sample is counted once, thereby allowing identification of configurations that maximize sampling div ersity . The optimization was implemented using the gamultiobj solver in MA TLAB with the follo wing parameters: population size of 500, 200 generations, a crossov er fraction of 0.8, a Pareto fraction of 0.6, and a uniform mutation function. Multiple optimization runs were performed with dif ferent pop- ulation settings, each producing fiv e Pareto-optimal solutions. The final outcome of this optimization process resulted in the third array configuration, shown in Fig. 2. This configuration achiev ed good resolution in both the horizontal and vertical dimensions while maintaining a wide field of vie w and a large number of unique samples. I V . A N A L Y S I S T o analyze and compare the performance of the proposed array configurations, simulations were conducted for each ar- ray geometry . The ev aluation focused on image reconstruction quality , spatial resolution, and main-lobe to sidelobe le vel characteristics. First, the sampling function corresponding to each array formation was computed and is shown in Fig. 3. The number of unique samples generated by each array was determined through cross-correlation of the element positions. 4 Fig. 2. Array formations in λ/ 2 grid, (a) circular array , (b) random-search array , (c) MO Array . Fig. 3. Sampling function of each array shown in figure 2. Fig. 4. Theoretical PSF of each case in figure 2. It can be seen the PSF changes depending on the array formation. The PSF can be used to characterize the imaging system in term of unambiguous FO V , resolution and quality of image reconstruction of the imager. The resulting counts of unique samples were 289 for the circular array , 477 for the random-search array , and 545 for the MO-optimized array . Follo wing (5), an in verse Fourier transform was applied to each sampling function to obtain the corresponding theoretical PSF . The normalized PSFs for all array configurations are presented in Fig. 4. As expected, the PSF shape v aries across configurations because it is directly determined by the sampling function, which itself depends on the array geometry . This relationship highlights the connection between the number of unique samples and the resulting sidelobe behavior . The sidelobe lev el (SLL) was computed as a function of angular position relati ve to the strongest pixel in each normalized PSF . Figure 5 presents the SLL as a function of declination angle, illustrating the PSL for each configuration. T able I summarizes the number of unique samples for each array alongside the corresponding av erage SLL v al- ues in dB. The circular array exhibits an av erage SLL of − 17 . 52 dB, the random-search array achiev es − 24 . 96 dB, and the multi-objectiv e array attains − 26 . 29 dB, representing an improv ement of nearly 10 dB between the circular and MO configurations. These results confirm that more unique samples leads to reduced SLL. In the random-search configuration, improv ed sidelobe performance relativ e to the circular array is observed; howe ver , the reconstructed PSF exhibits noticeable broadening. This ef fect arises because the random-search method exclusi vely optimizes for sampling div ersity without explicitly considering resolution or field-of-view constraints. In contrast, the MO-optimized array retains the low sidelobe characteristics achie ved by the random-search approach while also preserving strong resolution performance in both the horizontal and vertical dimensions. This outcome is a direct consequence of the multi-objectiv e formulation, which simul- taneously optimizes resolution and FO V while minimizing 5 Fig. 5. Sidelobe lev el (SLL) versus declination plot. Using as reference the center pixel and strongest point of the PSF we take 360° of angle around. This plot sho ws the comparison of the three array PSF SLL at every angle in increments of 1°. The behavior shown is expected and it can be appreciated as the SLL in the MO and random-search case is lo wer , it lo wers it by a v alue of 7 dB(random-search case) 9 dB (MO case). T ABLE I T H E OR E T I C A L P S F U NI Q U E S A M P L E S A N D A V E RA G E S L L # Unique Samples A vg SLL (dB) Circular 289 -17.52 Random-search 477 -24.96 MO 545 -26.29 T ABLE II S S I M V A L UE S O F T H E E X AM P L E S C EN E S S1 S2 S3 S4 Circular 0.125 0.077 0.079 0.097 Random-search 0.135 0.111 0.099 0.100 MO 0.142 0.138 0.107 0.112 sampling redundancy . A simulated set of random millimeter-wa ve test scenes were generated to facilitate an analysis of the image re- construction performance of the arrays, as shown in Fig. 6. The theoretical PSF associated with each configuration was then used to simulate the reconstructed scene via con volution with the scene. The reconstructed images were subsequently compared with the original scenes using the SSIM, which quantifies structural agreement between two images, with values ranging from − 1 (completely decorrelated) to 1 (perfect reconstruction) [27]. The SSIM results obtained from the random scenes provide insight into how ef fectively each array captures spatial information. Scenes dominated by lo w spatial frequency content generally yield higher SSIM v alues, as the arrays more accurately capture broad intensity variations. In contrast, scenes containing high spatial frequency features, such as small or closely spaced targets, place greater demands on array resolution and more clearly reveal sidelobe effects in the reconstructed images. Four random test scenes were selected for e v aluation. The randomness was introduced in both the geometric shapes and their corresponding intensity lev els in order to assess how effecti vely each array captures spatial information and to enable a fair performance comparison. The scenes were created to extend beyond of the unambiguous FO V to an- alyze the effect of aliasing in the images. Fig. 6 presents the reconstructed scenes, labeled S1, S2, S3, and S4. After reconstruction, the cropped unambiguous FO V was compared to the original scene to compute the SSIM v alues reported in T able II. In all cases, the MO-optimized array achiev ed the highest SSIM values. The random-search array consistently improv ed upon the circular configuration, but did not match the performance of the MO design. The circular array benefits from wide baselines distrib uted over many angles, which can provide strong angular resolution. Howe ver , the reconstructed images exhibited noticeable sidelobe contamination, resulting in visually noisy or cluttered scenes. In scenes S1 and S2, aliasing artifacts were strongly evident within the unambiguous FO V . In practical measurements, such artifacts could obscure weaker targets or make detection more challenging. Both the random-search and MO-optimized configurations produced visibly cleaner reconstructions with reduced ambiguities. The primary distinction between these two designs was that the MO-optimized array achiev ed higher resolution while also minimizing sample redundancy . As a result, it produces sharper and cleaner images compared to the other configurations. These results demonstrate that the MO- optimized array provided a better balance between resolution, sidelobe suppression, and ambiguity reduction, making it bet- ter suited for reliable target detection and separation. Analysis of the reconstruction results indicates that array configurations with a larger number of unique spatial samples produce cleaner main lobes and reduced sidelobe artifacts. This behavior is re- flected in consistently higher SSIM v alues across the ev aluated scenes. In particular , the MO-optimized array demonstrates the strongest overall performance, providing improv ed structural fidelity while maintaining the capability to resolve fine scene details within the unambiguous FO V . These findings suggest that the MO array design enhances practical imaging perfor- mance by effecti vely balancing the trade-off between spatial resolution and sidelobe suppression across a div erse set of randomly generated test scenes. V . E X P E R I M E N TA L S Y S T E M D E S I G N A N D C A L I B R A T I O N In order to demonstrate the performance of the array for- mation, a set of experiments were performed using a 38- GHz system consisting of four transmitters illuminating the scene with noise wav eforms mimicking thermally-generated random signals. A block diagram can be seen in Fig. 7. The system consisted of a 24-channel recei ving array along with four noise transmitters that were placed at a wider baseline than the widest baseline of the receiving array to ensure that the signals incident on the scene were spatially inco- herent. Since the transmitter noise sources were independent, the signals incident on the scene were therefore spatially 6 O r i gi nal R andom I m age C i r cul ar Thres hol d Mul t i - O bj Fig. 6. From left to right, the reconstructed images corresponding to each array configuration are presented. From top to bottom, scenes S1 through S4 are shown, representing the different randomly generated test cases selected for comparison and SSIM analysis. The MO-optimized array demonstrates consistent performance across all scenarios, producing cleaner reconstructions with reduced sidelobe artifacts. In contrast, the circular array exhibits more pronounced sidelobes, which introduce visible clutter and degrade image quality . The random-search array maintains reliable reconstruction performance; howe ver, its lower resolution leads to slight image blurring, and in some cases, aliasing effects begin to appear within the reconstructed targets. and temporally incoherent. Each transmitter used a separate baseband noise source, the signal from which was upcon- verted to the millimeter-wa ve carrier frequency using Analog Devices (ADI) HMC6787 upconv erters. Before transmission, the millimeter-wa ve noise signals were amplified using ADI HMC7229 power amplifiers. The carrier frequency was gen- erated by a 19-GHz local oscillator (LO) using a Keysight N5183A. The upconv erters included an integrated frequency doubler that con verts the 19-GHz LO to the desired 38-GHz carrier frequency . The signals captured at the receiving array were amplified using ADI HMC1040 low-noise amplifiers and then quadrature downcon verted using ADI HMC6789 downcon verters. All 48 I/Q baseband signals were digitized by three A TS9416 samplers that were hosted in a computer . The sample rate on each channel was 100 MS/s. All signal processing and image reconstruction was implemented in a host computer using MA TLAB. The array frame was fabricated and integrated into the imaging system, and the antenna placement was reconfigured to match each array geometry under ev aluation. Optical pho- tographs of the implemented array configurations are shown in Fig. 8. Prior to imaging experiments, system calibration 7 LO Q LNA A DI HM C1 040 A DI HMC6 78 9 A TS9 4 1 6 1 00M S/ s 24 Rx I MA TLAB P o w er A m pl if ier A DI HM C67 8 7 P o w er A m pl if ier A DI HMC722 9 XDM NSE1 5 - 1 L O Noise Sou r ce 4 Tx x2 ZX60 - 43 - S+ ZX60 - 1 00VH + Fig. 7. Block diagram of the transmitter and receiv er chains. T ABLE III M E A SU R E D P S F U N I Q U E S A M P L ES A N D A V E R AG E S L L # Unique Samples A vg SLL (dB) Circular 289 -17.46 Random-search 477 -21.25 MO 545 -25.28 is required to ensure that relativ e static phase offsets in the receiving channels are corrected. Previous work introduced a calibration approach based on redundant baselines within the antenna array , which naturally produce redundant sampling points [24]. This requirement influenced array formation, but fa vored geometries with baseline redundancy . Because the arrays in this work are focused on minimizing redundancy , a different calibration approach was required. By employing an active antenna transmitting a continuous-wave signal at 38 GHz as a test target, a direct calibration procedure was implemented following [28]. Because the calibration target is a kno wn point source, linearization of both amplitude and phase responses can be applied, resulting in a set of comple x calibration weights for each recei ve element. Specifically , the spatial locations of antenna pairs are used to deriv e weights that compensate amplitude and phase mismatches across the receiv er channels. These weights enable accurate reconstruc- tion of the point target generated by the single-tone activ e antenna positioned at the center of the array field of vie w . This calibration approach enables in vestigation of array geometries with reduced baseline redundancy while preserving accurate imaging performance. The calibrated point-source responses for each array configuration are presented in Fig. 9. All three cases exhibit structures consistent with their corresponding theoretical PSFs shown in Fig. 4, validating the calibration process and confirming the expected dependence of the mea- sured response on array geometry . V I . E X P E R I M E N T S Four experimental targets were reconstructed to ev aluate and compare array performance. The first target was a copper- tape cylinder with a height of 0.47 m and a diameter of 0.10 m, positioned at the center of the field of view (FO V) at a distance of 1.88 m from the system. The second target consisted of two spheres, each with a diameter of 0.20 m and a radar cross section (RCS) of − 15 dBsm. The left sphere was positioned 0.13 m to the left of the FO V center at a distance of 1.83 m, while the right sphere was located 0.17 m to the right and 1.96 m from the system. The third target maintained the same lateral and depth offsets as the second configuration but replaced the spheres with cylindrical objects. The right cylinder was identical to the cylinder used in the first target, whereas the left cylinder had a height of 0.37 m and a diameter of 0.08 m. The fourth target consisted of four spheres with diameters of 0.1 m, separated by 0.15 m center-to-center , each exhibiting an RCS of approximately − 21 dBsm. This target arrangement was positioned 1.52 m from the system. The reconstructed images for all cases are presented in Fig. 11. The three array configurations successfully recon- structed the first three targets, while noticeable differences emerged in the fourth scenario. For the first target, the circular array produced a reconstruction with relatively fine resolution; howe ver , some target information was diminished compared to the random-search and MO configurations. Consistent with simulation results, sidelobe le vels decreased as the number of redundant samples was reduced, leading to improved image clarity . In the second scenario, both spheres were reconstructed across all arrays. Notably , the random-search and MO con- figurations more accurately captured the amplitude difference between the two spheres, particularly for the right sphere located farther from the array , indicating improved scene rep- resentation. The third scenario, in volving two cylinders, was also successfully reconstructed in all cases, with observable differences corresponding to variations in cylinder height and range. The fourth target highlighted the most pronounced performance differences. The circular array struggled to fully resolve the four-sphere configuration due to sidelobe interfer- ence that obscured portions of the scene. The random-search array achie ved clearer reconstruction of the targets, while the MO-optimized array provided the most reliable result, enabling straightforward identification of the central targets within the FO V . This improved performance is attributed to reduced sidelobe lev els and stronger main-lobe dominance, allowing the targets to appear more distinctly in the recon- structed image. V I I . C O N C L U S I O N This work inv estigated the impact of receive array geometry on reconstruction performance in a 24-element 38-GHz AIM imaging system. Three array configurations were analyzed: a circular layout, a random-search optimized array designed to maximize unique spatial frequency samples, and a MO- optimized array that simultaneously considered spatial sam- pling di versity , system resolution, and field of vie w constraints. Theoretical analysis demonstrated that increasing the num- ber of unique spatial frequency samples improv es the point spread function characteristics by reducing sidelobe lev els and enhancing spatial frequency coverage. Among the ev aluated configurations, the MO-optimized array achiev ed the highest number of unique samples and produced the lowest theoret- ical peak sidelobe lev els while maintaining strong resolution 8 Fig. 8. Experimental array layouts for the circular array (left), random-search array (middle) and multi-objectiv e optimized array (right). Fig. 9. Measured point spread functions for the circular array (left), random-search array (middle) and multi-objecti ve optimized array (right). Fig. 10. Measured Sidelobe level (SLL) versus declination plot. The behavior shown is expected from what was obtained in theory , showing the calibration is close to theory and also showing avg SLL of -17.46 dB (circular), -21.25 dB (random-search) and -25.28 dB (MO). performance. Simulated image reconstruction using randomly generated scenes confirmed that arrays with greater sampling div ersity yield improv ed structural fidelity , with the MO configuration consistently achieving the highest SSIM values. Experimental validation was performed using a 38-GHz AIM imaging platform with a reconfigurable 24-element receiv e array implemented within a 48-position aperture. Measured PSFs closely matched theoretical predictions, confirming the effecti veness of the calibration procedure and the expected influence of array geometry on imaging behavior . Imaging experiments with se veral physical targets demonstrated that the optimized arrays produced clearer reconstructions and reduced sidelobe artifacts compared to the circular configuration. Array layout optimization can significantly improve reconstruction quality without increasing hardware complexity . While this work is applied to a restricted antenna array in an imaging system with spatial constraints, the approach can be directly extended to other Fourier domain array design problems. R E F E R E N C E S [1] D. M. Sheen, D. L. McMakin, and T . E. Hall, “Three-dimensional millimeter-wa ve imaging for concealed weapon detection, ” IEEE Tr ans. Micr ow . Theory T echn. , vol. 49, no. 9, pp. 1581–1592, Sep. 2001. [2] L. Y ujiri, M. Shoucri, and P . Mof fa, “Passiv e millimeter wa ve imaging, ” IEEE Micr ow . Mag. , vol. 4, no. 3, pp. 39–50, 2003. [3] R. Appleby and R. N. Anderton, “Millimeter -wav e and submillimeter- wav e imaging for security and surveillance, ” Proc. IEEE , vol. 95, no. 8, pp. 1683–1690, Aug 2007. [4] D. Chen and J. A. Nanzer , “Space–time dynamic antenna array design for fourier-domain microw av e remote sensing, ” IEEE Tr ansactions on Geoscience and Remote Sensing , v ol. 63, pp. 1–17, 2025. [5] L. M. Ulander and P .-O. Fr ¨ olind, “Ultra-wideband sar interferometry , ” IEEE T ransactions on Geoscience and Remote Sensing , vol. 36, no. 5, pp. 1540–1550, 1998. [6] U. Rau and T . J. Cornwell, “ A multi-scale multi-frequenc y decon volution algorithm for synthesis imaging in radio interferometry , ” Astronomy & Astr ophysics , vol. 532, p. A71, 2011. [7] A. V . Diebold, T . Fromenteze, E. Kpr ´ e, C. Decroze, M. F . Imani, and D. R. Smith, “Unified reciprocal space processing for short-range activ e and passive imaging systems, ” IEEE Open J ournal of Antennas and Pr opagation , vol. 3, pp. 124–134, 2021. [8] J. R. Colon-Berrios and J. A. Nanzer, “Frequency-diverse additive processing for activ e incoherent millimeter-wa ve imaging, ” IEEE Open Journal of Antennas and Propagation , vol. 7, no. 1, pp. 184–193, 2026. 9 T ar get Circ ula r Multi - Obj Random - sea rc h Fig. 11. Four targets were reconstructed and the performance was compared. The first target is a copper tape cylinder that measures 0.47 m of height and a diameter of 0.102 m, it was placed at the center of the FO V , 1.88 m away from the system. Second target consists of two spheres with diameter equal to 0.203 m and RCS of -14.89 dbsm, the left sphere was moved 0.127 m to the left of the FO V center and at 1.83 m distance from the system. The sphere on the right was mov ed 0.165 m to the right and is 1.96 m away from the system. The third target utilizes the same distances to the right and left and back and forward from the second target, in this case the cylinder used on the right is the same from the first target, the cylinder to the left had a height of 0.37 m and a diameter of 0.076 m. Finally the last target consist of four spheres with diameter of 10 cm and distance between spheres of 0.15 m with -21 dbsm RCS. The tar get was placed at 1.524 m from the system. [9] S. V akalis and J. A. Nanzer , “Microwa ve imaging using noise signals, ” IEEE T ransactions on Micr owave Theory and T echniques , vol. 66, no. 12, pp. 5842–5851, 2018. [10] S. V akalis, L. Gong, J. Papapolymerou, and J. A. Nanzer , “40-ghz active interferometric imaging with noise transmitters, ” in 2019 16th Eur opean Radar Confer ence (EuRAD) , 2019, pp. 273–276. [11] A. R. Thompson, J. M. Moran, and G. W . Swenson, Interferometry and Synthesis in Radio Astr onomy . John W iley and Sons, 2001. [12] S. Ellison, S. V akalis, and J. A. Nanzer , “Optimizing for spatial frequency coverage vs. point-spread function sidelobe level in active incoherent microwa ve imaging arrays, ” in 2019 USNC-URSI Radio Science Meeting (Joint with AP-S Symposium) , 2019, pp. 103–104. [13] A. M. Molaei, S. Hu, V . Skouroliakou, V . Fusco, X. Chen, and O. Y ur- dusev en, “Fourier compatible near-field multiple-input multiple-output terahertz imaging with sparse non-uniform apertures, ” IEEE Access , vol. 9, pp. 157 278–157 294, 2021. [14] N. Jin and Y . Rahmat-Samii, “ Analysis and particle swarm optimization of correlator antenna arrays for radio astronomy applications, ” IEEE T ransactions on Antennas and Pr opagation , vol. 56, no. 5, pp. 1269– 1279, 2008. [15] K. Chao, Z. Zhao, Z. Wu, and R. Lang, “ Application of the differential ev olution algorithm to the optimization of two-dimensional synthetic aperture microw av e radiometer circle array , ” in 2010 International Confer ence on Microwave and Millimeter W ave T echnology , 2010, pp. 1212–1215. [16] V . Skouroliak ou, A. M. Molaei, V . Fusco, and O. Y urduse ven, “Fourier- based radar processing for multistatic millimetre-wav e imaging with sparse apertures, ” in 2022 16th Eur opean Confer ence on Antennas and Pr opagation (EuCAP) , 2022, pp. 1–5. [17] F . Ares-Pena, J. Rodriguez-Gonzalez, E. V illanueva-Lopez, and S. Ren- garajan, “Genetic algorithms in the design and optimization of an- tenna array patterns, ” IEEE T ransactions on Antennas and Propa gation , vol. 47, no. 3, pp. 506–510, 1999. [18] M. Bray , D. W erner , D. Boeringer , and D. Machuga, “Optimization of 10 thinned aperiodic linear phased arrays using genetic algorithms to reduce grating lobes during scanning, ” IEEE T ransactions on Antennas and Pr opagation , vol. 50, no. 12, pp. 1732–1742, Dec. 2002. [19] H. Tsutsumi, Y . Kuwahara, and H. Kamo, “Design of the series fed microstrip patch planar array antenna by the parato genetic algorithm, ” in 2015 IEEE International Symposium on Antennas and Propa gation & USNC/URSI National Radio Science Meeting , 2015, pp. 1854–1855. [20] M. W . W olff and J. A. Nanzer , “ Application of pseudoweights in antenna array optimization and design, ” IEEE Antennas and W ir eless Pr opagation Letters , vol. 23, no. 5, pp. 1478–1482, 2024. [21] K. Deb, A. Pratap, S. Agarwal, and T . Meyari van, “ A fast and elitist multiobjectiv e genetic algorithm: Nsga-ii, ” IEEE T ransactions on Evo- lutionary Computation , vol. 6, no. 2, pp. 182–197, 2002. [22] S. V akalis, D. Chen, and J. A. Nanzer , “T o ward space–time incoherent transmitter design for millimeter-wav e imaging, ” IEEE Antennas and W ireless Propa gation Letters , vol. 19, no. 9, pp. 1471–1475, 2020. [23] M. Karaman, I. O. W ygant, O. Oralkan, and B. T . Khuri-Y akub, “Minimally redundant 2-d array designs for 3-d medical ultrasound imaging, ” IEEE T ransactions on Medical Imaging , vol. 28, no. 7, pp. 1051–1061, 2009. [24] S. V akalis, L. Gong, Y . He, J. Papapolymerou, and J. A. Nanzer, “Experimental demonstration and calibration of a 16-element active incoherent millimeter -wav e imaging array , ” IEEE T ransactions on Mi- cr owave Theory and T echniques , v ol. 68, no. 9, pp. 3804–3813, 2020. [25] J. R. Colon-Berrios, S. V akalis, D. Chen, and J. A. Nanzer , “Incoherent point spread function estimation and multipoint deconv olution for acti ve incoherent millimeter-wa ve imaging, ” IEEE Micr owave and W ireless Components Letters , vol. 32, no. 6, pp. 800–803, 2022. [26] J. A. Nanzer, Micr owave and Millimeter-W ave Remote Sensing for Security Applications . Artech House, 2012. [27] Z. W ang, A. Bovik, H. Sheikh, and E. Simoncelli, “Image quality assess- ment: from error visibility to structural similarity , ” IEEE T ransactions on Imag e Pr ocessing , vol. 13, no. 4, pp. 600–612, 2004. [28] C. L. C. G.B T aylor and R. Perley , “Synthesis imaging in radio astronomy ii, chapter 5, ” ASP Confer ence Series , vol. 180, pp. 79–110, 1999.
Original Paper
Loading high-quality paper...
Comments & Academic Discussion
Loading comments...
Leave a Comment