Sentinel-2 for Crop Yield Estimation: A Systematic Review
Accurate and timely crop yield estimation is critical for global food security, agricultural policy, and farm management. The Copernicus Sentinel-2 satellite constellation, with high spatial, temporal, and spectral resolution, has transformed agricul…
Authors: Mohammadreza Narimani, Alireza Pourreza, Ali Moghimi
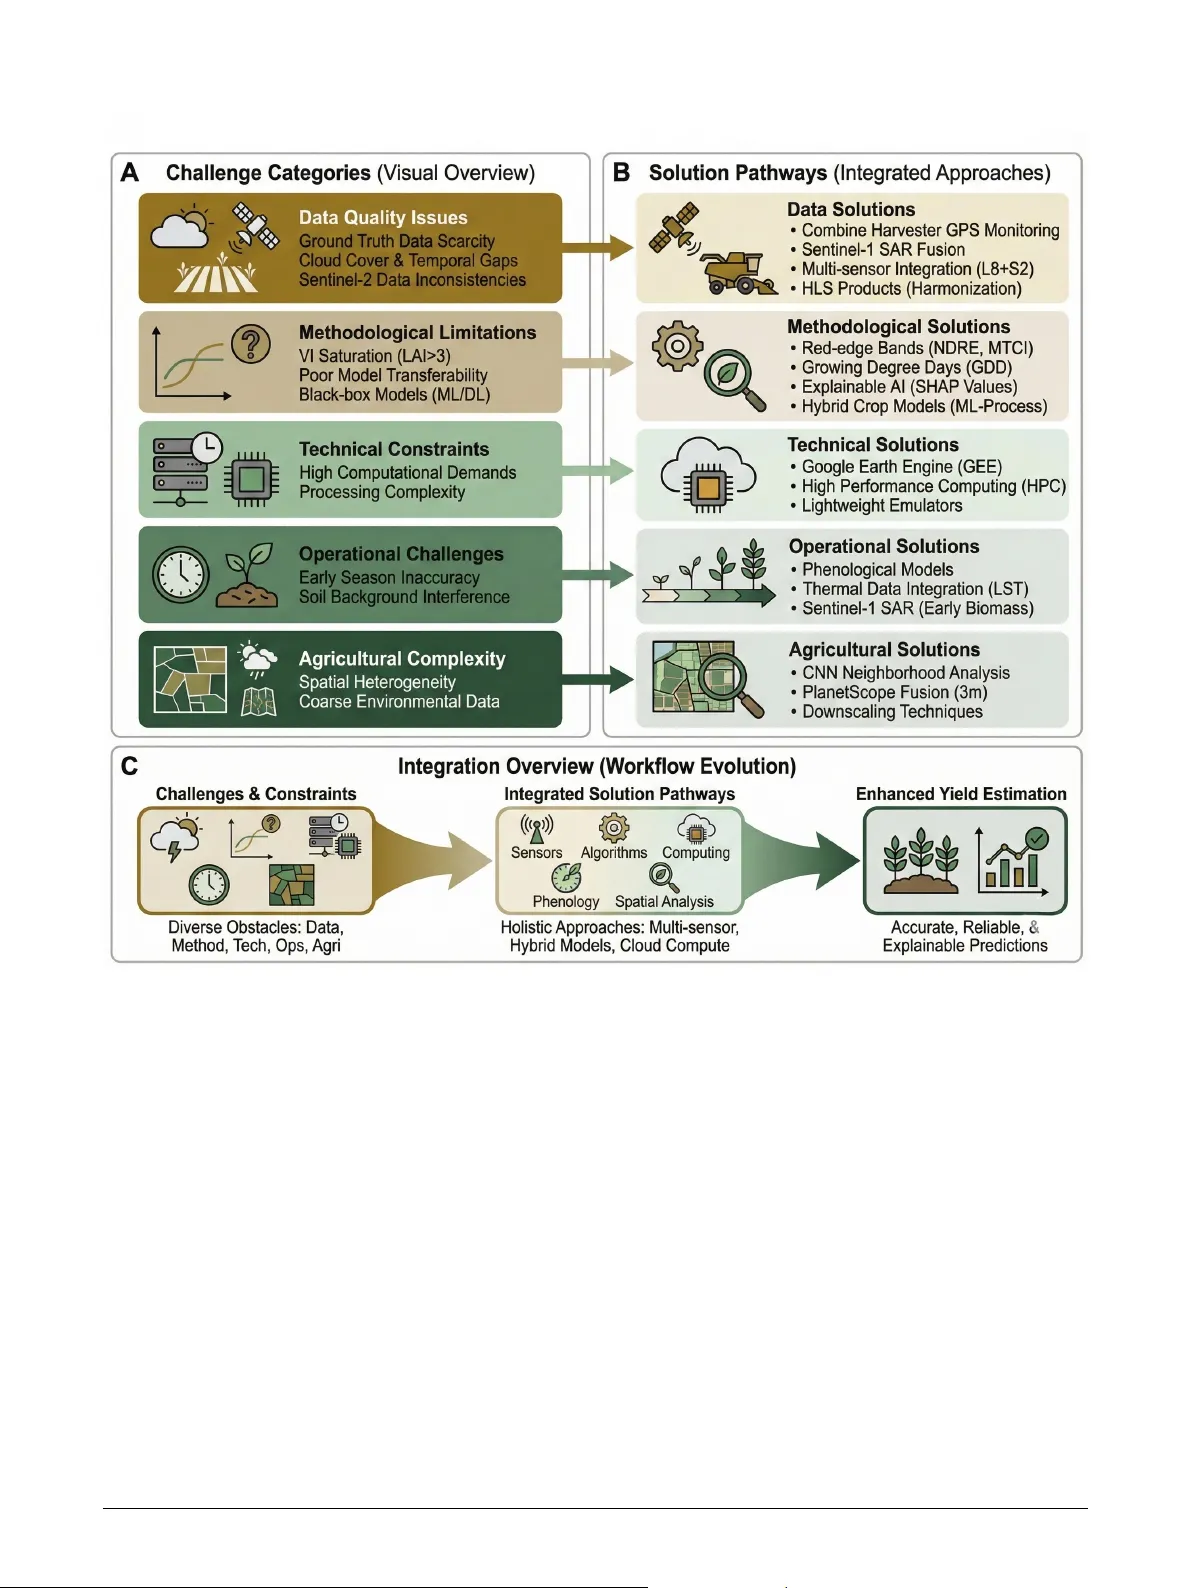
Sentinel-2 f or Crop Y ield Estimation: A Sys tematic Re view Mohammadreza Narimani a , Alireza Pourreza a , ∗ , Ali Moghimi a and Parast oo Farajpoor a a Univ ersity of California, Davis, Department of Biological and A gricultur al Engineering, Davis, CA, USA A R T I C L E I N F O Keyw ords : Sentinel-2 crop yield estimation remote sensing machine learning data assimilation precision ag riculture A B S T R A C T Accurate and timely crop yield estimation is fundamental for ensur ing global food security , guiding agricultural policy , and optimizing farm management. The adv ent of the Copernicus Sentinel- 2 satellite constellation, wit h its high spatial, temporal, and spectral resolutions, has cat alyzed a paradigm shift in Earth obser vation for agriculture, enabling monitor ing at the field and sub-field scale. This revie w synthesizes recent advancements in crop yield monitoring and estimation that lev erage Sentinel-2 data. A dominant theme is the transition from regional-scale models to high- resolution, field-lev el assessments, dr iven by t hree pr imary methodological approaches: (i) empirical models using vegetation indices, increasingly coupled wit h machine and deep lear ning algor ithms like Random Forest and Conv olutional Neural Netw orks, which consistently outper form traditional regressions; (ii) t he integration of process-based crop growth models (e.g., WOFOST , SAFY) through data assimilation of Sentinel-2 derived biophysical variables like Leaf Area Index (LAI); and (iii) data fusion techniques that combine Sentinel-2 optical data wit h weather -independent Sentinel-1 SAR imagery to overcome challenges like cloud cov er. Bey ond t he g rowing use of multi-modal data, the synthesis show s that Sentinel-2-based machine learning, deep lear ning, and hybrid crop growth model framew orks can explain a large fraction of within-field yield variability across crops and regions, while performance is still constrained by limited and noisy g round-trut h yield dat a, cloud-related gaps in optical imager y , and difficulties in transferring models across years and sites. Looking ahead, t he revie w points to tighter integ ration of multi-modal data streams with hybrid modeling and improv ed in-season ground observations as a key pat hwa y for tur ning Sentinel-2-based yield estimation into robust, operational decision-suppor t tools. These advanced framew orks provide powerful tools for precision agriculture and sustainable intensification, offer ing practically relevant insights into crop performance from local to global scales. Graphical Abstract ∗ Corresponding author apourreza@ucdavis.edu (A. Pour reza) Narimani et al.: Preprint Page 1 of 29 1. Introduction Ensuring global f ood security for a growing population requires substantial increases in agr icultural productivity , making timely and accurate crop yield information essential for f armers, policymakers, and global markets [ 1 – 3 ]. As climate variability , input costs, and resource constraints intensify , the need for timely , spatially explicit yield information has grown, particularly to support management at t he field and sub-field scale [ 1 – 3 ]. Crop yield is theref ore a central variable f or f ood secur ity planning, marke t stability , and on-farm decision-making. Remote sensing has long been recognized as a ke y technology for monitoring agr icultural systems at scale and for providing consistent obser vations across space and time [ 3 – 6 ]. At the finest scale, t he same spectral pr inciples under pin handheld and pro ximal spectrometers, which enable detection of yield-related traits, plant diseases, and nutr ient status at the leaf level with high precision [ 7 , 8 ]; how ev er, such point measurements are time-consuming to collect and difficult to generalize across entire farms. At an intermediate scale, drone-based multispectral imagery has been used for crop yield prediction, disease detection, and nutr ient mapping, offer ing better scalability o v er field-sized areas [ 9 , 10 ]. Y et at regional or national scales, drone operations are often not feasible or are limited to a small number of fields, and man y applications requir e the broader cov erage and acceptable accuracy that satellite-based monitoring can provide. Histor ically , how ev er, operational yield-related monitor ing relied on coarse- resolution sensors such as MODIS and A VHRR, which, despite high temporal frequency , could not adequately resolv e the small and heterogeneous fields common in many agr icultural landscapes [ 11 – 14 ]. While medium-resolution sensors such as Landsat improv ed spatial detail, long revisit intervals and frequent cloud contamination limited their ability to capture key phenological ev ents consistently [ 11 – 13 ]. The launch of t he Coper nicus Sentinel-2 satellite constellation (Sentinel-2A in 2015 and Sentinel-2B in 2017) marked a tur ning point for agr icultural remote sensing [ 11 , 13 , 15 – 17 ]. By pro viding freely accessible multispectral imagery wit h high spatial resolution (10–20 m), frequent revisit times (2–5 da ys at mid-latitudes), and unique spectral bands in the red- edge region, Sentinel-2 has enabled a shift from regional assessments to precise field-lev el and within-field yield monitoring [ 2 , 12 , 13 ]. This capability has spur red rapid me thodological dev elopment and a g rowing body of literature. Despite this growth, t he field remains fragmented across modeling paradigms, feature engineer ing strategies, and validation practices, making it challenging to compare findings across studies and to identify robust pathwa ys tow ard operational yield estimation. No systematic revie w has ye t synt hesized this body of work with an explicit focus on crop yield estimation (rather than classification or biomass alone), leaving researchers, practitioners, and policy-makers without a consolidated reference to guide the selection of methods and future research. A systematic review that consolidates cur rent approaches, clar ifies what Sentinel-2 uniquely contr ibutes, and highlights limitations and research gaps is t heref ore needed. A major t heme in the Sentinel-2 era is the advancement of empir ical and dat a-driven models beyond simple linear regressions. Numerous studies demonstrate the utility of veg etation indices (VIs) derived from Sentinel-2, particularly t hose using red-edge bands such as the Nor malized Difference Red-Edge Index (NDRE) and the MERIS (Medium Resolution Imaging Spectrome ter) T er restr ial Chloroph yll Inde x (MTCI), which are less susceptible to saturation in dense canopies than t he traditional Normalized Difference V egetation Index (ND VI) [ 4 , 18 – 20 ]. These VIs are increasingly used as inputs f or machine lear ning (ML) and deep lear ning (DL) algorithms, including Random Forest (RF), Support V ector Machines (SVM), and neural networ k architectures (e.g., CNNs and LSTMs), which of ten outperform con ventional statistical methods by captur ing complex, non-linear relationships betw een spectral dat a and yield [ 12 , 21 – 23 ]. Another prominent research area is the integration of Sentinel-2 data with process-based crop g rowth models (CGMs) such as WOFOS T, SAFY , APSIM, and CERES-Wheat [ 13 , 14 , 24 – 26 ]. Through data assimilation, satellite-derived biophysical variables—most commonly Leaf Area Index (LAI)—are used to calibrate and constrain CGM simulations, improving the accuracy of yield estimates by anchoring model dynamics to real-wor ld observations at high spatial resolution [ 12 , 26 ]. This hybrid approach combines mechanis tic underst anding of crop physiology with spatially explicit remote sensing inf ormation, enabling more robust estimations across div erse envir onmental conditions [ 3 , 13 , 15 , 24 , 26 ]. Finall y , data fusion strategies hav e emerged to o vercome the inherent limitations of any single sensor . A significant trend is the syner gistic use of Sentinel-2 optical data wit h Sentinel-1 Synthetic Aperture Radar (S AR) dat a [ 18 , 27 – 29 ]. Because SAR can penetrate clouds, this fusion suppor ts more continuous monitor ing throughout t he g ro wing season, which is par ticularly cr ucial in frequentl y o ver cast regions [ 13 , 18 , 30 ]. Studies also show improv ed model per f ormance when combining satellite imag er y with ancillary data (e.g., meteorological obser vations, soil properties, and topog raphic inf or mation) to better represent the dr ivers of yield variability [ 12 , 13 , 16 , 21 ]. The objectives of this systematic review are to (i) summarize methodological trends in Sentinel-2-based crop yield estimation, (ii) compare t he dominant modeling paradigms and their typical data inputs, and (iii) identify k ey challenges and future directions f or improving accuracy , robustness, and scalability . This revie w synthesizes t he literature around these objectives and compiles publication statistics from the papers review ed to illustrate the rapid g ro wth and f ocus of this research area (Figure 1 ). The methods used to conduct this systematic review are described in the next section. Narimani et al.: Preprint Page 2 of 29 Figure 1: Global trends in Sentinel-2 crop yield estimation research. (A) Geographic distr ibution of publications by countr y , showing t he number of studies conducted in each nation from 2015 to present. Countries are color -coded by publication count. (B) T emporal trends in crop study frequency , displaying t he ev olution of research f ocus across major crop types ov er time. The stacked bars show the relative contribution of different crops to the literature each year . (C) Continental distribution of publications over time, illustrating the geographic expansion of Sentinel-2 yield estimation research across different regions. In panels B and C, the first four years (2015–2018) are merged into a single bin f or consistency with the remaining year ranges. 2. Methods 2.1. Literature Search Strategy This systematic revie w synthesizes peer-re viewed literature published from 2015 to t he present, coinciding with the launch of the Sentinel-2A satellite. A comprehensive search w as conducted using the W eb of Science Core Collection as t he primar y database, supplemented by searches in Scopus and Google Scholar to ensure comprehensiv e cov erage. The search strategy employ ed a combination of ke ywords including "Sentinel-2", "crop yield", "yield estimation", "machine lear ning", "deep learning", "data assimilation", "wheat", "maize", "r ice", "soybean", "remote sensing", and "precision agr iculture". Boolean operators (AND, OR) were used to create t arge ted search str ings that captured the intersection of Sentinel-2 satellite dat a and agr icultural yield estimation applications. Narimani et al.: Preprint Page 3 of 29 2.2. Inclusion and Exclusion Cr iteria Articles w ere included if t hey met t he follo wing cr iter ia: (i) peer-re view ed research ar ticles published in English; (ii) use of Sentinel-2 dat a as a primar y or significant input for quantitative yield estimation of agr icultural crops; (iii) f ocus on field-scale or regional-scale yield estimation; (iv) av ailability of quantitativ e per formance metrics (e.g., R ² , RMSE, MAE); and (v) accessible full-text ar ticles wit h valid DOIs. Studies were ex cluded if they: (i) f ocused solely on crop classification or mapping without yield estimation; (ii) ex amined only biomass estimation without establishing a direct link to yield; (iii) used ex clusivel y other sensors without Sentinel-2 integration; (iv) were conf erence abstracts, dissert ations, or non-peer-re view ed publications; or (v) were published in languages other t han English. 2.3. Study Selection and Data Extraction The initial search yielded 382 papers from W eb of Science. A r igorous eight-step filtering process was applied to ensure quality and relev ance: (1) document type screening to retain peer-re viewed research ar ticles; (2) abstract av ailability verification; (3) duplicate remo val based on DOI matching; (4) DOI validation and accessibility verification; (5-6) systematic accessibility screening t hrough download attempts; (7) language filter ing to retain English publications only; and (8) final quality assessment. This systematic approach resulted in 301 high-quality , accessible English research papers t hat form the final dataset, representing a 21.2% reduction from the initial search that ensured comprehensiv e cov erage while maint aining rigorous quality standards. From each included study , the f ollowing information w as systematically extracted and categor ized: (i) modeling approach and algorit hms used (e.g., machine learning, deep learning, statistical regression, process-based models); (ii) crop type and study region; (iii) Sentinel-2 data f eatures utilized (e.g., spectral bands, vege tation indices, bioph ysical parameters); (iv) integration with other data sources (e.g., Sentinel-1 S AR, meteorological data, soil information); (v) temporal aspects (e.g., single-date vs. time-ser ies analy sis, phenological stages); (vi) reported accuracy metrics and model per formance; and (vii) ke y findings, limitations, and recommendations. 2.4. Data Analysis and Synthesis The extracted data w ere anal yzed to identify major research themes, methodological trends, and g eog raphic patter ns. Quantitative analysis included frequency counts of modeling approaches, crop types, and geographic distribution of studies. Perf ormance metr ics were standardized where possible to enable cross-study comparisons. T emporal trends in publication patterns and methodological ev olution were examined to understand the dev elopment trajector y of t he field. The synt hesis f ocused on three pr imar y research themes: (i) empirical and machine learning approaches using vege tation indices and spectral data; (ii) integration of process-based crop growth models through data assimilation; and (iii) multi-sensor dat a fusion strategies combining Sentinel-2 with complement ar y data sources. 2.5. Quality Assessment Study quality was assessed based on sev eral cr iter ia including: (i) clarity of methodology and reproducibility; (ii) adequacy of ground-trut h data f or model training and validation; (iii) appropriate use of cross-validation or independent test datasets; (iv) transparency in repor ting per formance metr ics and limitations; and (v) consideration of spatial and temporal transf erability . Studies wit h robust experimental designs, comprehensive validation approaches, and clear reporting of methods and results were given g reater weight in the synthesis. 3. Literature Synthesis Based on t he search and synthesis approach described abov e, t he f ollo wing sections present the findings of the revie w . Abbre viations used in t his review are listed in Appendix A. 3.1. Remote Sensing Platforms & Sentinel-2 F eatures The foundation of moder n crop monitor ing is a fleet of Ear th observation (EO) satellites, each wit h distinct capabilities. As outlined in the introduction, earlier operational sensors eit her lacked the spatial detail to resolv e individual fields or t he temporal frequency needed to capture key phenological stages; Sentinel-2 w as designed to address this gap. The Coper nicus Sentinel-2 mission, wit h its twin satellites (Sentinel-2A and Sentinel-2B), represents a paradigm shift for agr icultural applications. Its multispectral instrument (MSI) provides data wit h a unique combination of technical specifications that are highly advantag eous for crop monitor ing [ 13 , 25 , 31 – 33 ]. Ke y f eatures include: • High Spatial Resolution: Sentinel-2 offers 10 m resolution for its blue, g reen, red, and broadband near-infrared (NIR) bands; 20 m f or its red-edge, nar row NIR, and shor twa ve infrared (SWIR) bands; and 60 m for atmospher ic cor rection bands. [ 13 ] This 10–20 m resolution is adequate f or monitor ing at the field and e ven sub-field le vel, a critical impro vement f or precision ag riculture and f or studying small, fragmented farms common in many parts of the w orld [ 11 , 13 , 14 , 16 , 34 ]. Narimani et al.: Preprint Page 4 of 29 • High T emporal Resolution: The two-satellite constellation (Sentinel-2A and Sentinel-2B) provides a combined revisit time of 2–5 day s at mid-latitudes. A third satellite, Sentinel-2C, was launched in September 2024 and will furt her impro ve temporal resolution (shor ter revisit time) as the constellation transitions to a t hree-satellite configuration. This significantly increases t he probability of acquir ing cloud-free images dur ing critical crop growth stages compared to platf or ms like Landsat [ 2 , 11 , 14 , 25 , 35 ]. This high temporal frequency is essential f or tracking rapid phenological chang es, which are closely linked to final yield and thus support more accurate yield estimation [ 13 , 36 , 37 ]. • Uniq ue Spectral Bands: A ke y advantag e of Sentinel-2 is its inclusion of multiple bands in the red-edge region (around 705 nm, 740 nm, and 783 nm) [ 18 , 28 , 38 – 40 ]. The red-edge is highly sensitive to vege t ation chloroph yll and nitrogen content and is less prone to saturation in dense canopies compared to traditional red/NIR-based indices lik e ND VI [ 19 , 20 , 38 , 39 , 41 ]. This makes it particularly valuable f or assessing nutrient status and estimating biomass and yield with g reater accuracy [ 4 , 18 , 28 , 39 ]. The av ailability of larg e-scale computational platforms for analysis, most notably Google Eart h Engine (GEE), has been instrument al in enabling efficient access to and processing of t he vast archiv es of Sentinel-2 data required f or data-intensive yield estimation studies [ 18 , 23 ]. While Sentinel-2 offers strong capabilities as a free and open dat a source [ 13 , 16 , 31 , 33 , 42 ], it is often used synergisticall y with other platforms. Dat a fusion with Sentinel-1’ s weather -independent Synthetic Aperture Radar (S AR) is a common strategy to overcome cloud cov er limitations and ensure continuous monitoring [ 18 , 28 , 29 , 43 , 44 ]. Fusion with v ery-high-resolution commercial sensors like PlanetScope ( 3 m, daily revisit) is also used to enhance spatial detail [ 45 – 47 ], and combining Sentinel-2 with Landsat-8 data creates denser time series for more robust phenological analysis through initiatives like the Har monized Landsat Sentinel-2 (HLS) product [ 4 , 43 , 47 , 48 ]. T ables 1 and 2 provide detailed comparisons of key satellite platforms and t heir spectral characteristics, while Figure 2 illustrates the spatial, spectral, and temporal trade-offs between these systems. Agr icultural monitor ing advantages of Sentinel-2, Landsat 9, and PlanetScope are summar ized in Appendix B. T able 1 Comparison of satellite platf orms f or crop monitor ing [ 49 – 51 ]. Characteristic Sentinel-2 Landsat 9 PlanetScope Spatial Resolution 10, 20, 60 m 15, 30, 100 m 3 m T emporal Resolution 10 days (single) 16 days ∼ 1 day 5 days (combined) 8 days (wit h L8) Spectral Bands 13 bands 11 bands 4 bands Ke y Spectral Features Red-edg e Thermal IR RGB + NIR SWIR bands Panchr omatic Sw ath Width 290 km 185 km 24 km Data A vailability Free Free Commercial Launch Date 2015/2017 2021 2016-ongoing 3.2. Modeling Approaches for Yield Estimation The wealth of data from Sentinel-2 has catalyzed the development and application of diverse modeling framew orks for yield estimation, which can be broadl y categor ized into empirical, process-based (or hybrid), and data fusion approaches. A foundational method inv olv es empirical statistical models, which establish direct relationships between remote sensing observations and ground-measured yield [ 4 , 52 ]. Simple and multiple linear regressions using VIs as input features are common but are often limited by t heir inability to capture the complex, non-linear dynamics of crop growth [ 2 , 23 , 52 , 53 ]. Consequentl y , there has been a significant shif t tow ards machine learning (ML) and deep lear ning (DL) algorit hms, which now dominate the literature [ 4 , 23 , 25 , 28 , 54 ]. These dat a-driven models ex cel at lear ning complex, non-linear patter ns from larg e dat asets [ 4 , 52 , 54 ]. Random Forest (RF) is among the most widely used algor ithms, consistently demonstrating robust performance in estimating yield f or various crops by integrating satellite dat a wit h environmental variables [ 2 , 18 , 23 , 55 , 56 ]. Other popular methods include Suppor t V ector Mac hines (SVM) [ 2 , 57 ], Boosted Regression T rees [ 2 , 55 ], and various neural networ k architectures [ 58 , 59 ]. Adv anced deep learning models, such as Con volutional Neural N etw orks (CNNs), Recurrent Neural Netw orks (RNNs) like Long Shor t- T er m Memor y (LSTM), and Graph Neural Netw orks (GNNs), are increasingly being used to exploit t he spatio-temporal nature of satellite image time series [ 21 , 22 , 25 , 54 , 60 ]. These models can process ra w spectral bands directly , sometimes outperforming models based on pre-calculated VIs [ 19 , 25 , 33 , 61 , 62 ]. Narimani et al.: Preprint Page 5 of 29 T able 2 Detailed spectral band compar ison for agr icultural applications [ 49 – 51 ]. Spectral Region Band Name Sentinel-2 Landsat 9 PlanetScope Coastal Coastal/Aerosol 442.7 nm (60 m) 443 nm (30 m) – Visible Blue 492.7 nm (10 m) 482 nm (30 m) 490 nm (3 m) Green 559.8 nm (10 m) 562 nm (30 m) 565 nm (3 m) Red 664.6 nm (10 m) 655 nm (30 m) 665 nm (3 m) Red-Edg e Red-Edg e 1 704.1 nm (20 m) – – Red-Edg e 2 740.5 nm (20 m) – – Red-Edg e 3 782.8 nm (20 m) – – Near -Infrared NIR 832.8 nm (10 m) 865 nm (30 m) 865 nm (3 m) Narrow NIR 864.7 nm (20 m) – – W ater V apour W ater V apour 945.1 nm (60 m) – – Cirr us Cir r us 1373.5 nm (60 m) 1375 nm (30 m) – Shortwa ve IR S WIR 1 1613.7 nm (20 m) 1610 nm (30 m) – SWIR 2 2202.4 nm (20 m) 2200 nm (30 m) – Panchr omatic Panchr omatic – 590 nm (15 m) – Thermal IR TIR 1 – 10.8 𝜇 m (100 m) – TIR 2 – 12.0 𝜇 m (100 m) – The implementation of these dat a-intensive approaches has been greatly facilitated by cloud computing platforms like GEE, which enable the processing of vast archives of Sentinel-2 data at scale [ 18 , 19 , 30 , 56 , 63 ]. Hybrid approaches combine the mechanis tic insights of process-based crop gro wth models (CGMs) wit h the spatial explicitness of remote sensing data t hrough data assimilation [ 1 , 5 , 12 , 26 , 64 ]. In this framew ork, Sentinel-2 derived biophy sical variables, most commonl y LAI [ 5 , 26 , 64 – 66 ], are used to calibrate or update the state variables of models like WOFOS T, SAFY , APSIM, or AquaCrop [ 5 , 12 , 26 , 64 , 65 ]. This integ ration cor rects the model’ s simulation trajectory with real-world obser vations, impro ving the accuracy and spatial detail of yield estimations [ 12 , 26 , 65 ]. Some studies hav e also demonstrated a "hybrid-hybrid" approach, where the outputs from a dat a assimilation framewor k are f ed into an ML model for a final yield estimation, which can furt her improv e accuracy [ 29 , 67 ]. Finall y , a prominent trend is the use of multi-modal data fusion within a single model [ 21 , 60 ]. The most common strategy inv olv es fusing Sentinel-2 optical data with Sentinel-1 S AR data to ensure continuous obser vation regardless of cloud cover , which is critical in many agr icultural regions [ 18 , 28 , 29 , 43 , 68 ]. Models also frequently integrate ancillar y data such as weather and climate records (e.g., temperature, precipitation), soil proper ties (e.g., texture, organic carbon), and topographic information (e.g., elevation, slope) to provide a more holistic representation of the drivers of yield variability [ 12 , 18 , 21 , 23 , 56 ]. Figure 3 illus trates the dis tribution and co-occurrence patterns of these modeling approaches, while T able 3 provides a comprehensiv e summar y of representative studies across different model categor ies. 3.3. V egetation Indices, Data F eatures, & Regions A wide array of features der ived from Sentinel-2 and other sources are used as input f eatures in yield estimation models. The most common are V egetation Indices (VIs), which are mathematical combinations of spectral bands designed to enhance the veg etation signal [ 4 , 6 , 52 , 69 , 70 ]. The NDVI is t he most widely used VI, of ten serving as a baseline for performance compar ison [ 2 , 12 , 19 , 59 , 71 ]. Howe ver , its tendency to saturate in dense canopies is a well-documented limitation [ 2 , 19 , 32 , 55 ]. T o ov ercome this, researc hers increasingly fa vor indices that lev erage Sentinel-2’ s red-edge bands, which are more sensitive to high lev els of chlorophy ll and biomass [ 20 , 38 , 39 , 41 , 72 ]. Prominent red-edge indices include the Normalized Difference Red-Edge Index (NDRE) [ 25 , 56 , 73 – 75 ], MERIS (Medium Resolution Imaging Spectrometer) Terrestrial Chloroph yll Index (MTCI) [ 76 ], and various forms of the Chlorophy ll Index Red-Edge (CIred-edge) [ 4 ]. A nov el index, the Triple Red-Edge Index (TREI), which utilizes all three of Sentinel-2’ s red-edge bands, has also been proposed to better capture the slope of t he red-edge region [ 20 ]. Other frequentl y used VIs include the Green NDVI (GNDVI) [ 2 , 12 , 16 , 37 , 71 ], which can be more sensitive t han NDVI in cert ain conditions [ 16 ], and indices that adjust f or soil background effects, such as the Soil- Adjus ted V ege tation Inde x (SA VI) [ 6 , 16 , 75 , 77 ] and its variants. W ater-sensitiv e indices like t he Normalized Difference W ater Index (NDWI) or Moisture Index (NDMI) are also used, par ticularly for assessing drought stress [ 16 , 19 , 25 , 56 , 71 ]. Bey ond VIs, models lev erage a diverse set of input features. Many studies use t he ra w spectral reflectance bands directly as input features for ML/DL models, which can sometimes pro vide better per f or mance than VIs by av oiding information loss Narimani et al.: Preprint Page 6 of 29 Figure 2: Satellite platf orm comparison f or crop monitor ing. (A) Spatial resolution comparison showing the same ag ricultural area near Scott City , Kansas (38.51838 ° N, -100.91645 ° W) as captured by Landsat 9 (30 m), Sentinel-2 (10 m), and PlanetScope (3 m), demonstrating the trade-offs between spatial detail and cov erage. (B) Spectral band comparison illustrating the wa velength cov erage and bandwidth of each platf orm ov erlaid on a typical healthy vege tation reflectance curve (order matches panels A and C). (C) T emporal resolution comparison showing the acquisition frequency of each platf or m over a year , emphasizing the different revisit capabilities f or continuous crop monitoring. [ 19 , 25 , 60 – 62 ]. Bioph ysical parameters, especiall y LAI, are critical f eatures, either used as direct inputs or assimilated into CGMs [ 5 , 26 , 64 – 66 ]. These are of ten retrieved using dedicated processors like t he SNAP Biophysical Processor [ 2 , 14 , 25 , 78 , 79 ]. Some studies also incor porate texture features derived from high-resolution imagery to capture canopy structure [ 73 ]. A cr ucial component f or many models is the extraction of phenological metrics from the time ser ies of VIs or spectral bands, such as t he timing of peak g reenness, growing season length, or rates of g reen-up and senescence [ 18 , 36 , 43 , 80 ]. A more recent f eature, Solar -Induced Chlorophy ll Fluorescence (SIF), is gaining attention as a more direct proxy f or photosynthetic activity than traditional reflectance-based VIs [ 58 , 81 ]. SIF is retr iev ed from t he infilling of atmospher ic oxyg en absor ption bands in t he red–near-infrared region, notably the O2- A band at ∼ 760 nm and the O2-B band at ∼ 687 nm, where chloroph yll fluorescence adds to the radiance measured within these absor ption f eatures. Narimani et al.: Preprint Page 7 of 29 The revie wed literature cov ers a broad geographic scope, with numerous studies f ocusing on major ag ricultural regions in North America (USA, Canada) [ 14 , 21 , 25 , 26 , 65 ], Europe (e.g., Spain, France, Ger many , It aly) [ 2 , 5 , 13 , 63 , 82 ], Asia (e.g., China, India) [ 11 , 23 , 66 , 69 , 83 ], Aus tralia [ 20 , 84 , 85 ], South Amer ica (Brazil, Argentina) [ 21 , 86 , 87 ], and Africa (e.g., Ken ya, Ethiopia, Mali) [ 18 , 34 , 88 – 90 ]. The pr imar y crops studied are cereals, par ticularly wheat [ 2 , 13 , 69 , 82 , 91 ] and maize (corn) [ 2 , 5 , 6 , 19 , 25 ], follo wed by r ice [ 23 , 30 , 63 , 75 , 92 ], soybean [ 16 , 21 , 26 , 65 , 93 ], and other import ant commodity and f orage crops like sugarcane [ 55 , 85 , 87 , 94 , 95 ], potato [ 96 , 97 ], and alfalf a [ 32 , 98 ]. A comprehensive overview of the most commonly used veg etation indices in Sentinel-2 agr icultural applications, including their mathematical f or mulations and required spectral bands, is provided in Appendix C. 4. Discussion 4.1. A chiev ements, Gaps, and Challenges The findings synthesized abov e point to both achiev ements and challeng es. The integration of Sentinel-2 dat a into crop monitoring has marked a significant achie vement in crop yield estimation, fundamentally shifting t he paradigm from coarse, regional-scale assessments to high-resolution, field- and sub-field-level estimations [ 2 , 13 , 16 , 99 ]. A pr imary success has been the demonstrated accuracy of models built on Sentinel-2 data. Across a wide range of crops and geographies, machine learning (ML) and deep lear ning (DL) models hav e consistently achiev ed high coefficients of determination (R ² ) and low er ror rates, of ten explaining ov er 70–80% of yield variability when validated against g round-trut h dat a from combine harvesters [ 2 , 12 , 21 , 26 , 29 ]. This capability enables t he generation of detailed within-field yield maps, which are inv aluable for precision agr iculture applications like creating management zones for variable-rate fertilization and t arg eted ir r igation [ 99 , 100 ]. Furt hermore, the global cov erage and free data policy of the Coper nicus prog ram hav e democratized access, enabling robust yield monitoring not only in larg e-scale commercial f arming systems in Europe and North America but also in complex, heterog eneous smallholder landscapes in Afr ica and Asia [ 11 , 18 , 34 , 88 ]. Despite these successes, sev eral cr itical gaps and challeng es persist, limiting their translation into operational practice. Perhaps the most significant bottleneck is the scarcity of high-q uality , high-resolution ground-tr uth yield data f or model training and validation [ 18 , 34 , 60 , 88 ]. Man y studies rel y on data from combine-har vester yield monitors, which are themselv es prone to significant er rors and req uire e xtensive, non-tr ivial cleaning and post-processing to be reliable [ 2 , 34 , 61 , 101 ]. Alter native ground data, such as farmer sur ve ys, can introduce bias, while precise crop cuts are labor-intensiv e and difficult to scale [ 18 , 34 ]. Such data scarcity is a major constraint for data-hung ry DL models, which require large datasets to per form optimall y [ 11 , 34 , 63 , 102 ]. Methodological challeng es specific to machine lear ning and deep lear ning models, such as ov er fitting when training data are limited and the limited inter pretability of black -box predictions, are also widely reported and limit t he operational deplo yment of t hese approaches. Another challenge is t he inherent limitation of optical sensors. Cloud co ver frequentl y obstr ucts views dur ing cr itical growth per iods, creating temporal gaps in Sentinel-2 time ser ies that can compromise the accuracy of phenological metr ics and yield estimations [ 4 , 11 , 14 , 35 , 43 ]. Even with Sentinel-2’ s high resolution, the mixed pixel problem remains a challenge in small, fragmented fields or intercropped systems common in smallholder agr iculture, where a single pixel may contain multiple crops or non-crop elements, confounding t he spectral signal [ 11 , 13 , 18 , 34 ]. Furt hermore, the timing and transfer ability of yield estimations remain key hurdles. The highest accuracies are typically achie ved using data from late in the growing season (e.g., reproductive or g rain-filling stages), which limits the utility of estimations f or in-season management decisions [ 4 , 25 , 29 , 85 , 103 ]. Moreov er, models often exhibit poor generalizability , performing well in the specific region and year for which they were trained but failing when extrapolated to new years or locations [ 25 , 63 ]. This "domain mismatch" is driven by the complex inter play of genotype, environment, and management (G × E × M) interactions that vary spatially and temporally [ 25 ], a challenge that purely data-dr iven models str uggle to capture without diverse, multi-y ear training data. Figure 4 provides a comprehensive ov er view of these ma jor challeng es and the cor responding solution pat hw a ys that hav e emerg ed in the literature to address them. Narimani et al.: Preprint Page 8 of 29 Figure 3: Overview of modeling approaches f or yield estimation. (A) Hierarchical bar chart showing t he frequency of different modeling approaches org anized by category (Machine Learning, Statistical/Regression, Deep Lear ning, Process-Based/Dat a Assimilation, and Hybrid/Meta-lear ning) across t he review ed studies. (B) Category distribution showing the relative prevalence of each modeling approach famil y in Sentinel-2 yield estimation research. (C) Co-occur rence matrix displaying the frequency of joint usage of the top 10 modeling approaches, revealing common model combinations and co-occurrence patter ns in the literature. T able 3: Summar y of Sentinel-2 yield estimation studies Model Used Data Featur es Crop Region Perf or mance Refer ence Machine Learning Models RF S2 bands/VIs, En- vironmental data Wheat UK RMSE = 0.61 t/ha [ 12 ] RF S2 VIs (Multi- temporal, Phenological) Sugarcane Ethiopia R ² up to 0.84 [ 36 ] ANN, KNN, RF , SVM S2 bands, VIs, SDD Corn Brazil R ² = 0.89; MAE = 0.33; RMSE = 0.42 t/ha [ 86 ] Continued on next page Narimani et al.: Preprint Page 9 of 29 T able 3 – continued from previous page Model Used Data Featur es Crop Region Perf or mance Refer ence RF , KNN, MLR, Decision Tree S1/S2 VIs, T opo- graphic dat a Soybean Hungary R ² = 0.41- 0.89; RMSE = 0.122-0.224 t/ha [ 16 ] RF , SVM, MLR S2 VIs, LAI (RTM-deriv ed) Wheat Spain R ² = 0.89; RMSE = 0.74 t/ha (RF) [ 2 ] RF S2 bands, VIs, SP AD values Car rot Saudi Ara- bia R ² = 0.82; RMSE = 7.8 t/ha [ 104 ] RF Multi-temporal S2/L8 (ND VI primar y) Wheat France R ² ≥ 0.60; RMSE < 7 q/ha [ 105 ] XGBoost S2 VIs (EVI, ND VI), spectral bands Legumes It aly R ² = 0.8756 [ 106 ] Gaussian Kernel Re- gression S2 RDVI, S AR co- herence Rice China R ² = 0.81; RMSE = 0.55 t/ha [ 27 ] MLR, SMR, PLS, RF , SVR Multi-temporal S2/L8 imagery Sugarcane Thailand R ² = 0.79; RMSE = 3.93 t/ha (RFR) [ 107 ] Quantile Lasso, SVM, RF S2 red, red-edge, NIR bands Potato Spain RMSE = 10.94-11.67%; R ² = 0.88-0.93 [ 97 ] RF S2 VIs (GNDVI) Corn Italy R ² = 0.48 (GND VI); R ² ≥ 0.6 (RF) [ 108 ] Stepwise MLR, RF, GWR S2 VIs, T opogra- phy , Rainfall Wheat Spain R ² = 0.83 [ 109 ] MLR, RF , KNN, Boosting S2 reflectance bands, VIs (EVI, NMDI) Durum Wheat Greece R ² > 0.91; RMSE < 360 kg/ha (ML models) [ 110 ] Linear Regression, RF S2 VIs (MTCI, GCVI, ND VI) Maize Ethiopia R ² up to 0.63 (RF with MTCI) [ 76 ] RF S1 SAR, S2 ND VI, S AR -ND VI Spinach Spain R ² = 0.89; Er- ror = 1.4% [ 111 ] MLR, RF S2 bands, 52 VIs, PPI Potato Egypt R ² = 0.734; RMSE = 1.71 kg/m ² (RFR) [ 41 ] Statistical/Regression Models Ba yesian MLR S2 VIs, Cli- matic/T opog raphic data Wheat Iraq R ² = 0.41; RMSE = 0.698 t/ha [ 13 ] Stepwise Linear Re- gression, RF S2 time series, CWR, Climate data Winter Wheat Germany R ² = 0.84; RMSE = 0.56 t/ha [ 19 ] Gaussian Process Regression S2 kND VI time se- ries, GDD Winter cereal Switzerland RMSE = 0.71 t/ha; Rel. RMSE = 7.60% [ 103 ] Continued on next page Narimani et al.: Preprint Page 10 of 29 T able 3 – continued from previous page Model Used Data Featur es Crop Region Perf or mance Refer ence MLR S2 RSIs (GNDVI) Wheat Morocco R ² = 0.53- 0.89; RMSE = 4.29-7.78 q/ha [ 112 ] AutoML (GLM) S2 VIs, S1 SAR in- dices Wheat Ethiopia R = 0.69; RMSE = 0.84-0.98 t/ha [ 113 ] Empirical Regression S2 ND WI compos- ite Winter Wheat Sweden MAE = 0.40 t/ha [ 114 ] Empirical Regression S2 red-edg e, NIR bands Durum wheat T unisia R ² = 0.55- 0.73; RMSE = 3.80-4.90 q/ha [ 39 ] MLR ND VI (S2/L8) Cucumber, Bean, Cor n Honduras Accuracy: 96.74-98.92% [ 115 ] Cor relation-based Regression Models L8/S2 ND VI, S A VI Potato Saudi Ara- bia Er ror: 3.8- 10.2% (S2); R = 0.47-0.65 [ 116 ] Empirical Regression with Phenological Fitting HLS VIs, Surface reflectances, AGDD Winter Wheat Ukraine RMSE = 0.201 t/ha (5.4%); R ² = 0.73 [ 48 ] Empirical Regression S2 VIs (ND VI, MS A VI2, RCI, NDRE) Cotton Uzbekistan R ² up to 0.96; RMSE = 0.21 (NDRE) [ 117 ] Deep Learning Models 3D CNN + LSTM S2 bands, W eather, Soil, DEM Soybean Arg entina, Uruguay , Germany R ² = 0.86 [ 118 ] 3D CNN S2 Sur f ace Reflectance (B2-B4, B8) Rice Spain R ² = 0.92; MAE = 0.223 t/ha; MAPE = 5.78% [ 119 ] 3D-ResN et- BiLSTM S2 bands, VIs, S1 S AR, W eather Soybean United States R ² = 0.791; RMSE = 5.56 Bu/Ac [ 120 ] Process-Based/Data Assimilation Models W OFOST + EnKF Data Assimilation S1 SAR, S2 ND VI, Soil moisture Winter Wheat China R ² = 0.35; RMSE = 934 kg/ha (with D A) [ 121 ] S AFY + EnKF Data Assimilation S2 time-series, LAI (from EVI2) Winter Wheat Sweden R ² = 0.80 (LAI); 70% yield impro vement [ 122 ] Hybrid/Met a-Learning Models Hybrid (VIs + Crop Model Stress Index) S2 VIs, Crop W ater Stress Index Dryland Wheat Australia R ² = 0.91; RMSE = 0.54 t/ha (combined) [ 123 ] Note: Full names of abbreviations are provided in Appendix A. Narimani et al.: Preprint Page 11 of 29 Figure 4: Summary of challenges and solutions in Sentinel-2 yield estimation. A comprehensive table outlining major challenges (e.g., data av ailability , model transf erability), their impact on model per f ormance, and examples of solutions proposed in the literature (e.g., sensor fusion, hybrid modeling). 4.2. Outlook and Future Directions The future of Sentinel-2-based yield estimation is ev olving tow ards more integ rated, intelligent, and robust systems, dr iven by several conv erging trends. The continued adv ancement of deep learning is paramount, with a mov e bey ond standard CNNs and LSTMs tow ard more sophisticated architectures. No vel approaches suc h as Graph Neural Ne tw orks (GNNs) are being e xplored to better model the ir regular spatial structures of agr icultural fields [ 22 ], while attention mec hanisms [ 11 , 21 , 54 , 124 ] and multi-task lear ning framew orks [ 102 ] are being used to enhance f eature extraction and improv e model efficiency , especially with limited ground dat a. Multi-modal data fusion will become standard practice. The synergistic use of Sentinel-2 optical dat a with cloud- penetrating Sentinel-1 S AR imagery is already a dominant strategy for ensur ing continuous, all-weather monitor ing [ 16 , 18 , 28 , 30 , 111 ]. The next frontier is the seamless integ ration of these satellite streams with ancillar y data lay ers—including high- resolution weather f orecasts, dynamic soil properties, topographic information, and management records—within unified modeling framew orks [ 19 , 21 , 63 , 67 , 77 ]. Adaptiv e fusion methods, such as gated fusion networ k s, are emerging to dynamically weigh the contr ibution of each data modality , optimizing estimations based on crop type and environmental context [ 21 ]. A significant paradigm shif t is the mov e tow ards hybrid modeling, which couples the mechanistic understanding of process-based crop gro wth models (CGMs) with the pattern recognition capabilities of ML/DL [ 29 , 67 , 125 ]. Ins tead of relying on purely empir ical relationships, these hybrid systems use Sentinel-2 dat a to calibrate and constrain CGM simulations Narimani et al.: Preprint Page 12 of 29 through data assimilation [ 5 , 12 , 65 , 126 ]. The outputs of these biophysicall y-grounded simulations (e.g., simulated biomass, w ater stress) can t hen serve as pow er ful, mechanisticall y-inf or med features for a final ML estimation model, enhancing both accuracy and interpretability [ 29 ]. This approach also promises to improv e model transferability across different en vironments and years. Figure 5: Evolution and future outlook of Sentinel-2 yield estimation methods. A schematic timeline illustrating the progression from early methods (c. 2016) like simple VI-regressions to cur rent advanced approaches (c. 2020–2024) using ML/DL and dat a fusion, and projecting future trends (c. 2025+) such as operational SIF integration and hybrid CGM-ML systems. Finall y , the field will continue to benefit from t he dev elopment of new dat a features and the sustained commitment to open data and cloud computing. There is growing interest in proxies more directly linked to plant function than traditional VIs, such as Solar-Induced Chlorophy ll Fluorescence (SIF), which offers a direct measure of photosynthetic activity [ 58 , 81 ]. As new satellite missions enhance SIF retriev al, its integ ration is expected to refine yield models furt her . All these advancements will be accelerated b y platf orms like GEE, which democratize access to petabyte-scale archiv es of satellite data and the computational power required for larg e-scale analytics, enabling innovation to continue at a substantial pace [ 18 ]. Figure 5 illustrates this ev olutionary trajectory , sho wing the progression from early simple regression methods to cur rent advanced approaches and projecting future trends tow ard operational SIF integration and hybrid systems. 5. Data A vailability The data that suppor t the findings of this revie w are a vailable in the ar ticles cited in t he reference list. 6. Funding This research received no specific grant from any funding agency in the public, commercial, or not-f or-profit sectors. 7. Declaration of Interests The authors declare no competing interests. Ref erences [1] W eiguo Y u, Dong Li, Hengbiao Zheng, Xia Y ao, Y an Zhu, W eixing Cao, Lin Qiu, Tao Cheng, Y ongguang Zhang, and Y anlian Zhou. Hidym: A high-resolution gross primar y productivity and dynamic harvest index based crop yield mapper. Remote sensing of environment , 311:114301, 2024. Narimani et al.: Preprint Page 13 of 29 [2] Joel Segarra, Jose Luis Araus, and Shawn C Kefauv er. Far ming and eart h observation: Sentinel-2 data to estimate within-field wheat g rain yield. International Jour nal of Applied Earth Obser vation and Geoinformation , 107:102697, 2022. [3] Jianjian Song, Jianxi Huang, Hai Huang, Guilong Xiao, Xuecao Li, Li Li, W ei Su, W enbin Wu, Peng Y ang, and Shunlin Liang. Improving crop yield estimation by unified model parameters and state variable with bay esian inference. A gricultur al and F ores t Meteorology , 355:110101, 2024. [4] Haiyang Zhang, Y ao Zhang, Fanghui T ong, and Minzan Li. A novel winter wheat yield prediction framew ork using fused spatial–temporal-spectral (sts) information from sentinel-2 and landsat 8 via improv ed pix2pix networ k. Computers and Electronics in Agricultur e , 231:109982, 2025. [5] Marjor ie Battude, Ahmad Al Bit ar, David Morin, Jérôme Cros, Mireille Huc, Claire Marais Sicre, V alér ie Le Dantec, and V alér ie Demarez. Estimating maize biomass and yield over large areas using high spatial and temporal resolution sentinel-2 like remote sensing data. Remot e Sensing of Envir onment , 184:668–681, 2016. [6] Riska A yu Pur namasar i, Ry ozo Noguchi, and Tofael Ahamed. Land suitability assessments for yield prediction of cassav a using geospatial fuzzy expert systems and remote sensing. Computers and Electronics in Agricultur e , 166:105018, 2019. [7] Mohammadreza Narimani, Alireza Pour reza, Ali Moghimi, Parastoo Farajpoor, Hossein Jafarbiglu, and Mohsen B Mesgaran. Early detection of branched broomrape (phelipanche ramosa) infestation in tomato crops by using leaf spectral analysis and machine learning. IF AC-P apersOnLine , 59(23):114–119, 2025. [8] Parastoo Farajpoor, Alireza Pourreza, Mohammadreza Narimani, Ahmed El-kereamy , and Matt hew W Fidelibus. Multi-trait spectral modeling for estimating grapevine leaf traits and nutr ients. Plant Phenomics , 2025:100142, 2025. [9] Mohammadreza Narimani, Alireza Pourreza, Ali Moghimi, Mohsen Mesgaran, Parastoo Farajpoor , and Hossein Jafarbiglu. Drone-based multispectral imaging and deep lear ning for timely detection of branched broomrape in tomato farms. In Autonomous Air and Ground Sensing Systems for Ag ricultural Optimization and Phenotyping IX , volume 13053, pages 16–25. SPIE, 2024. [10] Stephan Nebiker , Norman Lack, Mar tin Abächerli, and Simon Läderach. Light-weight multispectral uav sensors and their capabilities for predicting grain yield and detecting plant diseases. The Inter national Arc hives of the Photog ramme tr y, Remote Sensing and Spatial Information Sciences , 41:963–970, 2016. [11] Guilong Xiao, Xue you Zhang, Quandi Niu, Xingang Li, Xuecao Li, Liheng Zhong, and Jianxi Huang. Winter wheat yield estimation at t he field scale using sentinel-2 data and deep lear ning. Computers and Electronics in Ag riculture , 216:108555, 2024. [12] Merr yn L Hunt, George Alan Blackburn, Luis Car rasco, John W Redhead, and Clare S Row land. High resolution wheat yield mapping using sentinel-2. Remote Sensing of Environment , 233:111410, 2019. [13] Sarchil Hama Qader, Chigozie Edson Utazi, Rhorom Pr iyatikanto, Peshaw a Najmaddin, Emad Omer Hama-Ali, Nabaz R Khwarahm, Andrew J T atem, and Jadu Dash. Exploring the use of sentinel-2 datasets and environmental variables to model wheat crop yield in smallholder ar id and semi-arid farming systems. Science of The T otal Envir onment , 869:161716, 2023. [14] Xi jia Zhou, Pengxin W ang, Kevin Tansey , Shuyu Zhang, Hongmei Li, and Huiren Tian. Reconstruction of time ser ies leaf area index for improving wheat yield estimates at field scales by fusion of sentinel-2,-3 and modis imagery . Com puters and Electronics in Ag riculture , 177:105692, 2020. [15] Jian Lu, Jian Li, Hongk un Fu, W enlong Zou, Junrui Kang, Haiwei Y u, and Xinglei Lin. Estimation of r ice yield using multi-source remote sensing data combined with crop growth model and deep learning algor ithm. Ag ricultural and F orest Meteor ology , 370:110600, 2025. [16] Khilola Amankulova, Nizom Farmonov , Khasan Omonov , Mokhigul Abdurakhimov a, and László Mucsi. Integrating the sentinel-1, sentinel-2 and topographic dat a into soybean yield modelling using machine lear ning. Advances in Space Researc h , 73(8):4052–4066, 2024. [17] Mohammadreza Narimani, Alireza Pour reza, Ali Moghimi, Parastoo Farajpoor , Hossein Jafarbiglu, and Mohsen Mesgaran. Branched broomrape detection in tomato farms using satellite imagery and time-series analysis. In Autonomous Air and Ground Sensing Systems for Ag ricultural Optimization and Phenotyping X , volume 13475, pages 237–243. SPIE, 2025. [18] Zhenong Jin, Georg e Azzari, Calum Y ou, Stefania Di Tommaso, Stephen Aston, Marshall Burke, and David B Lobell. Smallholder maize area and yield mapping at national scales with google ear th engine. Remote sensing of envir onment , 228:115–128, 2019. [19] Michael Marszalek, Marco Körner, and Urs Schmidhalter . Prediction of multi-year winter wheat yields at the field le vel with satellite and climatological dat a. Computers and Electronics in A gricultur e , 194:106777, 2022. [20] Dhahi Al-Shammar i, Brett M Whelan, Chen W ang, Robert GV Bramley , and Thomas FA Bishop. Assessment of red-edge based vege tation indices f or crop yield prediction at the field scale across large regions in australia. European Journal of Agr onomy , 164:127479, 2025. [21] Francisco Mena, Deepak Pathak, Hiba Najjar, Cr isthian Sanchez, Patr ick Helber, Benjamin Bisc hke, P eter Habelitz, Miro Miranda, Ja yanth Siddamsetty , Marlon Nuske, et al. Adaptiv e fusion of multi-modal remote sensing dat a for optimal sub-field crop yield prediction. Remote Sensing of Environment , 318:114547, 2025. [22] Oskar Åström, Simon Månsson, Isac Lazar, Magnus Nilsson, Joakim Ekelöf, Andreas Oxenstierna, and Alexandr os Sopasakis. Predicting intra-field yield variations for winter wheat using remote sensing and g raph attention networks. Computers and Electronics in Ag r iculture , 237:110499, 2025. [23] Komal Choudhary, W enzhong Shi, Y Dong, and R Paringer . Random forest for rice yield mapping and prediction using sentinel-2 dat a wit h google earth engine. Advances in Space Researc h , 70(8):2443–2457, 2022. [24] Yining Tang, Ruiheng Zhou, Ping He, Minglei Y u, Hengbiao Zheng, Xia Y ao, T ao Cheng, Y an Zhu, W eixing Cao, and Y ongchao Tian. Estimating wheat g rain yield by assimilating phenology and lai with the wheatgrow model based on t heoretical uncer tainty of remotely sensed obser vation. Ag ricultural and F orest Meteor ology , 339:109574, 2023. [25] Johann Desloires, Dino Ienco, and Antoine Botrel. Out-of-year cor n yield prediction at field-scale using sentinel-2 satellite imagery and machine learning methods. Com puters and Electronics in Ag riculture , 209:107807, 2023. [26] Deborah V Gaso, Allard de Wit, Andres G Berger , and Lammer t Kooistra. Predicting wit hin-field soybean yield variability by coupling sentinel-2 leaf area index with a crop growth model. Ag ricultural and forest meteor ology , 308:108553, 2021. [27] Y eshanbele Alebele, W enhui W ang, W eiguo Y u, Xue Zhang, Xia Y ao, Y ongchao Tian, Y an Zhu, W eixing Cao, and T ao Cheng. Estimation of crop yield from combined optical and sar imagery using gaussian kernel regression. IEEE Jour nal of Selected T opics in Applied Earth Obser vations and Remote Sensing , 14:10520–10534, 2021. [28] Lanxiang Li, Shuai Fu, Jinlong Gao, Tiangang Liang, Senyao Feng, Y unhao Li, Y angjing Xiu, and Y ongjia Hu. Impro ving t he estimation of alfalfa yield based on multi-source satellite dat a and t he synt hetic minor ity ov ersampling strategy . Computers and Electronics in Agricultur e , 236:110497, 2025. [29] Deborah V Gaso, Dilli Paudel, Allard de Wit, Laila A Puntel, Adugna Mullissa, and Lammert Kooistra. Beyond assimilation of leaf area index: Lev eraging additional spectral information using machine lear ning for site-specific soybean yield prediction. Ag ricultural and F orest Meteor ology , 351:110022, 2024. Narimani et al.: Preprint Page 14 of 29 [30] W eiguo Y u, Gaoxiang Y ang, Dong Li, Hengbiao Zheng, Xia Y ao, Y an Zhu, W eixing Cao, Lin Qiu, and T ao Cheng. Improved prediction of r ice yield at field and county levels by synergistic use of sar, optical and meteorological data. A gricultur al and for est meteor ology , 342:109729, 2023. [31] S Mahalakshmi, A Jose Anand, and Pachaiv annan Partheeban. Soil and crop interaction analysis for yield prediction with satellite imager y and deep learning techniques for t he coast al regions. Journal of Envir onmental Management , 380:125095, 2025. [32] Angie L Gámez, Joel Segarra, Thomas V atter, Luis G Santesteban, Jose L Araus, and Iker Aranjuelo. Alfalfa yield estimation using the combination of sentinel-2 and meteorological data. Field Crops Researc h , 326:109857, 2025. [33] Nicoleta Darra, Borja Espejo-Garcia, V assilis Psiroukis, Emmanouil Psomiadis, and Spyros Fountas. Spectral bands vs. vege tation indices: An automl approach for processing tomato yield predictions based on sentinel-2 imagery . Smar t A gricultur al T echnology , 10:100805, 2025. [34] Akiko Elders, Mark L Car roll, Chr istopher SR Neigh, Ant hony Louis D’ Agostino, Chr istopher Ksoll, Margare t R W ooten, and Molly E Brown. Estimating crop type and yield of small holder fields in burkina faso using multi-day sentinel-2. Remote sensing applications: Society and environment , 27:100820, 2022. [35] Jesús Sor iano-González, Eduard Angelats, Maite Martínez-Eixarch, and Carles Alcaraz. Monitoring rice crop and yield estimation with sentinel-2 data. F ield Crops Researc h , 281:108507, 2022. [36] Dimo Dimov , Johannes H Uhl, Fabian Low , and Gezahagn Negash Seboka. Sugarcane yield estimation through remote sensing time series and phenology metr ics. Smar t Agricultur al T echnology , 2:100046, 2022. [37] Pa vlo Kolodiy and Maryna Pidlypna. The improvement of the agr icultural yields forecasting model using the software product "land view er". Geomatics and environmental engineer ing , 14(1), 2020. [38] Lukas Prey and Urs Schmidhalter . Simulation of satellite reflectance data using high-frequency ground based hyperspectral canopy measurements for in-season estimation of grain yield and grain nitrogen status in winter wheat. ISPRS Jour nal of Photogr ammetry and Remot e Sensing , 149:176–187, 2019. [39] Rim Mehdaoui and Makram Anane. Exploit ation of the red-edge bands of sentinel 2 to improv e the estimation of dur um wheat yield in grombalia region (nor theaster n tunisia). International journal of r emote sensing , 41(23):8986–9008, 2020. [40] Omer Gokberk Narin and Say gin Abdikan. Monitor ing of phenological stage and yield estimation of sunflower plant using sentinel-2 satellite images. Geocarto inter national , 37(5):1378–1392, 2022. [41] Mohamed ES Amin, Mohsen Nabil, Mahmoud A Abdelf attah, Elsa yed S Mohamed, and Ali G Mahmoud. Exploitation of sentinel-2 spectral bands and vegetation indices in potato yield estimation. Journal of the Indian Society of Remote Sensing , pages 1–19, 2025. [42] Haiyang Zhang, Y ao Zhang, Xiuhua Li, Minzan Li, and Zezhong Tian. Predicting banana yield at the field scale by combining sentinel-2 time series data and regression models. Applied Engineer ing in Ag r iculture , 39(1):81–94, 2023. [43] Keke Duan, Anton V r ieling, Michael Schlund, Uday Bhaskar Nidumolu, Chr istina Ratcliff, Simon Collings, and Andrew Nelson. Detection and attribution of cereal yield losses using sentinel-2 and weather dat a: A case study in south australia. ISPRS Jour nal of Photogr ammetry and Remot e Sensing , 213:33–52, 2024. [44] Natacha I Kalecinski, Sergii Skak un, Nathan Torbic k , Xiaodong Huang, Belen Franch, Jean-Claude Roger , and Eric V ermote. Crop yield estimation at different growing stages using a synergy of sar and optical remote sensing dat a. Science of Remote Sensing , 10:100153, 2024. [45] Khilola Amankulova, Nizom Farmonov , Parvina Akramov a, Ikrom Tursunov , and László Mucsi. Compar ison of planetscope, sentinel-2, and landsat 8 dat a in soybean yield estimation within-field variability with random forest regression. Heliyon , 9(6), 2023. [46] Jumi Gogoi, Nathaniel K Ne w lands, Zia Mehrabi, Nicholas C Coops, and Na vin Ramank utty . Assessing the per formance of satellite-based models f or crop yield estimation in the canadian prair ies. Canadian Journal of Remote Sensing , 49(1):2252926, 2023. [47] Emily Myers, John Kerekes, Craig Daughtr y , and Andrew Russ. Effects of satellite revisit rate and time-ser ies smoothing method on throughout-season maize yield cor relation accuracy . IEEE Journal of Selected T opics in Applied Earth Obser vations and Remote Sensing , 14:12007–12021, 2021. [48] Sergii Skakun, Er ic V er mote, Belen Franch, Jean-Claude Roger , Nataliia Kussul, Junchang Ju, and Jeffrey Masek. Winter wheat yield assessment from landsat 8 and sentinel-2 data: Incorporating sur face reflect ance, through phenological fitting, into reg ression yield models. Remote Sensing , 11(15):1768, 2019. [49] A Gatti and A Ber tolini. Sentinel-2 products specification document. Rapport technique , pages 4–7, 2015. [50] Jeffrey G Masek, Michael A W ulder, Brian Markham, Joel McCorkel, Christopher J Crawf ord, James Storey , and Del T Jenstrom. Landsat 9: Empow er ing open science and applications through continuity . Remot e Sensing of Envir onment , 248:111968, 2020. [51] Da vid P Roy , Haiyan Huang, Rasmus Houborg, and Vitor S Mar tins. A global analy sis of the temporal av ailability of planetscope high spatial resolution multi-spectral imagery . Remot e Sensing of Envir onment , 264:112586, 2021. [52] Haiyang Zhang, Y ao Zhang, Kaidi Liu, Shu Lan, Tinyao Gao, and Minzan Li. Winter wheat yield prediction using integ rated landsat 8 and sentinel-2 veg etation index time-ser ies data and machine lear ning algorithms. Computers and Electronics in Agricultur e , 213:108250, 2023. [53] C Corbar i, I Ben Char fi, A Al Bitar, Drazen Skoko vic, JA Sobr ino, C Perelli, G Branca, and M Mancini. A fully coupled crop-w ater -energy balance model based on satellite data for maize and tomato crops yield estimates: The fest-e wb-safy model. A gricultur al W ater Manag ement , 272:107850, 2022. [54] Shalini Dangi, Sur ya K arthikeya Mullapudi, Chandrav ardhan Singh Raghaw , Shahid Shafi Dar, Mohammad Zia Ur Rehman, and Nagendra Kumar . A multi-temporal multi-spectral attention-augmented deep conv olution neural network wit h contrastive learning for crop yield prediction. Computers and Electronics in Ag r iculture , 239:110895, 2025. [55] Lihong Zhu, Xiangnan Liu, Zheng W ang, and Lingwen Tian. High-precision sugarcane yield prediction by integrating 10-m sentinel-1 vod and sentinel-2 g rvi index es. European Jour nal of Ag ronomy , 149:126889, 2023. [56] Keltoum Khechba, Mariana Belgiu, Ahmed Laamrani, Alfred Stein, Abdelhakim Amazirh, and Abdelghani Chehbouni. The impact of spatiotemporal variability of environmental conditions on wheat yield forecasting using remote sensing dat a and machine lear ning. International Journal of Applied Earth Observation and Geoinformation , 136:104367, 2025. [57] Nguyen- Thanh Son, Chi-Farn Chen, Y oug-Sin Cheng, Piero Toscano, Cheng-Ru Chen, Shu-Ling Chen, Kuo-Hsin Tseng, Chien-Hui Syu, Horng- Y uh Guo, and Yi- Ting Zhang. Field-scale rice yield prediction from sentinel-2 monthly image composites using machine lear ning algorit hms. Ecological informatics , 69:101618, 2022. [58] Xiaoy an Kang, Changping Huang, Lifu Zhang, Huihan W ang, Ze Zhang, and Xin Lv . Regional-scale cotton yield forecast via data-driven spatio- temporal prediction (stp) of solar-induced chloroph yll fluorescence (sif). Remote Sensing of Environment , 299:113861, 2023. [59] Maheen A yub, Najeed Ahmed Khan, and Rana Zeeshan Haider . Wheat crop field and yield prediction using remote sensing and machine learning. In 2022 2nd International Conference on Ar tificial Intelligence (ICAI) , pages 158–164. IEEE, 2022. Narimani et al.: Preprint Page 15 of 29 [60] Hamid Kamangir, Brent S Sams, Nick Dokoozlian, Luis Sanchez, and J Mason Earles. Large-scale spatio-temporal yield estimation via deep learning using satellite and management data fusion in vineyards. Computers and Electronics in Ag r iculture , 216:108439, 2024. [61] Gregor Perich, Mehmet Ozgur Tur koglu, Lukas V alentin Graf, Jan Dirk W egner, Helge Aasen, Achim W alter, and Frank Liebisch. Pixel-based yield mapping and prediction from sentinel-2 using spectral indices and neural networ ks. Field Crops Researc h , 292:108824, 2023. [62] Y afit Cohen, Amit Malka, Y onatan Goldwasser , Elia Scudiero, Eitan Goldshtein, Ohaliav Keisar, Guy Lidor, and Gilad Ravid. Leveraging satellite imagery and yield records to assess in-season maize field functionality with machine learning classification. Computers and Electronics in Ag riculture , 238:110809, 2025. [63] Giorgio Impollonia, Michele Croci, and Stefano Amaducci. U pscaling and downscaling approaches for early season rice yield prediction using sentinel-2 and machine lear ning f or precision nitrogen fertilisation. Computers and Electronics in Agricultur e , 227:109603, 2024. [64] Yinf ang Shi, Zhaoyang W ang, Cheng Hou, and Puhan Zhang. Y ield estimation of ly cium barbar um l. based on the wof ost model. Ecological Modelling , 473:110146, 2022. [65] Deborah V Gaso, Allard de Wit, Sytze de Br uin, Laila A Puntel, Andres G Berger , and Lammer t Kooistra. Efficiency of assimilating leaf area index into a soybean model to assess within-field yield variability . European journal of agr onomy , 143:126718, 2023. [66] W ANG Chao, HE Peng, JING Y ao-dong, Y ANG Wu-de, et al. Winter wheat yield estimation based on assimilated sentinel-2 images wit h the ceres-wheat model. Journal of Integr ative Ag riculture , 20(7):1958–1968, 2021. [67] Deborah V Gaso, Laura Elena Cue La Rosa, Laila A Puntel, Juan I Rattalino Edreira, Allard de Wit, and Lammert Kooistra. Predicting spatial and temporal variability in soybean yield using deep lear ning and open source data. European Jour nal of Agr onomy , 164:127498, 2025. [68] Pierre C Guillevic, Benjamin Aouizerats, Rogier Burger , Nadja Den Besten, Daniel Jackson, Margot Ridder ikhoff, Ar iel Zajdband, Rasmus Houborg, Trenton E Franz, G Philip Robertson, et al. Planet ’s biomass proxy for monitor ing aboveground agr icultural biomass and estimating crop yield. Field Crops Resear ch , 316:109511, 2024. [69] Enhui Cheng, Bing Zhang, Dailiang Peng, Liheng Zhong, Le Y u, Y ao Liu, Chenchao Xiao, Cunjun Li, Xiaoyi Li, Y ue Chen, et al. Wheat yield estimation using remote sensing data based on machine lear ning approaches. F rontiers in Plant Science , 13:1090970, 2022. [70] Md Monir ul Islam, Shusuke Matsushita, Ry ozo Noguchi, and Tof ael Ahamed. Dev elopment of remote sensing-based yield prediction models at t he maturity st age of boro r ice using parametr ic and nonparametric approaches. Remote Sensing Applications: Society and Envir onment , 22:100494, 2021. [71] Maximilian Schwarz, Windpanga Ar istide Ouedraogo, Issouf Traore, Charlotte Mueller, Ali Sie, Sandra Bar teit, Isabel Mank, Florian Siegert, Rainer Sauerborn, and Jonas Franke. Satellite-based multi-annual yield models f or major food crops at the household field lev el f or nutrition and health research: a case study from the nouna hdss, burkina faso. International Jour nal of Applied Earth Obser vation and Geoinformation , 117:103203, 2023. [72] Y uki Hamada, Colleen R Zumpf, John J Quinn, and Maria Cristina Negr i. Estimating field-lev el perennial bioenergy grass biomass yields using the normalized difference red-edge index and linear regression analysis f or central virginia, usa. Energies , 16(21):7397, 2023. [73] Jiayi Zhang, Y uanyuan Pan, Xi T ao, Binbin W ang, Qiang Cao, Y ongchao Tian, Y an Zhu, W eixing Cao, and Xiaojun Liu. In-season mapping of rice yield potential at jointing stage using sentinel-2 images integrated with high-precision uas dat a. European Journal of Ag ronomy , 146:126808, 2023. [74] Khilola Amankulova, Nizom Farmonov , Uzbekkhon Mukhtorov , and Laszlo Mucsi. Sunflower crop yield prediction by advanced statistical modeling using satellite-der ived vege tation indices and crop phenology . Geocarto international , 38(1):2197509, 2023. [75] Marzhan Sadenov a, Nail Beisekenov , Petar Sabev V arbanov , and Ting Pan. Application of machine learning and neural networ k s to predict the yield of cereals, legumes, oilseeds and forag e crops in kazakhstan. Ag r iculture , 13(6):1195, 2023. [76] Zachary Mondschein, Ambica Paliw al, T esfa ye Shif era w Sida, Jordan Chamberlin, Runzi Wang, and Meha Jain. Mapping field-level maize yields in ethiopian smallholder systems using sentinel-2 imagery . Remote Sensing , 16(18):3451, 2024. [77] Krishna Prasad Devkota, Abdelkrim Bouasr ia, Mina Devkota, and Vinay Nangia. Predicting wheat yield gap and its determinants combining remote sensing, machine lear ning, and sur vey approaches in rainf ed mediterranean regions of morocco. European Jour nal of Agr onomy , 158:127195, 2024. [78] T omas Persson, Francisco Javier Ancin Murguzur, Corine Davids, Mats Höglind, and Marit Jørgensen. Combining satellite-sensed and g round data and t he basg ra model to predict grass yield in high-latitude regions. F ield Crops Researc h , 318:109610, 2024. [79] Anna Pelosi, Oscar Rosario Belfiore, Guido D’Urso, and Giovanni Battista Chirico. Assessing crop water requirement and yield by combining era5-land reanalysis data with cm-saf satellite-based radiation data and sentinel-2 satellite imager y . Remote Sensing , 14(24):6233, 2022. [80] Dorijan Radovčaj, Ivan Plaščak, and Mladen Jurišić. Phenology-based maize and soybean yield potential prediction using machine lear ning and sentinel-2 imagery time-ser ies. Applied Sciences , 2025. [81] Xiaoy an Kang, Changping Huang, Lifu Zhang, Ze Zhang, and Xin Lv . Downscaling solar-induced chlorophy ll fluorescence for field-scale cotton yield estimation by a tw o-step conv olutional neural netw ork. Computers and electronics in agriculture , 201:107260, 2022. [82] Zdeněk Jelínek , Jitka Kumhálová, Jan Chyba, Mar ie W ohlmuthová, Mikuláš Madaras, and František Kumhála. Landsat and sentinel-2 images as a tool f or the effective estimation of winter and spr ing cultivar g rowth and yield prediction in t he czech republic. International Ag rophy sics , 34(3):391–406, 2020. [83] Akshar Tripathi, Reet Kamal Tiwari, and Surya Prakash Tiw ari. A deep lear ning multi-lay er perceptron and remote sensing approach for soil health based crop yield estimation. International Journal of Applied Earth Obser vation and Geoinformation , 113:102959, 2022. [84] James Brinkhoff, Allister Clarke, Brian W Dunn, and Mark Groat. Analysis and forecasting of australian r ice yield using phenology-based aggregation of satellite and weather data. Ag r icultural and F orest Meteor ology , 353:110055, 2024. [85] Y uri Shendryk, Robert Da vy , and Peter Thorburn. Integrating satellite imagery and environmental dat a to predict field-level cane and sugar yields in australia using machine learning. Field Crops Resear ch , 260:107984, 2021. [86] Antonio Alves Pinto, Cr istiano Zerbato, Glauco de Souza Rolim, Marcelo Rodrigues Barbosa Júnior, Luis Fer nando Vieira da Silva, and Romário Porto de Oliveira. Corn grain yield f orecasting by satellite remote sensing and machine-learning models. Agr onomy Journal , 114(5):2956–2968, 2022. [87] T atiana Fernanda Canata, Marcelo Chan Fu W ei, Leonardo Felipe Maldaner, and José Paulo Molin. Sugarcane yield mapping using high-resolution imagery dat a and machine lear ning technique. Remot e Sensing , 13(2):232, 2021. [88] Zhe Guo, Jordan Chamberlin, and Liangzhi Y ou. Smallholder maize yield estimation using satellite data and machine lear ning in ethiopia. Crop and Envir onment , 2(4):165–174, 2023. [89] Gizache w A yalew Tiruneh, Derege T segay e Meshesha, Enye w Adgo, Atsushi Tsuneka wa, Nigussie Haregew eyn, A yele Almaw Fenta, José Miguel Reichert, Temesg en Mulualem Aragie, and Kefyialew Tilahun. Monitoring impacts of soil bund on spatial variation of teff and finger millet yield with sentinel-2 and spectroradiometric data in ethiopia. Heliyon , 9(3), 2023. Narimani et al.: Preprint Page 16 of 29 [90] Da vid B Lobell, Stef ania Di T ommaso, Calum Y ou, Ismael Y acoubou Djima, Marshall Burke, and Talip Kilic. Sight for sorghums: Compar isons of satellite-and g round-based sorghum yield estimates in mali. Remote Sensing , 12(1):100, 2019. [91] Mohsen Y oosefzadeh-Najaf abadi, Dan Tulpan, and Milad Eskandari. Using hybrid ar tificial intelligence and evolutionary optimization algorithms f or estimating soybean yield and fresh biomass using hyperspectral vege tation indices. Remote Sensing , 13(13):2555, 2021. [92] Fatemeh Jafari Say adi, Mohammad Ali Gholami Sefidkouhi, Hemmatollah Pirdashti, and Mojt aba Khoshravesh. Assimilating veg etation indices and canopy cover der ived from remote sensing into the aquacrop model for estimating r ice yield. Irrigation and Drainag e , 74(3):1311–1325, 2025. [93] W alter T Dado, Jillian M Deines, Rinkal Patel, Sang-Zi Liang, and David B Lobell. High-resolution soybean yield mapping across t he us midwest using subfield harvester dat a. Remote Sensing , 12(21):3471, 2020. [94] Rafaella Pironato Amaro, Pier re T odoroff, Mathias Chr istina, Daniel Garbellini Duft, and Ana Cláudia dos Santos Luciano. Performance evaluation of sentinel-2 imagery , agronomic and climatic dat a for sugarcane yield estimation. Computers and Electronics in Ag riculture , 237:110522, 2025. [95] Rafaella Pironato Amaro, Mathias Chr istina, Pier re Todoroff, Guer r ic Le Maire, Peterson Ricardo Fiorio, Ester De Car valho Pereira, and Ana Claudia dos Santos Luciano. Regional model to predict sugarcane yield using sentinel-2 imagery in são paulo state, brazil. Sugar T ech , 27(1):108–118, 2025. [96] Diego Gómez, Pablo Salv ador, Julia Sanz, and José Luis Casanova. New spectral indicator potato productivity index based on sentinel-2 data to improv e potato yield prediction: A machine lear ning approach. International Journal of Remote Sensing , 42(9):3426–3444, 2021. [97] Diego Gómez, Pablo Salvador , Julia Sanz, and José Luis Casanova. Potato yield prediction using machine lear ning techniques and sentinel 2 data. Remote Sensing , 11(15):1745, 2019. [98] Jiang Chen, Tong Yu, Jerome H Cher ney , and Zhou Zhang. Optimal integration of optical and sar data for improving alfalfa yield and quality traits prediction: new insights into satellite-based forage crop monitor ing. Remote Sensing , 16(5):734, 2024. [99] Ahmed Kay ad, Marco Sozzi, Simone Gatto, Brett Whelan, Luigi Sartor i, and Francesco Marinello. T en years of cor n yield dynamics at field scale under digit al ag riculture solutions: A case study from nort h it aly . Computers and Electronics in Ag r iculture , 185:106126, 2021. [100] AS Tsibart, J Dillen, L V an Craenenbroeck, A Elsen, A Postelmans, G van De V en, and W Saey s. Scenar ios for precision nitrogen management in potato: Impact on yield, tuber quality and post-harvest nitrate residues in the soil. Field Crops Resear ch , 319:109648, 2024. [101] Andrei I Girz and Tuomas J Mattila. Within-field variation of crop yield loss from cover crops. Ag ronom y Jour nal , 116(6):2922–2933, 2024. [102] Shenzhou Liu, Di W ang, Haonan Guo, Chengxi Han, and W enzhi Zeng. Mt-cyp-net: Multi-task network for pixel-lev el crop yield prediction under very fe w samples. arXiv pr eprint arXiv:2505.12069 , 2025. [103] Eatidal Amin, Luca Pipia, Santiago Belda, Gregor Per ich, Lukas V alentin Graf, Helge Aasen, Shar i V an Wittenberghe, José Moreno, and Jochem V errelst. In-season forecasting of within-field grain yield from sentinel-2 time series data. International Journal of Applied Ear th Observation and Geoinformation , 126:103636, 2024. [104] Rangasw amy Madugundu, Khalid A Al-Gaadi, ElKamil Tola, Mohamed K Edr r is, Haroon F Edrees, and Ahmed A Alameen. Optimal timing of carrot crop monitor ing and yield assessment using sentinel-2 images: A machine-lear ning approach. Applied Sciences , 14(9):3636, 2024. [105] Rem y Fieuzal, Vincent Bustillo, Da vid Collado, and Gerard Dedieu. Combined use of multi-temporal landsat-8 and sentinel-2 images for wheat yield estimates at the intra-plot spatial scale. Agr onomy , 10(3):327, 2020. [106] Theodoros Petropoulos, Lefter is Benos, Remigio Ber r uto, Gabr iele Miserendino, V asso Marinoudi, Patr izia Busato, Chrysostomos Zisis, and Diony sis Bochtis. Inter pretable machine learning for legume yield prediction using satellite remote sensing data. Applied Sciences , 15(13):7074, 2025. [107] Jaturong Som-ard, Savittri Ratanopad Suwanlee, Dusadee Pinasu, Surasak Kea wsomsee, Kemin Kasa, Nattawut Seesanhao, Sara wut Ninsaw at, Enr ico Borgogno-Mondino, and Filippo Sarvia. Evaluating sugarcane yield estimation in thailand using multi-temporal sentinel-2 and landsat data together with machine-learning algor ithms. Land , 13(9):1481, 2024. [108] Ahmed Kay ad, Marco Sozzi, Simone Gatto, Francesco Marinello, and Francesco Pirotti. Monitoring wit hin-field variability of cor n yield using sentinel-2 and machine lear ning techniq ues. Remote Sensing , 11(23):2873, 2019. [109] Joel Segar ra, Jon González- Torralba, Íker Aranjuelo, Jose Luis Araus, and Shawn C Kef auver . Estimating wheat grain yield using sentinel-2 imagery and exploring topographic f eatures and rainfall effects on wheat performance in navarre, spain. Remote Sensing , 12(14):2278, 2020. [110] Maria Bebie, Chr is Cav alaris, and Ar is Kyparissis. Assessing dur um wheat yield t hrough sentinel-2 imagery: A machine learning approach. Remot e Sensing , 14(16):3880, 2022. [111] Francisco-Ja vier Mesas-Car rascosa, Juan Tomás Arosemena-Jov ané, Susana Cantón-Mar tínez, Fernando Pérez-Porras, and Jorge T orres-Sánchez. Enhancing crop yield estimation in spinach crops using synthetic aper ture radar-derived nor malized difference vegetation index: A sentinel-1 and sentinel-2 fusion approach. Remote Sensing , 17(8):1412, 2025. [112] Hajar Saad El Imanni, Abder razak El Har ti, and Lahcen El Iysaouy . Wheat yield estimation using remote sensing indices derived from sentinel-2 time ser ies and google eart h engine in a highly fragmented and heterogeneous agricultural region. A gr onomy , 12(11):2853, 2022. [113] Andualem Aklilu T esfay e, Berhan Gessesse A wok e, Tesf aye Shifera w Sida, and Daniel E Osgood. Enhancing smallholder wheat yield prediction through sensor fusion and phenology with machine lear ning and deep learning methods. A gricultur e , 12(9):1352, 2022. [114] Omran Alshihabi, Kristin Persson, and Mats Søderstrøm. Easy yield mapping for precision agriculture. Acta Ag riculturae Scandinavica, Section B—Soil & Plant Science , 74(1):2411950, 2024. [115] R Castro Castro. Prediction of yield and diseases in crops using vegetation indices t hrough satellite image processing. In 2024 IEEE T echnology and Engineering Manag ement Society (TEMSCON L ATAM) , pages 1–6. IEEE, 2024. [116] Khalid A Al-Gaadi, Abdalhaleem A Hassaballa, ElKamil Tola, Ahmed G Kayad, Rangaswam y Madugundu, Bander Alblewi, and Fahad Assir i. Prediction of potato crop yield using precision agr iculture techniques. PloS one , 11(9):e0162219, 2016. [117] Shovkat Khodjaev , Ihtiyor Bobojonov , Lena Kuhn, and Thomas Glauben. An accuracy assessment of satellite-based cotton yield estimation using panel dat a reg ression: a case study of uzbekistan. Environment, Development and Sustainability , pages 1–32, 2024. [118] Miro Miranda, Deepak Pathak, Marlon Nuske, and Andreas Dengel. Multi-modal fusion methods with local neighborhood information for crop yield prediction at field and subfield levels. In IGARSS 2024-2024 IEEE International Geoscience and Remote Sensing Symposium , pages 4307–4311. IEEE, 2024. [119] Ruben Fernandez-Beltran, Tina Baidar, Jian Kang, and Filiber to Pla. Rice-yield prediction with multi-temporal sentinel-2 data and 3d cnn: A case study in nepal. Remote sensing , 13(7):1391, 2021. [120] Mahdiyeh Fathi, Reza Shah-Hosseini, and Ar min Moghimi. 3d-resnet-bilstm model: a deep learning model for county-le vel soybean yield prediction with time-series sentinel-1, sentinel-2 imagery , and daymet data. Remote Sensing , 15(23):5551, 2023. [121] W en Zhuo, Jianxi Huang, Li Li, Xiaodong Zhang, Hongyuan Ma, Xinran Gao, Hai Huang, Baodong Xu, and Xiangming Xiao. Assimilating soil moisture retrieved from sentinel-1 and sentinel-2 data into wofos t model to improv e winter wheat yield estimation. Remote Sensing , 11(13):1618, Narimani et al.: Preprint Page 17 of 29 2019. [122] El houssaine Bouras, Per -Ola Olsson, Shangharsha Thapa, Jesús Mallol Díaz, Johannes Albertsson, and Lars Eklundh. Wheat yield estimation at high spatial resolution through the assimilation of sentinel-2 data into a crop growth model. Remote Sensing , 15(18):4425, 2023. [123] Y an Zhao, Andr ies B Potgieter , Miao Zhang, Bingfang Wu, and Graeme L Hammer . Predicting wheat yield at the field scale by combining high- resolution sentinel-2 satellite imagery and crop modelling. Remote Sensing , 12(6):1024, 2020. [124] Mahdiyeh Fathi, Reza Shah-Hosseini, Ar min Moghimi, and Hossein Arefi. Mhra-ms-3d-resnet-bilstm: A multi-head-residual attention-based multi- stream deep learning model f or soybean yield prediction in the us using multi-source remote sensing data. Remote Sensing , 17(1):107, 2024. [125] Garr y Hayman, John W Redhead, Matthew Brown, Ewan Pinnington, France Gerard, Mike Brown, William Fincham, Emma L Robinson, Chr is Huntingf ord, and Richard F Pywell. A framew ork for improv ed predictions of the climate impacts on potential yields of uk winter wheat and its applicability to other uk crops. Climate Ser vices , 34:100479, 2024. [126] Liang Jiang, Feilong Zhang, Jianan Chi, Pingping Y an, Xiangxin Bu, Y ong He, and Tiecheng Bai. Ev aluation of pear orchard yield and water use efficiency at the field scale by assimilating remotely sensed lai and sm into the wof ost model. Computers and Electronics in Ag riculture , 233:110145, 2025. [127] Y uki Hamada, Colleen R Zumpf, Jules F Cacho, DoKy oung Lee, Cheng-Hsien Lin, Ar vid Boe, Emily Heaton, Robert Mitchell, and Mar ia Cristina Negri. Remote sensing-based estimation of advanced perennial g rass biomass yields f or bioenergy . Land , 10(11):1221, 2021. [128] LGT Crusiol, Liang Sun, RNR Sibaldelli, V Felipe Junior, WX Furlaneti, R Chen, Z Sun, D Wuyun, Z Chen, MR Nanni, et al. Strategies f or monitoring within-field soybean yield using sentinel-2 vis-nir-swir spectral bands and machine learning regression methods. Precision Agricultur e , 23(3):1093–1123, 2022. [129] Muhammet Fatih Aslan, Kadir Sabanci, and Busra Aslan. Artificial intelligence techniques in crop yield estimation based on sentinel-2 data: A comprehensive sur vey . Sustainability , 16(18):8277, 2024. [130] Franciele Morlin Car neiro, Ar mando Lopes de Brito Filho, Francielle Morelli Fer reira, Getulio de Freit as Seben Junior, Ziany Neiva Brandão, Rouv erson Pereira da Silva, and Luciano Shozo Shiratsuchi. Soil and satellite remote sensing variables impor tance using machine learning to predict cotton yield. Smart agricultur al technology , 5:100292, 2023. [131] Da vid Fita, Constanza Rubio, Antonio Uris, Sergio Castiñeira-Ibáñez, Belén Franch, Daniel T arrazó-Ser rano, and Alber to San Bautista. Remote sensor images and vege tation indices to optimize rice yield analysis for specific growth stages within extensive data. Applied Sciences , 15(7):3870, 2025. [132] LA Suarez, Melanie Robertson-Dean, J Brinkhoff, and A Robson. Forecas ting car rot yield with optimal timing of sentinel 2 image acquisition. Precision Agricultur e , 25(2):570–588, 2024. [133] Nizom Farmonov , Khilola Amankulova, Jozsef Szatmar i, Jamol Ur inov , Zafar Narmanov , Jakhongir Nosirov , and Laszlo Mucsi. Combining planetscope and sentinel-2 images wit h environmental data for improv ed wheat yield estimation. Inter national Jour nal of Digital Earth , 16(1):847– 867, 2023. [134] Nicoleta Dar ra, Bor ja Espejo-Garcia, Aikater ini Kasimati, Olga Kriezi, Emmanouil Psomiadis, and Spyros Fount as. Can satellites predict yield? ensemble machine learning and statistical analysis of sentinel-2 imagery for processing tomato yield prediction. Sensors , 23(5):2586, 2023. [135] Niwat Bhumiphan, Jura wan Nontapon, Siwa Kaewplang, Neti Srihanu, W erapong Koedsin, and Alfredo Huete. Estimation of rubber yield using sentinel-2 satellite data. Sustainability , 15(9):7223, 2023. [136] Carlos Alber to Matias de Abreu Júnior, George Deroco Martins, Laura Cristina Moura Xavier , Br uno Sérgio Vieira, Rodrigo Bezerra de Araújo Gallis, Eusimio Felisbino Fraga Junior, Rafaela Souza Mar tins, Alice Pedro Bom Paes, Rafael Cordeiro Pereira Mendonça, and João Victor do Nascimento Lima. Estimating coffee plant yield based on multispectral images and machine learning models. A gr onomy , 12(12):3195, 2022. [137] Branisla v Pejak, Predrag Lugonja, Aleksandar Antić, Marko Panić, Miloš Pandžić, Emmanouil Alexakis, Philip Mavr epis, Na weiluo Zhou, Oskar Marko, and Vladimir Crnojević. Soya yield prediction on a within-field scale using machine learning models trained on sentinel-2 and soil data. Remote sensing , 14(9):2256, 2022. [138] Ashmitha Nihar, NR Patel, Ranjeet Singh, and Abhishek Danodia. Satellite-based light use efficiency model for sugarcane yield estimation at field scale. Jour nal of the Indian Society of Remote Sensing , 51(6):1357–1369, 2023. [139] Bryan Alemán-Montes, Alaitz Zabala, Carlos Henr íquez, and Pere Ser ra. Modelling two sugarcane ag ro-industrial yields using sentinel/landsat time-series data and t heir spatial validation at different scales in costa r ica. Remote Sensing , 15(23):5476, 2023. [140] Konstantinos Ntouros, Konstantinos Papatheodorou, Georgios Gkologkinas, and V asileios Dr imzakas-Papadopoulos. A python framew ork for crop yield estimation using sentinel-2 satellite data. Earth , 6(1):15, 2025. [141] Belen Franch, Alber to San Bautista, David Fita, Const anza Rubio, Daniel Tarrazó-Ser rano, Antonio Sánchez, Sergii Skak un, Eric V er mote, Inbal Beck er-R eshef, and Antonio Ur is. Within-field rice yield estimation based on sentinel-2 satellite data. Remot e Sensing , 13(20):4095, 2021. [142] Chengxiu Li, Ellasy Gulule Chimimba, Oscar Kambombe, Luke A Bro wn, T endai P olite Chibarabada, Y ang Lu, Daniela Anghileri, Cosmo Ngongondo, Justin Sheffield, and Jadunandan Dash. Maize yield estimation in intercropped smallholder fields using satellite data in souther n malawi. Remote Sensing , 14(10):2458, 2022. 8. Appendix 8.1. Abbr eviations T able 4: Appendix A: List of abbreviations used in this review Abbr eviation Full Name Machine Learning Models ANN Artificial Neural Netw orks CNN Con volutional Neural Netw ork GLM Generalized Linear Model Continued on next page Narimani et al.: Preprint Page 18 of 29 T able 4 – continued from previous page Abbr eviation Full Name KNN K -Nearest Neighbors LSTM Long Shor t- T erm Memory MLR Multiple Linear Regression RF Random Forest RFR Random Forest Regression SMR Stepwise Multiple Regression SVM Support V ector Machine SVR Support V ector Regression Statistical Methods D A Data Assimilation EnKF Ensemble Kalman Filter GWR Geographically W eighted Regression PLS Partial Least Squares RTM Radiativ e Transf er Model Crop Growth Models S AFY Simple Algor ithm For Yield W OFOST W orld Food Studies Satellite Platforms HLS Harmonized Landsat Sentinel-2 L8 Landsat-8 S1 Sentinel-1 S2 Sentinel-2 S AR Synthetic Aper ture Radar Spectral Bands NIR Near -Infrared RE1 Red-Edg e 1 RE2 Red-Edg e 2 RE3 Red-Edg e 3 SWIR1 Shortwa ve Infrared 1 SWIR2 Shortwa ve Infrared 2 Biophysical Par ameters AGDD Accumulated Gro wing Degree Da ys CWR Crop W ater Requirements DEM Digital Elevation Model GDD Gro wing Degree Da ys LAI Leaf Area Index PPI Potato Productivity Index RSIs Remote Sensing Indices SP AD Soil Plant Analysis Dev elopment P erformance Metrics Bu/Ac Bushels per Acre MAE Mean Absolute Er ror MAPE Mean Absolute Percentage Error Rel. RMSE Relativ e R oot Mean Square Er ror RMSE Roo t Mean Square Er ror V eg etation Indices EVI Enhanced V ege tation Index EVI2 Enhanced V ege tation Index 2 Continued on next page Narimani et al.: Preprint Page 19 of 29 T able 4 – continued from previous page Abbr eviation Full Name GCVI Green Chlorophy ll V egetation Index GND VI Green Normalized Difference V egetation Index kND VI kernel Nor malized Difference V egetation Index MS A VI2 Modified Soil-A djusted V egetation Index 2 MTCI MERIS (Medium Resolution Imaging Spectrometer) T er restrial Chlorophy ll Inde x NDRE Normalized Difference Red-Edg e Index ND VI Normalized Difference V egetation Index ND WI Normalized Difference W ater Index NMDI Normalized Multi-band Drought Index R CI Red-edg e Chlorophy ll Index RD VI Red-edg e Difference V egetation Index S A VI Soil- Adjusted V ege tation Index VIs V egetation Indices AR VI Atmospherically Resistant V egetation Index A WEI Automated W ater Extraction Index BND VI Blue Normalized Difference V egetation Index CCCI Canopy Chlorophy ll Content Index CIRE1 Chlorophy ll Index with Red-edg e 1 CIRE2 Chlorophy ll Index with Red-edg e 2 CIVE Color Index of V ege tation Extraction CVI Chlorophy ll V egetation Index D VI Difference V ege tation Index ExG Excess Green GARI Green Atmospherically Resistant Index GBM2 Green Biomass Index 2 GIPVI Green Infrared Percentage V egetation Index GLI Green Leaf Index IPVI Infrared Percentage V egetation Index IRECI In verted Red Edge Chloroph yll Index ISR In verse Simple Ratio LSWI Land Sur face W ater Index MCARI Modified Chlorophy ll Absorption in Reflectance Index MGVRI Modified Green Red V egetation Index MSI Moisture Stress Index MSR Modified Simple Ratio MTVI2 Modified Triangular V egetation Index 2 NBR Normalized Bur n Ratio NDBI Normalized Difference Built-Up Index NDI45 Normalized Difference Index NDII Normalized Difference Infrared Index NDII2 Normalized Difference Infrared Index 2 NDMI Normalized Difference Moisture Index NDRE1 Normalized Difference Red Edge 1 NDRE2 Normalized Difference Red Edge 2 NIRv Near -Infrared Reflectance of V egetation NLI Non-linear Index NPCI Normalized Pigment Chloroph yll Ratio Index PSRI Plant Senescence Reflectance Index PVI Perpendicular V egetation Index RE-P AP Red Edge Physiological & Architectural Parameter REIP Red-Edg e Position Index REND VI Red Edge Nor malized Difference V egetation Index R GB VI Red Green Blue V egetation Index Continued on next page Narimani et al.: Preprint Page 20 of 29 T able 4 – continued from previous page Abbr eviation Full Name R GVI Rice Growth V egetation Index RI Redness Index S A VI2 Soil Adjusted V egetation Index 2 SR Simple Ratio SRre1 Simple Ratio Red-Edge 1 SRre2 Simple Ratio Red-Edge 2 SRre3 Simple Ratio Red-Edge 3 TCARI Tr ansf or med Chloroph yll Absor ption in Reflectance Index TGI Triangular Greenness Index TVI Tr ansf or med V egetation Index V ARI Visible Atmospher ically Resistant Index VD VI Visible Band Difference V egetation Index WDR VI Wide Dynamic Range V egetation Index WD VI W eighted Difference V egetation Index 8.2. Agricultural Monitoring Adv ant ages T able 5: Appendix B: Agricultural monitoring advantag es by satellite platform Application Sentinel-2 Landsat 9 PlanetScope Crop Monitoring Red-edg e bands for Long-ter m dat a High spatial detail chloroph yll/LAI continuity (50+ years) f or small fields Yield Estimation Optimal spectral Thermal data for Daily monitor ing resolution for VIs stress detection capability Precision Agr iculture Field-le vel mapping Regional assessments Sub-field variability (10-20 m resolution) (3 m resolution) T emporal Cov erage Frequent revisits Consis tent long-ter m Near-dail y cov erage (2-5 day s) archiv e ( ∼ 1 day) Cost Effectiveness Free access Free access Commercial licensing required 8.3. V egetation Indices T able 6: Appendix C: V egetation indices used in Sentinel-2 agr icultural applications and yield estimation studies Index F ormula S2 Bands Refer ence Basic V egetation Indices (Normalized Difference V eg etation Index) ND VI NIR − RED NIR + RED B8, B4 [ 12 ] (Green Nor malized Difference V egetation Index) Continued on next page Narimani et al.: Preprint Page 21 of 29 T able 6 – continued from previous page Index F ormula S2 Bands Refer ence GND VI NIR − GREEN NIR + GREEN B8, B3 [ 12 ] (Simple Ratio) SR NIR RED B8, B4 [ 12 ] (Difference Veg etation Index) D VI NIR − RED B8, B4 [ 127 ] (Blue Normalized Difference V egetation Index) BND VI NIR − BLUE NIR + BLUE B8, B2 [ 128 ] (Non-linear Index) NLI NIR 𝑛𝑎𝑟𝑟𝑜𝑤 − RED NIR 𝑛𝑎𝑟𝑟𝑜𝑤 + RED B8A, B4 [ 129 ] (Infrar ed P ercentag e V ege tation Index) IPVI NIR NIR + RED B8, B4 [ 130 ] (Inver se Simple Ratio) ISR RED NIR B4, B8 [ 130 ] (Green Infrared P ercentag e V ege tation Index) GIPVI NIR NIR + GREEN B8, B3 [ 41 ] Red-Edg e Indices (Normalized Difference Red-Edge Index) NDRE NIR − RE1 NIR + RE1 B8, B5 [ 19 ] (MERIS T errestrial Chlorophyll Index) MTCI RE2 − RE1 RE1 − RED B6, B5, B4 [ 56 ] Continued on next page Narimani et al.: Preprint Page 22 of 29 T able 6 – continued from previous page Index F ormula S2 Bands Refer ence (Chloroph yll Index with Red-edg e 1) CIRE1 NIR RE1 − 1 B8, B5 [ 94 ] (Chloroph yll Index with Red-edg e 2) CIRE2 NIR RE2 − 1 B8, B6 [ 94 ] (Red Edge Normalized Difference V eg etation Index) REND VI NIR − RE2 NIR + RE2 B8, B6 [ 28 ] (Normalized Difference Index) NDI45 RE1 − RED RE1 + RED B5, B4 [ 40 ] (Simple Ratio Red-Edg e 1) SRre1 NIR RE1 B8, B5 [ 40 ] (Simple Ratio Red-Edg e 2) SRre2 NIR RE2 B8, B6 [ 40 ] (Simple Ratio Red-Edg e 3) SRre3 NIR RE3 B8, B7 [ 40 ] (Normalized Difference Red Edge 1) NDRE1 RE2 − RE1 RE2 + RE1 B6, B5 [ 131 ] (Normalized Difference Red Edge 2) NDRE2 RE3 − RE1 RE3 + RE1 B7, B5 [ 131 ] (Green Biomass Index 2) GBM2 RE1 − GREEN RE1 + GREEN B5, B3 [ 41 ] Continued on next page Narimani et al.: Preprint Page 23 of 29 T able 6 – continued from previous page Index F ormula S2 Bands Refer ence (Canopy Chlorophyll Content Index) CCCI 𝑁 𝐷𝑅𝐸 𝑁 𝐷𝑉 𝐼 B8, B4, B5 [ 132 ] Soil-Adjusted Indices (Soil-Adjusted V egetation Index) S A VI 1 . 5( NIR − RED ) NIR + RED + 0 . 5 B8, B4 [ 28 ] (Modified Soil- Adjusted V egetation Index 2) MS A VI2 ( NIR + 1) − 1 2 (2 NIR + 1) 2 − 8( NIR − RED ) B8, B4 [ 133 ] (Soil Adjusted Veg etation Index 2) S A VI2 NIR RED + 0 . 0070 B8, B4 [ 41 ] (Atmospherically Resistant V egetation Index) AR VI NIR − ( RED − BLUE ) NIR + ( RED − BLUE ) B8, B4, B2 [ 127 ] (P erpendicular V eget ation Index) PVI NIR − 𝑎 × RED − 𝑏 𝑎 2 + 1 B8, B4 [ 134 ] (W eighted Difference V ege tation Index) WD VI NIR − 𝑆 × RED B8, B4 [ 134 ] W ater/Moisture Indices (Normalized Difference Water Index) ND WI NIR − SWIR1 NIR + SWIR1 B8, B11 [ 19 ] (Normalized Difference Moisture Index) NDMI NIR − SWIR1 NIR + SWIR1 B8, B11 [ 94 ] Continued on next page Narimani et al.: Preprint Page 24 of 29 T able 6 – continued from previous page Index F ormula S2 Bands Refer ence (Land Sur face Water Index) LSWI NIR − SWIR1 NIR + SWIR1 B8, B11 [ 11 ] (Normalized Difference Infrar ed Index) NDII NIR − SWIR1 NIR + SWIR1 B8, B11 [ 128 ] (Normalized Difference Infrar ed Index 2) NDII2 NIR − SWIR2 NIR + SWIR2 B8, B12 [ 128 ] (Normalized Bur n Ratio) NBR NIR − SWIR2 NIR + SWIR2 B8, B12 [ 135 ] (Normalized Multi-band Drought Index) NMDI NIR − ( SWIR1 − SWIR2 ) NIR + ( SWIR1 − SWIR2 ) B8, B11, B12 [ 129 ] (Moistur e Stress Index) MSI SWIR1 NIR B11, B8 [ 56 ] (Automated W ater Extraction Index) A WEI 4( GREEN − SWIR2 ) − (0 . 25 NIR + 2 . 75 SWIR2 ) B3, B12, B8 [ 129 ] Enhanced/Modified Indices (Enhanced V eg etation Index) EVI 2 . 5( NIR − RED ) NIR + 6 RED − 7 . 5 BLUE + 1 B8, B4, B2 [ 28 ] (Enhanced V eg etation Index 2) EVI2 2 . 5( NIR − RED ) NIR + 2 . 4 RED + 1 B8, B4 [ 123 ] (kernel Normalized Differ ence V eg etation Index) Continued on next page Narimani et al.: Preprint Page 25 of 29 T able 6 – continued from previous page Index F ormula S2 Bands Refer ence kND VI t anh NIR − RED NIR + RED 2 B8, B4 [ 28 ] (Near -Infrar ed Reflectance of V ege tation) NIRv NIR ( NIR − RED ) NIR + RED B8, B4 [ 28 ] (Wide Dynamic Range V egetation Index) WDR VI 0 . 1 × NIR − RED 0 . 1 × NIR + RED B8, B4 [ 124 ] (Red-edg e Difference V ege tation Index) RD VI NIR − RED NIR + RED B8, B4 [ 104 ] (Modified Simple Ratio) MSR NIR RED − 1 NIR RED + 1 B8, B4 [ 32 ] (Modified T riangular V eget ation Index 2) MTVI2 1 . 5 1 . 2( NIR − GREEN ) − 2 . 5( RED − GREEN ) (2 NIR + 1) 2 − (6 NIR − 5 RED ) − 0 . 5 B8, B3, B4 [ 45 ] Chlorophy ll/Biomass Indices (Green Chlorophyll V egetation Index) GCVI NIR GREEN − 1 B8, B3 [ 12 ] (Chloroph yll V egetation Index) CVI NIR × RED GREEN 2 B8, B4, B3 [ 129 ] (Modified Chlorophyll Absorption in Reflectance Index) MCARI ( RE1 − RED − 0 . 2( RE1 − GREEN )) × RE1 RED B5, B4, B3 [ 136 ] (T ransformed Chlorophyll Absorption in Reflectance Index) Continued on next page Narimani et al.: Preprint Page 26 of 29 T able 6 – continued from previous page Index F ormula S2 Bands Refer ence TCARI 3(( RE1 − RED ) − 0 . 2( RE1 − GREEN ) × RE1 RED ) B5, B4, B3 [ 136 ] Visible Light Indices (Excess Green) ExG 2 × GREEN − RED − BLUE B3, B4, B2 [ 137 ] (Visible Atmospherically Resistant Index) V ARI GREEN − RED GREEN + RED − BLUE B3, B4, B2 [ 127 ] (T r iangular Greenness Index) TGI −0 . 5(190( RED − GREEN ) − 120( RED − BLUE )) B4, B3, B2 [ 2 ] (Green Leaf Index) GLI ( GREEN − RED )( GREEN − BLUE ) 2 GREEN + RED + BLUE B3, B4, B2 [ 137 ] (Color Index of V eg etation Extraction) CIVE 0 . 441 RED − 0 . 811 GREEN + 0 . 385 BLUE + 18 . 78745 B4, B3, B2 [ 137 ] (Visible Band Difference V eg etation Index) VD VI 2 GREEN − BLUE − RED 2 GREEN + BLUE + RED B3, B2, B4 [ 138 ] (Redness Index) RI RED − GREEN RED + GREEN B4, B3 [ 139 ] (Normalized Pigment Chlorophyll Ratio Index) NPCI RED − BLUE RED + BLUE B4, B2 [ 41 ] (Modified Green Red Veg etation Index) MGVRI GREEN 2 − RED 2 GREEN 2 + RED 2 B3, B4 [ 41 ] Continued on next page Narimani et al.: Preprint Page 27 of 29 T able 6 – continued from previous page Index F ormula S2 Bands Refer ence (Red Green Blue Veg etation Index) R GB VI GREEN 2 − ( BLUE × RED ) GREEN 2 + ( BLUE × RED ) B3, B2, B4 [ 130 ] Specialized Indices (Red-Edg e P osition Index) REIP 700 + 40 × RED + RE3 2 − RE1 RE2 − RE1 B4, B7, B5, B6 [ 19 ] (Inverted Red Edge Chlorophyll Index) IRECI RE3 − RED RE1 ∕ RE2 B7, B4, B5, B6 [ 11 ] (Red Edge Physiological & Architectur al P aramet er) RE-P AP RE3 − RE1 RE2 × NIR RED B7, B5, B6, B8, B4 [ 140 ] (Green Atmospherically Resistant Index) GARI NIR − [ GREEN − 1 . 7( BLUE − RED )] NIR + [ GREEN − 1 . 7( BLUE − RED )] B8, B3, B2, B4 [ 127 ] (Rice Growth V ege tation Index) R GVI 1 − BLUE − RED NIR + SWIR1 + SWIR2 B2, B4, B8, B11, B12 [ 141 ] (T ransformed V eg etation Index) TVI 0 . 5(120( NIR − GREEN ) − 200( RED − GREEN )) B8, B3, B4 [ 142 ] (Plant Senescence Reflectance Index) PSRI RED − BLUE RE2 B4, B2, B6 [ 129 ] (Normalized Difference Built-Up Index) Continued on next page Narimani et al.: Preprint Page 28 of 29 T able 6 – continued from previous page Index F ormula S2 Bands Refer ence NDBI SWIR1 − NIR SWIR1 + NIR B11, B8 [ 22 ] Note: Full names of abbreviations are provided in Appendix A. A cknow ledgement The authors ackno w ledge the suppor t of t he U niversity of Calif or nia, Da vis f or providing t he resources necessar y to conduct this research. Declarations The authors declare no conflicts of interest. Narimani et al.: Preprint Page 29 of 29
Original Paper
Loading high-quality paper...
Comments & Academic Discussion
Loading comments...
Leave a Comment