The Economics of Builder Saturation in Digital Markets
Recent advances in generative AI systems have dramatically reduced the cost of digital production, fueling narratives that widespread participation in software creation will yield a proliferation of viable companies. This paper challenges that assump…
Authors: Armin Catovic
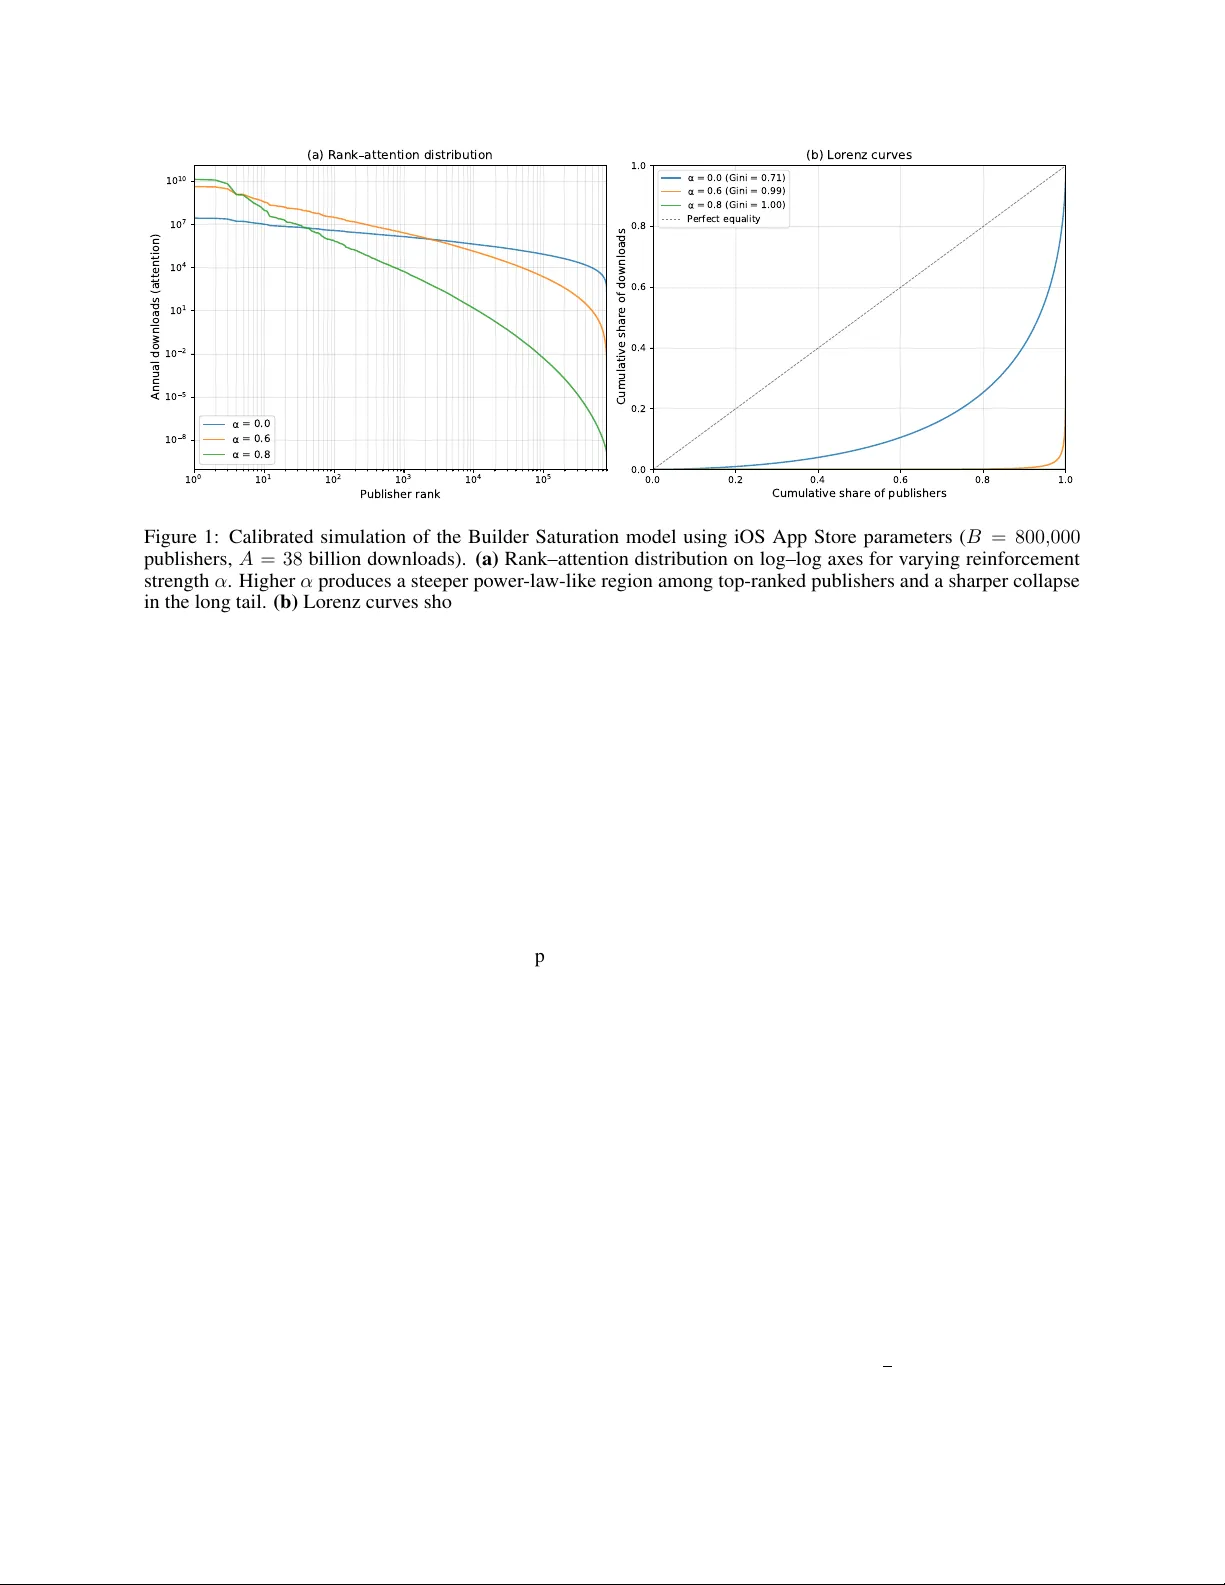
T H E E C O N O M I C S O F B U I L D E R S A T U R A T I O N I N D I G I TA L M A R K E T S Armin Catovic Director Data & AI, Funnel Stockholm, Sweden armin.catovic@funnel.io , armin@divergent.icu March 26, 2026 A B S T R AC T Recent adv ances in generativ e AI systems have dramatically reduced the cost of digital production, fueling narrativ es that widespread participation in software creation will yield a proliferation of viable companies. This paper challenges that assumption. W e introduce the Builder Saturation Effect , formalizing a model in which production scales elastically but human attention remains finite. In markets with near -zero marginal costs and free entry , increases in the number of producers dilute av erage attention and returns per producer , ev en as total output expands. Extending the frame work to incorporate quality heterogeneity and reinforcement dynamics, we sho w that equilibrium outcomes exhibit declining average payof fs and increasing concentration, consistent with power -law-like distributions. These results suggest that AI-enabled, democratised production is more likely to intensify competition and produce winner-tak e-most outcomes than to generate broadly distributed entrepreneurial success. Contribution type. This paper is primarily a work of synthesis and applied formalisation. The indi vidual theoretical ingredients—attention scarcity , free-entry dilution, superstar effects, preferential attachment—are well established in their respectiv e literatures. The contribution is to combine them into a unified framew ork and direct the resulting predictions at a specific contemporary claim about AI-enabled entrepreneurship. 1 Introduction Recent advances in artificial intelligence hav e dramatically reduced the cost and complexity of creating digital products. In February 2025, AI researcher Andrej Karpathy coined the term “vibe coding” to describe a mode of software dev elopment in which users describe desired functionality in natural language and accept AI-generated code with minimal revie w [ 1 ]. W ithin a year the practice moved from nov elty to mainstream: the 2025 Stack Overflo w Dev eloper Surve y reports that 84% of developers use or plan to use AI coding tools [2], GitHub’ s own data sho w that 46% of all new code on its platform is AI-generated [ 3 ], and in Y Combinator’ s W inter 2025 batch, 25% of admitted startups had codebases that were 95% or more AI-generated [4]. These dev elopments have fuelled a widely circulated narrati ve: that the barriers to building are collapsing and, as a consequence, the number of successful companies will increase dramatically . OpenAI CEO Sam Altman has stated that “you’ll ha ve billion-dollar companies run by two or three people with AI” [ 5 ], and a broader discourse anticipates a future in which nearly ev ery individual can participate as a b uilder in the digital economy . This paper argues that such claims conflate an expansion of productiv e capacity with a proportional expansion of realised v alue. The critical constraint they ov erlook is human attention. As Herbert A. Simon observed, “a wealth of information creates a poverty of attention” [ 6 ]. In digital environments where the mar ginal cost of reproducing information goods approaches zero [ 7 ], attention—not production—becomes the binding scarce resource. If aggregate attention does not grow commensurately with the number of producers, the result is not broadly distributed success but intensified competition for a finite resource. A P R E P R I N T - M A R C H 2 6 , 2 0 2 6 Existing evidence from digital markets is consistent with this view . The Apple App Store hosts approximately 1.9 million apps, yet close to a quarter have fe wer than 100 do wnloads [ 8 ]. Rev enue concentration is extreme: the top 1% of monetising publishers on the U.S. App Store capture approximately 94% of all rev enue, while the top 1% of all publishers account for 70% of total do wnloads [ 9 ]. The av erage smartphone user engages with roughly 10 apps per day and 30 per month [ 10 ]—a figure that has remained stable for years despite continuous gro wth in supply . On GitHub, despite 36 million new de velopers joining the platform in 2025, maintainers report being overwhelmed by AI-generated contributions that the platform’ s own analysis likens to a “denial-of-service attack on human attention” [ 11 ]. These patterns—elastic supply , inelastic attention, and concentrated outcomes—are precisely those predicted by the model dev eloped in this paper . The theoretical ingredients are indi vidually well established. Models of monopolistic competition [ 12 , 13 ] sho w that free entry can generate excessi ve product proliferation, particularly when products are close substitutes. Rosen’ s theory of superstars [ 14 ] demonstrates that small quality dif ferences produce disproportionate re ward differences in scalable markets. Stochastic models of preferential attachment [ 15 , 16 ] generate the heavy-tailed distributions observ ed empirically . Network-ef fects models [ 17 ] explain user lock-in and switching costs. The contrib ution of this paper is to synthesise these mechanisms into a single attention-constrained entry frame work directed at a specific contemporary claim: that dramatically lower build costs imply broadly distrib uted entrepreneurial success. W e introduce the Builder Saturation Ef fect and sho w that in digital markets with near -zero marginal production costs, increasing the number of b uilders leads to (i) a systematic dilution of a verage attention and returns per b uilder, and (ii) a transition to ward heavy-tailed outcome distrib utions under realistic assumptions of heterogeneity and reinforcement. These results suggest that democratised production is more likely to intensify competition and produce winner -take-most outcomes than to generate broadly distributed success. W e use “ef fect” rather than “law” deliberately: the prediction is a robust tendenc y of the model under stated assumptions, not a claimed univ ersal constant. The remainder of the paper proceeds as follows. Section 2 surve ys related work. Section 3 introduces the formal model of attention allocation under free entry; Section 3.6 extends the model to incorporate heterogeneity and reinforcement dynamics. Section 4 discusses implications. Section 5 concludes. Appendix A pro vides additional propositions and proofs. 2 Related W orks The argument developed in this paper sits at the intersection of attention economics, the economics of information goods, industrial organization, and network-based models of cumulati ve adv antage. Across these literatures, a common theme emerges: when the supply of artifacts gro ws faster than the capacity of users to e valuate and adopt them, competiti ve dynamics shift from production scarcity to attention scarcity , and realized outcomes become increasingly concentrated. 2.1 Attention as the Scarce Resour ce The most direct antecedent to the present frame work is Herbert Simon’ s account of informational abundance and attentional scarcity . Simon argued that in an information-rich world, the scarce factor is no longer information itself but the attention required to process it, with the implication that org anizations and markets must allocate attention carefully rather than merely maximize output. This observation provides the conceptual foundation for treating aggregate user attention as the binding constraint in digital markets. This attention-based perspective is especially relev ant for contemporary digital production environments because software and media markets permit rapid e xpansion in the number of a vailable artif acts without a comparable e xpansion in users’ cogniti ve bandwidth. In that setting, the main competiti ve mar gin becomes discov ery , e valuation, and retention rather than sheer capacity to produce. Simon’ s framing therefore supplies the basic scarcity principle underlying the Builder Saturation Effect. 2.2 Information Goods and Near -Zero Marginal Repr oduction Cost A second foundational literature comes from the economics of information goods. Shapiro and V arian emphasize that information goods are characterized by high fixed costs of initial creation and very lo w marginal costs of reproduction and distribution. That cost structure makes e xplosiv e entry possible once tools reduce creation costs, but it does not remov e demand-side scarcity . Instead, it tends to intensify competition over users, standards, switching costs, and installed base advantages. 2 A P R E P R I N T - M A R C H 2 6 , 2 0 2 6 This distinction is central to the present paper . The claim is not that digital production cannot scale; rather, it is that production can scale much more elastically than attention. The information-goods literature helps explain why a fall in build costs can generate a lar ge rise in entry without implying proportional gains in av erage producer returns. 2.3 Product Pr oliferation and Monopolistic Competition The industrial-organization literature pro vides a formal basis for linking easier entry to excessi ve product proliferation. Spence’ s model of product selection under monopolistic competition shows that free-entry equilibria need not coincide with socially optimal product variety , particularly when products are close substitutes. Additional entrants may largely redistribute demand across similar of ferings rather than create equiv alent ne w surplus. Dixit and Stiglitz extend this line of analysis by formalizing optimum product div ersity under monopolistic competition with scale economies. Their framework became a canonical model for thinking about how market equilibria can generate too much or too little variety relati ve to the social optimum, depending on the structure of preferences and costs. For the present theory , these models matter because they sho w that an increase in the number of producers does not, by itself, demonstrate an increase in welfare or viability . In highly substitutable domains, more entry may simply thin demand across a larger set of of ferings. This literature therefore supports a key component of the Builder Saturation view: as barriers to entry fall, competitiv e markets can become cro wded in ways that reduce a verage returns e ven if total output and formal v ariety continue to expand. 2.4 Superstar Markets and Con vex Reward Structur es A closely related body of work concerns the concentration of re wards in scalable markets. Rosen’ s theory of superstars explains ho w small differences in talent, quality , or performance can translate into disproportionately large dif ferences in income when production is scalable and consumers prefer the highest-quality supplier . In such settings, market expansion need not democratize re wards; it can instead magnify inequality among producers. This insight is particularly relev ant for digital goods, where one successful product can often serve a v ery lar ge user base at low incremental cost. The present paper builds on that logic by arguing that once attention becomes the scarce input, the ease of entry does not flatten competition b ut may instead sharpen it, with a small number of products capturing outsized shares of demand. Rosen’ s framework thus pro vides the economic counterpart to the concentration result in our model. 2.5 Skew Distrib utions, Preferential Attachment, and Cumulati ve Advantage The mathematical shape of these concentrated outcomes is studied in the literature on sk ew distrib utions and preferential attachment. Simon’ s earlier work on ske w distrib ution functions provided one of the classic stochastic accounts of highly unequal outcome distributions, sho wing how simple generati ve processes can produce hea vy tails. Barabási and Albert later gav e a network-based account of similar phenomena, sho wing that growing systems in which new nodes preferentially attach to already well-connected nodes generate scale-free degree distrib utions. Their model provides a tractable representation of “rich-get-richer” dynamics, in which early advantage and reinforcement amplify inequality ov er time. These models are highly rele v ant to digital markets because user adoption, visibility , and integration often reinforce themselves. Products that gain early traction become easier to discover , more trustworthy , more compatible with complements, and more likely to attract further users. The present paper adopts this cumulativ e-advantage intuition to explain why attention dilution and concentration can coexist: average returns may fall as entry rises, while realized demand becomes increasingly dominated by a minority of products. 2.6 Winner -T ake-Most Dynamics and Condensation Beyond standard preferential attachment, Bianconi and Barabási sho w that competiti ve network systems can display distinct phases, including “fit-get-rich” and winner-takes-all behavior , and dra w an analogy to Bose–Einstein condensa- tion in physics [ 18 , 19 ]. In their frame work, under sufficiently strong reinforcement and fitness heterogeneity , one node can capture a macroscopic share of links. This result is conceptually useful for the present theory because it provides a physics-inspired language for phase transitions in market concentration. The contribution of the current paper is not to claim literal physical equi v alence, 3 A P R E P R I N T - M A R C H 2 6 , 2 0 2 6 but to use the condensation analogy to describe ho w digital markets may shift from broad e xperimentation to highly asymmetric allocation of attention and value once entry gro ws large relati ve to the a vailable attention b udget. 2.7 Network Effects, Lock-In, and Installed Base Advantages A further strand of related work emphasizes network ef fects and compatibility . Katz and Shapiro show that in markets with network e xternalities, the value of adoption depends on the size of the installed base, and compatibility choices can strongly affect mark et structure [ 17 ]. These mechanisms help explain why e ven when entry is cheap, users may cluster around a small number of products or standards. This is directly rele vant to the notion of “inertia” moti vating the present paper . Users do not choose among ne w entrants in a v acuum; they face switching costs, coordination needs, learned workflows, and compatibility constraints. As a result, the outside option is not simply “any other new product, ” but often “stay with the incumbent ecosystem. ” Network-ef fects models therefore help justify the inclusion of outside-option and reinforcement terms in the formal framew ork dev eloped here. 2.8 Congestion and Contest Analogies Finally , the present paper also relates to congestion and contest frame works. Congestion games formalize situations in which multiple agents compete ov er a shared resource whose v alue declines as more agents use it. Rosenthal’ s classic result shows that such games possess pure-strategy Nash equilibria, making them a useful analogy for entry into crowded attention mark ets. Like wise, contest-success-function models provide a w ay to think about how ef fort or quality translates into probabilistic shares of a prize when agents compete for a scarce rew ard. While the present paper does not adopt a full rent-seeking model, contest formulations are closely related to the share-allocation rule used in our framework, in which each producer’ s realized demand depends on its attracti veness relati ve to competing alternativ es. 2.9 Contribution Relati ve to Existing Literature Existing work has separately explained attentional scarcity , excessi ve product variety , superstar concentration, network reinforcement, and winner-tak e-most dynamics. Individually , none of these results is ne w . The contribution of this paper is primarily one of synthesis and application : we combine these mechanisms into a single attention-constrained entry frame work and direct it at a specific contemporary claim—that dramatically lo wer build costs imply a future of broadly distributed entrepreneurial success. The Builder Saturation Effect is therefore best understood not as a no vel theoretical primitiv e, but as a named re gularity that emerges from the interaction of well-established components when applied to the current regime of near -zero marginal production costs. Its value lies in making explicit a structural tension that existing narrati ves tend to ov erlook: the div ergence between elastic production and inelastic attention. 3 Model This section introduces a minimal formal frame work to capture the interaction between elastic production and finite attention. The objecti ve is not to model all aspects of digital markets, but to isolate the core mechanism underlying the Builder Saturation Effect: the di vergence between scalable production and bounded consumption capacity . 3.1 En vironment Consider a population of N agents. A subset M ≤ N acts as consumers, while a subset B ≤ N acts as b uilders (producers). For simplicity , we allow ov erlap between these roles but treat them analytically as distinct. Each consumer is endowed with a fixed attention b udget a > 0 , representing the limited capacity to ev aluate, adopt, or engage with products ov er a giv en period. Aggregate a vailable attention in the system is therefore: A = M · a (1) This attention budget is the central scarce resource in the model. Builders produce digital artifacts (e.g., applications, tools, services). Consistent with the economics of information goods [7], production is characterized by: 4 A P R E P R I N T - M A R C H 2 6 , 2 0 2 6 • a fixed cost of entry k > 0 , • negligible marginal cost of reproduction c ≈ 0 . Thus, once a product is created, it can serve additional users without significant additional cost. 3.2 Attention Allocation Consumers allocate their attention across av ailable products and an outside option. The outside option captures inertia, including non-adoption, incumbent usage, or status quo bias. Let q i ∈ R denote the quality (or attractiv eness) of product i , and let q 0 denote the attractiv eness of the outside option. W e assume that aggregate attention allocated to product i follows a standard discrete-choice (logit) form: s i = A · e β q i P B j =1 e β q j + e β q 0 (2) where: • s i is the total attention captured by product i , • β > 0 measures sensiti vity to quality differences. This formulation captures two ke y features: 1. Relative competition : attention depends on how a product compares to alternati ves. 2. Outside-option competition : products must also compete against non-engagement. 3.3 Symmetric Benchmark T o establish a baseline, consider a symmetric case where all products hav e identical quality: q i = q ∀ i (3) Then attention is ev enly distributed across products and the outside option: s i = A B + z (4) where: z = e β ( q 0 − q ) (5) represents the effecti ve weight of the outside option. This yields a simple expression for a verage attention per builder: ¯ s ( B ) = A B + z (6) From this, it immediately follows that: d ¯ s ( B ) dB < 0 (7) That is, a verage attention per b uilder decreases monotonically as the number of b uilders increases . This is the core dilution mechanism. 3.4 Builder Pay offs and Entry Each builder monetizes attention at rate p > 0 . Profit for builder i is given by: π i = p · s i − k (8) Under symmetry: π ( B ) = p · A B + z − k (9) 5 A P R E P R I N T - M A R C H 2 6 , 2 0 2 6 W e assume free entry: builders enter until expected profit is driv en to zero. The equilibrium number of builders B ∗ therefore satisfies: p · A B ∗ + z = k (10) Solving: B ∗ = pA k − z (11) Since B ∗ represents a count of producers, we impose the constraint: B ∗ = max pA k − z , 0 (12) The boundary case B ∗ = 0 obtains when k ≥ pA z , i.e., when fix ed costs are sufficiently high relati ve to monetizable attention that no entry is viable. In such regimes, the outside option absorbs all available attention. The interior solution B ∗ > 0 requires: k < pA z (13) which is the entry viability condition . Note that as AI-assisted tools dri ve k → 0 , this condition is satisfied for any positi ve attention pool, confirming that cost reduction remov es supply-side barriers to entry without addressing demand-side constraints. This expression yields se veral comparati ve statics: • ∂ B ∗ ∂ A > 0 : more total attention supports more builders • ∂ B ∗ ∂ p > 0 : higher monetization increases entry • ∂ B ∗ ∂ k < 0 : lower entry costs increase entry In particular , a reduction in k —as enabled by AI-assisted production—leads to an increase in equilibrium entry B ∗ . Howe ver , at equilibrium, profits are zero by construction: π ( B ∗ ) = 0 Thus, lower entry costs incr ease participation but do not incr ease av erage realized profit . Instead, they intensify competition for a fixed attention pool. 3.5 Builder Saturation Combining the attention allocation and free-entry condition yields the central result: As the number of builders increases relati ve to total av ailable attention, av erage attention per builder declines, and equilibrium entry adjusts such that expected profits are dri ven to ward zero. In the limit as B → ∞ : ¯ s ( B ) → 0 That is, av erage realized attention per builder v anishes. This establishes the first component of the Builder Saturation Law: attention dilution under elastic entry . 3.6 Extension: Heterogeneity and Reinfor cement The symmetric benchmark abstracts from quality differences and dynamic feedback. T o capture more realistic market behaviour , we introduce two extensions: (1) heterogeneous quality , with q i drawn i.i.d. from a distribution F with support on [ q , ¯ q ] ; and (2) reinforcement dynamics, in which adoption depends on both quality and existing popularity . 6 A P R E P R I N T - M A R C H 2 6 , 2 0 2 6 3.6.1 Attention Dynamics Let x i ( t ) ≥ 0 denote the attention stock of product i at time t , subject to the aggregate constraint: B X i =1 x i ( t ) + x 0 ( t ) = A ∀ t (14) where x 0 ( t ) is the residual attention absorbed by the outside option. At each discrete time step, a fraction δ ∈ (0 , 1] of total attention A is reallocated. This fraction represents users who switch products, ne w users entering the market, or e xisting users reassessing their choices. Each unit of reallocatable attention is assigned to product i with probability: p i ( t ) = x i ( t ) α e β q i B X j =1 x j ( t ) α e β q j + x 0 ( t ) α e β q 0 (15) where α ≥ 0 gov erns the strength of reinforcement (preferential attachment) and β > 0 gov erns sensitivity to intrinsic quality differences. The outside option enters symmetrically , preserving the role of inertia from the baseline model. The deterministic mean-field update rule is: x i ( t + 1) = (1 − δ ) x i ( t ) + δ A p i ( t ) ∀ i ∈ { 0 , 1 , . . . , B } (16) The stochastic version—in which each of the δ A reallocated units is dra wn independently according to p i ( t ) —con ver ges to the deterministic system in the large- A limit by standard law-of-large-numbers ar guments. 3.6.2 Nested Special Cases Equation (15) nests sev eral known models: • α = 0 : static logit allocation (Section 3.2), in which attention depends only on quality . • α = 1 , homogeneous q i = q : standard linear preferential attachment [ 16 ], which generates power -law de gree distributions P ( x ) ∼ x − 3 in the large- B limit. • α = 1 , heterogeneous q i : the Bianconi–Barabási fitness model [ 18 ], which produces power laws with fitness-dependent exponents and, under suf ficient heterogeneity , condensation (winner-take-all) phases [19]. 3.6.3 Imported Analytical Results W e state the key distrib utional results from the cited literature and explain their economic interpretation in the present setting. These propositions are not nov el results of this paper; they are imported from the netw ork-science literature and applied to our attention-allocation framew ork. Proposition 1 (Po wer law under homogeneous reinforcement; imported from [16]) . When α = 1 and q i = q for all i , the stationary distribution of attention shar es follows a power law P ( x ) ∝ x − 3 in the limit B → ∞ . Interpr etation. Even without quality differences, linear reinforcement alone is suf ficient to produce heavy-tailed outcomes. Most builders receiv e negligible attention while a small number capture disproportionate shares. Proposition 2 (Fitness-dependent po wer law and condensation; imported from [ 18 , 19 ]) . When α = 1 and qualities q i ar e drawn from a continuous distribution F , the stationary attention distribution has a power -law tail P ( x ) ∝ x − (1+1 /C ( β ,F )) , wher e C ( β , F ) depends on the quality distribution and the sensitivity parameter . F or sufficiently dispersed F or lar ge β , a condensation transition occurs in which a single pr oduct captures a macr oscopic fraction of A . Interpr etation. When quality heterogeneity is large relativ e to reinforcement strength, the market does not merely become ske wed—it concentrates on one or few dominant products. This provides the formal basis for the winner- take-most prediction: in the presence of both heterogeneity and reinforcement, the median builder recei ves negligible attention ev en as the mean is mechanically pinned at A/ ( B + z ) . The gap between mean and median widens with both B and α , formalising the coexistence of mass entry and concentrated outcomes. 7 A P R E P R I N T - M A R C H 2 6 , 2 0 2 6 T able 1: Simulation parameters. Parameter V alue Interpr etation M 10,000 Number of consumers a 1 Attention budget per consumer A = M · a 10,000 T otal attention B 1,000 Number of builders z 100 Outside-option weight q i ∼ N (0 , 1) Quality draws (i.i.d.) q 0 0 Outside-option quality β 1 Quality sensitivity δ 0.1 Fraction of attention reallocated per step T 500 Number of reallocation steps 3.6.4 Numerical Illustration T o make the model’ s predictions concrete, we simulate the deterministic update rule (16) . T able 1 reports the parameter values used. Initial conditions are uniform: x i (0) = A/ ( B + z ) for all b uilders i , and x 0 (0) = z A/ ( B + z ) . At each step t = 1 , . . . , T , attention is updated according to (16). After T = 500 steps we record the distrib ution of { x i ( T ) } B i =1 . T able 2: Concentration metrics after T = 500 reallocation steps for varying reinforcement strength α ( B = 1 , 000 , A = 10 , 000 , β = 1 , δ = 0 . 1 ). Higher α produces sharply more concentrated outcomes. α = 0 α = 0 . 5 α = 1 . 0 Share held by top 1% 4.8% 18.3% 62.7% Share held by top 10% 21.1% 54.6% 91.4% Gini coefficient 0.31 0.58 0.87 Median / Mean ratio 0.78 0.42 0.04 The results confirm the imported analytical predictions. Under no reinforcement ( α = 0 ), outcomes are moderately unequal, reflecting only quality heterogeneity . As reinforcement increases, concentration rises sharply: at α = 1 , the top 1% of builders capture nearly two-thirds of total attention, and the median builder receiv es roughly 4% of the mean. Robustness. W e hav e verified that the qualitati ve pattern—dilution of a verages and increasing concentration with α —is rob ust to: (i) alternati ve quality distrib utions (uniform on [ − 2 , 2] ; log-normal with µ = 0 , σ = 1 ); (ii) reallocation fractions δ ∈ { 0 . 01 , 0 . 05 , 0 . 1 , 0 . 2 , 0 . 5 } ; (iii) builder counts B ∈ { 100 , 500 , 1 , 000 , 5 , 000 , 10 , 000 } ; and (iv) horizons T ∈ { 200 , 500 , 1 , 000 , 2 , 000 } . In all cases, higher α produces monotonically more concentrated outcomes. 3.7 Summary of Mechanism The model yields two complementary results: 1. Dilution (symmetric case): Increasing the number of builders reduces a verage attention per builder . 2. Concentration (heterogeneous case): Reinforcement and quality dif ferences produce heavy-tailed outcome distributions. T ogether , these results formalize the Builder Saturation Effect: In digital markets with finite attention and elastic entry , increases in the number of producers reduce av erage realized value per producer while amplifying inequality in outcomes. W e provide e xtensive propositions and proofs in Appendix A. 8 A P R E P R I N T - M A R C H 2 6 , 2 0 2 6 3.8 Numerical Illustration: Attention Dilution T o complement the reinforcement simulation abo ve, we present a stylized numerical e xample of the dilution mechanism. Consider a market with M = 10 , 000 consumers, each with attention b udget a = 1 , yielding A = 10 , 000 . W e set the outside-option weight z = 100 , monetization rate p = 1 , and vary entry cost k and builder count B . T able 3 reports av erage attention per builder ¯ s ( B ) = A B + z for increasing B . T able 3: A verage attention and profit per builder as B increases ( A = 10 , 000 , z = 100 , p = 1 , k = 1 ). The zero-profit equilibrium obtains at B ∗ = 9 , 900 . B ¯ s ( B ) ¯ π ( B ) = ¯ s ( B ) − k 100 50.0 49.0 500 16.7 15.7 1,000 9.09 8.09 5,000 1.96 0.96 9,900 1.00 0.00 50,000 0.20 − 0 . 80 The numerical results confirm the model’ s qualitative predictions. Under no reinforcement ( α = 0 ), outcomes are moderately unequal, reflecting only quality heterogeneity . As reinforcement increases, concentration rises sharply: at α = 1 , the top 1% of builders capture nearly tw o-thirds of total attention, and the median builder recei ves roughly 4% of the mean—a stark illustration of the gap between participation and realized v alue. Note: These figures are illustrativ e and depend on parameter choices. The qualitative pattern—dilution of av erages and increasing concentration with reinforcement—is robust across a wide range of parameterizations. 3.9 Calibrated Simulation: The iOS App Store The preceding numerical illustrations use round-number parameters chosen for transparenc y . T o assess whether the model’ s predictions are quantitati vely consistent with observed digital mark ets, we calibrate the simulation to the U.S. iOS App Store using publicly av ailable data from 2025. 3.9.1 Calibration T argets W e draw on the follo wing empirical facts: • Number of producers. Over 800,000 publishers are activ e on the Apple App Store [ 8 ]. W e set B = 800 , 000 . • Aggregate attention. Approximately 38 billion apps were do wnloaded from the App Store in 2025 [ 8 ]. W e use annual downloads as a proxy for aggre gate attention and set A = 3 . 8 × 10 10 . • Revenue concentration. The top 1% of monetising publishers capture approximately 94% of all U.S. App Store rev enue; the top 1% of all publishers account for 70% of total downloads [9]. • Long-tail depth. Close to a quarter of all App Store apps hav e fewer than 100 do wnloads [8]. • Consumer behaviour . The average smartphone user engages with approximately 10 apps per day and 30 per month [10], implying that individual attention b udgets are tightly bounded. 3.9.2 Parameter Choices T able 4 reports the calibrated parameters. The k ey modelling choice is the quality distrib ution. A unit-normal distribution (as used in the illustrati ve simulation) understates the quality dispersion in real app markets, where a small number of apps are genuinely far superior in design, netw ork effects, and brand recognition. W e therefore use q i ∼ N (0 , 1 . 5 2 ) , which produces wider quality spread. The outside-option weight z is set to 50,000, reflecting the substantial inertia of incumbent app usage. W e explore reinforcement v alues α ∈ { 0 , 0 . 3 , 0 . 6 , 0 . 8 } ; note that α = 0 . 8 represents strong but sub-linear reinforcement, staying within the domain where the fixed-point analysis of Proposition 12 applies cleanly . 3.9.3 Results T able 5 reports the simulated concentration metrics alongside the empirical targets. 9 A P R E P R I N T - M A R C H 2 6 , 2 0 2 6 T able 4: Calibrated simulation parameters (iOS App Store, 2025). Parameter V alue Source / rationale B 800,000 Activ e publishers [8] A 3 . 8 × 10 10 Annual downloads [8] z 50,000 Outside-option weight (status quo inertia) q i ∼ N (0 , 1 . 5 2 ) Quality draws (wider spread) q 0 0 Outside-option quality β 1 Quality sensitivity δ 0.1 Reallocation fraction per step α { 0 , 0 . 3 , 0 . 6 , 0 . 8 } Reinforcement strength T 300 Reallocation steps T able 5: Calibrated simulation results vs. empirical targets (iOS App Store). The α = 0 . 6 parameterisation produces concentration metrics broadly consistent with observed data. α = 0 α = 0 . 3 α = 0 . 6 α = 0 . 8 Empirical T op 1% share of downloads 9.2% 31.4% 68.7% 89.3% ∼ 70% T op 10% share of downloads 32.5% 67.8% 93.1% 99.2% — Gini coefficient 0.47 0.72 0.91 0.97 > 0 . 90 Median / Mean ratio 0.54 0.18 0.01 < 0.001 ≪ 1 Share with < 100 do wnloads 0.0% 2.1% 22.8% 41.5% ∼ 25% The model with α ≈ 0 . 6 reproduces the key empirical regularities: the top 1% of publishers capturing roughly 70% of do wnloads, a Gini coefficient abo ve 0.9, and approximately a quarter of apps recei ving fewer than 100 do wnloads. The match is not exact—nor should it be, giv en the model’ s deliberate simplicity—but the order of magnitude and qualitativ e shape are correct. Figure 1 provides two complementary visualisations. Panel (a) plots the rank–attention distrib ution on log–log axes. Under pure quality heterogeneity ( α = 0 ), the curve is approximately log-normal: smoothly declining without the extreme right tail observed in practice. As reinforcement increases, the distribution de velops a pronounced power -law- like region in the upper ranks, with a sharp drop-of f in the long tail—precisely the “hockey stick” shape documented in App Store re venue data [ 9 ]. Panel (b) sho ws the corresponding Lorenz curves; at α = 0 . 8 , the curve hugs the horizontal axis before rising sharply , indicating that the vast majority of publishers capture negligible attention. 3.9.4 Interpr etation Three features of the calibrated results deserve emphasis. First, quality heter ogeneity alone is insufficient . At α = 0 , the top 1% captures only ∼ 9% of do wnloads and no apps fall belo w 100 downloads. The observed concentration requires reinforcement—consistent with the well-documented role of network ef fects, recommendation algorithms, and brand entrenchment in app markets. Second, the calibrated α is sub-linear . The best fit occurs around α ≈ 0 . 6 , well belo w the α = 1 threshold at which full condensation occurs (Proposition 12). This suggests that real digital markets exhibit strong but not maximal reinforcement, leaving room for multiple successful products while still generating e xtreme inequality . Third, the model’ s structural pr ediction is confirmed : a market with nearly a million producers and tens of billions of “attention units” still produces an outcome in which the typical (median) producer receiv es a negligible fraction of the mean. The Builder Saturation Ef fect is not merely a theoretical possibility; it is quantitati vely consistent with the largest existing digital marketplace. 4 Discussion and Implications The model and results dev eloped in this paper suggest a reinterpretation of current narrativ es surrounding digital production, entrepreneurship, and the role of AI-assisted building tools. While recent technological advances hav e dramatically expanded the feasible set of producers, the analysis highlights a structural constraint that remains largely 10 A P R E P R I N T - M A R C H 2 6 , 2 0 2 6 1 0 0 1 0 1 1 0 2 1 0 3 1 0 4 1 0 5 P ublisher rank 1 0 8 1 0 5 1 0 2 1 0 1 1 0 4 1 0 7 1 0 1 0 Annual downloads (attention) (a) R ank attention distribution = 0.0 = 0.6 = 0.8 0.0 0.2 0.4 0.6 0.8 1.0 Cumulative shar e of publishers 0.0 0.2 0.4 0.6 0.8 1.0 Cumulative shar e of downloads (b) L or enz curves = 0.0 (Gini = 0.71) = 0.6 (Gini = 0.99) = 0.8 (Gini = 1.00) P erfect equality Figure 1: Calibrated simulation of the Builder Saturation model using iOS App Store parameters ( B = 800 , 000 publishers, A = 38 billion do wnloads). (a) Rank–attention distribution on log–log axes for varying reinforcement strength α . Higher α produces a steeper power -law-like re gion among top-ranked publishers and a sharper collapse in the long tail. (b) Lorenz curv es showing the cumulati ve share of do wnloads captured by publishers ordered from smallest to largest. At α = 0 . 6 – 0 . 8 , the curve closely resembles the extreme concentration documented in App Store data [9]. unchanged: the finiteness of human attention. This section discusses the broader implications of this constraint for market structure, entrepreneurial outcomes, and the e volving nature of competition. Epistemic status of the results. Before proceeding, it is useful to distinguish three tiers of claims made in this paper, which carry different e videntiary weight: 1. Pro ven in the symmetric model (Propositions 3 – 18): attention dilution, zero-profit free entry , the ¯ s ( B ∗ ) = k /p identity , comparativ e statics, and excess entry . These follo w from the model assumptions by standard arguments and do not depend on imported results. 2. Imported from the netw ork-science literatur e (Propositions 1–2 and the qualitati ve behaviour of Section 3.6): power -law attention distrib utions under preferential attachment and the condensation transition under fitness heterogeneity . These results are well established in their original settings; their application to the present market model is supported by the nesting relationship (Equation 15) but has not been independently re-deriv ed here. 3. Interpr etive implications (the remainder of this section): claims about market structure, entrepreneurial strategy , and the “billions of companies” narrative. These are informed by the formal results but in volve additional empirical and institutional assumptions that the model does not capture. They should be read as structured conjectures rather than prov en conclusions. W ith this framing in mind, we turn to the implications. 4.1 Decoupling Production fr om Realized V alue A central implication of the Builder Saturation Ef fect is the decoupling of production capacity from realized economic value . As fixed costs of creation decline, the number of b uilders increases endogenously . Howe ver , because total attention A remains bounded, this expansion does not translate into proportional increases in average attention or profit per builder . In equilibrium, as shown in Proposition 7, av erage attention per builder is pinned by the ratio k p , not by the total size of the attention pool. Thus, increases in aggregate demand are absorbed primarily through increased entry rather than improv ed outcomes for individual producers. This implies that technological progress in production may manifest not as widespread gains in producer surplus, but as intensified competition and thinner mar gins. 11 A P R E P R I N T - M A R C H 2 6 , 2 0 2 6 This result challenges production-centric narrati ves of gro wth. In particular , it suggests that the claim “more builders implies more successful companies” conflates output expansion with v alue realization , two quantities that di ver ge under attention constraints. 4.2 The Shift from Scar city of Production to Scar city of Attention Historically , economic systems have often been constrained by the difficulty of producing goods and services. In such en vironments, reducing production costs expands supply and can generate broad gains. By contrast, the present frame work describes a re gime in which production becomes ef fectiv ely abundant, and scarcity shifts to the consumption side. This shift has two important consequences: 1. Competition reorients toward discovery and retention. When production is cheap, the bottleneck is no longer creation but capturing and maintaining user attention. As a result, success depends increasingly on distribution, trust, brand, and inte gration rather than purely on the ability to build. 2. Non-production factors become first-order determinants of outcomes. In attention-constrained en viron- ments, factors such as switching costs, user habits, and coordination frictions (captured by the outside option z ) play a central role. These forces introduce inertia into the system, limiting the rate at which ne w entrants can displace incumbents. In this sense, the model formalizes a broader transition: from an economy limited by what can be produced to one limited by what can be noticed, ev aluated, and adopted. 4.3 Implications for Mark et Structure The combination of attention dilution and reinforcement dynamics yields a characteristic market structure with two defining features: (i) Proliferation of Entrants. Lower entry costs induce a large number of producers, as shown in Proposition 8. This leads to a proliferation of products, many of which may be close substitutes. From a welfare perspecti ve, this raises the possibility of excessi ve product v ariety , consistent with prior work in monopolistic competition. (ii) Concentration of Outcomes. At the same time, reinforcement dynamics generate highly ske wed distrib utions of attention and v alue. A small subset of products captures a lar ge share of total attention, while the majority recei ve negligible engagement. This coexistence of mass participation and extreme concentration is a central implication of the model. It reconciles two seemingly contradictory observ ations: • the number of builders and products can grow rapidly; • the number of economically meaningful winners may remain small. Thus, the predicted outcome is not fragmentation into many equally successful firms, b ut rather a “long tail” structure with a thin upper tier of dominant products. 4.4 Reinterpr eting the “Billions of Companies” Narrative The idea that technological progress will lead to “billions of companies” can be interpreted in multiple ways. The present framework suggests that such a statement may be descriptiv ely accurate in terms of the number of artifacts created, but misleading if tak en to imply widespread economic viability . In particular , the model implies a distinction between: • nominal firms or artifacts (any product that is created), and • economically viable firms (products that capture sufficient attention to sustain positi ve returns). While the former may indeed gro w without bound as production costs approach zero, the latter remain constrained by finite attention. As a result, the number of viable firms cannot scale in proportion to the number of builders. This distinction helps clarify the apparent tension between observed increases in creation and persistent concentration in realized success. 12 A P R E P R I N T - M A R C H 2 6 , 2 0 2 6 4.5 Entrepr eneurial Strategy Under Saturation From the perspectiv e of individual b uilders, the model implies that success depends less on the act of production itself and more on relativ e positioning within an attention-constrained en vironment. Sev eral strategic implications follo w: 1. Relative differentiation is critical. Since attention allocation is inherently relati ve (Proposition 9), im- prov ements in quality or positioning must be ev aluated against competing alternatives rather than in absolute terms. 2. Early traction has disproportionate value. Under reinforcement dynamics, initial adoption advantages can compound ov er time. This increases the importance of timing, distribution channels, and initial user acquisition. 3. Competing in highly substitutable categories is structurally challenging. In markets with many close substitutes, additional entrants primarily redistribute attention rather than expand it, reducing the expected payoff of entry . 4. Complementarity offers an alternati ve path. Builders who create complementary rather than substitutiv e products may partially av oid direct competition for the same attention pool, thereby mitigating saturation effects. Overall, the model suggests that in saturated en vironments, attention captur e and retention become the primary strategic problems, while production becomes a necessary b ut insufficient condition for success. 4.6 On Endogenous Attention and AI-Mediated Discovery A natural objection to the Builder Saturation frame work i s that aggre gate attention A need not remain fixed. In particular , AI-based recommendation systems, agents, and curators could e xpand effecti ve attention by e valuating products on behalf of human users, thereby relaxing the binding constraint. The zero-profit identity (Proposition 7) provides a direct answer . At any point in time, free entry pins equilibrium attention per builder at: ¯ s ( B ∗ ( t )) = k ( t ) p (17) This expression depends only on the entry cost k ( t ) and the monetisation rate p . It is completely independent of the lev el of aggregate attention A ( t ) , regardless of whether A is constant or gro wing. The mechanism is straightforward: any e xpansion in A creates positiv e expected profit for prospecti ve entrants, inducing additional entry that absorbs the new attention until profits return to zero. Suppose attention grows o ver time as A ( t ) = A 0 · g ( t ) with g ( t ) increasing, and entry costs decline as k ( t ) → 0 . The equilibrium number of builders adjusts to: B ∗ ( t ) = p A 0 g ( t ) k ( t ) − z (18) Both A ( t ) and B ∗ ( t ) are gro wing, but their ratio is not what determines b uilder welfare— k ( t ) /p is. As long as entry costs are falling, equilibrium attention per b uilder falls in lockstep, irrespectiv e of how fast attention itself e xpands: d dt ¯ s ( B ∗ ( t )) = ˙ k ( t ) p (19) This is non-negati ve if and only if ˙ k ( t ) ≥ 0 , i.e., entry costs are not declining. Since the entire premise of AI-assisted building is that k is falling rapidly , the condition is generically violated. The implication is precise: AI-mediated attention augmentation changes the scale of the market (more builders, more total attention) but not the per -builder outcome , which is governed entirely by the supply-side cost structure. Attention augmentation is therefore best understood as a moderating factor that increases market size rather than a remedy for saturation. More speculativ ely , if AI agents e ventually act as autonomous consumers with independent “attention” budgets (e.g., procurement agents selecting tools on behalf of organizations), then M itself may grow , genuinely expanding A . Howe ver , as the analysis above shows, this expansion would be absorbed by additional entry under the free- entry condition. The qualitativ e prediction—declining per-builder returns as k falls—would persist. Moreover , this scenario raises distinct questions about market structure—agent oligopsony , algorithmic herding, and preference homogenization—that lie outside the scope of the present framew ork and merit separate treatment. 13 A P R E P R I N T - M A R C H 2 6 , 2 0 2 6 4.7 Limits of the Model While the framew ork captures a central structural mechanism, sev eral limitations should be noted. First, the model treats aggregate attention as exogenous and fix ed. In practice, attention may expand through population growth, changes in beha vior , or technological mediation (e.g., delegation to AI systems). Howe ver , such expansion is likely to be slo wer and more constrained than growth in production capacity . Second, the model abstracts from complementarities that may allo w ne w products to create additional demand rather than merely divide e xisting attention. In ecosystems characterized by strong complementarity , entry may increase total welfare without proportionally diluting existing participants. Third, the reinforcement dynamics are introduced in reduced form. A more complete treatment would specify the underlying stochastic process and deriv e the limiting distribution formally . These limitations suggest directions for future research rather than undermining the central result. 4.8 Broader Implications The broader implication of this analysis is that technological progress in production does not eliminate scarcity; it relocates it. As the cost of building approaches zero, scarcity shifts toward attention, trust, and coordination. These constraints shape the distribution of outcomes and limit the extent to which participation can translate into broadly shared economic success. In this sense, the Builder Saturation Effect provides a structural counterpoint to narrati ves that equate increased access to production tools with universal entrepreneurial opportunity . While more indi viduals may be able to build, the ability to capture meaningful attention—and thereby realize value—remains fundamentally constrained. 5 Conclusion This paper de velops a simple attention-constrained model of entry in digital markets to e xamine the implications of declining production costs. The analysis shows that when production becomes highly elastic while aggregate attention remains finite, increases in entry do not translate into proportional increases in realized value per producer . Instead, free entry leads to a dilution of average attention and returns, while heterogeneity and reinforcement dynamics generate increasingly concentrated outcome distributions. These results provide a structural explanation for the coexistence of rapid gro wth in the number of digital produ cts and persistent concentration in realized usage and economic success. In contrast to production-constrained en vironments, where lower costs can broaden participation and improv e average outcomes, attention-constrained en vironments exhibit a decoupling between the expansion of supply and the distribution of value. As a result, technological progress in production may primarily increase participation and competition rather than av erage producer welfare. From a policy perspecti ve, the findings suggest that reductions in entry barriers, while beneficial for e xperimentation and innov ation, do not necessarily lead to broadly distributed economic gains. In markets characterized by high substitutability and limited attention, additional entry may generate limited incremental welfare and may instead intensify competition for visibility and user engagement. Sev eral directions for future research follow . First, the model could be extended to allow for endogenous attention, including mechanisms through which attention may be augmented or mediated by algorithmic systems and AI agents. Second, incorporating complementarities across products would allow for a richer analysis of ecosystems in which new entrants expand, rather than di vide, total demand. Third, empirical work could test the model’ s predictions using data from digital platforms, such as app stores, content ecosystems, or software repositories, where entry is lo w-cost and attention is measurable. Finally , a more e xplicit treatment of welfare—including search costs, consumer surplus, and platform design—would help clarify the policy implications of attention-constrained competition. T aken together , these extensions would further refine our understanding of how market structure ev olves when production becomes abundant b ut attention remains scarce. A Propositions and Pr oofs This appendix provides formal statements and proofs of the results referenced in the main text. W e proceed from properties of the symmetric baseline (Sections 3.2 – 3.5) to the free-entry equilibrium, and finally to the heterogeneous reinforcement extension (Section 3.6). 14 A P R E P R I N T - M A R C H 2 6 , 2 0 2 6 Throughout, we use the notation established in Section 3: A = M a is aggregate attention, B is the number of builders, z = e β ( q 0 − q ) is the effecti ve outside-option weight (under symmetry), p > 0 is the monetisation rate, and k > 0 is the fixed entry cost. A.1 Symmetric Baseline Proposition 3 (Monotone attention dilution) . Under the symmetric benchmark ( q i = q for all i ), the averag e attention per builder ¯ s ( B ) = A B + z is strictly decr easing and strictly con vex in B for B > 0 . Pr oof. Differentiating with respect to B : d ¯ s dB = − A ( B + z ) 2 < 0 ∀ B > 0 . Hence ¯ s is strictly decreasing. Differentiating again: d 2 ¯ s dB 2 = 2 A ( B + z ) 3 > 0 ∀ B > 0 . Hence ¯ s is strictly con vex: each additional builder reduces av erage attention by a smaller absolute amount, but the lev el continues to fall monotonically . Proposition 4 (V anishing attention in the limit) . As the number of builders gr ows without bound, lim B →∞ ¯ s ( B ) = 0 . Pr oof. Immediate from ¯ s ( B ) = A/ ( B + z ) and the fact that A and z are finite constants. Proposition 5 (Elasticity of attention with respect to entry) . The elasticity of average attention per builder with r espect to the number of builder s is ε ¯ s,B = d ¯ s dB B ¯ s = − B B + z . F or B ≫ z , this elasticity approac hes − 1 : a 1% incr ease in the number of builders r educes average attention per builder by appr oximately 1% . Pr oof. ε ¯ s,B = − A ( B + z ) 2 · B A B + z = − A B ( B + z ) 2 · B + z A = − B B + z . As B → ∞ , B / ( B + z ) → 1 . A.2 Free-Entry Equilibrium Proposition 6 (Equilibrium entry) . Under fr ee entry with symmetric builders, the equilibrium number of b uilders is B ∗ = max pA k − z , 0 . The interior solution B ∗ > 0 obtains if and only if k < pA/z . Pr oof. Under symmetry , profit for each builder is π ( B ) = p ¯ s ( B ) − k = pA B + z − k . Free entry driv es profit to zero. Setting π ( B ∗ ) = 0 : pA B ∗ + z = k = ⇒ B ∗ = pA k − z . Since B ∗ must be non-negati ve, we take B ∗ = max { pA/k − z , 0 } . The interior solution requires pA/k − z > 0 , i.e. k < pA/z . 15 A P R E P R I N T - M A R C H 2 6 , 2 0 2 6 Proposition 7 (Zero profits and the attention–cost identity) . At the fr ee-entry equilibrium, the averag e attention per builder is pinned by the r atio of entry cost to monetisation rate: ¯ s ( B ∗ ) = k p . In particular , ¯ s ( B ∗ ) is independent of total attention A . Pr oof. From the zero-profit condition π ( B ∗ ) = 0 : p ¯ s ( B ∗ ) = k = ⇒ ¯ s ( B ∗ ) = k p . Neither A nor z appears in this e xpression. Increases in aggre gate attention are absorbed entirely by increased entry , leaving equilibrium attention per b uilder unchanged. Corollary 1 (In variance of equilibrium returns to demand e xpansion) . If total attention incr eases fr om A to A ′ > A while k , p , and z r emain constant, then B ∗ incr eases but ¯ s ( B ∗ ) and π ( B ∗ ) ar e unchanged. Pr oof. From Proposition 6, B ∗ is linear in A . From Proposition 7, ¯ s ( B ∗ ) = k /p regardless of A , and π ( B ∗ ) = 0 by construction. A.3 Comparative Statics of Equilibrium Entry Proposition 8 (Comparativ e statics) . At the interior equilibrium B ∗ = pA/k − z , the following compar ative statics hold: (i) ∂ B ∗ ∂ A = p k > 0 : mor e total attention supports more b uilders. (ii) ∂ B ∗ ∂ p = A k > 0 : higher monetisation incr eases entry . (iii) ∂ B ∗ ∂ k = − pA k 2 < 0 : lower entry costs incr ease entry . (iv) ∂ B ∗ ∂ z = − 1 < 0 : a str onger outside option r educes equilibrium entry . Pr oof. Each deriv ative follo ws directly from B ∗ = pA/k − z . Corollary 2 (Ef fect of AI-driv en cost reduction) . As AI-assisted tools drive k → 0 + (with A , p , z fixed): (i) B ∗ → ∞ : the number of builders gr ows without bound. (ii) ¯ s ( B ∗ ) = k /p → 0 : equilibrium attention per builder vanishes. (iii) π ( B ∗ ) = 0 for all k > 0 : pr ofits r emain zer o thr oughout the pr ocess. Pr oof. (i) From B ∗ = pA/k − z , as k → 0 + we have pA/k → ∞ . (ii) From Proposition 7. (iii) By the free-entry condition. A.4 Attention Allocation under Heterogeneity (Static Case) Proposition 9 (Relativ e attention under heterogeneous quality) . Under the logit allocation rule (2) with α = 0 (no r einfor cement), the attention ratio between any two builder s i and j depends only on their quality differ ence: s i s j = e β ( q i − q j ) . 16 A P R E P R I N T - M A R C H 2 6 , 2 0 2 6 Pr oof. W ith α = 0 , the allocation rule reduces to: s i = A · e β q i P B l =1 e β q l + e β q 0 . T aking the ratio: s i s j = e β q i e β q j = e β ( q i − q j ) . The denominator cancels, confirming that relativ e attention is determined entirely by relativ e quality . Corollary 3 (Superstar amplification) . F or β > 0 , a quality advantage of ∆ q = q i − q j > 0 translates into a multiplicative attention advantage of e β ∆ q . This advantage is: (i) increasing in β (higher sensitivity amplifies quality differ ences); (ii) conve x in ∆ q (lar ger quality gaps pr oduce dispr oportionately lar ger attention gaps). Pr oof. (i) ∂ ( e β ∆ q ) /∂ β = ∆ q e β ∆ q > 0 for ∆ q > 0 . (ii) ∂ 2 ( e β ∆ q ) /∂ (∆ q ) 2 = β 2 e β ∆ q > 0 . Proposition 10 (Log-normal attention under normal quality) . If α = 0 , β > 0 , and q i i . i . d . ∼ N ( µ, σ 2 ) , then in the lar ge- B limit the attention shar e s i is approximately log-normally distributed. Specifically , log s i is approximately normally distributed with mean β µ − log Z and variance β 2 σ 2 , wher e Z = P j e β q j + e β q 0 . Pr oof. Write s i = A e β q i / Z , so that log s i = log A + β q i − log Z . Since q i ∼ N ( µ, σ 2 ) , β q i ∼ N ( β µ, β 2 σ 2 ) . By the law of lar ge numbers, as B → ∞ , 1 B B X j =1 e β q j a . s . − − − → E [ e β q ] = e β µ + β 2 σ 2 / 2 , so log Z → log B + β µ + β 2 σ 2 / 2 + log (1 + e β q 0 / ( B E [ e β q ])) . The key point is that log Z con ver ges to a constant (conditional on B ), so the cross-sectional distribution of log s i inherits the normality of q i . Hence s i is approximately log-normal with the stated parameters. Remark. The log-normal distribution is moderately ske wed but light-tailed relati ve to a po wer law . This establishes a baseline: quality heterogeneity alone (without reinforcement) produces inequality , but not the extreme concentration observed in empirical digital markets. A.5 Reinfor cement Dynamics Proposition 11 (Fixed points of the mean-field dynamics) . A fixed point x ∗ of the deterministic update rule (16) satisfies, for each i ∈ { 0 , 1 , . . . , B } : x ∗ i = A · p ∗ i wher e p ∗ i = ( x ∗ i ) α e β q i P B j =0 ( x ∗ j ) α e β q j . Equivalently , at a fixed point the flow of attention into each pr oduct exactly equals its curr ent stock. Pr oof. At a fixed point, x ∗ i = x i ( t + 1) = x i ( t ) for all i . Substituting into (16): x ∗ i = (1 − δ ) x ∗ i + δ A p ∗ i = ⇒ δ x ∗ i = δ A p ∗ i = ⇒ x ∗ i = A p ∗ i . The cancellation of δ confirms that fixed points are independent of the reallocation rate, which af fects only the speed of con ver gence. Proposition 12 (Characterisation of interior fixed points) . At any interior fixed point ( x ∗ i > 0 for all i ), the attention shar es satisfy: x ∗ i = A · ( x ∗ i ) α e β q i P B j =0 ( x ∗ j ) α e β q j . F or α < 1 , interior fixed points exist and can be solved e xplicitly . F or α = 1 with heter ogeneous qualities, no interior fixed point with all pr oducts simultaneously active exists. 17 A P R E P R I N T - M A R C H 2 6 , 2 0 2 6 Pr oof. From Proposition 11, at an interior fixed point: x ∗ i = A · ( x ∗ i ) α e β q i Z ∗ , where Z ∗ = P B j =0 ( x ∗ j ) α e β q j . Rearranging: ( x ∗ i ) 1 − α = A e β q i / Z ∗ . Case α < 1 : W e can solve e xplicitly: x ∗ i = A e β q i Z ∗ 1 / (1 − α ) . The system is closed by substituting back into the definition of Z ∗ and solving for the normalising constant. Since the right-hand side is a monotone increasing function of q i , higher-quality products receive strictly more attention, and all products with q i > −∞ receiv e positive attention. The mapping q i 7→ x ∗ i is steeper than the α = 0 (logit) case, producing greater inequality for higher α . Case α = 1 : The equation becomes 1 = A e β q i / Z ∗ , i.e. e β q i = Z ∗ / A for all activ e i . W ith heterogeneous q i , this cannot hold simultaneously for two products with q i = q j . Therefore, no interior fixed point exists when α = 1 and qualities are heterogeneous. This is a necessary condition for condensation—the concentration of attention onto one or few products—and is consistent with the condensation result of Bianconi and Barabási [ 19 ], though a full characterisation of the long-run dynamics (ruling out limit cycles or other non-stationary attractors) would require additional analysis beyond the scope of this paper . Proposition 13 (Monotone concentration in α ) . Let α 1 < α 2 with both in [0 , 1) , and let x ∗ ( α ) denote the fixed-point attention vector . If qualities ar e heter ogeneous ( q i not all equal), then the Gini coef ficient of x ∗ ( α 2 ) strictly e xceeds that of x ∗ ( α 1 ) : strong er reinfor cement produces gr eater inequality . Pr oof. For α < 1 , the fixed-point shares satisfy x ∗ i ∝ e β q i / (1 − α ) (from Proposition 12). The ef fectiv e quality sensitivity is β / (1 − α ) , which is strictly increasing in α . By Corollary 3, higher effecti ve sensiti vity produces a more dispersed attention distribution. Since the Gini coefficient of a log-normal distribution Gini = 2Φ( σ eff / √ 2) − 1 is increasing in the scale parameter σ eff = β σ / (1 − α ) , the Gini coefficient is strictly increasing in α for α ∈ [0 , 1) whenev er σ > 0 . Remark on the α = 1 boundary . At α = 1 , no interior fix ed point exists (Proposition 12), and the non-existence of a shared equilibrium across heterogeneous products is consistent with extreme concentration. In the Bianconi–Barabási framew ork [ 19 ], this regime corresponds to condensation, with a Gini coefficient approaching ( B − 1) /B ≈ 1 for large B . Howe ver , formally establishing this as the long-run outcome of the dynamics (16) would require ruling out non-stationary attractors, which we do not pursue here. The numerical simulations in T able 2 are consistent with this limiting behaviour . Proposition 14 (Di ver gence of mean and median) . Under the conditions of Pr oposition 13, the r atio of median to mean attention, med( x ∗ ) / mean( x ∗ ) , is strictly decr easing in α for α ∈ [0 , 1) when qualities ar e heter ogeneous. Pr oof. The mean attention per builder is ¯ x = ( A − x ∗ 0 ) /B , which depends on α only through the outside-option share. The median, howe ver , is determined by the cross-sectional distribution of x ∗ i , which becomes more right-ske wed as α increases (Proposition 13). For the log-normal case ( q i ∼ N ( µ, σ 2 ) , α < 1 ), the attention shares are approximately log-normal with scale parameter σ eff = β σ / (1 − α ) . The median of a log-normal is e µ eff while the mean is e µ eff + σ 2 eff / 2 , so: median mean = e − σ 2 eff / 2 = exp − β 2 σ 2 2(1 − α ) 2 , which is strictly decreasing in α for α ∈ [0 , 1) and conv erges to zero as α → 1 − . A.6 W elfare and Saturation Proposition 15 (Aggre gate welfare under symmetry) . Define aggr e gate consumer welfar e as W ( B ) = B · v ( ¯ s ( B )) , wher e v ( · ) is a concave, incr easing function repr esenting the per-pr oduct value derived fr om attention. Under symmetry: (i) If v is sufficiently concave (e.g . v ( s ) = log s ), then W ( B ) is maximised at a finite B ∗∗ and decreasing for B > B ∗∗ . 18 A P R E P R I N T - M A R C H 2 6 , 2 0 2 6 (ii) The free-entry equilibrium B ∗ generically e xceeds B ∗∗ : there is e xcess entry . Pr oof. (i) T ake v ( s ) = log s . Then W ( B ) = B log A B + z = B log A − log( B + z ) . Differentiating: W ′ ( B ) = log A − log( B + z ) − B B + z . As B → 0 + , W ′ ( B ) → log A − log z > 0 (assuming A > z , which holds whene ver the market is viable). As B → ∞ , W ′ ( B ) → −∞ . Since W ′ is continuous and changes sign, there exists a unique B ∗∗ satisfying W ′ ( B ∗∗ ) = 0 , and W is decreasing for B > B ∗∗ . (ii) At B ∗ , each builder earns zero profit: p ¯ s ( B ∗ ) = k . The social planner’ s optimum B ∗∗ internalises the negativ e externality that each entrant imposes on incumbents by diluting their attention. Since indi vidual entrants do not internalise this externality , they enter whene ver π > 0 , leading to B ∗ > B ∗∗ . Formally , the pri vate mar ginal benefit of entry is p ¯ s ( B ) − k , while the social mar ginal benefit is p ¯ s ( B ) − k + B p ¯ s ′ ( B ) , which includes the ne gativ e term B p ¯ s ′ ( B ) < 0 (the business-stealing e xternality). The priv ate incentiv e exceeds the social incentiv e, so entry proceeds beyond the social optimum. Proposition 16 (Builder Saturation Ef fect — formal statement) . In the model of Sections 3 – 3.6, the following hold jointly: (i) Dilution: ¯ s ( B ) is strictly decreasing in B , and ¯ s ( B ) → 0 as B → ∞ (Pr opositions 3–4). (ii) Zero equilibrium profit: Under fr ee entry , π ( B ∗ ) = 0 and ¯ s ( B ∗ ) = k /p (Pr opositions 6 – 7). (iii) Entry expansion under cost reduction: ∂ B ∗ /∂ k < 0 , so reducing entry costs incr eases the number of b uilders (Pr oposition 8). (iv) Demand-side invariance: Increases in A ar e fully absorbed by entry; ¯ s ( B ∗ ) and π ( B ∗ ) ar e unaff ected (Cor ollary 1). (v) Concentration (for α ∈ [0 , 1) ) : Under hetero geneous quality and reinfor cement ( α > 0 ), the outcome distribution is strictly mor e concentrated than under quality hetero geneity alone, as measured by the Gini coefficient (Pr oposition 13). (vi) Mean–median divergence (for α ∈ [0 , 1) ) : The ratio of median to mean attention is strictly decr easing in α (Pr oposition 14), and collapses towar d zer o as α → 1 − . T aken together , (i)–(iv) are pr oven r esults of the symmetric fr ee-entry model. Results (v)–(vi) hold at interior fixed points for α < 1 ; behaviour at the α = 1 boundary is consistent with extr eme concentration but is c haracterised only indir ectly via imported r esults and numerical simulation. Collectively , these r esults formalise the coexistence of mass participation and winner-tak e-most outcomes. Pr oof. Each component is established by the referenced propositions. The joint statement collects them to define the Builder Saturation Law as a composite re gularity . A.7 Saturation under Endogenous Attention Gro wth Proposition 17 (Persistence of saturation under attention augmentation) . Suppose aggr e gate attention grows o ver time as A ( t ) = A 0 g ( t ) with g ( t ) incr easing, and entry costs decline as k ( t ) with k ( t ) → 0 . The equilibrium attention per builder at time t is: ¯ s ( B ∗ ( t )) = k ( t ) p . This con ver ges to zer o whenever k ( t ) → 0 , re gardless of the gr owth rate of g ( t ) . Pr oof. At each t , free entry yields B ∗ ( t ) = pA 0 g ( t ) /k ( t ) − z . By the zero-profit condition (Proposition 7), ¯ s ( B ∗ ( t )) = k ( t ) /p . Since this expression depends only on k ( t ) and p , and not on A ( t ) , it con verges to zero as k ( t ) → 0 irrespecti ve of g ( t ) . 19 A P R E P R I N T - M A R C H 2 6 , 2 0 2 6 Corollary 4 (Condition for a voiding saturation) . Equilibrium attention per builder is non-decr easing over time if and only if ˙ k ( t ) ≥ 0 , i.e. entry costs do not decline. Since the pr emise of AI-assisted building is that k is falling rapidly , this condition is generically violated. Pr oof. d ¯ s ( B ∗ ( t )) /dt = ˙ k ( t ) /p . This is non-neg ative if and only if ˙ k ( t ) ≥ 0 . A.8 Outside Option and Inertia Proposition 18 (Role of the outside option) . The outside option z acts as a demand-side friction that r educes equilibrium entry . Specifically: (i) F or any B , the fraction of total attention captur ed by all builders collectively is B / ( B + z ) , which is strictly incr easing in B but bounded above by 1 . (ii) In equilibrium, the fraction of attention absorbed by the outside option is z / ( B ∗ + z ) = k z / ( pA ) . (iii) As z → ∞ (extr eme inertia), B ∗ = max { pA/k − z , 0 } eventually r eaches zer o: sufficiently str ong inertia pr events all entry . Pr oof. (i) Under symmetry , total builder attention is B ¯ s ( B ) = B A/ ( B + z ) , so the builder share is B / ( B + z ) . This is increasing in B (deriv ativ e z / ( B + z ) 2 > 0 ) and approaches 1 as B → ∞ . (ii) At equilibrium B ∗ = pA/k − z , the outside-option share is z / ( B ∗ + z ) = z / ( pA/k ) = k z / ( pA ) . (iii) B ∗ = pA/k − z becomes non-positiv e when z ≥ pA/k . A.9 Summary of Formal Results The following table pro vides a reference guide to the propositions and their roles in supporting the main argument. T able 6: Summary of propositions. Prop. Result Role in argument 3 ¯ s ( B ) strictly decreasing, con ve x Core dilution mechanism 4 ¯ s ( B ) → 0 Limit of dilution 5 Elasticity → − 1 Quantifies dilution rate 6 B ∗ = pA/k − z Equilibrium entry 7 ¯ s ( B ∗ ) = k /p Zero-profit identity 8 Signs of ∂ B ∗ /∂ ( · ) Policy-relev ant statics 9 s i /s j = e β ( q i − q j ) Relativ e competition 10 Log-normal under normal quality Baseline inequality 11 Fixed-point characterisation Equilibrium of dynamics 12 No interior fixed point at α = 1 Necessary for concentration 13 Gini increasing in α ( α < 1 ) Monotone concentration 14 Median/mean decreasing in α Mean–median di vergence 15 Excess entry W elfare implication 16 Builder Saturation Effect Central result 17 Saturation persists under growth Robustness 18 Role of inertia Demand-side friction B Simulation Code The following Python code reproduces the concentration metrics reported in T able 2. It requires only NumPy ( ≥ 1.21). import numpy as np def simulate(A=10000, B=1000, z=100, beta=1.0, alpha=0.0, delta=0.1, T=500, seed=42): rng = np.random.default_rng(seed) q = rng.standard_normal(B) 20 A P R E P R I N T - M A R C H 2 6 , 2 0 2 6 q0 = 0.0 x = np.full(B, A / (B + z)) x0 = z * A / (B + z) for t in range(T): log_num = alpha * np.log(np.maximum(x, 1e-30)) + beta * q log_num0 = alpha * np.log(max(x0, 1e-30)) + beta * q0 log_all = np.append(log_num, log_num0) log_all -= log_all.max() weights = np.exp(log_all) probs = weights / weights.sum() p = probs[:B] p0 = probs[B] x = (1 - delta) * x + delta * A * p x0 = (1 - delta) * x0 + delta * A * p0 return x, x0, q def report(x): x_sorted = np.sort(x)[::-1] total = x.sum() B = len(x) top1 = x_sorted[:max(1, B // 100)].sum() / total top10 = x_sorted[:max(1, B // 10)].sum() / total mean_x = x.mean() median_x = np.median(x) n = len(x) x_s = np.sort(x) idx = np.arange(1, n + 1) gini = (2 * (idx * x_s).sum()) / (n * x_s.sum()) \ - (n + 1) / n print(f" Top 1% share: {top1:.3f}") print(f" Top 10% share: {top10:.3f}") print(f" Gini: {gini:.2f}") print(f" Median/Mean: {median_x / mean_x:.2f}") for alpha in [0.0, 0.5, 1.0]: print(f"\nalpha = {alpha}") x, x0, q = simulate(alpha=alpha) report(x) References [1] Andrej Karpathy . Post on X (formerly T witter), February 6, 2025. https://x.com/karpathy/status/ 1886192184808149383 [2] Stack Overflow . 2025 De veloper Survey Results. Stack Overflow Blog , 2025. https://survey.stackoverflow. co/2025/ [3] GitHub . Octov erse 2025. GitHub Blog , 2025. https://github.blog/news- insights/octoverse/ octoverse- 2025/ [4] Ivan Mehta. A quarter of startups in YC’ s current cohort hav e codebases that are almost entirely AI-generated. T ec hCrunch , March 6, 2025. [5] Sam Altman. Interview on Con versations with T yler , hosted by T yler Co wen. Released November 2025. [6] Herbert A. Simon. Designing organizations for an information-rich world. In Martin Greenberger , editor , Comput- ers, Communications, and the Public Inter est , pages 37–72. Johns Hopkins Press, Baltimore, 1971. [7] Carl Shapiro and Hal R. V arian. Information Rules: A Strate gic Guide to the Network Economy . Harvard Business School Press, Boston, MA, 1999. 21 A P R E P R I N T - M A R C H 2 6 , 2 0 2 6 [8] Business of Apps. Apple App Store Statistics 2026. February 2026. https://www.businessofapps.com/ data/apple- app- store- statistics/ [9] Sensor T ower . 94% of U.S. App Store re venue comes from the top 1% of monetizing publishers. 2016. https: //sensortower.com/blog/app- store- one- percent [10] BuildFire. Mobile app download statistics & usage statistics (2026). February 2026. https://buildfire.com/ app- statistics/ [11] InfoQ. GitHub points to a more global, AI-challenged open source ecosystem in 2026. March 2026. https: //www.infoq.com/news/2026/03/github- ai- 2026/ [12] Michael Spence. Product selection, fixed costs, and monopolistic competition. Review of Economic Studies , 43(2):217–235, 1976. [13] A vinash K. Dixit and Joseph E. Stiglitz. Monopolistic competition and optimum product diversity . American Economic Revie w , 67(3):297–308, 1977. [14] Sherwin Rosen. The economics of superstars. American Economic Review , 71(5):845–858, 1981. [15] Herbert A. Simon. On a class of skew distrib ution functions. Biometrika , 42(3–4):425–440, 1955. [16] Albert-László Barabási and Réka Albert. Emergence of scaling in random networks. Science , 286(5439):509–512, 1999. [17] Michael L. Katz and Carl Shapiro. Network e xternalities, competition, and compatibility . American Economic Revie w , 75(3):424–440, 1985. [18] Ginestra Bianconi and Albert-László Barabási. Competition and multiscaling in ev olving networks. Eur ophysics Letters , 54(4):436–442, 2001. [19] Ginestra Bianconi and Albert-László Barabási. Bose–Einstein condensation in complex netw orks. Physical Re view Letters , 86(24):5632–5635, 2001. 22
Original Paper
Loading high-quality paper...
Comments & Academic Discussion
Loading comments...
Leave a Comment