A Job I Like or a Job I Can Get: Designing Job Recommender Systems Using Field Experiments
Recommendation systems (RSs) are increasingly used to guide job seekers on online platforms, yet the algorithms currently deployed are typically optimized for predictive objectives such as clicks, applications, or hires, rather than job seekers' welf…
Authors: Guillaume Bied, Philippe Caillou, Bruno Crépon
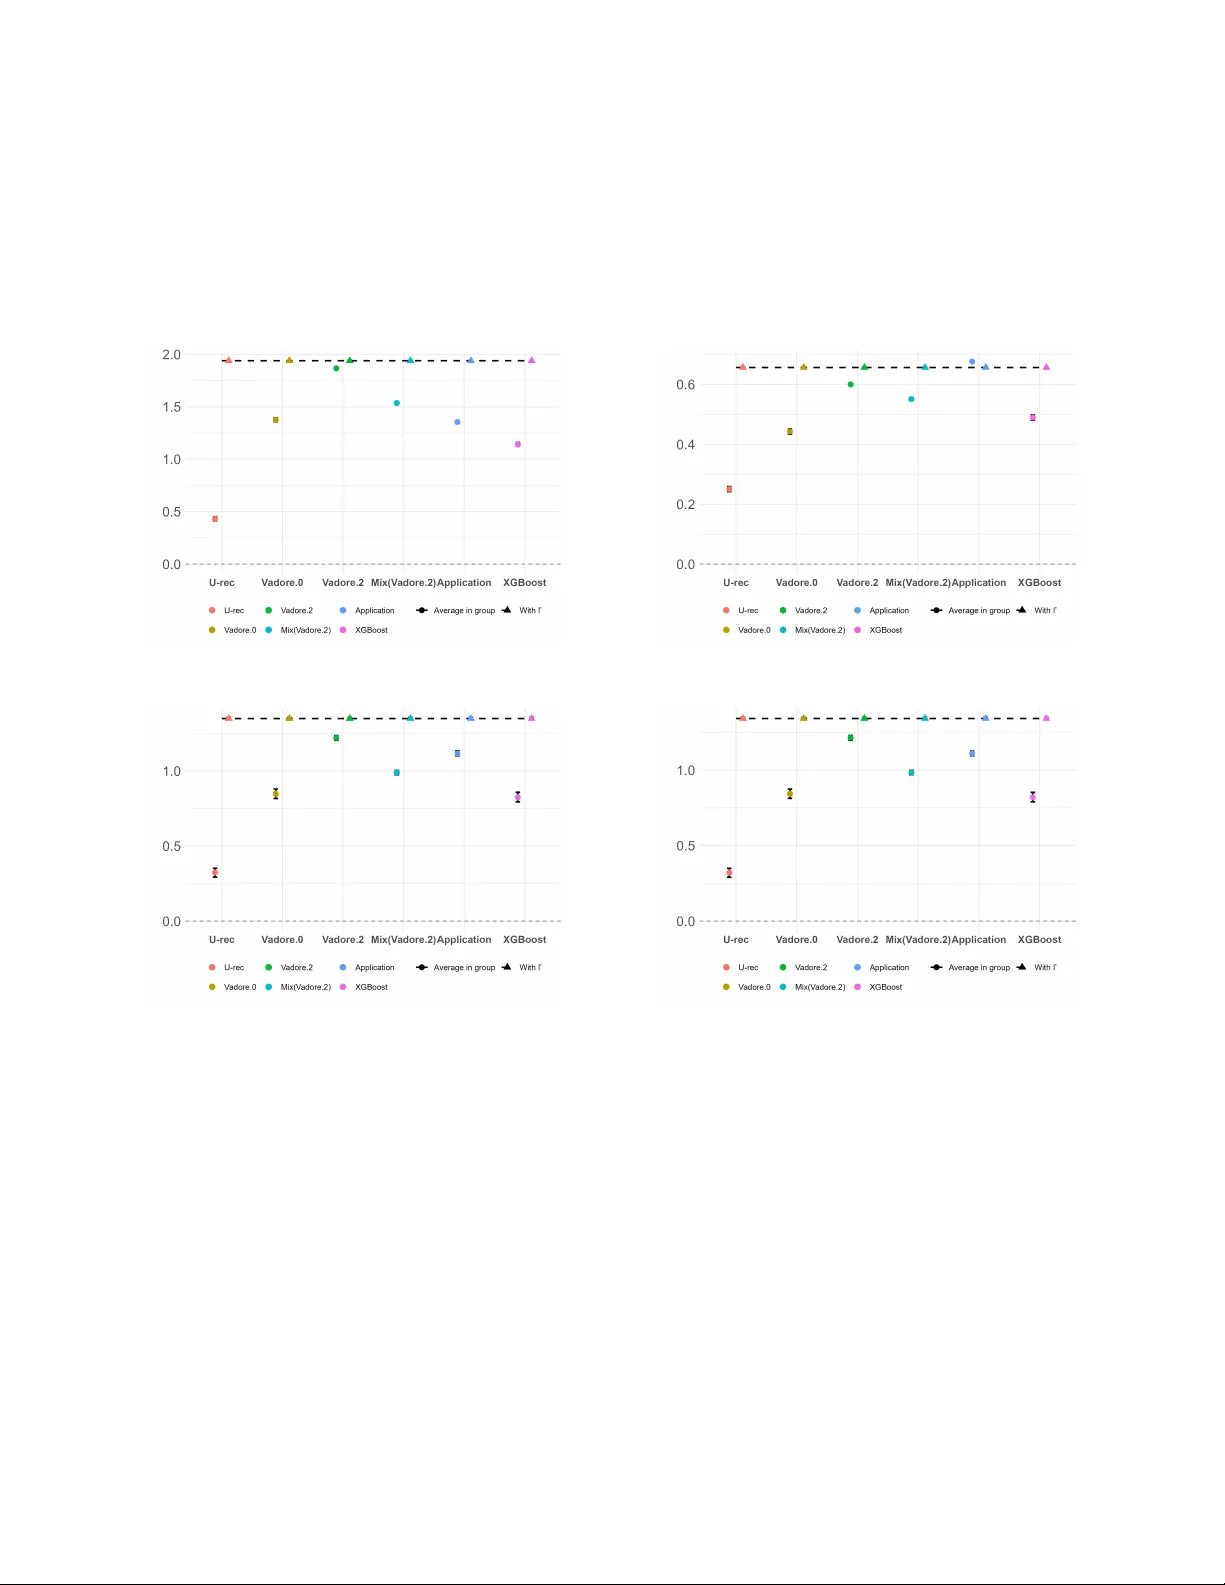
A Job I Lik e or a Job I Can Get: Designing Job Recommender Systems Using Field Exp erimen ts ∗ Guillaume Bied, Philipp e Caillou, Bruno Cr ´ ep on, Christophe Gaillac, Elia P ´ erennes, Mic h ` ele Sebag Marc h 24, 2026 Abstract Recommendation systems (RSs) are increasingly used to guide job seek ers on online plat- forms, y et the algorithms currently deploy ed are typically optimized for predictive ob jectives suc h as clic ks, applications, or hires, rather than job seekers’ w elfare. W e dev elop a job-searc h mo del with an application stage in which the v alue of a v acancy dep ends on tw o dimensions: the utilit y it deliv ers to the w orker and the probabilit y that an application succeeds. The mo del implies that w elfare-optimal RSs rank v acancies b y an expected-surplus index combining both, and shows why rankings based solely on utility , hiring probabilities, or observed application b eha vior are generically sub optimal, an instance of the inv ersion problem b et ween b eha vior and welfare. W e test these predictions and quantify their practical imp ortance through tw o randomized field exp erimen ts conducted with the F renc h public emplo ymen t service. The first exp erimen t, comparing existing algorithms and their com binations, pro vides b eha vioral evidence that b oth dimensions shap e application decisions. Guided b y the mo del and these results, the second exp erimen t extends the comparison to an RS designed to approximate the welfare-optimal ranking. The exp erimen ts generate exogenous v ariation in the v acancies sho wn to job seek ers, allo wing us to estimate the model, v alidate its behavioral predictions, and construct a welfare metric. Algorithms informed by the mo del-implied optimal ranking sub- stan tially outperform existing approaches and perform close to the welfare-optimal b enc hmark. Our results sho w that em b edding predictive to ols within a simple job-search framework and com bining it with exp erimen tal evidence yields recommendation rules with substan tial welfare gains in practice. JEL Classification: J64, J68, L86, C78, C55, C61 Keyw ords: Job Recommender Systems, Matching, Experiments, Mac hine Learning. ∗ Bied, Ghen t Univ ersit y , IDLab: guillaume.bied@ugen t.b e; Caillou, UPSacla y/LISN/ IN- RIA: caillou@lri.fr; Cr ´ ep on: CREST, crepon@ensae.fr; Gaillac: Univ ersit y of Genev a, GSEM: c hristophe.gaillac@unige.c h; P ´ erennes, CREST / F rance T rav ail: elia.p erennes@ensae.fr; Sebag, UP- Sacla y/LISN/INRIA/CNRS: sebag@lri.fr. This pap er is the result of a partnership with F rance T ra- v ail, the Public Employmen t Service in F rance. W e thank Camille Qu´ er ´ e, Chantal V essereau, Cyril Nouv eau, Paul Beurnier, Y ann De Coster, Sebastien Robidou and Thierry F oltier for their operational supp ort. The first experiment received IRB appro v al 2021-026 from the PSE-IRB and the second one IRB approv al 2021-026-amendment. They were registered at the AEA’s Registry for R CTs (respec- tiv ely https://doi.org/10.1257/rct.8998- 1.3 and https://doi.org/10.1257/rct.16650- 1.0 ). This researc h w as supp orted b y the D A T AIA conv ergence institute as part of the ≪ Programme d’In vestissemen t d’Av enir ≫ , (ANR-17-CONV-0003) op erated by CREST and LISN. C. Gaillac ackno wledges supp ort from ER C POEMH 337665 and ANR-17-EURE-0010. Authors retained full intellectual freedom throughout this pro cess, all errors are our o wn. W e thank Mic hele Belot, Morgane Hoffmann, Philipp Kircher, Rafael Lalive, Barbara P etrongolo, as well as seminar participants at Oxford, IZA/CREST Conference, ENSAI Economics Da ys, the 7th Lindau meeting, Universit y of Bologna, 2023 EALE Conference, LISN, and the HiJoS W ork- shop in Innsbruck for useful commen ts and suggestions. 1 1 In tro duction Recommendation systems (RSs) are transforming ho w job seek ers interact with online lab or- mark et platforms. Their adoption is accelerating, and many public employmen t services (PES) are considering integrating such to ols (see Bro ec k e , 2023 ). Y et designs v ary widely , and evidence on their relative effectiv eness or their ability to generate meaningful lab or- mark et improv emen ts at scale remains limited, even if they may b enefit sp ecific subgroups. This pap er develops a framework providing a welfare criterion for comparing designs, and uses t w o field exp eriments to sho w that algorithms informed b y this criterion substantially outp erform existing approaches. A large data-science literature dev elops job RSs by training algorithms on historical data to predict user b eha vior suc h as clicks, applications, or hires, and ev aluating p erformance using predictiv e metrics ( F reire and de Castro , 2021 ; De Ruijt and Bh ulai , 2021 ; Masha y ekhi et al. , 2022 ). While highly effective at forecasting observ ed behavior, their normativ e in terpretation is less clear: predicting observed interactions do es not imply that recommended opp ortunities maximize job seekers’ exp ected welfare. A t the same time, a growing empirical literature in economics ev aluates job recommendations in the field, often through randomized exp eriments conducted in partnership with PESs in sev eral coun tries. Many of these in terven tions provide o ccupational or emplo y er-level recommendations designed to broaden searc h or redirect job seekers tow ard lab or markets with better prosp ects (see, e.g., Belot et al. , 2019 ; Altmann et al. , 2022 ; Behaghel et al. , 2024 ; Belot et al. , 2025 ; B¨ ac hli et al. , 2025 ). These studies provide v aluable causal evidence, but they typically ev aluate a small num b er of pre-sp ecified recommendation rules against a limited set of outcomes, and offer little guidance on ho w to compare such rules against a common w elfare criterion. These t w o literatures ha ve largely dev elop ed in parallel, though recent con tributions connect them. Hensvik et al. ( 2022 ) ev aluate a collab orative filtering RS based on clic king b eha vior; Su et al. ( 2022 ) consider social welfare maximization. Other work questions the practice of treating observed b ehavior as a proxy for welfare (see, e.g., Agan et al. , 2023 ; Klein b erg et al. , 2022 , 2024 ; Mullainathan , 2025 ). Kleinberg et al. ( 2024 ) formalize the in v ersion problem: when b ehavior is generated under frictions, predicting b eha vior is not equiv alen t to reco v ering the laten t ob jective guiding optimal decisions. This pap er develops a job-searc h framework to discipline the design of RSs. The frame- w ork incorp orates the application stage and highlights tw o ob jects: the utility a job seeker 2 asso ciates with a v acancy and the probability that an application results in a hire. The w elfare-optimal rule ranks v acancies by an exp ected-surplus index combining b oth. A cen- tral implication is that neither utilit y or hiring outcomes alone pro vide a sufficient basis for optimal recommendations: the optimal algorithm requires a sp ecific com bination of utility and hiring probability that reflects the exp ected gains from applying. This is an instance of the in version problem: recommendation rules that optimize predictiv e ob jectives suc h as predicted utility , observed application b ehavior, or observed hiring outcomes alone will generally miss it, ev en in a simple and frictionless job-search environmen t. An imp ortan t em- pirical question is whether this inv ersion problem is economically significant in practice, and whether welfare-orien ted rankings deliv er substantial impro vemen ts ov er robust predictiv e rules in realistic environmen ts. W e bring this framework to the data through close collab oration with the F renc h PES. Starting from tw o existing RSs, one reflecting stated preferences, another a state-of-the-art ML system ( Bied and al. , 2023 ) predicting hiring outcomes, w e conduct a sequence of t wo randomized field exp eriments. These exp eriments are not designed to ev aluate the large- scale causal impact of deploying recommendations p er se. Rather, they are conceived as b eta-tests in a learning cycle (in the spirit of A they , 2018 ), aimed at comparing alternative algorithmic designs and iteratively improving them. A first exp eriment compares recommendations based on existing algorithms separately and in combination. W e find that job seekers resp ond more fa vorably to recommendations com- bining information about preferences and hiring prospects, suggesting that neither dimension alone is sufficient to shap e searc h b eha vior. Guided b y these findings and the model’s structure, w e design a new class of algorithms that better appro ximate the model-implied optimal ranking by incorporating explicit pro xies for application b eha vior and preference-related signals into hiring predictions. This yields a family of recommendation rules including the original algorithms, an application-based algorithm, and an appro ximation of the w elfare-optimal algorithm that combines information on preferences, applications, and hiring. W e ev aluate these alternativ e designs in a second randomized exp eriment. The newly intro- duced algorithms, particularly the application-based algorithm and the appro ximation of the w elfare-optimal rule, substantially outp erform the initial approac hes, esp ecially in terms of clic ks and applications. While they remain distinct from the theoretically optimal rule, their strong empirical p erformance highlights the practical gains from incorp orating application b eha vior and preference-related signals into recommendation design. 3 A central goal of the pap er is to use the conceptual structure of the job-search mo del to formally compare alternative RSs. Because optimality is defined within a b ehavioral mo del and a w elfare criterion, this comparison requires that the mo del’s implications for application b eha vior b e empirically plausible. W e therefore exploit the exogenous v ariation generated b y the random assignment of recommendation algorithms to estimate a structural mo del of application b ehavior. The results v alidate the mo del’s core b eha vioral predictions: both the utilit y score and the inv erse hiring probability are highly significan t predictors of application decisions, with co efficients stable across sp ecifications. This supp orts using the mo del as a conceptual basis for welfare comparisons. The exp erimen tal data allo w us to identify the predictive comp onen ts needed to reconstruct the mo del-implied optimal recommendation rule. Using observed outcomes under differen t algorithms, we estimate predictions for b oth applications and hiring, and combine them to construct an estimate of the optimal recommendation score. This score is then used to iden tify the v acancies that w ould ha ve b een recommended under the optimal algorithm and to rank the tested algorithms against a common w elfare b enchmark. The application-based algorithm and our approximation of the welfare-optimal rule strongly outp erform the initial algorithms. The latter further improv es up on the application-based algorithm, alb eit by a smaller margin, and p erforms remark ably close to the mo del-implied optimum. T aken together, our results p oin t to an imp ortan t implication: RSs that target predictiv e ob jectives such as clicks, applications, or hiring outcomes are generally not aligned with job seek ers’ w elfare. A t the same time, the predictiv e tasks underlying these systems pro vide essen tial building blo c ks for welfare-relev ant recommendation design. By combining struc- tural mo deling with exp erimental evidence that disciplines its b ehavioral assumptions, our approac h illustrates ho w predictiv e to ols can b e used to construct, ev aluate, and iterativ ely impro ve recommendation rules. Our pap er sp eaks to a gro wing empirical literature in economics that studies job RSs and related forms of automated advice, often through randomized field exp erimen ts conducted in partnership with public employmen t services (see, e.g., Belot et al. , 2019 ; Altmann et al. , 2022 ; Behaghel et al. , 2024 ; Belot et al. , 2025 ; B¨ ac hli et al. , 2025 ; Hensvik et al. , 2022 ). A central feature of this literature is the div ersity of ob jectiv es implicitly targeted by rec- ommendation rules. Some interv entions rely on observ ed transitions or predicted hiring probabilities to steer job seek ers tow ard o ccupations or emplo y ers with higher employmen t prosp ects (e.g., Belot et al. , 2019 ; Altmann et al. , 2022 ; Behaghel et al. , 2024 ; Belot et al. , 2025 ); others emphasize measures of fit or expressed in terest inferred from searc h b ehavior or skills profiles (e.g., B¨ ac hli et al. , 2025 ; Hensvik et al. , 2022 ). While these approaches 4 pro vide v aluable causal evidence on the effects of sp ecific recommendation designs, they do not offer a general framework to compare alternativ e algorithmic ob jectives or relate them to a common welfare criterion. W e contribute to this literature by providing such a framework and comparing different RSs using exp eriments. Within a simple job-search mo del that explicitly incorp orates the application stage, we sho w that t wo dimensions are central to recommendation design: the utilit y that a job seek er asso ciates with a v acancy and the probability that an application results in a hire. Existing approaches can b e in terpreted as emphasizing one of these dimen- sions in isolation, but neither is sufficien t on its o wn. An economically meaningful ranking m ust com bine both in to a single expected-surplus index, whic h allo ws us to place div erse recommendation designs on a common fo oting and to ev aluate their relative p erformance. Our analysis also relates to a gro wing literature at the intersection of machine learning and economics that questions the normativ e interpretation of observed b ehavior on digital platforms (see, e.g., Agan et al. , 2023 ; Kleinberg et al. , 2022 , 2024 ; Mullainathan , 2025 ). In our setting, the inv ersion problem arises b ecause application decisions only reveal whether applying is priv ately profitable, hiring outcomes capture only part of the expected gains, whereas w elfare-relev ant ranking of v acancies dep ends on the magnitude of exp ected gains. Our contribution is to make this insigh t op erational in a lab or-market en vironment. By com bining exp erimen tal v ariation with a structural mo del of application b ehavior, we char- acterize job seek ers’ welfare-relev ant ob jectiv e, distinguish it from commonly used b ehavior- based rankings, and quantify the imp ortance of the in version problem. While the mo del implies that w elfare-relev ant rankings differ from application-based recommendations, our results sho w that the gap is p ositiv e but quan titatively mo dest, an assessment that w ould b e difficult to obtain without join tly leveraging experimental evidence and structural mo deling. Our metho dology relates closely to w ork emphasizing exp erimen tation and economic mo del- ing in the design of algorithmic decision rules (e.g., A they , 2018 ). Rather than ev aluating the large-scale causal impact of a fixed RS, w e use sequen tial b eta-tests to compare designs, feed the results back in to the mo del, and construct improv ed algorithms. The structural mo del disciplines which signals to incorp orate and how to combine them, while the exp erimen ts in turn discipline the mo del’s b eha vioral assumptions and pro vide the v ariation needed to esti- mate the w elfare metric. Empirically , RSs informed by b oth utility and hiring probabilities substan tially outp erform approac hes based on either alone, yielding sizeable gains relativ e to algorithms currently used in practice, while the in v ersion problem has mo dest quantitativ e implications in this setting. 5 The pap er pro ceeds as follows. Section 2 presents the job-search mo del and deriv es the opti- mal recommendation rule. Section 3 describ es tw o represen tative RSs and their underlying scores. Section 4 presents the design and results of the randomized exp eriments. Section 5 estimates the structural mo del and compares alternative algorithms using the proposed metric. Section 6 concludes with implications for the design of job RSs in practice. 2 Job searc h mo del with recommender systems Ov erview. W e dev elop a job-search mo del in whic h job seekers encounter v acancies se- quen tially and decide whether to apply . V acancies are lotteries c haracterized b y (i) the utility they would deliver to the work er and (ii) the probability that an application succeeds. W e then in tro duce a RS as a technology that (a) restricts the set of v acancies a job seeker is exp osed to based on a score and (b) p otentially increases the rate at whic h v acancies can b e pro cessed. The mo del delivers (i) a mo del-implied v alue index for v acancies, (ii) conditions under whic h an RS improv es w elfare, and (iii) an optimal ranking rule in the b enchmark case of m yopic job seekers. Finally , we discuss how these results inform RS design and clarify wh y ranking by utility alone, by hiring probabilit y alone, or b y predicted application b eha vior is generally sub optimal. 2.1 En vironmen t and primitiv es Our job search mo del builds on the following environmen t and primitiv es. Job seekers and v acancies. Job seek ers are indexed b y characteristics x and v acancies b y c haracteristics y . An unemplo yed job seek er receiv es flo w utilit y u ( b ). P ay offs. A v acancy y yields utility U ( x, y ) + ε i,y to job seeker i of type x , where ε is an idiosyncratic taste sho ck observed by the job seeker. W e assume ε follows a logistic distribution with scale parameter σ and cumulativ e distribution function F ε ( · ) = F ( · /σ ). Hiring probability . Conditional on applying, the job seeker is hired with probability p ( x, y ), which is kno wn to the job seeker at the application decision stage. V acancy distribution and reparametrization. V acancies are drawn from F 0 ( y ). F or a giv en t yp e x , the induced distribution of ( p ( x, y ) , U ( x, y )) is denoted F 0 ( p, U ). 1 1 with x suppressed in the notation. 6 Other primitiv es. Applications entail a cost k and rejection en tails a psychological cost R . Matches separate at rate q and future utility is discounted at rate r . 2.2 Baseline sequen tial searc h without an RS This section c haracterizes job seekers’ b eha vior and the v alue of unemplo yment in the base- line sequen tial searc h en vironment without an RS. The key friction is that job seek ers explore v acancies sequentially , drawing from the distribution F 0 ( p, U ) at rate α 0 , and cannot simul- taneously compare all av ailable opp ortunities. Up on encountering a v acancy , the job seeker observ es its c haracteristics ( p, U, ε ) and decides whether to apply . All formal deriv ations and pro ofs are relegated to App endix B . 2.2.1 Reserv ation utility and surplus Let V 0 ( x ) denote the discoun ted v alue of unemplo yment for a job seeker of t yp e x in the absence of a RS. Eac h time the job seeker encoun ters a v acancy with characteristics ( p, U, ε ), she faces a binary decision: apply to it or contin ue searching. If the job seek er do es not apply , she remains unemplo y ed and retains con tinuation v alue V 0 ( x ). If she applies, she pays the application cost k ; with probabilit y p the applica- tion succeeds and she transitions in to employmen t with discounted presen t v alue of utility V e ( x, U + ε ), while with probability 1 − p she is rejected and contin ues searc hing, incurring the rejection cost R . Conditional on applying, the discounted exp ected pa y off is therefore p V e ( x, U + ε ) + (1 − p ) V 0 ( x ) − R − k . T o characterize this apply-or-not decision, it is useful to introduce a reserv ation utilit y: U ∗ 0 ( x, p ) = r V 0 ( x ) − R + k + R p , (1) where R = ( r + q ) R and k = ( r + q ) k . The quantit y U ∗ 0 ( x, p ) represents the minim um utility lev el that mak es a v acancy with hiring probability p worth applying to. W e then define the surplus asso ciated with a v acancy as ∆( x, p, U ) := U − U ∗ 0 ( x, p ) . (2) This surplus compares the utility provided b y the v acancy to the reserv ation utility asso ciated with its hiring probabilit y . V acancies with lo wer hiring probabilities m ust offer higher utility 7 in order to b e attractiv e, reflecting the costs asso ciated with unsuccessful applications. T o streamline notation, we henceforth suppress the dep endence on x whenever this does not create am biguit y . 2.2.2 Application b ehavior and v acancy v alue The job seeker applies to a v acancy whenever the realized surplus is p ositive: ∆( p, U ) + ε > 0 . (3) This rule admits a natural interpretation: a job seeker applies if the realized utilit y U + ε exceeds the reserv ation utilit y U ∗ 0 ( p ). Under the assumed logistic distribution for ε , this decision rule implies that the probabilit y of applying to a v acancy ( p, U ) is p a ( p, U ) = F (∆( p, U ) /σ ). The discoun ted v alue of unemplo ymen t satisfies r V 0 = u ( b ) + α 0 r + q E (Γ( p, U )) , (4) where the exp ectation is taken ov er the distribution of v acancies and Γ( p, U ) := p Z (∆( p, U ) + ε ) 1 { ∆( p, U ) + ε > 0 } dF ε ( ε ) . (5) The index Γ( p, U ) represen ts the exp ected contribution of encoun tering a v acancy with char- acteristics ( p, U ) to the job seek er’s contin uation v alue. It aggregates the probability of ap- plying, the probabilit y of b eing hired conditional on application, and the surplus generated b y a successful match conditional on application. Under the logistic assumption on ε , Γ( p, U ) admits the closed-form expression Γ( p, U ) = p σ log 1 + e ∆( p,U ) /σ . (6) Prop osition 2.1 (Application rule and v acancy v alue) . In the absenc e of a RS, applic ation b ehavior is governe d by the surplus ∆( p, U ) thr ough the rule ( 3 ) , while the welfar e-r elevant value of a vac ancy is summarize d by the index Γ( p, U ) . Pr o of. See App endix B.1 . Prop osition 2.1 mak es explicit the distinction b et w een application b eha vior and v acancy 8 v alue. This non-equiv alence arises b ecause application decisions are go verned by a binary profitabilit y condition, whereas v acancy v alues dep end on the exp ected magnitude of the gains. A v acancy with a high hiring probability p contributes more to the job seeker’s con- tin uation v alue than one with lo w p , ev en if b oth exceed the application threshold. Rankings based on observed applications therefore do not generally coincide with rankings that max- imize job seekers’ welfare. This distinction is central to the design of RSs, and Section 2.5 c haracterizes it precisely . 2.3 Recommender systems: selection and exp osure A recommender system (RS) scores the p o ol of av ailable v acancies and pre-selects a subset to b e shown to the job seek er, potentially also increasing the rate at which v acancies can b e pro cessed. While decisions remain sequen tial on the work er side, the RS transforms sequen tial searc h o ver v acancies into sequential applications ov er a curated set. In our framework, RSs affect job search through t wo c hannels: (i) Selection. The RS restricts the job seek er’s consideration set to v acancies whose score exceeds a threshold, i.e. , the top s fraction according to a score. (ii) Exp osure. The RS may c hange the effectiv e rate at which v acancies can b e pro cessed, from α 0 to α 1 . 2.3.1 Scores and the induced distribution of considered v acancies F or a job seeker with c haracteristics x and a v acancy describ ed by characteristics y , the RS computes a score S ( x, y ). T o k eep the notation light, we suppress the dep endence on x and y whenever it is unam biguous. F or a giv en x , the joint distribution of v acancy c haracteristics and scores is the distribution of p ( x, y ) , U ( x, y ) , S ( x, y ) , when y ∼ F 0 , whic h w e denote by F 0 ( p, U, S ). 2 W e mo del RS selection as recommending the v acancies whose score lies ab ov e the (1 − s )- quan tile of the score distribution. Let q S ( s ) denote the quantile of order 1 − s of S under F 0 ( p, U, S ). Then the RS induces the truncated distribution dF 1 ( p, U, S ) = 1 { S > q S ( s ) } s dF 0 ( p, U, S ) , (7) 2 As in Section 2.2 , this notation suppresses the dependence on x . F ormally , F 0 ( p, U, S ) is the distribution of ( p ( x, y ) , U ( x, y ) , S ( x, y )) induced by F 0 ( y ) conditional on x . 9 whic h is the distribution of ( p, U, S ) among recommended v acancies. 2.3.2 Exp osure: arriv al/pro cessing rate In addition to c hanging the comp osition of v acancies considered, RSs may also c hange the in- tensit y of exp osure to v acancies. W e capture this b y allowing the effectiv e v acancy-pro cessing rate under recommendations to b e α 1 rather than α 0 . This reduced-form form ulation ac- commo dates multiple mechanisms: recommendations may lo wer cognitiv e and search costs, facilitate na vigation, or simply deliver a fixed num b er of suggestions o v er a giv en p erio d. 2.3.3 My opic b enc hmark: v alue under recommendations W e first consider the case of myopic job seek ers, who do not adjust their reserv ation utility in response to the introduction of the RS. They contin ue to ev aluate v acancies using the baseline reserv ation utilit y U ∗ 0 ( p ) derived in Section 2.2 . Accordingly , Γ m ( p, U ) is defined b y the same expression as Γ( p, U ), but ev aluated at the baseline contin uation v alue V 0 . In particular, Γ m ( p, U ) = Γ( p, U ) in the absence of an RS. Under an RS characterized by ( S, s, α 1 ), the discoun ted v alue for a my opic unemploy ed job seek er is r V m 1 ( s, α 1 ) = u ( b ) + α 1 r + q E (Γ m ( p, U ) 1 { S > q S ( s ) } ) s , (8) where the exp ectation is taken with resp ect to F 0 ( p, U, S ). 2.4 Optimal RS and improv emen t conditions 2.4.1 Ob jectiv e and definition of an optimal RS W e now define what it means for a RS to b e optimal. Since the RS is designed and imple- men ted by the PES, we must sp ecify the ob jectiv e it pursues. Throughout the pap er, w e assume that the PES aims to maximize the welfare of job seek ers. W e abstract from firms’ outcomes and from broader so cial ob jectives. RSs rank v acancies using a score S and recommend the top fraction s of v acancies according to that score. An optimal RS is therefore one that, for an y recommendation intensit y s , maximizes the exp ected v alue of the recommended v acancies. Definition 1. F or myopic job se ekers, an optimal RS is a me asur able sc oring rule S ∗ of 10 ( p, U ) that solves, for e ach s ∈ [0 , 1] , S ∗ ∈ argmax S E Γ m ( p, U ) 1 l S ( p, U ) > q S ( s ) . The requirement that optimalit y holds for all s emphasizes that the RS defines a global ranking, rather than b eing tailored to a sp ecific cutoff or n um b er of recommendations. 2.4.2 Characterization and sufficient conditions Characterizing the optimal RS in the m y opic case is straightforw ard and yields sharp impli- cations for practice. Prop osition 2.2. Consider a RS b ase d on a sc or e S ( p, U ) that sele cts the top fr action s of vac ancies. 1. The optimal r anking is obtaine d by S ( p, U ) = Γ m ( p, U ) . 2. If α 1 ≥ α 0 , a sufficient c ondition for an S -b ase d RS to impr ove job se ekers’ welfar e r elative to b aseline se ar ch is that z 7→ E (Γ m ( p, U ) | S = z ) is incr e asing. In p articular, the RS b ase d on S ( p, U ) = Γ m ( p, U ) strictly impr oves welfar e whenever Γ m is non-de gener ate. Pr o of. See App endix B.1 . In terpretation. Prop osition 2.2 establishes that the optimal RS solv es a glob al r anking pr oblem ov er the entire distribution of v acancies, whereas application b ehavior reflects a binary profitabilit y condition. T ogether with Prop osition 2.1 , this creates an inversion pr oblem : algorithms that target observed applications or hiring outcomes are not gener- ally aligned with job seek ers’ welfare-relev ant ranking. Section 2.5 characterizes the nature and magnitude of this gap for sev eral natural recommendation rules. 2.5 Implications for the design of recommender systems This section studies the gap b etw een the optimal RS characterized in Prop osition 2.2 and alternativ e recommendation rules that ma y app ear reasonable a priori . W e consider rankings based on p erceived utilit y U , on the probabilit y of hire p , on observ ed application b eha vior p a , and on observed hires. The latter are of sp ecial in terest, since applications are the observ able outcome of job seekers’ decisions and hiring is a key outcome of the search pro cess, making it natural to ask whether recommendation rules that replicate observed applications or hires can b e normatively justified. 11 Building on the mo del and w elfare criterion introduced abov e, w e compare these alterna- tiv e rules to the w elfare-relev ant ob jectiv e. The key result of this section is a unifying de- comp osition of the w elfare-relev ant score, from whic h the non-optimality of several natural recommendation rules follows directly . 2.5.1 Decomp osing the w elfare-relev an t score In the my opic case, the welfare-relev ant index Γ( p, U ) admits the decomp osition: Γ( p, U ) = p × p a ( p, U ) × E [∆( p, U ) + ε | ∆( p, U ) + ε > 0 , p, U ] . (9) This expression makes clear that the optimal ranking is the pro duct of three distinct com- p onen ts: (i) the probability of b eing hired conditional on applying ( p ), (ii) the probability of applying ( p a ( p, U )), and (iii) the exp ected surplus generated b y a successful application, conditional on applying. Since p a ( p, U ) = P (∆( p, U ) + ε > 0 | p, U ) is a monotone function of ∆ under mild condi- tions, the conditional exp ectation in ( 9 ) can b e expressed as a function of the application probabilit y . Let m ( p a ( p, U )) := E [∆( p, U ) + ε | ∆( p, U ) + ε > 0 , p, U ], which allo ws us to rewrite the optimal score as Γ( p, U ) = p × p a ( p, U ) × m ( p a ( p, U )). This decomp osition is generic and do es not rely on a sp ecific parametric assumption on the distribution of the idiosyncratic sho ck ε . Under the logistic assumption adopted in the baseline mo del, Γ( p, U ) admits the closed-form expression giv en in Equation ( 6 ), which can b e written as Γ( p, U ) = p × p a ( p, U ) × − log 1 − p a ( p, U ) p a ( p, U ) . (10) The last term, m ( p a ) = − log(1 − p a ) /p a , is a con v ex and increasing function of p a , with lim p a → 0 m ( p a ) = 1 and lim p a → 1 m ( p a ) = + ∞ . Th us, for small p a , a second-order T a ylor expansion gives m ( p a ) ≈ 1 + p a / 2, so that Γ( p, U ) ≈ p h ( p, U ) × (1 + p a ( p, U ) / 2), where p h is the unconditional probability of b eing hired, p h ( p, U ) := p × p a ( p, U ) , (11) i.e., the pro duct of the hiring probability conditional on application and the application probabilit y . When application probabilities are empirically small, Γ is therefore well appro x- imated by p h , whic h rationalizes the strong empirical p erformance of hiring-based rankings do cumen ted in Section 5.2 . 12 More generally , one can show that if the distribution of ε is log-concav e, then the conditional surplus m ( p a ) is an increasing function of the application probability . The precise shap e of this function dep ends on the distributional assumption. App endix Figure H4 illustrates this additional term for three standard cases: logistic, Gumbel (EV1), and normal distributions, all normalized to hav e unit v ariance. The decomp osition ( 10 ) immediately implies that neither U , p , p a , nor p h alone is suffi- cien t to recov er the optimal ranking: eac h captures only a subset of the dimensions join tly determining Γ( p, U ). 2.5.2 Wh y ranking b y application probability is not optimal Ranking v acancies according to observ ed application b eha vior is a natural b enchmark, since applications are directly observed and summarize job seekers’ choices. Within the mo del, ho wev er, the Bellman equation makes clear that application b ehavior and welfare-relev an t v acancy v alues rely on fundamentally different ob jects. When a job seeker applies to a v acancy ( p, U ), the con tribution of this v acancy to her con tinuation v alue is prop ortional to p U − U ∗ 0 ( x, p ) + ε , where p is the probabilit y of b eing hired conditional on application. By con trast, the application decision itself is go verned by a threshold rule: a job seek er applies whenev er this expression is p ositiv e. As a result, application b ehavior only reveals whether applying is priv ately profitable, but abstracts from the probabilit y p that scales the contribution of the v acancy to exp ected w elfare. Two v acancies may generate the same surplus U − U ∗ 0 ( p ) + ε and therefore induce the same application decision, yet differ substan tially in their welfare con tribution b ecause they are asso ciated with different hiring probabilities p . This wedge follows directly from the dynamic structure of the search problem and provides a structural explanation for the inv ersion problem emphasized in the algorithmic fairness literature: a score that repro duces application b ehavior generally fails to reco ver the w elfare- relev ant ranking of v acancies. 2.5.3 Wh y ranking b y hiring probability is not optimal A closely related benchmark is to rank v acancies according to the probabilit y of hire p h ( p, U ) (see Equation 11 ). Using the decomp osition in ( 10 ), the optimal score can b e written as Γ( p, U ) = p h ( p, U ) × m p a ( p, U ) . 13 This expression shows that p h is still an incomplete measure of v acancy v alue. Under log- conca vity of the distribution of ε , the function m ( p a ) is increasing, implying that p h do es not place sufficient w eight on p erceiv ed utilit y and application b eha vior. Ranking b y p h underw eights v acancies that generate large conditional surpluses. That said, for standard distributions such as the logistic or Gumbel (EV1), the function m ( p a ) v aries relativ ely slowly when p a is small. As a result, in environmen ts where application probabilities are lo w, rankings based on p h ma y p erform reasonably w ell in practice, ev en though they are not theoretically optimal. 2.5.4 Tw o implemen table routes to welfare-orien ted recommendation Prop osition 2.2 characterizes the welfare-optimal ranking through the score Γ( p, U ). In practice, t w o routes can b e follow ed to implement such a ranking. Route A: structural implementation. A first approach is to reco v er the primitives en tering Γ( p, U ) by separately estimating a utility component U i,j and the probabilit y of recruitmen t p i,j , and then computing the w elfare score implied by the mo del. While con- ceptually direct, this route requires sp ecifying ho w observed platform signals map into the laten t utilit y ob ject U i,j . Route B: reduced-form welfare index. An alternativ e is to construct the welfare score directly from observ able transition probabilities. Let p a,i,j = P ( C i,j = 1 | x i , y j ) , p i,j = P ( H i,j = 1 | C i,j = 1 , x i , y j ) denote the probability of applying and the probabilit y of recruitment conditional on appli- cation. Under the logistic sp ecification discussed ab ov e, the welfare score can b e written as ( 6 )-( 10 ), whic h yields Γ i,j = p i,j [ − log(1 − p a,i,j )], up to a p ositiv e scale normalization. This second route is directly implemen table since it relies only on predicting applications and hires. The empirical strategy developed b elow follo ws this approach: we estimate b p a,i,j and b p i,j using the av ailable signals, construct b Γ i,j , and use it to form welfare-orien ted recom- mendation sets. Implemen ting such a w elfare-oriented ranking relies on the b eha vioral structure linking ap- plications to b oth the surplus comp onent U i,j and the probabilit y of recruitment p i,j . Es- tablishing the empirical relev ance of this structure is therefore a natural prerequisite for 14 algorithm design. 3 Random assignment of recommendation algorithms generates exogenous v ariation in the signals observed by job seek ers. This v ariation allo ws us to iden tify ho w application decisions resp ond to b oth utility-related signals and recruitment probabilities. 2.6 Iden tification of the ob jectiv e Γ from application data 2.6.1 Iden tification of ∆( p, U ) and reconstruction of Γ( p, U ) Under the logit taste-sho ck sp ecification, application decisions identify the surplus index ∆( p, U ) that gov erns job seekers’ application b ehavior. As Equation ( 6 ) shows, the w elfare- relev ant v acancy v alue Γ( p, U ) is a function of this surplus index. Giv en iden tification of ∆( p, U ), the structural assumptions of the mo del allo w us to reconstruct the w elfare-relev an t ob jective Γ( p, U ) and th us the optimal ranking. Iden tification of Γ( p, U ) in this framework therefore primarily hinges on the ability to iden tify ∆( p, U ) from application data. W e denote b y C i,j = 1 if job seek er i applies to v acancy j , and 0 otherwise. Let ˜ U i,j ≡ U i,j − U ∗ 0 ,i (1) denote utility net of the contin uation v alue of unemploymen t. 2.6.2 A sufficient parametric identification result W e provide a sufficient parametric iden tification result under a logistic sp ecification. Prop osition 2.3. L et ε b e distribute d as a lo gistic r andom variable with sc ale p ar ameter σ . Assume that se quenc es of individual i ’s applic ation de cisions on vac ancies j ar e observe d, to gether with p i,j and ˜ U i,j . Then, the p ar ameters α , 4 β , and γ in the binary choic e mo del P ( C i,j = 1 | p i,j , ˜ U i,j ) = F α ˜ U i,j − β /p i,j + γ (12) ar e identifie d. Mor e over, for generic values ( p, U ) , the structur al obje cts σ , k + R , ∆( p, U ) , and Γ( p, U ) in e quations ( 2 ) and ( 5 ) ar e identifie d as fol lows: (i) 1 /α identifies σ ; (ii) β /α identifies k + R ; (iii) U − ( β /α ) /p + γ /α identifies ∆( p, U ) ; (iv) p log 1 + e αU + γ − β /p /α identifies Γ( p, U ) . 3 While the exp eriments rep orted b elow provide evidence consistent with this b ehavioral structure, they do not identify the exact distribution of taste sho cks. 4 This α is not to b e confused with the v acancy-arriv al rates α 0 , α 1 . 15 Pr o of. See App endix B.1 . In Prop osition 2.3 , the assumption that ˜ U i,j is directly observed can b e relaxed b y allo wing for an individual-sp ecific error term ν i , so that utilities take the form ˜ U i,j + ν i . In this case, identification of σ , k + R , ∆( p, U ), and Γ( p, U ) follo ws from a fixed-effects panel logit sp ecification adapted from Equation ( 12 ). 2.7 Extensions and scop e This section discusses extensions of the baseline framew ork and clarifies the scop e of the analysis. Our ob jectiv e is not to provide a full treatment of these extensions in the main text, but rather to explain how the core insigh ts extend b ey ond the baseline mo del and to indicate where additional complexities arise. 2.7.1 F orward-looking job seekers The analysis in the main text fo cuses on my opic job seek ers. In Online App endix A.1 , w e extend the framework to allow for forward-looking b eha vior. W e address t wo issues. First, w e examine ho w to ev aluate the gains associated with the use of a RS when job seekers are not my opic. W e show that, using observ able data, it is p ossible to adjust the welfare ev aluation derived under the my opia assumption to accoun t for the endogenous adjustment of the reserv ation utilit y implied b y forw ard-lo oking b ehavior. Second, we consider the implications for RS design. While the optimal rule under my opia is no longer exactly optimal in this setting, recommendation sets constructed under this assumption can still b e impro ved. Although deriving a fully optimal rule with forward- lo oking job seek ers is challenging, the RS remains effectiv e in steering job seek ers tow ard v acancies with higher exp ected v alue. 2.7.2 Imp erfect knowledge ab out the distribution of opp ortunities The baseline mo del abstracts from p otential misp erceptions ab out the distribution of av ail- able v acancies. In practice, job seek ers may hold biased b eliefs ab out the t yp es of opp ortu- nities they are likely to encounter and form exp ectations accordingly . T o fix ideas, consider the case of m y opic job seekers. Absen t recommendations, job seekers base their searc h decisions on a sub jectiv e distribution of v acancies, whic h giv es rise to a con tinuation v alue denoted V J S 0 . By contrast, the true distribution of opp ortunities would 16 imply a v alue V T rue 0 . In tro ducing a RS provides access to v acancies dra wn from the true dis- tribution and yields a con tin uation v alue V m 1 , without mo difying the mo del-implied optimal ranking rule Γ m for recommended v acancies. The o v erall effect of the RS can therefore b e decomp osed as: V m 1 − V J S 0 | {z } F ull RS effect = V m 1 − V T rue 0 | {z } Pure RS effect + V T rue 0 − V J S 0 | {z } Information effect . This decomp osition highlights that, in addition to alleviating search frictions, RSs ma y gen- erate v alue by correcting job seek ers’ misp erceptions about the distribution of opportunities. 5 2.7.3 Comp etition and congestion The mo del abstracts from comp etition among job seekers and from congestion effects. At the recommendation stage, v acancies are ranked indep endently for eac h job seeker, so the RS effectiv ely solv es a collection of individual optimization problems. In environmen ts with man y job seek ers, this approac h may lead m ultiple individuals to b e recommended the same v acancy , potentially exacerbating congestion and altering effective hiring probabilities. Accoun ting for such in teractions w ould require formulating a global assignmen t problem that imp oses constraints on how often a v acancy can b e recommended. F rom an algorithmic persp ectiv e, this can b e implemen ted as a post-pro cessing step on top of a proximit y matrix b etw een job seek ers and v acancies, for instance using optimal transp ort metho ds that explicitly trade off match qualit y and congestion (see, e.g., Bied et al. , 2021 ; Masha yekhi et al. , 2023 ). In this pap er, w e delib erately abstract from congestion and fo cus on recommendation rules that ignore these in teractions. 3 Tw o represen tativ e job RSs Section 2 sho ws that w elfare-optimal recommendations m ust com bine t w o primitives: the utilit y U ( x, y ) a v acancy delivers to a job seeker and the probability p ( x, y ) that an appli- cation succeeds. This section presents the t wo RSs at the core of the pap er’s exp erimen tal 5 F ormally , sub jectiv e b eliefs can b e represented by assuming that job seek ers draw v acancies from a sub jective distribution dF J S 0 , while recommended v acancies are drawn from the true distribution dF T r ue 0 . The relation b etw een the tw o can b e expressed, for example, as dF T r ue 0 = ϕ ( p, U ) dF J S 0 , where ϕ ( · ) captures systematic belief distortions. Under this formulation, recommendations shift job seek ers from dra ws based on dF J S 0 to draws based on dF T r ue 0 , without altering the model-implied optimal ranking. F or forward-looking job seekers, the same logic applies, although the interaction with the endogenous reserv ation utility mak es the analysis more inv olved without altering the qualitative insight. 17 design, chosen precisely b ecause each emphasizes one of these t wo comp onents. The first, a state-of-the-art ML algorithm trained on realized hires, primarily targets p ; the second, a kno wledge-based matc hing algorithm derived from job seek ers’ stated searc h criteria, primar- ily targets U . Neither is w elfare-optimal in isolation (Prop osition 2.1 ), but they pro vide the building blo c ks for the w elfare-appro ximating algorithms constructed in Section 4 . Before describing these tw o systems, w e briefly situate them within the broader RS landscap e. 3.1 Man y forms of RSs All RSs op erate according to a common principle: they rely on the computation of a matc hing score that summarizes information ab out the exp ected v alue of a job seek er–v acancy matc h. Sp ecifically , for an individual i describ ed b y a set of characteristics x i and a v acancy j describ ed by c haracteristics y j , the system computes a score S i,j dep ending on x i and y j . Higher v alues of S i,j indicate a stronger match and are therefore preferred. Once these scores are computed, generating recommendations is straigh tforw ard. F or a giv en job seek er i 0 , v acancies are ranked according to their scores S i 0 ,j from the most to the least desirable. T o make k recommendations to i 0 , an intuitiv e solution is to pick the k v acancies with the highest scores. 6 Although this underlying principle is shared across systems, job recommendation approac hes v ary widely in b oth the computer science literature and real-w orld applications. As surv eyed b y F reire and de Castro ( 2021 ); De Ruijt and Bh ulai ( 2021 ); Mashay ekhi et al. ( 2022 ), this diversit y reflects a multitude of application contexts, data a v ailability , and algorithmic strategies. Imp ortantly , these approaches also differ in the type of information they exploit and in the outcomes they are designed to predict. T able 1 summarizes the main families of approac hes and highligh ts their key characteristics. Know le dge-b ase d RSs leverage exp ert ontologies of o ccupations, skills, and lo cations to match w orkers to v acancies based on assessed fit. A prominen t example is WCC ELISE, used b y sev eral PESs and priv ate en tities. 7 An alternativ e class of approaches lev erages machine learning tec hniques. Col lab or ative filtering relies on interaction histories to infer similarity patterns, as in the clic k-based algorithm studied b y Hensvik et al. ( 2022 ) at the Sw edish PES. By contrast, c ontent-b ase d RSs exploit observ able c haracteristics ( e.g. o ccupation, education and skills) to predict interaction probabilities; CareerBuilder pro vides an example ( Zhao et al. , 2021 ). 6 Throughout the pap er, we define the rank of a v acancy as its p osition in this ordering, with rank 1 corresp onding to the highest score. 7 See the dedicated websites Rob ert Half and ELISE . 18 Hybrid RSs combine these approaches. Examples include the RecSys 2017 winner ( V olko vs et al. , 2017 ) or Link edIn’s system, whic h predicts matc hes based on user and v acancy c harac- teristics, incorp orating individual and recruiter-lev el fixed effects when sufficient in teraction data are a v ailable ( Shi et al. , 2022 ). Finally , Indeed’s RS (see Ma et al. , 2022 ) combines collab orativ e filtering and conten t-based metho ds, with a final hybrid stage in volving deep learning and a rule-based engine. Bey ond algorithmic design, an imp ortan t dimension of heterogeneit y across RSs concerns the c hoice of target v ariable. T able 1 summarizes selected contributions from data science and economics, as w ell as the algorithms studied in this pap er. The table highligh ts substantial v ariation in outcome measures, ranging from clicks and applications to hires. Notably , data science contributions predominantly fo cus on intermediate outcomes such as clicks or applications, whereas economic studies typically emphasize hires. Our pap er implements an exp erimen tal comparison of RSs with different designs within the same setting, ev aluated against a common welfare metric derived from the mo del. This contrasts with the existing literature, where studies typically ev aluate one or tw o pre-sp ecified algorithms targeting differen t outcomes in different p opulations, making cross-study comparisons difficult. 3.2 A state-of-the-art RS based on hiring predictions W e present the baseline ML-based RS we initially developed (see Bied et al. , 2021 ; Bied and al. , 2023 , for arc hitectural details and related literature). This is a state-of-the-art con tent-based RS building on the insigh ts of the winning algorithm of the RecSys 2017 c hallenge ( V olk ovs et al. , 2017 ). In the framew ork developed in Section 2 , this algorithm can b e interpreted as primarily targeting the probability of successful matching p ( x, y ). It is trained on data from job seek ers who found employmen t, using the v acancy that led to a hire as the p ositiv e example for each job seeker, and a set of v acancies that did not result in a hire as negative examples. The training ob jective seeks to rank the realized match ab o v e the alternativ es for each job seeker, it do es not directly maximize reemploymen t rates, but rather learns a score that separates successful from unsuccessful job seeker, v acancy pairs. Mo del p erformance is naturally ev aluated using recall@ k : the share of job seekers i hired a giv en w eek for whom the algorithm ranks the realized v acancy among the top k recommenda- tions av ailable that w eek, where k is usually 10, 20, 50, or 100. While the recall@ k provides a meaningful ev aluation metric, it is intractable for direct optimization. W e therefore follow the le arning to r ank literature, and learn a similarity score S i,j b et w een job seek er i and v acancy j . The ob jectiv e is to ensure that, for any job seeker i , the score asso ciated with 19 T able 1: Examples of differen t RSs References Setting Knowledge Collaborative Conten t T arget Type of based Filtering based v ariable Recom. WCC Elise National PESs, x Robert Half Zhao et al. ( 2021 ) CareerBuilder x Applications V acancies Shi et al. ( 2022 ) LinkedIn x x Applications, “sav e” V acancies V olko vs et al. ( 2017 ) Xing challenge x x Impressions, clicks V acancies Ma et al. ( 2022 ) Indeed x x x Clic ks, Applications V acancies RSs tested in Economics Hensvik et al. ( 2022 ) Swedish PES x Clicks V acancies Altmann et al. ( 2022 ) Danish PES x Hires Occupations Behaghel et al. ( 2024 ) F rench PES x x Hires Firms Belot et al. ( 2025 ) Dutch PES x x Hires Occupations B¨ achli et al. ( 2025 ) Swiss PES x Skills profile fit Occupations Our tested RSs U - rec F rench PES x Utility V acancies V adore .0 F rench PES x Hires V acancies XGBoost F rench PES x Hires V acancies Applica tion F rench PES x Applications V acancies V adore .2 F rench PES x Applications, Hires V acancies Mix 1 ⁄ 4 , Mix 1 ⁄ 2 , Mix 3 ⁄ 4 F rench PES x x Utility , Hires V acancies Mix - 1 / 2 ( V ad ore .2) F rench PES x x Utility , Hires, Appl. V acancies the realized match j ∗ ( i ) exceeds that of any alternativ e v acancy j ′ . This leads to minimizing the triplet mar gin loss corresponding to the following ob jectiv e: min S X i X j ′ = j ∗ ( i ) [ S i,j ∗ ( i ) − S i,j ′ + η ] + , (13) where η > 0 is a scalar hyperparameter, [ x ] + = max( x, 0), the outer sum ranges o ver all job seekers with matches, the inner one o ver all v acancies (see, e.g. , W einberger and Saul , 2009 ). The ob jective enforces a separation of at least η b et ween the scores of matc hed and unmatc hed v acancies for eac h job seek er. Giv en job seek er and v acancies charac teristics, resp ectiv ely denoted b y X i and Y j , the score S ij is defined as: S i,j ( X i,j ) = ϕ ( X i ) ⊤ Aψ ( Y j ) , where X i,j = ( X i , Y j ), ϕ, ψ are feed-forward neural net works with sev eral la yers, and A is an affinit y matrix. F eed-forward neural netw orks provide flexible, differen tiable represen tations w ell suited to high-dimensional inputs and large datasets. 8 In this con text, ϕ ( X i ) and ψ ( Y j ) can b e interpreted as latent representations of job seeker i and v acancy j . The matrix A captures cross-dimensional affinities: the parameter A k,l 8 The interested reader may consult Goo dfello w et al. ( 2016 ) for a textb o ok treatment. 20 measures the complemen tarity b etw een dimension k of the job seekers’ laten t space and dimension l of the v acancy’s laten t space. Both latent spaces ha ve dimension 872. T able 2 lists the observ able c haracteristics used on the job seek er and v acancy sides to predict hires. Imp ortan tly , ϕ , ψ and A are given a structure which incorp orates three main blo c ks corre- sp onding to geograph y , skills, and all remaining features. This design explicitly incorp orates k ey dimensions emphasized in the job recommendation and lab or mark et literature, most no- tably lo cation and (soft) skills (see Belot et al. , 2019 , 2025 ; Altmann et al. , 2022 ; B¨ ac hli et al. , 2025 ), while leveraging the p o w er of ML metho ds to detect the most promising interactions and transitions. F ormally (see Figure H5 ), the similarity score decomp oses as S i,j ( X i,j ) = X b ∈{ “ g eog r aphy ” , “ sk ills ” , “ other f eatur es ” } ϕ b ( X i ) ⊤ A b ψ b ( Y j ) , where ϕ b , ψ b and A b are blo ck-specific transformations and affinity matrices. The parameters that are optimized during training include the neural net work w eigh ts defin- ing the mappings to the laten t spaces, as w ell as the affinit y matrices A b . The resulting non-con vex ob jective is minimized using mini-batch sto chastic gradient descen t. F or com- putational tractability , non-matc hing job seeker–v acancy pairs are hea vily and uniformly subsampled. Finally , for a giv en job seeker i 0 , we define the P -ranking as the ordering of v acancies induced b y the score S i 0 ,j . Data used to train algorithms. Three features of the data are particularly relev an t for this study . First, administrative records on job seek ers and v acancies are matched to b eha vioral data (clic ks, applications, and hiring outcomes) on the same platform, providing a join t view of both sides of the mark et and the interactions b et ween them. Second, we observ e clic k data alongside application data, allowing us to distinguish early-stage interest from actual application decisions; the use of clic k data to measure job seek ers’ expressed in terest at this early stage of online search is nov el in this con text. Third, the scale of the data, o v er 1.1 million job-seek er search sessions, 516,776 unique v acancies, and 75,744 observ ed hires, enables reliable training of high-dimensional ML mo dels and estimation of the structural application mo del. W e use ric h historical administrativ e data from the Public Employmen t Service (PES) to train and ev aluate sev eral job recommendation systems (RSs). T able H6 summarizes the t yp e of data used in this pap er. This includes descriptions of v acancies p osted on the PES, 21 job seekers’ characteristics and search parameters, as w ell as user interactions on the PES w ebsite, suc h as clic ks, applications, and subsequen t hiring outcomes. Our analysis fo cuses on the former F rench region of Rhˆ one-Alp es, which offers substantial economic and geographic div ersity while remaining sufficien tly con tained for detailed empirical analysis. The PES w ebsite is op en to all employ ers and job seekers and constitutes the largest platform for v acancy p ostings in the F rench lab or market. 9 The data provide extensive information on job p ostings, including publication date, the o ccupation at sev eral levels of granularit y , the p osted w age, required exp erience; con tract type (p ermanent, temp orary , or fixed-term); w orkplace lo cation; weekly working hours; and required qualifications. Imp ortantly , the data con tain information on desired hard and soft skills, textual descriptions of b oth the v acancy and the firm, firm size, the num b er of applications receiv ed b y the v acancy and by the firm o ver the previous six months, and the time elapsed since the v acancy w as p osted. Information on job seekers is drawn from administrative records on unemploymen t sp ells (for example, the fichier historique , FH, of the PES). These records include demographic c haracteristics and detailed job searc h histories, such as date of registration, geographic lo cation, exp erience, skills, unemplo yment duration, applications in the last six mon ths. They also con tain v arious individual and p ostal co de lev el so cio-demographic characteristics. Imp ortan tly , we observe job search parameters declared at registration, including reserv ation w age, maxim um commuting time, desired o ccupation, desired type of contract (temp orary vs. long-term), and working hours (full-time vs. part-time). This comprehensiv e information on b oth sides of the market is complemented by detailed data on user b ehavior on the PES website, notably clicks on v acancies and subsequent ap- plications. While application data from the PES hav e b een used in previous w ork (see Marinescu and Sk andalis , 2021 ; Glo v er , 2019 ; Algan et al. , 2020 ), the use of clic k data to measure job seekers’ interest at the early stages of online search app ears to b e no v el in this con text. Applications are observ ed through three of the PES c hannels: applications submit- ted directly b y job seek ers, p oten tial matc hes initiated b y firms, and applications suggested b y PES casework ers. Finally , w e also exploit the final outcome of these in teractions, whether a hire o ccurs, which is recorded b y casew ork ers. 10 9 Using the same application data, Le Barbanc hon et al. ( 2021 ) estimate that v acancies p osted on this w ebsite represented 60% of all v acancies in 2010 (see their Section VI.A.) 10 As noted in Algan et al. ( 2020 ), these hiring data are sub ject to measuremen t error, notably because hires o ccurring outside the PES may not be observ ed. T o mitigate this limitation, we complement the PES records with comprehensive administrative data on all hires ( D´ eclar ations pr´ ealable ` a l’emb auche ) whenever a hire can b e link ed to an identifiable PES p osted v acancy . 22 3.3 An RS based on searc h criteria The F rench PES relies on a matching algorithm based on WCC Elise to recommend relev ant v acancies to job seekers. Lik e most knowledge-based RSs, this algorithm starts from a comparison b etw een characteristics of the job desired by job seek ers and those of the av ailable v acancies and can b e in terpreted, in the framework dev elop ed in Section 2 , as primarily capturing the utility comp onent of a job seek er–v acancy matc h. F or eac h characteristic considered, a sub-score is determined, ranging from zero to one, reflecting the degree of compatibilit y b etw een the job seeker’s preferences or profile and the v acancy’s requirements. The sub-scores are then aggregated to form a global score. Aggregation is primarily based on a weigh ted a verage. F or the purp ose of this study , we construct a RS inspired by the PES algorithm and based on the same set of criteria. Eac h criterion is matched exactly with its counterpart on the recruiter’s side ( i.e. , the requiremen ts sp ecified in the v acancy and the characteristics of the job offered). F or each characteristic k , we define a consistency measure c k,i,j ∈ [0 , 1], whic h captures the degree to which c haracteristic k of job seeker i is compatible with that of v acancy j . The characteristics entering the definition of the score and their asso ciated w eights are as follo ws: Occupation (0.332), Skills in o ccupation (0.332), Geographic mobility (0.1), Reser- v ation wage (0.066), Diploma (0.033), W orking hours (0.033), Driving license (0.033), Lan- guages (0.033), Y ears of experience in o ccupation (0.033), Duration and t yp e of con tract (0.003). The resulting matching score is defined as: 11 U i,j = K X k =1 w k c k,i,j . (14) W e refer to the ordering of v acancies for a giv en job seek er i 0 according to the criterion U i 0 ,j as the U ranking. As for the P -based RS, recommendations are the v acancies ranked highest (i.e., with the largest score) under this ordering. 11 Throughout the pap er, we use the formula from Equation ( 14 ) together with the weigh ts used by the PES. The score U P E S actually used by the PES and the score U - rec used in our exp eriments are not iden tical. The exact criteria used at the PES share the same principles but allow for smo other definitions of several sub-criteria and incorp orates additional nonlinearities, such as censoring based on geographic fit. W e abstract from these features here in order to preserve transparency and interpretabilit y . 23 T able 2: Information used b y the search criteria and machine-learning RSs Searc h criteria RS Mac hine-learning RS Job seeker data Skil ls and qualific ations Skills; Diploma; Languages Skills ( SVD/em b eddings ); Diploma; Languages; Soft skills (14) L ab or market history Exp erience; Occupation (3-digit) Exp erience; Occupation (1–3 digit) Constr aints and pr efer enc es Lo cation; W orking hours; Reserv ation wage and mobility Lo cation; W orking hours; Reserv ation wage and mobility ( history ) Demo gr aphics and se ar ch b ehavior — Age; Sex; Children; Search type ; Constrain ts; Applications V acancy data Job re quir ements Skills; Diploma; Experience Skills ( SVD/em b eddings ); Diploma; Qualification ; Soft skills (14) Contr act and pay Con tract type; W orking hours; W age Con tract type; W orking hours W age; Duration Firm and p osting char acteristics Lo cation Lo cation; Firm size and status; Posting age ; Applications T extual information — Job and firm descriptions Notes: Differences in terms of data used are highligh ted in b old . 3.4 Understanding the tw o RSs The U score as a utilit y signal . Our previous analysis shows that any recommendation algorithm score can b e in terpreted as a com bination of t wo comp onents: a signal ab out utilit y , U i,j − U ∗ 0 ,i (1) and a signal ab out the probability of recruitment, p i,j . Consequently , the scores asso ciated with the different RSs generally mix information ab out b oth dimensions. W e in terpret the U score primarily as a signal of surplus utility U i,j − U ∗ 0 ,i (1). Salary is the job attribute most directly link ed to utility , but the other job c haracteristics included in the definition of U such as o ccupation, required skills, geographic lo cation, working hours, and con tract type also plausibly affect job seekers’ utility . Similarly , requiremen ts related to diplomas, exp erience, driving licenses, and languages describ e the set of skills that a job seek er would deplo y in the p osition. Skill matc hing is not only relev ant for productivity but is also asso ciated with job satisfaction, p ersonal fulfillment, and the accum ulation of h uman capital, all of which are v alued by job seekers. The weigh ts used to aggregate these c haracteristics are those set b y the PES. Nev ertheless, as shown in App endix I , these w eights can alternativ ely b e estimated from the data at our disp osal using application b ehavior. The P score as a match probabilit y signal . Analogously , w e interpret the ranking in- duced by the P score as primarily reflecting the probability of recruitmen t, p i,j . Appendix D 24 pro vides empirical supp ort for this in terpretation. F ollo wing the approach of Chernozh uk ov et al. ( 2018 ), we use the predictiv e con tent of the ML algorithm’s score to build a generic best logistic predictor of the matching probability . Sp ecifically , we exploit the history of se quen- tial job applic ations to estimate a mo del linking the probabilit y of a successful application to the matc hing score b et ween job seeker i and the v acancies j ( i ) to which they applied. The results in T able D1 strongly v alidate the asso ciation b et ween the score S i,j and recruitmen t outcomes. This pro cedure also allo ws us to map the score S i,j in to an estimated probability of success, p i,j . As a result, the rankings induced by the S -score and P -score, which we call P -ranking, can b e in terpreted as rankings based on recruitment probabilities. 12 Tw o differen t scores . Figure E2 compares the sets of top-ranked v acancies recommended to a giv en job seek er under the U and P rankings. The ov erlap b etw een the v acancies rank ed highest according to each criterion is v ery limited. On av erage, the v acancy that maximizes P is ranked 2,027th in the U ordering, while the v acancy that maximizes U is rank ed 4,403rd in the P ordering. These large rank reversals highligh t that the t wo scores emphasize mark edly differen t dimensions of job seeker–v acancy matc hes. App endix E further do cumen ts these differences b y comparing the distributions of U and P among the top-ranked v acancies under each criterion (see Figure E3 ). F or example, the median probability of success of a v acancy recommended under the U ranking is 0.02, compared with 0.06 for a v acancy recommended under the P ranking. T aken together, these results supp ort the intuitiv e interpretation that the U -based RS pri- marily captures the utilit y dimension, while the P -based RS primarily captures the probabil- it y of successful matc hing. This distinction is useful for exp ositional clarity . Ho wev er, neither score was originally designed to isolate a single dimension. There is no guarantee that U i,j p erfectly identifies U i,j − U ∗ 0 ,i (1) and that P i,j p erfectly identifies p i,j . More plausibly , b oth scores are functions of the tw o underlying comp onen ts, suc h that U i,j = U ( U i,j − U ∗ 0 ,i , p i,j ) and P i,j = P ( U i,j − U ∗ 0 ,i , p i,j ). Ev en if U predominan tly reflects utility and P predominantly reflects recruitment probabilities, each score is likely to contain information ab out b oth di- mensions. The framework of Section 2 identifies the theoretically correct com bination, and the exp eriments of Section 4 are designed to test whether algorithms that mo v e in this di- rection, b y enric hing hiring-based predictions with preference-related signals, deliver w elfare gains in practice. Imp ortantly , U and P were dev elop ed indep enden tly of this in terpretation and w ere not designed to b e com bined; the mo del provides the basis for doing so. 12 This approach pro vides us with an estimate of p i,j for each application–v acancy pair. This quan tit y is t ypically unobserved, but is revealed here through the machine-learning-based estimation. 25 4 Using field exp erimen ts to design recommender sys- tems This section rep orts t wo randomized field exp eriments that are distinctive in three resp ects. First, six algorithms are compared head-to-head in the same setting, using the same p op- ulation and the same outcome measures, a direct exp erimen tal comparison of this breadth do es not exist in the prior literature. Second, the set of algorithms spans the full sp ectrum from welfare-misaligned (pure P or pure U ) to welfare-appro ximating ( V adore .2), so the exp erimen ts trace the welfare gains from progressiv ely b etter-aligned designs. Third, the design of the second exp eriment is deriv ed from the theoretical predictions of the mo del and guided b y the results of the first exp erimen t, as part of an iterativ e learning cycle. The first field exp eriment (b eta-test 1) tests whether job seekers resp ond more fa v orably to recommendations that com bine hiring-based and preference-based rankings than to recom- mendations based on either dimension alone, the core prediction of Prop osition 2.1 . Section 3 and App endix E establish that the P and U rankings differ substan tially , so this comparison has empirical bite. The results of this exp eriment motiv ate a redesign of the algorithm that more directly incorp orates preference information while maintaining hiring prediction as the primary ob jective. The second field exp eriment (b eta-test 2) ev aluates a new family of algorithms designed in resp onse to these results, including an application-based algorithm ( Applica tion ) and an enric hed hiring-prediction algorithm ( V adore .2) that incorp orates b oth preference-related and application-related signals. Applica tion plays a dual role: it is a theoretically mean- ingful b enchmark closely related to job seekers’ decision rules, and a building blo ck used to impro ve hiring predictions in V adore .2. The tw o field experiments w e conducted follo w the same proto col, whic h is describ ed in detail in App endix F . T able F3 summarizes these exp erimen ts. The eligible p opulation consists of job seekers registered at F rance T rav ail in the Auv ergne-Rhˆ one-Alp es region who w ere activ ely seeking emplo yment. In eac h exp eriment, a single email w as sent to a randomly se- lected sample of job seekers among this p opulation, resp ectively 102,314 for the Marc h 2022 exp erimen t and 150,000 for the June 2023 one, providing access to a list of job recommenda- tions. Job seek ers who clic k ed the consen t link and view ed the list were enrolled, resulting in 18,947 and 30,973 participan ts, resp ectively . There is no control group; instead, participants w ere randomly assigned to recommendation lists generated b y different algorithms. The first exp erimen t fo cuses on com bining the tw o generic algorithms presented in Section 3 . The second exp eriment emphasizes new algorithms dev elop ed based on insights from the first ex- 26 p erimen t. In b oth exp eriments, we analyze the U and P scores of recommended v acancies, as w ell as clicks, applications, and hires. 4.1 Beta-test 1: testing ordinal combinations of U and P 4.1.1 Exp erimental design and treatmen ts The exp erimen t randomized t w o dimensions of the interv en tion: (i) the algorithm use d to gener ate job r e c ommendations , and (ii) the display of additional information . Job seek ers w ere randomly assigned to one of ten treatment arms, corresp onding to fiv e algorithmic v ariants crossed with t wo display conditions. Recommendation algorithms All recommendations are dra wn from a c onsider ation set , a p o ol of v acancies that includes job v acancies highly ranked b y at least one of the t w o base algorithms ( V adore .0 or U - rec ). This ensures that the recommended v acancies are relev an t according to either match likelihoo d or stated preferences. Eac h job seek er w as randomly assigned to one of five algorithms, whic h differed in ho w they selected and ranked job v acancies from within this consideration set: 13 - V adore .0 (ML-based recommendations): The RS ranking v acancies using the P score (detailed in Section 3.2 ), designed to predict successful matches. - U -rec (Preference-based recommendations): The RS using the U score (see Sec- tion 3.3 ), which ranks v acancies based on the job seeker’s stated preferences. On top of this baseline score, it also includes a final censoring step based on the geographic fit (see fo otnote 11 ). - Mix algorithms (ordinal com binations of V adore .0 and U -rec): Three hybrid v ariants combine the rankings from V adore .0 and U - rec , relying solely on ordinal information. The steps are as follo ws (see App endix F.2 for details): 1. Rank v acancies in the consideration set according to V adore .0 ( P ); 2. Filter v acancies in the consideration set: - Mix- 1 / 4 : Retains the top 25% according to P ranking; 13 Indep enden tly of the recommendation algorithm, job seekers w ere also randomly assigned to different information displa y conditions. Some participan ts w ere sho wn additional performance indicators (star ratings summarizing preference match and predicted hiring probability) for the first tw o recommended v acancies. In the main analysis, we p o ol all display conditions. App endix T able H9 shows that accoun ting for this v ariation do es not affect our conclusions. 27 - Mix- 1 / 2 : Retains the top 50% according to P ranking; - Mix- 3 / 4 : Retains the top 75% according to P ranking; 3. Re-rank the filtered v acancies using the U ranking; 4. Select the 10 first v acancies in this ranking. W e refer to these three v arian ts collectively as the Mix group. Clearly , the corresp onding algorithms, ordered as V adore .0, Mix - 1 / 4 , Mix - 1 / 2 , Mix - 3 / 4 , and U - rec , progressively shift the w eight from P to U ranking. Surv ey proto col and data description. Each of the 102,314 job seekers randomly se- lected for in vitation to the exp erimen t w as first assigned to one of ten randomization groups. They received an email con taining a link to a Qualtrics surv ey in which job ads w ere listed. Of the 102,314 individuals in vited, 100,879 successfully receiv ed the email (the remainder w ere affected b y tec hnical issues), and 18,947 (18.6%) op ened the surv ey , thereby enrolling in the exp eriment. Each job seeker w as sho wn the top 10 ads corresp onding to their profile according to the algorithm to which they w ere assigned. 4.1.2 Reduced-form estimates W e estimate the following sp ecification at the job seeker–v acancy pair level using ordinary least squares (OLS): Y ij = X a ∈A 1 β a G a,i + γ ⊤ Z i + ϵ ij , (15) where Y ij denotes one of the following outcomes for job seeker i and v acancy j : the hiring score ( P ), the matc hing score ( U ), whether the job seek er click ed or applied to the v acancy , or the sub jectiv e rating given to the v acancy . The indicator G a,i denotes assignmen t of individual i to algorithm a ∈ A 1 = { V adore .0 , Mix − 1 / 4 , Mix − 1 / 2 , Mix − 3 / 4 , U - rec } . The vector Z i includes a set of indicators for the p osition of the v acancy in the display ed list (slots 1 to 10). Standard errors are clustered at the job seek er lev el. Figure 1 (see also T able H7 , taking U - rec as reference) presents the results using data from the 18,947 job seekers randomly assigned to receive job recommendations from one of the fiv e algorithms. 14 14 Preregistered outcomes for this b eta-test are: ratings, clic ks and applications on recommended v acancies. W e also preregistered broader lab or market outcomes related to job search but do not use them here. 28 Figures 1 -(a) and 1 -(b) use the full set of 10 job recommendations pro vided to each partici- pan t (for a total of 189,470 observ ations) to examine how the assigned algorithm affects the distribution of v acancies b y predicted hiring probability and matc hing score. As intended b y the exp erimen tal design, assignmen t to algorithms with higher w eigh t on V adore .0 results in higher a v erage hiring scores ( P ) but low er matc hing scores ( U ). Sp ecifically , compared to v acancies recommended b y U - rec , recommendations from V adore .0 ha ve an av erage hiring score that is 0.046 p oin ts higher (against a baseline mean of 0.054), representing nearly a doubling in expected hiring probability . All estimated coefficients are statistically significan t, and we observ e a large jump in hiring scores b etw een Mix - 3 / 4 and Mix - 1 / 2 . The three al- gorithms with greater weigh t on V adore .0 ( V adore .0, Mix - 1 / 4 , and Mix - 1 / 2 ) yield similar outcomes on this dimension. Con versely , matc hing scores ( U ) decline mark edly as the weigh t on V adore .0 increases. V acancies recommended b y V adore .0 ha v e an av erage matching score 0.19 p oints lo wer than those recommended by U - rec (baseline: 0.773). The pattern of decreasing U scores mirrors the increase in P scores, and again, the first three algorithms ( V adore .0, Mix - 1 / 4 , Mix - 1 / 2 ) yield relatively close estimates. Figures 1 -(c) uses data on sub jective ratings pro vided by job seekers for the first t wo rec- ommended v acancies (36,668 observ ations). These ratings range from 0 to 10 and were elicited via the question: “Over al l, what r ating out of 10 would you give this job vac ancy?” . In T able H7 , all treatment co efficien ts are p ositive and statistically significan t, indicating that v acancies recommended by algorithms in A 1 \ {U - rec } are rated more fa v orably than those recommended by U - rec . Imp ortantly , the highest co efficient is not associated with V adore .0, but—as anticipated from the mo del presented in the previous section, with hy- brid algorithms that combine the rankings of U - rec and V adore .0. The Mix - 1 / 2 algorithm yields the highest av erage rating. Figures 1 -(d) and 1 -(e) presen t results for clicks and applications using again the full set of ten recommendations p er job seek er. Both outcomes are relatively rare, particularly appli- cations. The low est rates are observed under U - rec : 4.2% for clic ks and 0.45% for appli- cations. Clic k b ehavior follows a pattern consistent with the sub jectiv e ratings: algorithms ( V adore .0, Mix - 1 / 4 , Mix - 1 / 2 ) yield relativ ely close and higher estimates, the difference with U - rec b eing p ositive and statistically significan t. The Mix - 1 / 2 algorithm again pro duces the largest increase, with a click rate 0.64 p ercentage p oints higher than U - rec , an increase of appro ximately 15%. Application rates are also higher under V adore .0 and Mix - 1 / 2 , with the former effect b eing significant at the 10% lev el and representing roughly 16% increases relativ e to the U - rec baseline. Since we only observ ed three hires based on the recommen- 29 dations made in this first exp eriment, the results regarding the effects on hiring are not significan t and are therefore not rep orted. 4.2 Designing new algorithms based on the exp erimen tal results The key finding of b eta-test 1 is that the hybrid algorithm Mix - 1 / 2 , which com bines b oth P and U rankings, outp erforms the t w o pure strategies on ratings and clic ks. This is the empir- ical counterpart of Prop osition 2.1 : since ∆( p, U ) and Γ( p, U ) are not ordinally equiv alen t, neither utility-based nor hiring-based rankings alone suffice for welfare-optimal recommen- dations. These results therefore motiv ate the exploration of additional recommendation principles consisten t with the mo del. Building on this insigh t, we consider tw o complemen tary directions for extending the initial recommendation scores. First, the mo del highligh ts application b ehavior as a k ey b ehavioral ob ject. As shown in Section 2 , application decisions iden tify the surplus index ∆( p, U ) that gov erns job seekers’ c hoices. A recommendation score based on predicted applications therefore constitutes a theoretically meaningful benchmark, ev en though it do es not coincide with the welfare-relev an t score Γ. W e accordingly train a RS that predicts applications rather than hirings, whic h we denote Applica tion . Beyond its role as a b enc hmark, this score pro vides an empirical proxy for p erceived job utilit y , which is not directly observ ed. Second, the mo del implies that welfare-relev an t rankings dep end not only on hiring prob- abilities but also on job seek ers’ preferences. T o op erationalize this dimension within a hiring-based RS, we enrich the original hiring-prediction algorithm by incorp orating the preference comp onents c k,i,j used in the U score (see Equation ( 14 )) as additional predictors. This mo dification yields an in termediate v ersion of the algorithm, denoted V adore .1. W e then com bine these tw o extensions b y introducing the application-based score as an addi- tional input in to the hiring-prediction architecture used for V adore .1. This results in the final algorithm, V adore .2, whic h augments hiring predictions with information on b oth job seek ers’ preferences and application b eha vior. Figure H6 sc hematically illustrates how these comp onen ts are integrated within the algorithm. Imp ortan tly , the algorithms ev aluated in the second field exp erimen t also allow us to assess empirically a natural appro ximation of the welfare-relev ant score c haracterized in Section 2 . As sho wn in the mo del, the optimal score can b e written as Γ( p, U ) = p h ( p, U ) × m p a ( p, U ) , where the function m ( · ) is increasing in the application probabilit y under fairly general conditions. While p a ( p, U ) is not directly observ ed, b oth application-based predictions and preference-based scores provide empirical proxies that are p ositively related to job seekers’ 30 F-test: F=899.6, p=0.000 (a) U F-test: F=1423.1, p=0.000 (b) P F-test: F=6.73, p=0.000 (c) Rating F-test: F=2.917, p=0.02 (d) Clicks F-test: F=1.123, p=0.344 (e) Applications Figure 1: Beta-test 1: Effects of algorithm assignment on v acancy character- istics and job-seeker resp onses Notes: Each panel rep orts co efficient estimates from separate regressions of the indicated outcome on recommendation-treatment indicators, controlling for ad fixed effects. Poin ts represent estimated co efficien ts and bars denote 95% confidence interv als. Standard errors are clustered at the job-seeker lev el. Outcomes P , Clicks, Applications, and Hirings are rescaled as indicated in the figure lab els. F-tests corresp ond to the F-statistic and p-v alue from a join t test of significance of all estimated co efficien ts, with U - rec tak en as the reference group. 31 prop ensit y to apply . F rom this p ersp ective, combining a hiring-based score with additional information on job utilit y constitutes a conceptually grounded w a y of enriching p h ( p, U ) in the direction sug- gested by the model. In particular, mixing the hiring score produced b y V adore .2 with the U score amounts to testing whether reinforcing the utilit y con tent of a hiring-based RS improv es p erformance, in line with the monotonicity prop erties implied by the mo del. Although alternativ e com binations, such as directly mixing p h with predicted application probabilities, w ould also b e consisten t with this logic, the mixtures considered here allow us to assess whether incorp orating job utility in to hiring-based recommendations mo v es the algorithm in the direction predicted by the theory . 4.3 Beta-test 2: ev aluating the mo del-guided algorithm family 4.3.1 Exp erimental design and treatmen ts The second field exp erimen t is designed to ev aluate the relativ e p erformance of the new algorithms dev elop ed in resp onse to the results of the first b eta-test. Its ob jective is t wofold: first, to compare these newly designed algorithms against one another; second, to b enc h- mark them against the tw o reference algorithms based on hiring predictions ( P ) and stated preferences ( U ) that motiv ated the initial analysis. Among the six algorithms tested in this second exp erimen t, t w o were already included in the March 2022 study and serv e as b enchmarks: U - rec and V adore .0. 15 They are comple- men ted by four additional algorithms that reflect different wa ys of incorp orating preference- related information in to hiring-based recommendations. These include the enhanced hiring- based algorithm V adore .2, whic h integrates the design improv emen ts describ ed ab ov e; the Applica tion algorithm, whic h predicts application b eha vior and serves b oth as a theoret- ically meaningful b enchmark and as an input into V adore .2; and a hybrid ranking that com bines V adore .2 and U - rec , denoted Mix 1 / 2 ( V adore .2), constructed in the same spirit as the mixtures tested in the first exp eriment. Finally , we include XGBoost , a b enchmark algorithm based on gradient b o osting that mirrors the ob jectiv e of V adore .0 (predicting hires) but replaces neural net works with a standard gradient-bo osting architecture. Its pur- p ose is to disentangle the effect of the recommendation obje ctive from the effect of the ar chite ctur e : since V adore .0 and XGBoost target the same outcome but differ in their ML metho d, any p erformance difference b etw een them reflects architectural choices rather 15 Although their architecture is unchanged, b oth algorithms were retrained using more recen t data to reflect lab or market conditions prev ailing at the time of the June 2023 exp eriment. 32 than the w elfare alignment of the ob jectiv e. Conv ersely , differences b etw een X GBoost and the w elfare-enric hed algorithms ( V adore .2, Applica tion ) reflect ob jective alignment rather than architecture. The full set of algorithms ev aluated in this second exp eriment is therefore: 16 A 2 = { V adore .0 , V adore .2 , Mix 1 / 2 ( V adore .2) , Applica tion , XGBoost , U - rec } . The exp eriment closely replicated the design of the 2022 study . As in the earlier exp eriment, job seek ers were invited by email and enrollment w as conditional on clic king a consent button. The surv ey templates were kept very similar to those previously used. Conducted in June 2023, the exp eriment invited 150,000 job seek ers, of whom 30,973 were enrolled. The reduced-form analysis follo ws the same metho dology as in the first exp eriment, as sp ec- ified in Equation ( 15 ). The results for V adore .0 and U - rec , presented in Figure 2 (see also T able H8 , taking the group receiving recommendations from the U - rec as reference) are consisten t with those observed in the previous exp erimen t. 17 V adore .0 outp erforms U - rec in terms of hiring probability ( P ), but, as exp ected by construction, underp erforms in terms of the adequacy score ( U ). It p erforms marginally b etter than U - rec in terms of clic ks, but not in terms of applications. The most notable c hanges are observ ed in clic k-through rates and application rates. Relativ e to the b enchmark algorithms U - rec and V adore .0, the gains are considerable. Application rates for the V adore .2 and Applica tion recommendations are approximately twice as high as those for U - rec . The improv emen ts are less dramatic for Mix - 1 / 2 and XGBoost , but still meaningful. Figure 2 -(f ) (see also column (6) of T able H8 ) rep orts hiring outcomes on recommended v acancies. The baseline hiring rate in the reference group is very low: 0.42 ‱ . W e detect a mo dest signal for the new Mix - 1 / 2 ( V adore .2) algorithm, significan t at the 10% level: al- though the absolute hiring rate remains small, it is roughly three times higher than in the con trol group U - rec . Except this group, no statistically significan t differences are observ ed. This is not particularly surprising: despite their differences, all algorithms yield lo w appli- cation rates—b elow 1%—and, although the success rates of applications v ary substan tially 16 In addition to algorithmic v ariation, the exp eriment also randomized the t yp e of information dis- pla y ed alongside recommendations for a subset of algorithms (including V adore .2, Applica tion , and Mix 1 / 2 ( V adore .2)), resulting in m ultiple display conditions. As in the first experiment, our baseline analysis abstracts from this dimension and aggregates all display v ariants for a giv en algorithm. App endix T able H10 sho ws that accounting explicitly for displa y v ariation do es not affect our main conclusions. 17 Preregistered outcomes for this b eta-test are: ratings, clicks, applications and hirings on recommended v acancies. 33 across algorithms, they are capp ed around 7%. T o inform exp ectations ab out the effects of scaling these in terv entions, the final column of T able H8 rep orts hiring rates conditional on application, that is, the ratio of hires to applications among recommended v acancies. Mix - 1 / 2 ( V adore .2) and X GBoost nearly double this efficiency relative to the other algorithms, including Applica tion . These lo w hiring rates on the recommendations are not unexp ected and are consisten t with the mo del. Since application probabilities are small (b elo w 1% p er recommendation), the join t hiring probability p h = p × p a is extremely low. Detecting welfare differences through hiring rates alone w ould require samples several orders of magnitude larger than a b eta-test; the in termediate outcomes suc h as click-through rates, application rates, and the hiring rate conditional on application, are therefore the relev ant margins for comparing recommendation principles at this scale. Accordingly , the primary ob jectiv e of these exp eriments is not to estimate emplo yment effects at scale, but to compare recommendation principles and generate the v ariation needed to estimate the structural mo del in Section 5 . 5 Estimation of the searc h mo del This section uses the exp erimen tal v ariation generated b y the random assignment of rec- ommendation algorithms to serve t wo purp oses. First, we estimate a structural mo del of application b ehavior and test whether the core b ehavioral predictions of the mo del, in par- ticular that b oth utility and hiring probabilities shap e application decisions, are consisten t with the data. Second, we use the estimated mo del to construct the welfare metric Γ( p, U ) from Prop osition 2.2 and compare all tested recommendation rules against this common b enc hmark. 5.1 Preferences estimation using application b eha vior The mo del in Section 2 characterizes ho w job seekers’ application decisions dep end on b oth the p erceived utilit y of v acancies and their probability of success. In this section, w e use observ ations on job seekers’ applications to estimate these preferences. As in Hitsch et al. ( 2010 ) 18 or Le Barbanchon et al. ( 2021 ), giv en the threshold based decision rule in Equation ( 3 ), these preferences can b e estimated using a discrete choice mo del. W e primarily rely on the exp erimen tal data introduced in Section 4 , but also provide esti- mates based on observ ational data in the App endix as a robustness chec k. In the exp erimen ts, 18 See for example their Equation (9). 34 F-test: F=73.1, p=0.000 (a) U F-test: F=805.8, p=0.000 (b) P F-test: F=65.7, p=0.000 (c) Rating F-test: F=11.9, p=0.000 (d) Clicks F-test: F=11.3, p=0.000 (e) Applications F-test: F=1.465, p=0.197 (f ) Hirings Figure 2: Beta-test 2: Effects of algorithm assignment on v acancy character- istics and job-seeker resp onses Notes: Each panel rep orts co efficient estimates from separate regressions of the indicated outcome on recommendation-treatment indicators, controlling for ad fixed effects. Poin ts represent estimated co efficien ts and bars denote 95% confidence interv als. Standard errors are clustered at the job-seeker lev el. Outcomes P , Clicks, Applications, and Hirings are rescaled as indicated in the figure lab els. F-tests corresp ond to the F-statistic and p-v alue from a join t test of significance of all estimated co efficien ts, with U - rec tak en as the reference group. 35 for eac h job seeker in the sample, we observe: - The group corresp onding to the algorithm used to generate the 10 recommendations: either one of the mixtures used in Exp eriment 1, or one of the six algorithms used in Exp erimen t 2. W e denote the asso ciated group dumm y v ariables by T i ; - The list of 10 v acancies selected by the corresp onding algorithm; - The scores U i,j and success probabilities P i,j ; - The clicks and applications for each of the 10 v acancies. W e closely follo w Equation ( 12 ) in Proposition 2.3 . W e estimate this structural model of application b eha vior b y instrumenting U i,j and 1 / P i,j using the assignmen t v ariables T i . Our binary c hoice mo del takes the following general form: P ( C i,j = 1 | W i,j , T i , c i ) = Λ α U i,j − β P i,j + δ B 2 ,i + γ + c i , (16) where B 2 ,i ∈ { 0 , 1 } is an indicator for participation in Exp eriment 2, and the vector W i,j = ( U i,j , 1 / P i,j , B 2 ,i ) collects the utilit y score, the in verse hiring probability , and this exp eriment indicator. This sp ecification is in the spirit of Hitsc h et al. ( 2010 ); Chen et al. ( 2023 ), who estimate similar equations in the context of marriage markets. Ho wev er, we leverage here the randomization p erformed in our exp eriments. Note that the term − β / P i,j en ters with a negativ e sign in ( 16 ), so β > 0 implies a p ositive effect of P on the application probability , as exp ected. The individual effect c i captures heterogeneit y across job seek ers. As discussed in Section 2.6.2 , this effect captures systematic individual sp ecific differences betw een the observ ed index U and the actual utility gain relative to a reserv ation v alue. The functional form used in ( 16 ) corresp onds to a logit mo del. Ho wev er, logit mo dels with fixed effects are not easily compatible with the transparen t identification structure pro vided b y random assignmen t. W e w ould also like to account for p oten tial measurement error in W i,j : follo wing the standard mo del W i,j = W ∗ i,j + e i,j , where W ∗ i,j is the true latent regressor and e i,j is error, the instruments T i allo w consisten t estimation under classical measurement error assumptions. Giv en the lo w application probabilit y (3 ‰ ), w e adopt the appro ximation Λ( x ) ≈ exp( x ) and estimate a P oisson IV mo del. Under this sp ecification, the conditional exp ectation b ecomes: P ( C i,j | W i,j , T i , c i , e i,j ) = exp( W ⊤ i,j θ + γ + c i − e i,j θ | {z } µ i,j ) , (17) 36 where, from Equation ( 16 ), θ = ( α , − β , δ ). The control function approach (see W o oldridge ( 2010 )) can b e used to address endogeneity . 19 An alternative approac h is to use a first-order T aylor expansion of Λ( x ) around the sample mean x : Λ( x ) ≈ Λ( x ) + Λ ′ ( x )( x − x ) = ˜ Λ + ˜ Λ ′ x . This leads to a linearized mo del of the form: E ( C i,j | W i,j , T i , µ i,j ) ≈ ˜ Λ + ˜ Λ ′ ( W ⊤ i,j θ + γ + µ i,j ) = W ⊤ i,j ˜ θ + ˜ γ + ˜ µ i,j . (21) This equation can b e estimated either b y instrumen tal v ariables or using the control function approac h describ ed abov e. In the linear context b oth metho ds yield exactly the same results. Note that, due to the linear appro ximation, co efficients are identified up to a scaling factor, whic h is not problematic for our purp oses. W e are primarily interested in the sign and statistical significance of the co efficients on U and 1 / P , and the ratio of the t w o co efficients (see Prop osition 2.3 ). The results are presen ted in T able 3 . Columns (1) and (2) rep ort estimates for the linear appro ximation in Equation ( 21 ). Column (1) rep orts results using OLS, ignoring p otential endogeneit y and column (2) the estimates when instead using random RS-assignmen t as instrumen ts. Column (3) rep orts the estimates for the exp onen tial mo del of Equation ( 17 ) using the con trol function metho d. Column (4) provides estimates of the Av erage Marginal Effects and can thus b e compared more easily to columns (1) and (2). All columns provide evidence consistent with the theoretical mo del. The tw o key v ariables of the mo del, U and 1 / P , are b oth highly significant, with the co efficien t on 1 / P b eing, as exp ected, negative, indicating a p ositive relationship b etw een the probabilit y of success and the decision to click or apply . Comparing columns (1) and (2) shows that the co efficient of U is not c hanged when using instrumental v ariables rather than OLS but that the co efficien t 19 In a nutshell, the control function metho d in this context works as follows. The p otentially endogenous regressors W i,j are linked to instruments T i through a first-stage equation: W i,j = T i Π + v i,j (18) and the structural error term µ i,j is mo deled as dep ending on v i,j but not on T i (exclusion restriction): µ i,j = v ⊤ i,j ρ + ν i,j (19) with ν i,j indep enden t of v i,j . Substituting ( 19 ) into ( 17 ) and integrating o v er the distribution of ν i,j yields the control function moment condition: E ( C i,j − exp( W ⊤ i,j θ + ˜ γ + v ⊤ i,j ρ ) | W i,j , T i ) = 0 . (20) In practice, the first-stage mo del ( 18 ) is estimated, from which the residuals ˆ v i,j are computed, and substituted into Equation ( 20 ). Notably , this approach also provides an estimate of ρ , whic h captures the correlation b etw een the structural error term µ i,j and the endogenous v ariables W i,j . 37 of 1 / P is reduced b y almost 40% in column (1) ignoring endogeneit y compared to column (2). Indeed, when lo oking at the b ottom panel of the table, rep orting the ρ ’s of the Con trol F unction method (see footnote 19 ), we observ e that the co v ariance b et w een the residuals and the dep endent v ariables is non-significan t for U , but significant and p ositive for 1 / P . 20 It is also w orth highlighting the consistency of the results. As is standard in discrete c hoice mo dels, the key quan tit y is the ratio of the co efficients. When considering the ratio b etw een the co efficien t on 1 / P and that on U , we obtain very similar v alues across columns: 0.016 for column (2) and 0.024 for columns (3) and (4). As stressed ab ov e, these results are esp ecially imp ortan t b ecause they supp ort the interpre- tation outlined at the b eginning of Section 2 . They are consisten t with viewing the score U i,j as a signal of the utilit y gap U − U ∗ and the probabilit y P i,j as a signal of the lik eliho o d of success of an application. T aken together, these findings reinforce the idea that b oth dimensions are relev an t inputs for the design of welfare-impro ving RSs. As a robustness chec k, we also examine an alternativ e sp ecification using observ ational data. W e rely on data from the monitoring of job seek ers’ searc h activit y . All job postings on whic h a job seek er has clic ked are identified and stored, along with subsequen t actions—particularly whether an application w as submitted. F or eac h of these postings, w e compute the indicators U and P . W e then estimate the mo del directly using this observ ational dataset. T able I13 in App endix I presents these results, which are remark ably consistent with those in T able 3 . The main v ariables are all significan t with the exp ected sign and, in addition, the co efficien ts from these estimations pro vide similar orders of magnitude. More precisely , the ratio of the t wo co efficien ts ranges from 0.018 to 0.025, v ery close to the previous v alues. 5.2 Comparison of different RSs W e use the data from our exp erimen ts, together with the mo del developed in Section 2 , to compare the p erformance of different recommendation systems (RSs). Equation ( 6 ) shows that the w elfare-relev ant score for a v acancy is giv en b y the pro duct of the probability of a successful application, p , and the function σ log 1 + e ∆( p,U ) /σ . The estimates from the previous section allow us to iden tify the surplus function ∆( p, U ). In principle, one could therefore reconstruct the mo del-implied optimal score for eac h v acancy 20 If we use the b enchmark error in v ariable mo del y = a + bx ∗ + u , a measurement mo del x = x ∗ + e and an instrumental first stage regression x = α z + ε + e with u , e and ε uncorrelated and u and ε + e uncorrelated with z ; if w e assume errors in v ariable is the only source of endogeneit y; then, in equation 19 , µ is equal to u − be and v to ε + e . Thus ρ = − bσ 2 e / ( σ 2 ε + σ 2 e ). This would lead to a share of v ariance of the error σ 2 e / ( σ 2 ε + σ 2 e ) of 0 . 008 / 0 . 014 = 0 . 57 for column (2) and 0 . 029 / 0 . 068 = 0 . 43 for column (3). 38 T able 3: Estimation of the application mo del on job p ostings, p o oling b oth exp erimen ts LPM LPM, CF Poisson CF Co ef (x100) Co ef (x100) Co ef. AME (x100) (1) (2) (3) (4) U 0.832*** 0.857*** 2.824** 1.318* (0.048) (0.300) (1.355) (0.641) 1 / P -0.0081*** -0.014*** -0.068*** -0.032*** (6.06e-04) (0.003) (0.015) (0.007) Constan t -0.100 -0.020 -6.615*** (0.042) (0.142) (0.596) Con trols b etatest X X X Con trols Ad X X X ρ for CF Co ef (x100) Co ef. U 0.003 -1.173 (0.303) (1.351) 1 / P 0.008** 0.029** (0.003) (0.013) Notes : 499,200 observ ations, with 49,920 individuals each receiving 10 recommenda- tions, across the tw o exp eriments. Equation ( 16 ) is estimated mo deling applications using a fixed-effect logit mo del approximated either as a linear mo del (columns (1) and (2)) or a Poisson mo del (columns (3) and (4)). Column (1): OLS; column (2): IV imple- men ted using the control function approach. Column (3) “Poisson CF” estimation with m ultiplicativ e errors is p erformed using a control function approach. The sample p o ols b oth exp eriments. Instruments are the dummy v ariables for the groups job seekers hav e b een randomly assigned to. Column (4) “Average Marginal” Effect asso ciated with esti- mates from column (3). Standard errors are clustered at the job seeker level. The low er panel pro vides estimates of the cov ariance b etw een the residuals and the dep endent v ari- able, as provided by the Control F unction metho d (see fo otnote 19 ). Significance levels: < 1% : ∗∗∗ , < 5% : ∗∗ , < 10% : ∗ . directly from the baseline utility and hiring scores. W e do not pursue this approach. Doing so w ould mec hanically anc hor the analysis on the t wo initial scores U and P , and w ould preven t us from exploiting the additional information rev ealed b y alternativ e RSs. Instead, we adopt the p ersp ectiv e that each RS pro vides a noisy signal ab out the tw o underlying comp onents that matter for job seekers’ welfare: the probabilit y of b eing hired conditional on applying and the surplus from applying. Our ob jective is therefore to enric h the pro xies for b oth dimensions b y exploiting the full set of algorithms tested in the exp eriments. T o implemen t this strategy , we rely on data from Exp erimen t 2. W e briefly describ e ho w we pro ceed and provide further details in App endix G . F or each enrolled job seek er, w e observ e 39 the list of ten recommended v acancies and, for each of these v acancies, the scores pro duced b y all algorithms considered in the second b eta-test (with the exception of XGBoost). By com bining these scores with observed application decisions and subsequent hiring outcomes on recommended v acancies, w e estimate the comp onents of the w elfare-relev ant score. W e pro ceed in four steps, detailed in App endix G . Step 1. Hiring c onditional on applying. W e identify the probabilit y of a successful applica- tion, p . Restricting attention to v acancies to which job seek ers actually applied, we estimate a logistic regression of the hire outcome on the scores pro duced b y the different algorithms ( V adore .0, V adore .2, Mix - 1 / 2 ( V adore .2), Applica tion , U - rec ). This yields predicted hiring probabilities p i,j for eac h job seeker–v acancy pair in the recommendation lists. Step 2. Applic ations on r e c ommende d vac ancies. W e identify the surplus comp onent ∆, or equiv alently the application probabilit y p a . W e estimate a logistic mo del for the probabilit y that a recommended v acancy receiv es an application, again as a function of the same set of algorithmic scores. This yields predicted application probabilities p a,i,j . 21 Step 3. R e c onstructing Γ and r elate d obje cts. Com bining these tw o sets of predictions, w e reconstruct for each job seek er i and eac h recommended v acancy j ∈ { 1 , . . . , 10 } the comp osite score Γ i,j as w ell as its comp onents p i,j , p a,i,j , and p h,i,j = p i,j × p a,i,j . Step 4. Counterfactual optimal r e c ommendations. W e use the estimated Γ function to construct a coun terfactual b enchmark. F or each job seeker, w e identify the set of v acancies that w ould hav e b een recommended had it b een p ossible to rank all a v ailable v acancies at the time of the exp erimen t using the welfare-relev ant score. This yields, for eac h job seeker, coun terfactual scores Γ ∗ i,j for the (counterfactual) top ten v acancies. W e then ev aluate eac h RS using the p erformance measures µ i,j ∈ { p i,j , p a,i,j , p h,i,j , Γ i,j , Γ ∗ i,j − Γ i,j } and compute their av erages within each exp erimen tal group assigned to algorithm a ∈ A 2 . Since these estimates are subsequently used to construct predicted scores, we adopt a split- sample approach. One randomly selected half of the data, S 1 , is used to estimate p a , p , p h , and Γ. The remaining half, S 2 , is then used to compute a verage p erformance measures b y 21 The results of these tw o first steps are rep orted in columns (1) and (2) of T able E2 . F or the hiring prob- abilit y (column (1)), only the coefficient for the V adore .2 score is significan t. This supp orts the idea that it effectively incorp orates the V adore .0 score in predicting hires. Moreov er, the fact that the Applica tion and U - rec scores do not predict hires once the V adore .2 score is accounted for also strengthens the p oint that these scores con tain information distinct from the hiring probabilit y . F or applications (column (2)), the Applica tion score is as exp ected the most imp ortan t predictor, even though the V adore .2 and U - rec scores are also significant. 40 exp erimen tal group: µ i,j i ∈ S 2 , a i = a . T o account for the uncertain ty introduced b y sample splitting, v alid confidence interv als are constructed by taking the medians of the upp er and lo wer b ounds of the confidence interv als across m ultiple splits (see Chernozhuk o v et al. , 2018 ). Figure 3 summarizes the p erformance of the different RSs along four dimensions: the prob- abilit y of b eing hired conditional on applying, p (panel (a)); the probability of applying, p a (panel (b)); exp ected utility prior to application, Γ (panel (c)); the joint probability of ap- plying and b eing hired, p h = p × p a (panel (d)). 22 The figures also display the a v erage v alue of the v acancies that wo uld ha ve b een recommended by the optimal RS, as measured b y the metric used in the figure (dep ending on the figure, either p , p a , p h or Γ). This b enc hmark represen ts the p erformance that would b e attained by the Γ-optimal recommendation set. It allows us to directly compare the performance of each recommendation rule to that of the optimal RS, using the metric implicit to eac h panel. Accordingly , the gap b etw een the p erformance of a given RS and this reference captures ho w far the RS is from the optimal b enc hmark along each dimension ( p in panel (a), p a in panel (b), Γ in panel (c), and p h in panel (d)). While this comparison is informativ e across all panels, it is particularly meaning- ful in panel (c), whic h relies on the Γ metric: only for Γ do es the gap admit a direct welfare in terpretation as a loss relative to the optim um. This panel therefore pro vides a direct as- sessmen t not only of ho w well each algorithm p erforms under the appropriate ob jective, but also of how close it comes to the optimal b enchmark. P anel (a) shows that all algorithms significan tly increase the probabilit y of a hire conditional on application p , relativ e to the baseline U - rec system. Ev en the algorithm with the smallest gain, X GBoost , more than doubles this probabilit y . The b est-p erforming algorithm on this dimension is V adore .2, for which the probability of hire is 3.2 times higher than under U - rec . Despite these relativ e improv emen ts, it is important to note that absolute success rates remain v ery lo w. Ev en for the best algorithm ( V adore .2), the conditional probability of hire on a recommended job p osting remains b elow 1.5%. P anel (b) presents similarly strong gains in the probabilit y of application p a . Again, relativ e to the U - rec b enchmark, improv ements are substantial. The smallest gain is observed for V adore .0, whic h still increases the probabilit y of application by 75%. The Applica tion algorithm ac hiev es the highest impact, increasing the probability by a factor of 1.7, with V adore .2 not far b ehind at 1.4. This can b e seen as a consistency c hec k given as the main 22 T able H11 provides the asso ciated estimates. 41 predictor in our estimation of p a is the Applica tion score (see T able E2 ). Y et, absolute lev els remain mo dest: ev en the b est-p erforming algorithm yields an application probabilit y of only 0.4%. P anel (d) sho ws the unconditional probability of hire p h . The pattern mirrors that of the previous panels: the new RSs all substan tially outp erform U - rec , with V adore .2 again pro viding the largest gain—tripling the likelihoo d of successful matc hes. The Applica tion algorithm p erforms nearly as well. Ho wev er, the absolute probability of a match remains extremely lo w, around 1 in 10,000. Finally , panel (c) rep orts the optimal score Γ whic h ranks the algorithms according to their exp ected v alue from the job seek er’s p ersp ective. Tw o p erformance tiers emerge clearly: V adore .2 and Applica tion form a top tier, generating large gains relative to the b ench- mark U - rec , while V adore .0, Mix - 1 / 2 ( V adore .2), and XGBoost constitute a second tier. As sho wn in Section 2.5.3 , Γ ≈ p h × (1 + p a / 2) for small p a , so the tw o metrics are nearly iden tical in our empirically lo w-application setting. Ov erall, the strong p erformance of V adore .2 and Applica tion highlights the imp ortance of explicitly mo deling application b eha vior when deriving optimal recommendations using the ob jectiv e Γ. At the s ame time, these gains should b e interpreted cautiously: in absolute terms, application and hiring rates for recommended v acancies remain lo w across all systems. Across all panels, recommendations generated b y the optimal algorithm strictly dominate those pro duced by any alternative algorithm. This ranking holds regardless of the metric considered. Among the feasible algorithms, V adore .2 consistently p erforms closest to the optimal b enchmark, with one exception: for the application probabilit y metric, the algorithm based solely on p a is the closest and in fact delivers nearly iden tical v alues. The most informativ e comparison is that based on the Γ metric. Along this dimension, the p erformance ac hieved b y V adore .2 is very close to that of the optimal algorithm, implying that the effectiv e loss from using V adore .2 instead of the optimal recommendation rule is small. 6 Conclusion In this pap er, we study the design of job recommendation systems (RSs) by com bining economic mo deling, mac hine learning, and field exp erimentation. W e dev elop a job-searc h framew ork in which v acancies are lotteries characterized b y a hiring probabilit y p and pay off U . The mo del shows why recommendation rules based solely on proxies for p , pro xies for U , or observ ed application b ehavior are incomplete, and that w elfare-relev ant rankings must com bine b oth dimensions into an exp ected-surplus index. It also highligh ts an in version 42 (a) p ( × 100) (b) p a ( × 100) (c) Γ ( × 10 , 000) (d) p h ( × 10 , 000) Figure 3: Second exp erimen t - Reduced-F orm estimation - impact of the assignmen t on Γ for the 10 first ads Notes: Each panel rep orts co efficient estimates from separate regressions of the indicated outcome on recommendation-treatment indicators, controlling for ad fixed effects. Poin ts represent estimated co efficien ts and bars denote 90% confidence interv als. Standard errors are clustered at the job-seeker lev el. Outcomes P , Clicks, Applications, and Hirings are rescaled as indicated in the figure lab els. 43 problem: observ ed application choices reveal whether applying is priv ately profitable, but not the magnitude of the exp ected gains relev an t for w elfare. W e bring this framew ork to the data through collab oration with the F renc h PES. Starting from t wo op erational RSs, one reflecting stated preferences and one optimized to predict hiring outcomes, we conduct tw o randomized field exp erimen ts conceiv ed as b eta tests within a learning cycle. Guided by the mo del and exp erimental feedback, this pro cess leads to an appro ximation of the welfare-optimal RS ( V adore .2), whose p erformance in terms of clic ks and applications substantially exceeds that of the initial systems. Bey ond reduced-form p erformance, the exp erimen ts generate exogenous v ariation in the c haracteristics of recommended v acancies, whic h w e use to estimate a structural mo del of application b ehavior. The estimates supp ort the key b eha vioral mec hanisms emphasized in the theory and quantify the relative imp ortance of hiring probabilities and utility in job seek ers’ decisions. Com bined with the model’s structure, the exp erimental data allow us to construct an empirically grounded b enchmark for welfare-relev ant rankings and compare all tested recommendation rules to it. W e find that the appro ximation V adore .2 of the w elfare-optimal algorithm deliv ers large gains relativ e to the initial systems and p erforms close to the mo del-implied optimum. A broader lesson from our analysis concerns the p erformance of simple heuristic rankings. While the join t application-and-hiring probabilit y p h is not w elfare-optimal in theory , it emerges as a strong empirical b enchmark in our setting. This result is structural rather than algorithmic: application probabilities are empirically small and remain so ev en under recom- mendation rules designed to stimulate applications. In this regime, the welfare-relev ant index is w ell appro ximated b y p × p a , explaining why hiring-based rankings dominate alternativ e heuristics. By con trast, rankings based solely on application b ehavior are theoretically frag- ile. Their reasonable p erformance in our setting may not generalize to environmen ts where application b ehavior resp onds more strongly to recommendations. When recommendations substan tially affect application decisions, the gap b etw een b eha vior-based and welfare-based rankings ma y b e muc h larger. More broadly , our results suggest a general lesson for the design of algorithmic intermedia- tion in lab or markets. Machine-learning tools can substantially impro ve matc hing outcomes, but only when embedded in a framework that defines the economic ob jective and disciplines b eha vioral assumptions with exp erimen tal evidence. Without suc h a framew ork, RSs opti- mized for observ able behaviors may p erform w ell on predictiv e metrics yet remain misaligned with w elfare-relev ant outcomes. 44 Our findings suggest sev eral directions for future researc h. First, improving RS p erformance requires b etter prediction of the primitives p and U , esp ecially job seeker s’ utilit y for differ- en t jobs. Second, scaling recommendations ma y generate congestion and general-equilibrium effects (see, e.g., Gee , 2019 ; Altmann et al. , 2022 ; Bied et al. , 2021 ; Su et al. , 2022 ; Hensvik et al. , 2022 ; Behaghel et al. , 2024 ; Lehmann et al. , 2023 ), calling for mark et-level recommen- dation rules, for example based on optimal transp ort ( Bied et al. , 2021 ). Third, fairness and inequalit y concerns remain central in lab or-market RSs ( Zhang and Kuhn , 2022 ; Bied et al. , 2023 ), and p ost-pro cessing approaches with fairness constrain ts app ear promising. F ourth, incorp orating b ehavioral frictions may further impro v e recommendation design, for instance b y combining RSs with elicited b eliefs to study how recommendations shap e exp ectations and search strategies (see, e.g., Alm ˚ as et al. , 2023 ; Cr ´ ep on et al. , 2025 ). Finally , an imp or- tan t extension is to dev elop RSs that also b enefit firms ( Horton , 2017 ; Algan et al. , 2020 ), mo ving to ward tw o-sided systems that jointly mo del applications and hiring decisions. 45 References Agan, A. Y., D. Dav enp ort, J. Ludwig, and S. Mullainathan (2023). Automating automatic- it y: Ho w the con text of h uman choice affects the exten t of algorithmic bias. Working p ap er, National Bur e au of Ec onomic R ese ar ch . Algan, Y., B. Cr ´ ep on, and D. Glov er (2020). Are activ e lab or mark et p olicies directed at firms effectiv e? evidence from a randomized ev aluation with lo cal employmen t agencies. J-P AL working p ap er . Alm ˚ as, I., O. Attanasio, and P . Jervis (2023). Economics and measurement: New measures to mo del decision making. National Bur e au of Ec onomic R ese ar ch working p ap er . Altmann, S., A. M. Glenny , R. Mahlstedt, and A. Sebald (2022). The direct and indirect effects of online job search advice. IZA Discussion Pap er . A they , S. (2018). The impact of Machine Learning on Economics. In The e c onomics of artificial intel ligenc e: An agenda , pp. 507–547. Universit y of Chicago Press. B¨ ac hli, M., R. Laliv e, and M. Pellizzari (2025). Helping jobseekers with recommendations based on skill profiles or past exp erience: Evidence from a randomized in terven tion. CEPR Discussion Pap er No. 19949 . Behaghel, L., S. Dromundo, M. Gurgand, Y. Hazard, and T. Zub er (2024). The p oten tial of recommender systems for directing job search: A large-scale exp eriment. IZA Discussion Pap er . Belot, M., B. de Koning, D. F ouarge, P . Kirc her, P . Muller, and S. Phlippen (2025). Advising job seek ers in o ccupations with po or prosp ects: A field exp eriment. Institute of L ab or Ec onomics (IZA) Working p ap er . Belot, M., P . Kircher, and P . Muller (2019). Providing advice to jobseekers at low cost: An exp erimen tal study on online advice. The R eview of Ec onomic Studies 86 (4), 1411–1447. Bied, G. and al. (2023). T ow ard job recommendation for all. Pr o c e e dings of the Thirty- Se c ond International Joint Confer enc e on Artificial Intel ligenc e (IJCAI), AI for Go o d , 5906–5914. Bied, G., C. Gaillac, M. Hoffmann, P . Caillou, B. Cr´ ep on, S. Nathan, and M. Sebag (2023). F airness in job recommendations: Estimating, explaining, and reducing gender gaps. Pr o- c e e dings of ECAI-workshop AEQUIT AS . 46 Bied, G., E. Perennes, V. A. Na y a, P . Caillou, B. Cr´ ep on, C. Gaillac, and M. Sebag (2021). Congestion-a voiding job recommendation with optimal transport. In FEAST workshop ECML-PKDD 2021 . Bro ec k e, S. (2023). OECD so cial, employmen t and migration w orking pap ers: Artificial in telligence and lab our mark et matching. Or ganisation for Ec onomic Co-op er ation and Development working p ap er . Chen, K.-M., Y.-W. Hsieh, and M.-J. Lin (2023). Reducing recommendation inequality via t wo-sided matching: a field exp erimen t of online dating. International Ec onomic R eview . Chernozh uko v, V., M. Demirer, E. Duflo, and I. F ernandez-V al (2018). Generic mac hine learning inference on heterogenous treatment effects in randomized exp erimen ts. National Bur e au of Ec onomic R ese ar ch working p ap er . Cr ´ ep on, B., A. F rot, and C. Gaillac (2025). Biases-informed job searc h guidance: Charac- terization, implications, and targeting supp ort. Working p ap er . De Ruijt, C. and S. Bhulai (2021). Job recommender systems: A review. arXiv pr eprint arXiv:2111.13576 . F reire, M. N. and L. N. de Castro (2021). e-recruitmen t recommender systems: a systematic review. Know le dge and Information Systems 63 , 1–20. Gee, L. K. (2019). The more you know: information effects on job application rates in a large field exp eriment. Management Scienc e 65 (5), 2077–2094. Glo ver, D. (2019). Job searc h and in termediation under discrimination: Evidence from terror- ist attac ks in france. Chair e Se curisation des Par c ours Pr ofessionels Working Pap er,(2019- 02) 164 . Go o dfellow, I., Y. Bengio, and A. Courville (2016). De ep L e arning . MIT Press. http: //www.deeplearningbook.org . Hardy , G. H., J. E. Littlewoo d, and G. P´ oly a (1952). Ine qualities . Cam bridge Universit y Press. Hensvik, L., T. Le Barbanchon, and R. Rathelot (2022). How can AI improv e search and matc hing? Evidence from 59 million p ersonalized job recommendations. Working p ap er . Hitsc h, G. J., A. Horta¸ csu, and D. Ariely (2010). Matc hing and sorting in online dating. A meric an Ec onomic R eview 100 (1), 130–63. 47 Horton, J. J. (2017). The effects of algorithmic lab or market recommendations: Evidence from a field exp eriment. Journal of L ab or Ec onomics 35 (2), 345–385. Klein b erg, J., J. Ludwig, S. Mullainathan, and M. Ragha v an (2024). The inv ersion problem: Wh y algorithms should infer men tal state and not just predict b ehavior. Persp e ctives on Psycholo gic al Scienc e 19 (5), 827–838. Klein b erg, J., S. Mullainathan, and M. Raghav an (2022). The challenge of understanding what users w an t: Inconsistent preferences and engagement optimization. arXiv pr eprint arXiv:2202.11776 . Le Barbanc hon, T., R. Rathelot, and A. Roulet (2021). Gender differences in job search: T rading off comm ute against wage. The Quarterly Journal of Ec onomics 136 (1), 381–426. Lehmann, T., C. T errier, and R. Laliv e (2023). Impro ving matc hing efficiency in tw o-sided mark ets: A m utual p opularity ranking approach. Working p ap er . Ma, S., H. Luo, J. Ma, Z. Liu, Y. Sun, X. Huang, F. W an, V. Beeram, H. Oh, S. R. Kumar, et al. (2022). Jobs filter to impro ve the job seeker exp erience at Indeed.com. Working p ap er . Marinescu, I. and D. Sk andalis (2021). Unemplo ymen t insurance and job searc h b ehavior. The Quarterly Journal of Ec onomics 136 (2), 887–931. Masha yekhi, Y., B. Kang, J. Lijffijt, and T. De Bie (2023). Recon: Reducing congestion in job recommendation using optimal transp ort. In Pr o c e e dings of the 17th ACM Confer enc e on R e c ommender Systems , pp. 696–701. Masha yekhi, Y., N. Li, B. Kang, J. Lijffijt, and T. De Bie (2022). A challenge-based survey of e-recruitmen t recommendation systems. arXiv pr eprint arXiv:2209.05112 . Mullainathan, S. (2025). Economics in the age of algorithms. AEA Pap ers and Pr o c e e d- ings 115 , 1–23. Shi, J., C. Jiang, A. Gupta, M. Zhou, Y. Ouy ang, Q. C. Xiao, Q. Song, Y. W u, H. W ei, and H. Gao (2022). Generalized deep mixed models. In Pr o c e e dings of the 28th A CM SIGKDD Confer enc e on Know le dge Disc overy and Data Mining , pp. 3869–3877. Su, Y., M. Bay oumi, and T. Joac hims (2022). Optimizing rankings for recommendation in matc hing mark ets. Pr o c e e dings of the ACM Web Confer enc e . T utz, G., M. Schmid, et al. (2016). Mo deling discr ete time-to-event data . Springer. 48 V olko vs, M., G. W. Y u, and T. Poutanen (2017). Con tent-based neighbor mo dels for cold start in recommender systems. In Pr o c e e dings of the R e c ommender Systems Chal lenge 2017 - R e cSys Chal lenge 17 . A CM Press. W einberger, K. Q. and L. K. Saul (2009). Distance metric learning for large margin nearest neigh b or classification. Journal of Machine L e arning R ese ar ch 10 (2). White, H. (1982). Maxim um lik eliho o d estimation of missp ecified models. Ec onometric a , 1–25. W o oldridge, J. M. (2010). Ec onometric analysis of cr oss se ction and p anel data . MIT press. Zhang, S. and P . Kuhn (2022). Understanding algorithmic bias in job recommender systems: An audit study approach. Working p ap er . Zhao, J., J. W ang, M. Sigdel, B. Zhang, P . Hoang, M. Liu, and M. Koray em (2021). Em b edding-based recommender system for job to candidate matching on scale. arXiv pr eprint arXiv:2107.00221 . 49 ONLINE APPENDIX A Non-m y opic job seek ers A.1 Deriv ation of RSs for non-m y opic job seek ers The analysis in Section 2.4 fo cuses on the discounted v alue when using an RS for my opic job seek ers. W e analyze here the case of non-my opic job seek ers. W e first address the question of the discounted v alue when the optimal RS assuming a m y opic job seeker is in tro duced. W e simply correct the discoun ted v alue. W e then sho w ho w to adapt the set of recommendations to the case of non-my opic job seekers. The main c hange compared to the my opic case is that non-my opic job seek ers adjust their reserv ation utilit y and their decision rule to apply . In such a case, the discounted v alue, that w e denote by r V ad j 1 for an unemploy ed job seeker exp osed to recommendations, is the solution of an equation that takes the follo wing form: r V ad j 1 ( S, s, α 1 ) = u ( b ) + α 1 r + q E Γ ad j ( p, U )1 l { S > q S ( s ) } s , (A1) where Γ ad j ( p, U ) is based on r V ad j 1 rather than on r V 0 as in the m yopic case. More precisely: Γ ad j ( p, U ) = pσ log 1 + e ∆ ad j ( p,U ) /σ , (A2) using ∆ ad j ( p, U ) = U − U ∗ 1 ( p ) and U ∗ 1 ( p ) = r V ad j 1 − R + ( k + R ) /p . The c hanges in the discounted v alue following the introduction of an RS obtained when as- suming a m y opic job seek er are also informative ab out the c hanges in the discoun ted v alue for non-m yopic job seekers. Consider an RS (in the case α 1 = α 0 ) that selects the top s % jobs ac- cording to an index S , and call δ m ( S, s ) = r V m 1 ( S, s, α 0 ) − r V u, 0 the change in the discoun ted v alue of an unemploy ed job seek er compared to the discounted v alues giv en b y the equations ( 8 ) and ( 4 ). Let δ ad j ( S, s ) = r V ad j 1 ( S, s, α 0 ) − r V u, 0 b e the change in the discoun ted v alue of a non-m yopic unemploy ed job seeker. W e define the exp ected hiring rate on recommended v a- cancies for a my opic job seeker θ m ( S, s ) = E ( pF (∆( p, U ) /σ ) 1 l { S > q S ( s ) } ) s and for a non- m yopic job seek er (see Equation ( A2 )) θ ad j ( S, s ) = E pF ∆ ad j ( p, U ) /σ 1 l { S > q S ( s ) } s . Prop osition A.1. The changes in the disc ounte d value for myopic and non-myopic job se ekers have the same sign. F o cusing on RSs for which δ m ( S, s ) is p ositive: 1 • The hiring r ate on r e c ommende d vac ancies for myopic job se ekers is lar ger than for non-myopic job se ekers: θ m ( S, s ) ≥ θ ad j ( S, s ) • The change in the disc ounte d value for a non myopic unemploye d job se eker δ ad j ( S, s ) c an b e br ackete d by r + q r + q + α 0 θ m ( S, s ) δ m ( S, s ) ≤ δ ad j ( S, s ) ≤ r + q r + q + α 0 θ ad j ( S, s ) δ m ( S, s ) , (A3) • An or der of magnitude of the change is given by δ ad j ( S, s ) ≈ r + q r + q + α 0 θ m ( S, s ) δ m ( S, s ) . (A4) • Non-myopic job se ekers ar e mor e sele ctive: their r eservation utility for a job they ar e sur e to get incr e ases: U ∗ 1 (1) = U ∗ 0 (1) + δ ad j ( S, s ) . Pr o of. See mo del App endix B.1 . The result in Prop osition 2.2 states that the optimalit y of the selection rule Γ m ( p, U ) holds in the case of my opic job seekers. When job seekers are no longer m yopic, the problem of identifying an optimal RS is more complex, as shown b y the equations ( A1 ) and ( A2 ), since the present v alue once the RS has b een trivially implemen ted dep ends on the optimal RS, but con v ersely the optimal RS also dep ends on the present v alue. 23 B Mo del App endix B.1 Pro of of prop ositions Pr o of of Pr op osition 2.1 . Fix a w orker type x and suppress x when there is no am bi- guit y . Over an interv al of length dt , the matc h survives with probabilit y 1 − q dt and breaks 23 The optimal RSs consists of ranking the v acancies according to pσ log 1 + e (∆ m ( p,U ) − x ) /σ but the x to consider is difficult to identify . Defining S ( x ) as S ( x ) = pσ log 1 + e (∆ m ( p,U ) − x ) /σ , it is the solution of r V + x = u ( b ) + α 0 r + q E S ( x ) F S ( x ) ( S ( x )) > 1 − s with r V = u ( b ) + α 0 r + q E ( S (0)) 2 with probabilit y q dt . Th us, (1 + r dt ) V e ( U + ε ) = ( U + ε ) dt + (1 − q dt ) V e ( U + ε ) + q dt V 0 . (B5) Rearranging and taking the limit yields ( r + q ) V e ( U + ε ) = U + ε + q V 0 , so that V e ( U + ε ) − V 0 = U + ε − r V 0 r + q . While unemploy ed, v acancies arriv e at rate α 0 and each draw yields ( p, U, ε ). Up on observing ( p, U, ε ), the work er either applies ( C = 1) or do es not apply ( C = 0). The unemplo ymen t Bellman equation is (1 + r dt ) V 0 = u ( b ) dt + (1 − α 0 dt ) V 0 + α 0 dt Z C ( p, U, ε ) pV e ( U + ε ) + (1 − p )( V 0 − R ) − k dF 0 ( p, U ) dF ε ( ε ) + α 0 dt Z (1 − C ( p, U, ε )) V 0 dF 0 ( p, U ) dF ε ( ε ) . Subtracting V 0 from b oth sides, dividing by dt , and taking the limit in dt giv es r V 0 = u ( b ) + α 0 Z C ( p, U, ε ) p V e ( U + ε ) − V 0 − (1 − p ) R − k dF 0 ( p, U ) dF ε ( ε ) . Using the expression for V e ( U + ε ) − V 0 deriv ed ab o v e, r V 0 = u ( b ) + α 0 r + q Z C ( p, U, ε ) p ( U + ε − r V 0 ) − ( r + q ) (1 − p ) R + k dF 0 ( p, U ) dF ε ( ε ) . Define R := ( r + q ) R and k := ( r + q ) k , and define the reserv ation utilit y U ∗ 0 ( p ) := r V 0 − R + k + R p , whic h is equiv alent to ( 1 ). Then the term inside the integral can b e written as p U − U ∗ 0 ( p ) + ε . Therefore the optimal application rule is C ( p, U, ε ) = 1 l { U − U ∗ 0 ( p ) + ε > 0 } . 3 Defining the surplus ∆( p, U ) := U − U ∗ 0 ( p ) yields the application rule ( 3 ). Moreo ver, substi- tuting this rule back into the Bellman equation giv es r V 0 = u ( b ) + α 0 r + q E p Z (∆( p, U ) + ε )1 l { ∆( p, U ) + ε > 0 } dF ε ( ε ) , whic h corresp onds to ( 4 )–( 5 ) with Γ( p, U ) := p Z (∆( p, U ) + ε )1 l { ∆( p, U ) + ε > 0 } dF ε ( ε ) . This establishes that application b ehavior is go verned by ∆( p, U ), and the v alue of encoun- tering a v acancy is summarized by Γ( p, U ). Pr o of of Pr op osition 2.2 . Under an RS characterized b y ( S, s, α 1 ), the v alue of unem- plo yment for a m y opic job seek er is given by ( 8 ): r V m 1 ( s, α 1 ) = u ( b ) + α 1 r + q E (Γ m ( p, U ) | S > q S ( s )) , where q S ( s ) is the (1 − s )-quantile of S under F 0 (with arbitrary tie-breaking if needed). F or fixed s , maximizing V m 1 is therefore equiv alen t to maximizing E (Γ m ( p, U ) 1 { S > q S ( s ) } ) o ver all measurable scores S . Pro of of p oint ( 1 ) . The previous expression dep ends on S only through the induced selec- tion set A = { S > q S ( s ) } , whic h m ust satisfy P ( A ) = s . An application of the rearrangemen t inequalit y (see, e.g. , Theorem 368, Hardy et al. , 1952 ) implies that, among all measurable subsets A of probabilit y s , the exp ectation E (Γ m 1 l { A } ) is maximized when the indicator 1 l { A } is comonotonic with Γ m , that is A = { Γ m > q Γ m ( s ) } . Equiv alently , the optimal rule selects the top s fraction of v acancies according to Γ m . Indeed, if A contains states with lo w Γ m while excluding states with higher Γ m , sw apping them w eakly increases E (Γ m 1 l { A } ). Iterating this argument implies that the optimizer m ust include all higher-Γ m states b efore lo wer-Γ m ones, hence b e a threshold rule based on Γ m . Suc h a selection rule is implemented by the score S ( p, U ) = Γ m ( p, U ). 4 Pro of of p oin t ( 2 ) . In the absence of recommendations, the v alue of unemplo ymen t satisfies r V 0 = u ( b ) + α 0 r + q E (Γ m ( p, U )) . Th us, when α 1 ≥ α 0 , the RS improv es w elfare relativ e to baseline search whenever E (Γ m ( p, U ) | S > q S ( s )) ≥ E (Γ m ( p, U )) . Let g ( z ) = E (Γ m | S = z ). By the law of iterated exp ectations, E (Γ m | S > q S ( s )) = E ( g ( S ) | S > q S ( s )) , E (Γ m ) = E ( g ( S )) = E ( g ( S ) | S > q S ( s )) s + E ( g ( S ) | S < q S ( s ))(1 − s ) . Th us, w e obtain E (Γ m ) − E (Γ m | S > q S ( s )) = E ( g ( S ) | S > q S ( s )) s + E ( g ( S ) | S < q S ( s ))(1 − s ) − E ( g ( S ) | S > q S ( s )) and th us E (Γ m ) − E (Γ m | S > q S ( s )) = (1 − s )( E ( g ( S ) | S < q S ( s )) − E ( g ( S ) | S > q S ( s ))) , whic h is negativ e giv en g is increasing. Strict impro vemen t under the optimal RS. The second sen tence of p oint ( 2 ) follo ws immediately: when S = Γ m , w e ha ve g ( z ) = z , whic h is strictly increasing. Therefore, E (Γ m | Γ m > q Γ m ( s )) > E (Γ m ) for any s ∈ (0 , 1) whenev er Γ m is non-degenerate. If α 1 ≥ α 0 , this implies a strict increase in the v alue of unemplo ymen t relativ e to searc h without recommendations. Pr o of of Pr op osition 2.3 . Identification of α , β , and γ in the binary choice mo del ( 12 ) is direct giv en the normalizations. Then, using ( 3 ) and that ε is distributed as a logistic 5 distribution with scale parameter σ , with F ( z /σ ) its cum ulative distribution, we obtain that P ( C i,j = 1 | p i,j , U i,j − U ∗ 0 ,i (1)) = F (∆( p i,j , U i,j ) /σ ) = F 1 σ ( U i,j − U ∗ 0 ,i (1)) − k + R σ p i,j + k + R σ , using ( 1 ) and ( 2 ). Using the assumption that parameters in ( 12 ) are iden tified, this yields that 1 /α iden tifies σ and β /α identifies k + R . Identification of ∆( p, U ) and Γ( p, U ) is a direct consequence. Pr o of of Pr op osition A.1 . When job seekers are not m yopic, the discoun ted v alue of job seek ers is giv en b y r V 1 ( S, s, α 0 ) = u ( b ) + α 0 r + q E Γ 1 ( p, U, r V 1 ( x, S, s, α 0 )) F S ( S ( p, U ) > 1 − s = u ( b ) + α 0 r + q E pσ log 1 + e ∆ 1 ( p,U,rV 1 ( S,s,α 0 )) /σ F S ( S ( p, U ) > 1 − s where ∆ 1 ( p, U, z ) := U − z + R − k + R p . The discoun ted v alue r V 1 ( S, s, α 0 ) is thus the solution of an equation of the form: z ( s ) = f S ( z ( s ) , s ) . f S ( z , s ) is a decreasing function of z . The v alue of the deriv ative is given by d f S dz ( z , s ) = − α 0 r + q E pF ∆ 1 ( p, U, z ) /σ | F S ( S ( p, U ) > 1 − s and the second deriv ativ e is giv en b y d 2 f S dz 2 ( z , s ) = α 0 ( r + q ) σ E pF ∆ 1 ( p, U, z ) /σ 1 − F ∆ 1 ( p, U, z ) /σ | F S ( S ( p, U ) > 1 − s > 0 . The discoun ted v alue in the absence of the RSs is the solution z 0 of z 0 = f S ( z 0 , 1). Th us 6 δ ad j ( S, s ) = z ( s ) − z 0 , and we hav e z ( s ) − z 0 = f S ( z ( s ) , s ) − f S ( z 0 , 1) = f S ( z ( s ) , s ) − f S ( z 0 , s ) + [ f S ( z 0 , s ) − f S ( z 0 , 1)] = ( z ( s ) − z 0 ) d f S dz ( z ′ ( s ) , s ) + [ f S ( z 0 , s ) − f S ( z 0 , 1)] with d f S dz ( z ′ ( s ) , s ) the deriv ativ e of f S for a v alue z ′ ( s ) in b etw een z 0 and z ( s ). Thus, z ( s ) − z 0 = f S ( z 0 , s ) − f S ( z 0 , 1) 1 − d f S dz ( z ′ ( s ) , s ) The quan tity f S ( z 0 , s ) − f S ( z 0 , 1) is the my opic c hange δ m ( S, s ). Giv en d f S dz ( z ′ ( s ) , s ) < 0, this sho ws that δ m ( S, s ) and δ ad j ( S, s ) hav e the same sign. F o cusing on cases for whic h δ m ( S, s ) is p ositiv e, this implies that δ ad j ( S, s ) is p ositiv e and th us that z ( s ) ≥ z 0 . In addition, the second deriv ative of f with resp ect to z is p ositive, th us d f S dz ( z 0 , s ) < d f S dz ( z ′ ( s ) , s ) < d f S dz ( z ( s ) , s ), and we hav e d f S dz ( z 0 , s ) = − α 0 r + q E pF ∆ 1 ( p, U, z 0 ) /σ | F S ( S ( p, U ) > 1 − s = − α 0 r + q θ m ( S, s ) d f S dz ( z ( s ) , s ) = − α 0 r + q E pF ∆ 1 ( p, U, z ( s )) /σ | F S ( S ( p, U ) > 1 − s = − α 0 r + q θ ad j ( S, s ) . As a result θ m ( S, s ) ≥ θ ad j ( S, s ) and δ m ( S, s ) 1 + α 0 r + q θ m ( S, s ) ≤ δ ad j ( S, s ) ≤ δ m ( S, s ) 1 + α 0 r + q θ ad j ( S, s ) whic h giv es the result. C Usual assessmen t of an RS’s p erformance: recall@k Although algorithms can b e obtained according to different principles and with different data, there is a common w a y of measuring their p erformance, whic h is the “Recall@k”. Consider a target v ariable M , such as M i,j = 1 if i has b een hired b y j . As usual, the 7 algorithm is trained on a “train sample” and tested on a “test sample”. F or eac h individual i and the k b est v acancies according to S in the test sample J ∗ k ( S, i ), we can build a v ariable M k i ( S ) which tak es v alue 1 if the target v ariable M i,j tak es v alue 1 for one of these k best S -based v acancies: M k i ( S ) = 1 X j ∈J ∗ k ( S,i ) M i,j = 1 , (C6) where 1 ( · ) denotes the indicator function. If the target v ariable is hiring, the recall@ k is the prop ortion of job seekers who were hired on one of the top- k recommendations: recall@ k ( S ) = 1 N N X i =1 M k i ( S ) . (C7) This is the usual measure in the machine learning literature of the global p erformance of the RSs S , whic h can b e used for example to compare tw o RSs. Figure E1 shows the performance of differen t RSs that we considered when building our final ML-based RS. The figure on the right panel compares the p erformances in terms of recall@100 on the test set of differen t RSs. Progressiv ely including additional v ariables (suc h as previously considered v acancies) yields huge improv ements on the recall. 24 The first RSs (“fixed w eigh ts”) corresp onds to the U -ranking, the preference-based RSs inspired from the PES’s current one. As the graph shows, the recall@100 is v ery low, around 5%. The second RS considered uses the same v ariables as those used to build the matching score, but instead of giving them fixed weigh ts, it optimizes them to b est predict the return to emplo ymen t. This leads to impro v ements, but the recall@100 is still mo dest, remaining b elo w 20%. The last tw o RSs consider a broader set of v ariables. The first of the last tw o, based on neural net works, follows the method describ ed in section 3.2 and is our P -ranking. The second uses a different mac hine learning metho d based on ensem bling and uses v ariables that explicitly describ e the in teractions b etw een the v ariables c haracterizing the job supply and the job seek ers (e.g. the distance b et ween a job seeker and an establishment). Both RSs p erform significan tly b etter than the first tw o. The neural netw ork achiev es a recall@100 of ab out 57.5% and the last one an ev en higher recall@100. The disadv antage of the last system is its sp eed, esp ecially when making recommendations. The neural netw ork mo del takes ab out one hour to train and ab out 0.07 seconds to generate a set of recommendations for a giv en job seek er; these figures are 2 hours and 10 seconds resp ectively for the last mo del. 24 See the definition of the recall@k in App endix C . 8 D Estimation of the matc hing probabilit y using the score as predictor Let M ∗ i,j ∈ { 0 , 1 } b e the latent v ariable that takes the v alue 1 if there is a match for a pair of job seeker-firm ( i, j ) after they meet. Imp ortan tly , after this pro cess, the observed hiring dumm y b et w een i and j is M i,j = M ∗ i,j C i,j . W e w an t to characterize the true probability of i b eing matc hed with j conditional on the v ery ric h information X i,j a v ailable to us, namely P ( M ∗ i,j = 1 | X i,j ). There are three main difficulties in estimating this true conditional probabilit y . First, there is a selection problem, since w e only observ e matc hes conditional on a past in terview C i,j = 1, so the v ariable M i,j = M ∗ i,j C i,j . Second, since we w an t to consider all p otentially relev ant co v ariates at our disp osal, this is a high-dimensional setting. Third, ML algorithms, and in particular those of section 3.2 , generally do not pro duce a consistent estimator of the matc hing probabilities, but provide excellen t predictiv e p erformance of future matc hing leveraging the complex in teractions betw een the comp onen ts of X i,j . W e provide a framew ork that allo ws to estimate the b est predictions of the matc hing probabilities with a logistic predictor, giv en the score S i,j pro duced by the RS. 25 Denote by F j the sigma-algebra generated by the v ector of past applications up to j , i.e., { C i,k = 1 , k = 1 , . . . , j } , and negativ e observ ed results { M i,k = 0 , k = 1 , . . . , j } . The selection problem translates in to the fact that our data only allows us to iden tify P ( M i,j ( i ) = 1 | X i,j ( i ) , F j ( i ) − 1 , C i,j ( i ) = 1) instead of P ( M ∗ i,j ( i ) = 1 | X i,j ( i ) ). T o deal with this selection problem, we mak e the follo wing assumption of conditional independence of the matc hing { M ∗ i,j , j ∈ J } and application pro cesses { C i,j , j ∈ J } . Assumption 1 (Selection on observ ables and Mark o vian prop ert y) . Θ( X i,j ( i ) ) := P ( M i,j ( i ) = 1 | X i,j ( i ) , F j ( i ) − 1 , C i,j ( i ) = 1) = P ( M ∗ i,j ( i ) = 1 | X i,j ( i ) ) . Giv en how large the set of co v ariates we are starting from is, this assumption makes sense. 25 Note that the ob jective function ( 13 ) of this algorithm, whose purp ose is to rank, is inv ariant to the addition of an individual sp ecific effect α i . How ever, this do es not change the interpretation of our ob ject of interest here, which is the b est predictor given the sc or e and data use d . Of course, a differen t training could change the v alues of the estimated co efficien ts as the score would be differen t, but would marginally c hange the predicted probabilities which are our ob jects of interest. Alternatively , one could use a logit with fixed effects approach similar to the one of section 5.1 to account for these p otential shifts. Ho wev er, this imp ortantly limits the predictions to the set of “mov ers” (here 427 individuals) and even on them w e t ypically observe few applications in this p erio d (median of 3). 9 Then, w e tak e adv an tage of observing the c hronologically ordered sequence for an individual i 0 , 1( i 0 ) , 2( i 0 ) , . . . , j max ( i 0 ) as a sequential searc h mo del and analyze it as a discrete duration mo del (see, e.g. , T utz et al. , 2016 ), where the conditional hazard rate is Θ( X i,j ( i ) ). Let us use the shortened notation for the score S i,j ( i ) := S i,j ( i ) ( X i,j ( i ) ) and r ( i, j ) for the rank of the v acancy j in the application set. W e define the b est logistic predictor of this conditional probability giv en the score and this rank as Λ( α ∗ r ( i,j ( i )) + β ∗ S i,j ( i ) ), where Λ is the usual logistic function, in the sense that ( α ∗ r ( i,j ( i )) , β ∗ ) minimizes the Kullback Leibler Information Criterion (KLIC) with Θ( X i,j ( i ) ), see White ( 1982 ). 26 The parameters of this b est logistic predictor ( α ∗ r ( i,j ( i )) , β ∗ ) can b e consistently estimated using conditional maximum lik eliho o d estimation (MLE). Estimation. F or the estimation w e use the sequence { M i,j ( i ) } i =1 ,...,N ; j =1 ,...,n ( i ) , where n ( i ) is the num b er of observ ed applications for job seek er i and N is the n umber of observ ed job seekers. T aking into account completed and censored sp ells (see, e.g. , T utz et al. , 2016 , page 52), the estimation can b e done using conditional MLE, considering the log-likelihoo d function, conditional on the scores pro duced by the RS, given by L ( α, β | M , S ) = N X i =1 M i,n ( i ) ln(Λ( α r ( i,n ( i )) + β S i,n ( i ) )) + N X i =1 X j ∈J ( i ) \{ n ( i ) } (1 − M i,j ) ln(1 − Λ( α r ( i,j ) + β S i,j )) . There is a simple generalization of the former expression to consider r ( i, j ) the rank of v acancy j in the application set of job seeker i , but also q ( i, j ) the rank of i in the applicant p o ol for job j . The lik eliho o d expression in this case is written as L ( α, β | M , S ) = X ( i,j ): C i,j =1 M i,j ln(Λ( α v q ( i,j ) + α j s r ( i,j ) + β S i,j ) + X ( i,j ): C i,j =1 (1 − M i,j ) ln(1 − Λ( α v q ( i,j ) + α j s r ( i,j ) + β S i,j )) , where α v and α j s are the sequences of “weariness” effects for v acancies and job seekers. 26 Th us, White ( 1982 ) also suggest this is a “minim um ignorance” solution. When the mo del is correctly sp ecified, this identifies the true parameters. 10 Estimation results. The estimation is p erformed on 34,255 randomly selected job seek ers in the test set, represen ting 79,097 applications. As exp ected, the estimated co efficien t of β of 0.061 is significantly p ositiv e at the 1% l ev el. This result is robust to v arious specifications, including application and in terview rank effects (the co efficient on S i,j drops to 0.038 and 0.047 , resp ectiv ely , see table D1 ). Overall, this v alidates the conten t of the ML score S i,j in terms of its p otential to reflect hiring c hances. F rom now on, instead of S i,j , we will think of our estimated b est logistic predictor giv en the score in column (1) of T able D1 as P i,j := Λ(0 . 061 S i,j − 4 . 113), which is our b est prediction of the probabilit y of hiring p ( i, j ). T able D1: Estimates of the b est logistic predictor of hirings given the ML score Metho d (1) (2) (3) Score S i,j 0.061*** 0.038*** 0.047*** (0.0029) (0.0030) (0.0030) With application rank No Y es Y es With in terview rank No No Y es In tercept -4.113*** -2.994*** -2.538*** (0.0559) (0.0570) (0.0575) AIC 28,040 25,116 23,897 Notes: On a half of the job seek ers presen t in the test sample (weeks 44-48 of 2019): 79,097 applications, 3,469 matc hes, 34,255 job seekers. Significance lev els: < 1% : ∗∗∗ , < 5% : ∗∗ , < 10% : ∗ . “With application rank” denotes dummies for the ranking of the application j in the list of applications of job seeker i . “With interview rank ” denotes dummies for the ranking of the candidate j in the list of recorded interviews for v acancy j . E Comparison of the t w o RSs obtained from U and P rankings W e apply the framew ork outlined in Section 3.1 to our tw o scores: the preference score U i,j , that w e call hereafter the U -ranking, and the hiring prediction score P derived from the ML-based estimate S . W e refer to the latter as the P -ranking hereafter. F or each job seeker w e define tw o sets of recommendations: a set based on the U -ranking and one based on the P -ranking. F or each of these tw o scores, to make k recommendations to job seeker i 0 , the k v acancies with the largest score U ( i 0 , j ) (resp ectiv ely P i 0 ,j ) are selected. The right panel of Figure E1 shows how the recall of the last mo del v aries with the n umber 11 of recommendations. F or 5 recommendations, the prop ortion is as large as almost 20%. As sho wn in the figure, the prop ortion increases progressively when the n um b er of recommen- dations increases. Figure E1: Performance on the test set of different RSs. The tw o rankings are p ositively correlated for a large part of the p opulation (median at 0.14 and first and third quartiles at 0.10 and 0.19 resp ectiv ely), but there are still significant differences in the ranking of v acancies b etw een the t wo criteria. T o explore this further, we compare for eac h type of job seeker i the optimal v acancy based on the P ranking, denoted b y j P ( i ), and the optimal v acancy based on the U ranking, denoted by j U ( i ). W e first compare the resp ectiv e ranks of these optimal v acancies: the rank of j P ( i ) in the U -ranking: r U ( i, j P ( i )), and symmetrically the rank of j U ( i ) in the P -ranking: r P ( i, j U ( i )). The upp er panel of Figure E3 sho ws the distribution of these ranks. While some individuals hav e optimal recommendations according to the tw o ranks that matc h, this is a small minority . F or most, the ranks considered are very large. The median of r U ( i, j P ( i )) is 381 (top 2%) and that of r P ( i, j U ( i )) is 3,093 (top 16%). Thanks to the estimation result of the searc h mo del in section D , w e giv e a further quantita- tiv e interpretation of these t wo systems. The lo wer panel of Figure E3 sho ws the distribution of the hiring probabilities for the tw o v acancies: P ( i, j P ( i )) and P ( i, j U ( i )). The median v alue of the maximum hiring probability for eac h individual P ( i, j P ( i )) is 0.06, sharply contrast- ing with the hiring probability for the optimal v acancy according to the adequacy criterion (0.02). Although the probabilit y of hiring from the b est v acancy in the P -ranking is higher than the probability of hiring from the U -ranking, it is w orth noting that this probability in absolute terms is not so large. Even more pronounced differences arise in the matc hing 12 T able E2: Estimates of the b est logistic predictor of hirings and applications giv en the differen t scores, based on the second exp erimen t Outcome Hiring cond. application Application Hiring (1) (2) (3) Score V adore .2 1.878*** 0.252*** 2.574*** (0.711) (0.080) (0.850) Score V adore .0 0.196 0.044 0.288 (0.169) (0.033) (0.188) Score APPLICA TION -0.015 0.680*** 0.302* (0.296) (0.052) (0.171) Score U-Rec -0.195 0.301*** 0.134 (0.172) (0.026) (0.167) In tercept -4.728*** -5.505*** -10.241*** (0.316) (0.042) (0.362) Notes: Significance levels: < 1% : ∗∗∗ , < 5% : ∗∗ , < 10% : ∗ . The column “Hiring cond. application” considers hirings realizations conditional on applications while column “Appli- cation” considers applications to job postings conditional on clicks. Regressors are the scores corresp onding to the differen t algorithms. All scores are standardized to simplify the compar- isons. Number of observ ations 309,730, of applications 1,752. Standard errors are clustered at the individual level. scores U ( i, j U ( i )) and U ( i, j P ( i )). As shown in Figure E3 , the distribution U ( i, j U ( i )) has a substan tial mass at 1 (median 0.98), indicating that for many job seek ers there are v acancies that meet all their criteria. Conv ersely , for the optimal v acancy according to the hiring probabilit y , there is a significant mass at zero (median 0.46). 13 Notes: 60,299 job seekers whose main sector is transp ortation and logistics in the Rhˆ one- Alp es region – ISO weeks 44-48 of 2019 – 18,873 v acancies av ailable at that p erio d in this sector. Distributions of the ranks of the b est recommendations based on past hirings ( P ) and elicited preferences ( U ) in each other rankings. The small bunch at the right gathers v acancies asso ciated with some b est recommendations according to P but rank ed after 18,800 according to U as they ha ve a preference score of 0 and are ranked by distance to the job seekers. Figure E2: Comparison of the rankings of the b est recommendations with resp ect to the other ranking 14 E3 Distributions of hiring probabilities E3 Distributions of preference score Notes: 60,299 job seekers whose main sector is transp ortation and logistics in the Rhˆ one- Alp es region – ISO weeks 44-48 of 2019 – 18,873 v acancies av ailable at that p erio d in this sector. Upp er p anel : Histograms of the hiring probabilities for the b est recommendations in b oth systems. L ower p anel : Histograms of the preference score for b est recommenda- tions in b oth systems. Figure E3: Comparison of the b est recommendations in the tw o rankings: hiring probabilities and preference score 15 F Randomized Exp erimen t T able F3: Summary of the Two Field Exp eriments (2022 and 2023) Exp erimen t 1: March 2022 Exp erimen t 2: June 2023 ( a ) P opulation Job seekers registered at PES in Auv ergne–Rhˆ one–Alp es, actively seeking work. Same p opulation and recruitment proto col as Exp erimen t 1. In vited 102,314 job seekers 150,000 job seekers Enrolled 18,947 (click ed consen t link) 30,973 (clic ked consent link) Design One email with recommendations; no control group; random assign- men t across treatment arms. Same core structure: email invi- tation, enrollment conditional on consen t, random assignment. T reatmen t di- mensions (1) Algorithm generating recom- mendations; (2) Displa y of addi- tional information (2 conditions). (1) Expanded set of algorithms; (2) Ric her v ariation in display ed infor- mation (4 conditions). T reatmen t arms 10 total (5 algorithms × 2 displa y conditions). 15 total (6 algorithms + 3 information-displa y v ariants for selected algorithms). Algorithms tested V adore .0, U - rec , and three h y- brid Mix v ariants (Mix 1 / 4 , Mix 1 / 2 , Mix 3 / 4 ). V adore .0(retrained), U -rec, V adore .2, Mix 1 / 2 ( V adore .2), Applica tion , and X GBoost . Information displa y Baseline vs. additional informa- tion. No information; p ersonalized “scores”; “explanation”; “explana- tion+”. Outcomes U and P scores; clic ks; applica- tions; hires. Same outcome measures. (a) Actually , in addition to the 15 arms listed previously , the exp eriment includes a sixteenth arm where par- ticipan ts receive recommendations based on the score U P E S , currently used by the PES. Its exact formula is unkno wn. It follows the same structure and weigh ts as U but includes nonlinearities and strict exclusions (as already mentioned in fo otnote 11 ). These features preven t some job seekers from receiving the 10 recommenda- tions planned in the interv ention, making full-sample comparisons infeasible. Specifically , 15.4% of job seekers ha ve no recommended offers, 35% fewer than five offers, and 49% fewer than ten offers. The score U provides a linear approximation of U P E S , with the adv antage of alw ays generating 10 recommendations and excluding no job seek er. F.1 P opulation of in terest The eligible p opulation are job seek ers registered at F rance T ra v ail in the Auvergne-Rhˆ one- Alp es region, of administrativ e category A ( i.e. , a v ailable for a job and lo oking for one), aged o ver 18 years old, and ha ving given the PES the p ermission to contact them b y email. Randomization was stratified b y desired job t yp e (14 mo dalities), the kind of supp ort de- liv ered b y the institution (3 mo dalities describing the job seek er’s degree of autonom y), and geographic lo cation (lev el of a F rench d ´ ep artement , 12 mo dalities). T able F4 rep orts balance 16 c hecks for the first exp eriment across the fiv e treatmen t arms. F.2 T reatmen ts: 5 com binations of the t w o rankings U and P W e construct five w ays to rank job v acancies based on the t wo scores, U and P , b y v arying the w eigh t giv en to eac h ranking. These hybrid rankings are implemen ted based solely on ranks, not on the actual v alues of the scores. W e pro ceed as follo ws: 1. First, we define a “ c onsider ation set ” consisting of the top v acancies according to one or b oth rankings: C S = { T op25 U } ∪ { T op25 P } ∪ {{ T op50 U } ∩ { T op100 P }} ∪ {{ T op100 U } ∩ { T op50 P }} W e define L as the num b er of v acancies b elonging to this recommendation set. 2. T o guard against v acancies disapp earing from F rance T rav ailwebsite b et w een the selec- tion pro cess and the time the email is sent, w e select 15 v acancies from these L . Only the top 10, according to the considered ranking and still a v ailable online at the time of sending, are included in the email. 3. W e rank the L v acancies in C S according to P . The selected v acancies for the different ranking metho ds are as follows: • V adore : The top 15 v acancies from C S ranked by P . • Mix - 1 / 4 : The top 15 v acancies rank ed by U among the max { 15 , L/ 4 } v acancies from C S in the ranking of C S b y P . • Mix - 1 / 2 : The top 15 v acancies rank ed by U among the max { 15 , L/ 2 } v acancies from C S in the ranking by P . • Mix - 3 / 4 : The top 15 v acancies rank ed by U among the max { 15 , 3 L/ 4 } v acancies from C S in the ranking by P . • U - rec : The top 15 v acancies from C S rank ed b y U . 17 F.3 Design and Outcome v ariables The first exp erimen t was conducted in Marc h 2022. Job-seekers are sent an email inviting them to complete an online survey using a link pro vided in the email that tak es them to the survey’s “landing page.” The landing page pro vides them with information ab out the goals of the surv ey and assures them that the information collected will b e used for researc h purp oses and will not affect their treatment by F rance T rav ail. If they accept these conditions, job-seek ers are first sho wn t wo job postings (the top 2 of their assigned algorithm). The job p ostings are characterized by the compan y , working con- ditions, salary , lo cation (and distance), exp erience, education requiremen ts, driver’s license requiremen ts, and a summary of the textual description of the job and the company . Job seek ers are asked to rate the tw o job p ostings in terms of i) global relev ance, ii) their p er- ception of their chances of b eing hired, and iii) fit with their job searc h criteria. They can also optionally provide natural language comments. After rating the t wo job ads (which is required to pro ceed with the surv ey), job seekers are presen ted with an additional page that initially displa ys the tw o previous ads, but with a link to apply and three additional ads. Job seek ers do not ha ve to rate the ads on this page. They can click on the ads to view them on F rance T rav ail’s w ebsite (whic h pro vides more details ab out the ads and allows job seekers to apply if they wish). Job seek ers’ clicks on the ads are recorded. If they wish, job seekers can see an additional page with five more ads. F.3.1 A ttrition differen tial T able F5 displays the results of the regression: Y i = α + X k β k { T i = k } + ϵ i among job seek ers who received an email, where T i is job seek er i ’s received treatment, and Y i corresp onds to a binary indicator of ha ving completed the survey (rated the top tw o ads and accessed the final page). The V adore treatment serves as the reference category . A F-test of the joint n ullit y of co efficients asso ciated to U - rec , Mix - 1 / 4 , Mix - 1 / 2 and Mix - 3 / 4 yields a F-stat 1.885 (p=0.11). Accordingly , we do not attempt to mo del attrition differential. 18 T able F4: Balance c heck among full sample V adore Mix - 1 / 4 Mix - 1 / 2 Mix - 3 / 4 U - rec p Age 38.18 38.09 38.46 38.38 38.47 0.10 Lo oking for a p ermanent con tract, full time 0.65 0.65 0.65 0.65 0.64 0.66 Lo oking for a p ermanent con tract, part time 0.11 0.11 0.11 0.11 0.12 0.94 Lo oking for a temp orary con tract 0.19 0.19 0.19 0.20 0.19 0.77 Education: High school 0.25 0.26 0.26 0.25 0.26 0.56 Education: Less than high school 0.10 0.10 0.10 0.10 0.10 0.71 Education: V o cational training 0.28 0.27 0.28 0.27 0.27 0.25 Education: College Education 0.37 0.37 0.37 0.37 0.37 0.95 Gender: W oman 0.53 0.52 0.52 0.54 0.53 0.04 Lev el of assistance from the PES: Light 0.25 0.25 0.25 0.25 0.25 1.00 Lev el of assistance from the PES: Medium 0.55 0.55 0.55 0.55 0.55 1.00 Lev el of assistance from the PES: Strong 0.19 0.19 0.19 0.19 0.19 1.00 Married 0.42 0.41 0.43 0.43 0.42 0.04 Max. commuting time (minutes) 23.4 23.8 23.6 23.6 23.4 0.28 No child 0.57 0.58 0.57 0.57 0.57 0.95 Occupation targeted: Agriculture 0.03 0.03 0.03 0.03 0.03 0.99 Occupation targeted: Art and crafts 0.01 0.01 0.01 0.01 0.00 0.98 Occupation targeted: Banking, insurance, real est. 0.01 0.01 0.01 0.01 0.01 0.95 Occupation targeted: Business supp ort services 0.16 0.16 0.16 0.16 0.16 0.90 Occupation targeted: Comm, media, digital 0.02 0.02 0.02 0.02 0.02 0.99 Occupation targeted: Construction, public works 0.07 0.06 0.07 0.06 0.07 1.00 Occupation targeted: Health 0.04 0.04 0.04 0.04 0.04 1.00 Occupation targeted: Industry 0.08 0.08 0.08 0.08 0.08 1.00 Occupation targeted: Maintenance 0.04 0.04 0.04 0.04 0.04 1.00 Occupation targeted: Missing 0.00 0.00 0.00 0.00 0.00 0.56 Occupation targeted: Performing arts 0.02 0.02 0.02 0.02 0.02 0.99 Occupation targeted: Personal services 0.19 0.19 0.19 0.19 0.19 1.00 Occupation targeted: Sales 0.15 0.15 0.15 0.15 0.15 0.98 Occupation targeted: T ourism, leisure 0.09 0.09 0.09 0.09 0.09 0.99 Occupation targeted: T ransp ort 0.10 0.10 0.10 0.10 0.10 0.98 Reserv ation wage (in euros) 2702 2864 2799 2808 2838 0.52 Skill level: Higher o ccupation 0.15 0.15 0.16 0.15 0.15 0.66 Skill level: Intermediate o ccupation 0.70 0.69 0.69 0.69 0.69 0.85 Skill level: Low er o ccupation 0.12 0.13 0.13 0.12 0.13 0.93 Skill level: Missing 0.03 0.03 0.03 0.03 0.03 0.18 UB status: Not eligible to UB 0.49 0.50 0.49 0.48 0.49 0.41 UB status: Receives UB 0.51 0.50 0.51 0.52 0.51 0.41 Unemplo ymen t duration (in months) 15.29 15.35 15.20 15.43 15.32 0.80 W ork exp erience (in months) 9.71 9.00 9.32 9.57 9.38 0.35 N. Obs. 10099 10092 10108 10094 10102 Note: Columns (1) to (5) characterize job-seekers by their treatmen t assignmen t and rep ort mean v alues; shares of the sample for binary v ariables and lev els for contin uous v ariables (Age, Max. commuting time, Reserv ation w age, Unemploymen t duration, W ork experience). Column p rep orts the p-v alue from the F-test for joint significance of treatment co efficien ts in the regressions of eac h cov ariate on treatment assignment. 19 T able F5: Survey completion Dep enden t v ariable Completed the survey Mix - 1 / 4 − 0 . 003 (0 . 005) Mix - 1 / 2 0 . 009 (0 . 006)* Mix - 3 / 4 0 . 001 (0 . 005) U - rec − 0 . 004 (0 . 005) Strata fixed effects Y es N.Obs. 50 495 Con trol mean ( V adore ) 0.176 Note: The V adore treatment group is used as the reference category . Robust standard errors are in parentheses. *, **, ***: significance at 10%, 5%, and 1%. G Estimation of application and hiring probabilities from m ultiple algorithmic scores This app endix provides implementation details for the estimation strategy describ ed in Sec- tion 5.2 . Throughout, w e use data from Exp eriment 2. F or each enrolled job seek er i and eac h recommended v acancy j ∈ { 1 , . . . , 10 } , we observe a v ector of algorithmic scores S i,j ≡ S V adore .0 i,j , S V adore .2 i,j , S Mix 1 / 2 ( V adore .2) i,j , S Applica tion i,j , S U - rec i,j . as well as an indicator of application C i,j ∈ { 0 , 1 } and, when C i,j = 1, an indicator of hire H i,j ∈ { 0 , 1 } . Step 1. Hiring conditional on applying. W e estimate p i,j ≡ P ( H i,j = 1 | C i,j = 1 , S i,j ) on the subsample of recommended v acancies that received an application: P ( H i,j = 1 | C i,j = 1 , S i,j ) = Λ( α h + S ′ i,j β h + X ′ i,j γ h ) , (G8) where Λ( t ) = 1 / (1 + e − t ) and X i,j denotes the set of controls used in the main sp ecifica- tions (e.g., recommendation-rank fixed effects, and an y additional controls included in the empirical section). Predicted probabilities are denoted ˆ p i,j . 20 Step 2. Applications on recommended v acancies. W e estimate p a,i,j ≡ P ( C i,j = 1 | S i,j ) on the full sample of recommended v acancies: P ( C i,j = 1 | S i,j ) = Λ α a + S ′ i,j β a + X ′ i,j γ a . (G9) Predicted probabilities are denoted ˆ p a,i,j . Step 3. Reconstructing Γ and related ob jects. Using the estimates from equa- tions ( G8 )–( G9 ), we compute ˆ p h,i,j ≡ ˆ p i,j ˆ p a,i,j . T o reconstruct the w elfare-relev ant score Γ i,j , w e use the mapping implied by equation ( 6 ). In practice, we implement this by first mapping predicted application probabilities into a surplus index, and then applying the closed-form expression for Γ under the logistic taste- sho c k sp ecification and normalizing σ to 1: ˆ Γ i,j = ˆ p i,j [ − log(1 − ˆ p a,i,j )] . Step 4. Counterfactual optimal recommendations. Let J i denote the set of v acancies a v ailable to job seeker i at the time of the exp erimen t. F or each j ∈ J i , w e compute ˆ Γ i,j and define the coun terfactual top-ten set as the ten v acancies with highest ˆ Γ i,j . Denoting their scores b y ˆ Γ ∗ i, 1 , . . . , ˆ Γ ∗ i, 10 , w e summarize distance to the optimum using ˆ Γ ∗ i,j − ˆ Γ i,j . Step 5. Split-sample implemen tation. T o a void ov erfitting when using predicted prob- abilities to construct p erformance metrics, w e randomly split the sample of enrolled job seek ers in to t w o halves, S 1 and S 2 . W e estimate equations ( G8 )–( G9 ) and construct ˆ Γ( · ) using S 1 only . W e then ev aluate a verage p erformance measures in S 2 b y exp erimental group assignmen t. H Supplemen tary tables and figures 21 Administrativ e Data Exp erimen tal Data Observ ational Data Con tents PES administrative data (Rhˆ one-Alp es); v acancy attributes (o ccupation, salary , con tract, lo cation, hours, required skills, firm info, text descriptions, past applications); job seek er demographics, exp erience, skills, search parameters; clic ks, applications, and hires (PES + DP AE). Qualtrics-based exp eri- men ts; eac h job seeker receiv es 10 recommenda- tions from alternative RSs; observ ed clicks, applica- tions, and hires; job seeker and v acancy c haracter- istics; recov ered ranking scores. PES data for weeks 1–48 of 2019; sto cks of job seek- ers and v acancies; 75,744 hires; training (w eeks 1–43) and test (w eeks 44–48) sets; subsamples for match- ing calibration, observ a- tional application mo del, and RSs ranking compari- son (transp ort/logistics sec- tor). Purp ose T rain and v alidate RSs; construct features; measure in terest, applications, and realized matches. Compare algorithms in a controlled en viron- men t; ev aluate b ehav- ioral resp onses; assess clic k/application/hire p er- formance. Calibrate matching prob- abilities; estimate appli- cation b ehavior; ev aluate RSs out-of-sample; com- pare ranking p erformance. T able H6: Summary of the Three Types of Data Used Figure H4: Exp ected surplus conditional on application Notes: This figure plots the conditional expected surplus E [∆( p, U ) + ε | ∆( p, U ) + ε > 0] as a function of the application probabilit y p a ( p, U ) = P (∆( p, U ) + ε > 0). The figure illustrates how the magnitude of the surplus conditional on application v aries across different distributions of the taste sho c k ε (logistic, Gum b el (EV1), and normal), all normalized to hav e unit v ariance. 22 Job Seek er V ariables x .g eo ϕ g eo ( x ) x .sk ϕ sk ( x ) x .g al ϕ g al ( x ) Emb e dding Job Seek er ϕ 0 ( x ) Job Ads V ariables y .g eo ψ g eo ( y ) y .sk ψ sk ( y ) y .g al ψ g al ( y ) Emb e dding Job Ads ψ 0 ( y ) V ador e ( x , y ) = < ϕ 0 ( x ) , ψ 0 ( y ) > Figure H5: V adore .0 architecture: three embeddings are defined to mo del geographical, skills and general asp ects of job seek ers (left) and job ads (righ t), and compute the hiring score. 23 x .g al Job Seeker V ariables and embedding ϕ 0 ( x ) ϕ 1 ( x ) ϕ 1 ( x ) ⊙ ψ 1 ( x , y ) Job Ads V ariables and embedding SDR sub-criteria V adore .0 scores/rank c k ( x , y ) V ador e. 0( x , y ) r . 0( x , y ) y .g al ψ 0 ( y ) ψ 1 ( x , y ) V ador e. 1( x , y )= H . 1 .H ir ing ( x , y ) H . 2 .Appl ication ( x , y ) V ador e. 2( x , y ) V adore.2 V adore.1 Figure H6: V adore.1 (b elow dashed line) and V adore.2 architectures. V adore.2 includes a second-head to model the applications, and a top head, exploiting b oth the standalone hiring and the application scores to predict the o v erall hiring score. 24 T able H7: First exp erimen t— Reduced-form estimates: effects of algorithm assignmen t on U and P scores, clicks, applications, and sub jective ratings U P Rating Clic ks Applications ( × 100) ( × 100) ( × 100) V adore .0 -0.1919*** 4.602*** 0.149** 0.463** 0.073* (0.0039) (0.076) (0.054) (0.207) (0.040) Mix - 1 / 4 -0.1757*** 3.863*** 0.214*** 0.432** 0.053 (0.0040) (0.070) (0.054) (0.209) (0.039) Mix - 1 / 2 -0.1584*** 3.573*** 0.241*** 0.640*** 0.065 (0.0041) (0.068) (0.053) (0.211) (0.040) Mix - 3 / 4 -0.0477*** 1.474*** 0.095* 0.175 0.038 (0.0043) (0.069) (0.054) (0.206) (0.038) U - rec (mean) 0.773*** 6.445*** 4.169*** 4.216*** 0.455*** (0.003) (0.050) (0.038) (0.199) (0.054) Observ ations 189,470 189,470 36,668 189,470 189,470 Notes: U - rec is the omitted reference group. All regressions control for strata fixed effects. Standard errors clustered at the job seek er lev el. *, **, and *** denote significance at the 10%, 5%, and 1% lev els, resp ectively . I Estimating application b eha vior on observ ational data As a robustness chec k, we also examine an alternativ e sp ecification using observ ational data. W e rely on data from the monitoring of job seekers’ searc h activity (see dedicated paragraph b elo w). All job p ostings on which a job seeker has click ed are identified and stored, along with subsequen t actions—particularly whether an application was submitted. F or eac h of these p ostings, we compute the indicators U and P . W e then estimate equation ( 16 ) directly using this observ ational dataset, with a logit mo del with or without fixed effects. Results app ear in T able I13 . The first and second columns (Logit) and (FE-Logit) of table I13 presen t the results with and without fixed effects, resp ectively , while the third column (FE-Logit unconstr.) presen ts results in whic h instead of using U with its PES-giv en w eigh ts, w e estimate them. F or eac h of the three estimates, the v ariable − 1 / P i,j has a significant p ositiv e co efficien t (whic h implies, as exp ected, that the probability of applying increases with P ). Moreov er, these co efficients are very similar: 0.018 for the logit, 0.028 for the logit FE, and 0.026 for the logit FE with estimated weigh ts. Similarly , the utilit y score co efficien t U has a p ositiv e and significan t co efficient in each of the first tw o sp ecifications and the v alues are also very close, resp ectively 0.992 and 1.101. As stressed ab o ve, the result in the second 25 T able H8: Second exp eriment - Reduced-F orm estimation - impact of assign- men t on U and P scores and clicks and applications on the 10 first ads (1) (2) (3) (4) (5) (6) (7) U P Rating Clic ks Applications Hirings Hiring rates ( × 100) ( × 100) ( × 100) ( × 10,000) (6) / (5), levels V adore .0 -0.0922*** 3.624*** 0.298*** 0.747*** 0.086 0.017 0.019 (0.0063) (0.072) (0.065) (0.232) (0.066) (0.696) V adore .2 -0.0545*** 2.605*** 0.637*** 1.173*** 0.285*** 1.173 × 10 − 4 0.010 (0.0053) (0.047) (0.051) (0.178) (0.053) (0.541) Mix - 1 / 2 ( V adore .2) -0.0301*** 2.324*** 0.580*** 1.138*** 0.219*** 1.064 0.040 (0.0053) (0.046) (0.051) (0.180) (0.052) (0.647) Applica tion -0.0397*** 2.288*** 0.802*** 1.279*** 0.378*** 0.729 0.022 (0.0053) (0.046) (0.050) (0.180) (0.056) (0.618) X GBoost -0.0045 2.054*** 0.400*** 0.998*** 0.221** 1.005 0.039 (0.0069) (0.065) (0.064) (0.243) (0.074) (0.986) Av erage, U - rec 0.429*** 3.901*** 4.941*** 6.067*** 0.148*** 0.420 0.004 (0.0050) (0.040) (0.046) (0.201) (0.053) (0.698) Num b er Obs. 309,730 309,730 123,875 309,730 309,730 309,730 Note: The U - rec treatment group is used as the reference category and we con trol for the ad p osition in the displa y . Column (7) represents the ratio of the n um b er of hirings (6) ov er the num b er of applications (5) on the recommended v acancies. Standard errors are clustered at the job seeker level. *, **, ***: significance at 10%, 5%, and 1%. column is esp ecially important as it v alidates the interpretation we sk etched at the beginning of section 2 , of the score U i,j as a signal of the utilit y gap U − U ∗ and of the probabilit y P as a signal of the chances of success of an application, and that b oth scores m ust b e taken in to accoun t to design an optimal RS. In addition, consistent with intuition, in the last column the fit b etw een job seekers’ parameters and v acancies in terms of occupation, reserv ation w ages, skills, diplomas, and geographic mobility significantly predicts that an application is more likely . The only unexp ected result here is that the fit in terms of exp erience in the o ccupation seems to enter negatively into the application decision. 27 Observ ational data used in the v aluation exercise. F or the analysis using observ a- tional data in this pap er, w e consider this market from weeks 1 to 48 of 2019. There, w e use data on 1,181,902 (or 516,776) unique job seek er searc h sessions (or job ads); and on a verage, 610,986 job s eek ers (or 129,642 job ads) are active in a given w eek. W e observe 75,744 suc- 27 The introduction of fixed effects forces to restrict the sample to so-called “mov ers” for whom at least t w o clicks are observ ed, including at least one application and one non-application. In order to track the c hanges due to the different sp ecifications and the different sample, the app endix table I13 compares the results of the model with fixed effects on mov ers (column 3) to those with uniform w eights (column 2) as w ell as the results without fixed effects and on the whole p opulation (column 1). Despite the sharp reduction in the n umber of observ ations used b etw een these columns the results are close. The table shows the robustness of the result for 1 / P i,j . The estimated co efficients are all negative, as exp ected, and very close to each other. 26 T able H9: First b eta-test - Reduced-F orm estimation - impact of assignment on U and P scores and clicks and applications on the 10 first ads U P Note Clic ks Applications x100 x100 x100 V adore .0 -0.1875*** 4.519*** 0.118 0.599** 0.101* (0.0055) (0.108) (0.075) (0.300) (0.058) Mix - 3 / 4 -0.1743*** 3.747*** 0.085 0.531* 0.054 (0.0057) (0.098) (0.075) (0.297) (0.056) Mix - 1 / 2 -0.1557*** 3.462*** 0.136* 0.788** 0.068 (0.0058) (0.095) (0.074) (0.298) (0.058) Mix - 1 / 4 -0.0485*** 1.406*** 0.020 0.101 -0.010 (0.0061) (0.098) (0.075) (0.294) (0.053) V adore .0, scores -0.1952*** 4.479*** -0.097 0.212 0.011 (0.0054) (0.108) (0.075) (0.284) (0.054) Mix - 3 / 4 , scores -0.1760*** 3.775*** 0.065 0.219 0.017 (0.0057) (0.010) (0.075) (0.292) (0.053) Mix - 1 / 2 , Score -0.1600*** 3.479*** 0.066 0.366 0.027 (0.0058) (0.099) (0.075) (0.295) (0.053) Mix - 1 / 4 , scores -0.0457*** 1.335*** -0.109 0.136 0.052 (0.0061) (0.097) (0.076) (0.286) (0.054) U - rec , scores 0.0012 -0.204* -0.275*** -0.114 -0.035 (0.0061) (0.091) (0.076) (0.285) (0.052) Av erage, U - rec 0.633*** 5.584*** 4.307*** 3.844*** 0.224*** (0.004) (0.065) (0.052) (0.200) (0.036) Num b er Obs. 189,470 189,470 36,668 189,470 189,470 Note: The U - rec treatment group is used as the reference category . Standard errors are clustered at the job seeker level. *, **, ***: significance at 10%, 5%, and 1%. 27 T able H10: Second exp eriment - Reduced-F orm estimation by displa y con- dition U P Notes Clic ks Applications Hirings x100 x100 x100 x10,000 V adore .0 -0.0922*** 3.624*** 0.298*** 0.747*** 0.086 0.017 (0.0063) (0.072) (0.0645) (0.232) (0.0659) (0.696) Application -0.0388*** 2.276*** 0.766*** 1.737*** 0.392*** 0.518 (0.0063) (0.065) (0.0626) (0.262) (0.0835) (0.858) Mix - 1 / 2 with V adore .2 -0.0298*** 2.354*** 0.515*** 1.588*** 0.261*** 0.954 (0.0066) (0.062) (0.0628) (0.262) (0.0761) (0.961) V adore .2 -0.0523*** 2.589*** 0.547*** 1.818*** 0.267*** -0.484 (0.0063) (0.066) (0.0626) (0.264) (0.0776) (0.484) X GB -0.0045 2.054*** 0.400*** 0.998*** 0.221*** 1.005 (0.0069) (0.065) (0.0642) (0.243) (0.0742) (0.986) V adore .2, scores -0.0556*** 2.639*** 0.689*** 0.962*** 0.294*** -0.484 (0.0062) (0.066) (0.0625) (0.242) (0.0856) (0.484) Application, scores -0.0344*** 2.297*** 0.804*** 1.404*** 0.299*** 1.362 (0.0063) (0.063) (0.0618) (0.247) (0.0760) (1.042) Mix - 1 / 2 with V adore .2, scores -0.0333*** 2.279*** 0.585*** 0.933*** 0.248*** 0.437 (0.0064) (0.062) (0.0620) (0.239) (0.0749) (0.812) Application, explanation -0.0428*** 2.302*** 0.837*** 0.874*** 0.391*** 0.496 (0.0063) (0.063) (0.0630) (0.246) (0.0884) (0.845) Mix - 1 / 2 with V adore .2 , explanation -0.0301*** 2.354*** 0.585*** 1.019*** 0.174** 2.418* (0.0066) (0.063) (0.0642) (0.250) (0.0697) (1.279) V adore .2, explanation -0.0589*** 2.565*** 0.653*** 0.987*** 0.291*** 0.924 (0.0062) (0.064) (0.0636) (0.234) (0.0741) (0.946) Application, explanation + -0.0431*** 2.274*** 0.801*** 1.104*** 0.436*** 0.497 (0.0064) (0.064) (0.0629) (0.255) (0.0929) (0.846) Mix - 1 / 2 with V adore .2 , explanation + -0.0269*** 2.312*** 0.636*** 1.017*** 0.192** 0.480 (0.0065) (0.062) (0.0633) (0.252) (0.0809) (0.836) V adore .2, explanation + -0.0512*** 2.626*** 0.657*** 0.944*** 0.286*** 0.005 (0.0063) (0.065) (0.0642) (0.248) (0.0753) (0.688) Av erage, U - rec 0.427*** 3.918*** 4.941*** 2.232*** 0.310*** 0.484*** (0.005) (0.039) (0.046) (0.149) (0.042) (0.707) Num.Obs. 309,730 309,730 123,865 309,730 309,730 30,973 Note: The U - rec treatment group is used as the reference category . Standard errors are clustered at the job seeker level. *, **, ***: significance at 10%, 5%, and 1%. 28 T able H11: Second b eta-test - Reduced-F orm estimation - impact of the assignmen t on Γ for the 10 first ads p p a Γ p h = p × p a ( × 100) ( × 100) ( × 10 , 000) ( × 10 , 000) (1) (2) (3) (4) U - rec 0.431 0.250 0.323 0.320 [0.411,0.452] [0.242,0.259] [0.292,0.352] [0.290,0.349] V adore .0 1.375 0.442 0.848 0.843 [1.356,1.396] [0.433,0.451] [0.817,0.879] [0.813,0.874] V adore .2 1.867 0.600 1.221 1.214 [1.856,1.877] [0.596,0.604] [1.205,1.236] [1.198,1.230] Mix - 1 / 2 ( V adore .2) 1.535 0.551 0.990 0.985 [1.525,1.546] [0.546,0.555] [0.974,1.005] [0.969,0.999] Applica tion 1.355 0.676 1.116 1.109 [1.345,1.365] [0.672,0.680] [1.100,1.134] [1.094,1.126] X GBoost 1.140 0.489 0.825 0.820 [1.123,1.161] [0.480,0.498] [0.794,0.858] [0.790,0.852] Av erage with Γ 1.939 0.656 1.349 1.342 [1.935,1.943] [0.654,0.658] [1.341,1.357] [1.334,1.350] Note: Num b er of observ ations: 309,730. W e use 500 split-sampling in half to estimate separately the probabilities p and p a on the first part and to p erform these regressions on the second one. F ollowing Chernozh uk o v et al. ( 2018 ), w e report the median ov er the splits of the estimated co efficients and lo wer/upper confidence b ounds at the 95% level, whic h giv es the 90% confidence in terv als displa y ed in brack ets. These tak e in to account uncertaint y conditional on the split as w ell as uncertaint y due to split-sampling. These are the av erages ov er the 500 splits. 29 T able H12: Second b eta-test - Average differences b etw een the Γ-optimal recommendation set and the recommendation set for a giv en RS using the Γ metric Algorithm Estimate CI 95% CI 99% Applica tion 0.23 [0.227, 0.243] [0.225, 0.245] U - rec 1.02 [0.971, 1.069] [0.957, 1.080] Mix - 1 / 2 ( V adore .2) 0.35 [0.337, 0.360] [0.334, 0.365] V adore .0 0.46 [0.429, 0.492] [0.422, 0.503] V adore .2 0.14 [0.130, 0.142] [0.128, 0.144] X GBoost 0.51 [0.488, 0.541] [0.483, 0.549] Note: Number of observ ations: 309,730. W e use 500 split-sampling in half to estimate separately the proba- bilities p and p a on the first part and to perform these regressions on the second one. F ollowing Chernozh uko v et al. ( 2018 ), we compute the median ov er the splits of the estimated co efficients and low er/upp er confidence b ounds obtained using 1000 b o otstrap replications at the 97.5% and 99% levels, whic h gives the 95% and 99% confidence interv als resp ectively , display ed in brack ets. These take in to account uncertain ty conditional on the split as well as uncertaint y due to split-sampling. These are the av erages ov er the 500 splits. cessful matches in the data. Observ ations from w eek 1 to 43 of 2019 are used as a training set (represen ting 66,914 matches) for the tw o RSs; while w eeks 44 to 48 (representing 8,830 matc hes) are used as a test set to ev aluate the qualit y of recommendations. Sample sizes and restrictions for the exp eriments are detailed b elow. More precisely , for the calibration of the matching probability (App endix D ), w e use time- ordered sequences of all applications made on the PES w ebsite together with the outcomes for all individuals without o ccupational restrictions in the test set ( i.e. , from weeks 44 to 48 of 2019). This amounts to 85,639 job seekers, 207,544 applications and 8,830 hires. F or the estimation of the mo del of application using observ ational data (App endix I ), we use all clic ks recorded on v acancies p osted on the PES website with outcomes (application or not) for job seekers b elonging to the transp ortation and logistics sector during w eek 44 of 2019, whatev er the outcome (application or hiring or not). Estimation keeps 70,557 observ ations for 8,105 job seek ers, and 869 of them applying at least once. Finally , for the comparison of the rankings of the v acancies b etw een RSs (App endix E ), w e use the sample of 60,299 job seek ers whose main sector is transp ortation and logistics in the test sample, where 18,873 v acancies are a v ailable during that p erio d in this sector. 30 T able I13: Estimates of the mo del of application on job p ostings (1) (2) (3) Logit FE-Logit FE-Logit unconstr. Estimate Std. error Estimate Std. error Estimate Std. error Utilit y score U i,j ( α ) 0.992 ∗∗ 0.194 1.101 ∗∗∗ 0.155 Occupation 0.582 ∗∗∗ 0.104 Skills 0.175 ∗ 0.114 Reserv ation wage 0.236 ∗∗∗ 0.082 Languages -0.010 0.229 Exp erience in o cc. -1.017 ∗∗∗ 0.339 Diploma 0.288 ∗∗ 0.118 Driving license 0.106 0.097 Geographic mobility 0.625 ∗∗∗ 0.214 Duration 0.139 0.068 T yp e of con tract 0.015 0.004 In verse of P i,j ( β ) -0.018 ∗∗ 0.007 -0.028 ∗∗∗ 0.004 -0.026 ∗∗∗ 0.004 Avg. indiv. Fixed effects -1.908 0.179 -1.388 0.047 -1.372 0.04 Estimation of equation ( 16 ) modeling applications as a fixed effect logit model. Notes: Our sample is the set of all clicks on job p ostings monitored at the PES for job seekers in the transp ortation and logistics sector during week 44 of 2019, leading to an application and hiring or not. Fixed effect estimation keeps 70,557 observ ations for 8,105 job seekers, and 869 of them applying at least once. Thus, 17,865 observ ations are kept for estimation. Significance levels: < 1% : ∗∗∗ , < 5% : ∗∗ , < 10% : ∗ . 31
Original Paper
Loading high-quality paper...
Comments & Academic Discussion
Loading comments...
Leave a Comment