AI Token Futures Market: Commoditization of Compute and Derivatives Contract Design
As large language models (LLMs) and vision-language-action models (VLAs) become widely deployed, the tokens consumed by AI inference are evolving into a new type of commodity. This paper systematically analyzes the commodity attributes of tokens, arg…
Authors: Yicai Xing
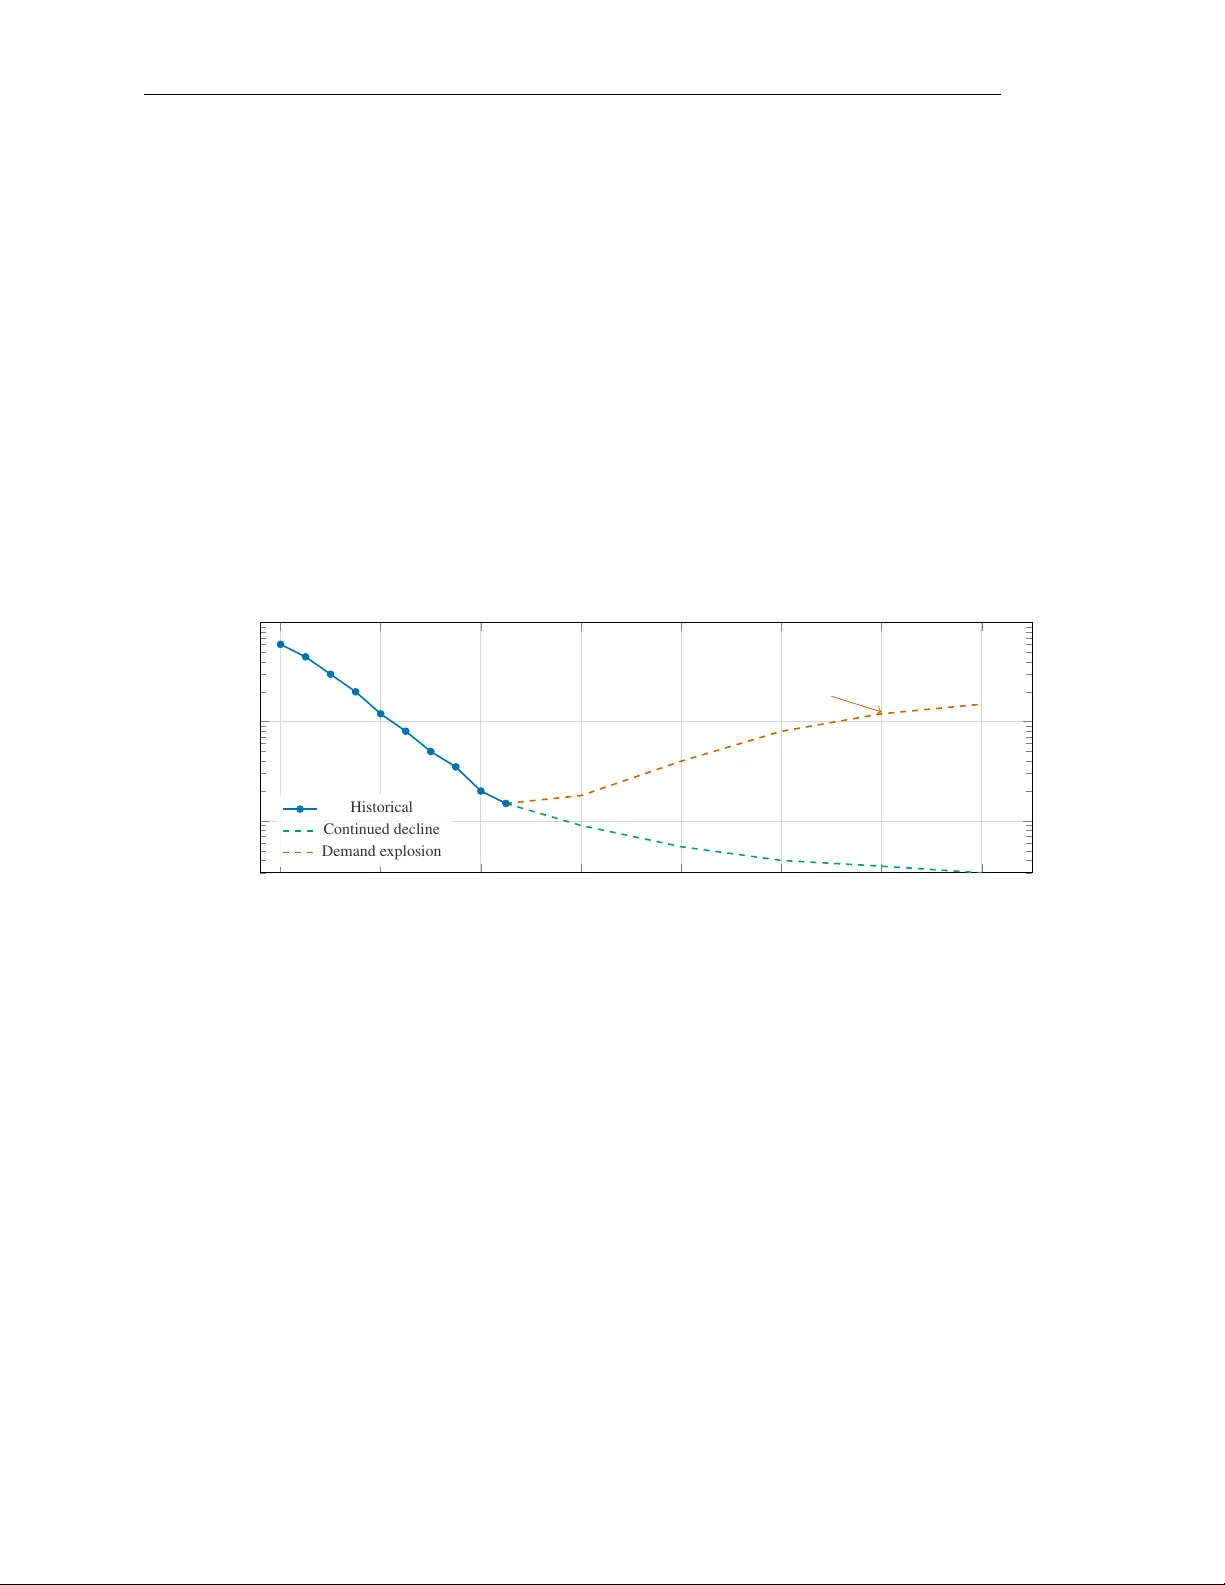
A I T O K E N F U T U R E S M A R K E T : C O M M O D I T I Z A T I O N O F C O M P U T E A N D D E R I V A T I V E S C O N T R A C T D E S I G N Y icai Xing Independent Researcher xingyc18@tsinghua.org.cn March 2026 Abstract As large language models (LLMs) and vision-language-action models (VLAs) become widely deployed, the tokens consumed by AI inference are e volving into a ne w type of commodity . This paper systematically analyzes the commodity attributes of tokens, ar guing for their transition from “intelligent service outputs” to “compute infrastructure raw materials, ” and draws comparisons with established commodities such as electricity , carbon emission allow ances, and bandwidth. Building on the historical experience of electricity futures markets and the theory of commodity financialization, we propose a complete design for standardized token futures contracts, including the definition of a Standard Inference T oken (SIT), contract specifications, settlement mechanisms, margin systems, and market-maker regimes. By constructing a mean-reverting jump-dif fusion stochastic process model and conducting Monte Carlo simulations, we ev aluate the hedging efficiency of the proposed futures contracts for application-layer enterprises. Simulation results show that, under an application-layer demand explosion scenario, tok en futures can reduce enterprise compute cost v olatility by 62%–78%. W e also explore the feasibility of GPU compute futures and discuss the regulatory frame work for token futures markets, providing a theoretical foundation and practical roadmap for the financialization of compute resources. Keyw ords: AI inference T oken pricing Compute commoditization Futures contract design Hedging strate gies Monte Carlo simulation 1 Introduction 1.1 The Rise of AI Inference Economics Over the past decade, the economic center of gravity in artificial intelligence has shifted from training to inference. During the “large model race” of 2017–2022, the industry’ s core concern was training cost—GPT -3’ s training cost approximately $4.6 million ( Bro wn et al. , 2020 ), while GPT -4’ s training cost is estimated to exceed $100 million. Howe ver , as pretrained models mature and commercial deployment scales, inference costs are supplanting training costs as the central issue in AI economics. The logic behind this paradigm shift is clear and profound: training is a one-time fix ed-cost in vestment, while inference is an ongoing marginal-cost expenditure. When a model is called billions of times daily by millions of users, cumulati ve inference costs far e xceed training in vestment. According to Epoch AI estimates, as of early 2025, inference computation accounts for o ver 60% of total computation among major AI model providers ( AI , 2023 ), and this proportion is accelerating. Sevilla et al. ( 2022 ) sho w that compute required for machine learning has grown exponentially o ver the past decade and continues to accelerate, meaning inference-side compute demand will become the key dri ver of global computing resource allocation. In this conte xt, the token—the basic unit of measurement for large language model inference—is evolving from a technical term into an economic concept. Every AI inference request can be decomposed into input and output tok en 1 A pr eprint processing, and per-token pricing has become the industry-standard model. This token-based metering and pricing system lays the foundation for standardized trading of compute resources. 1.2 Current State and T rends in T oken Pricing T oken prices hav e experienced dramatic declines over the past three years. Using GPT -4-le vel capabilities as a benchmark, inference prices fell from approximately $60 per million output tok ens in early 2023 to less than $1.5 per million output tokens in early 2025—a more than 40-fold reduction. This decline stems from three overlapping factors: first, model architecture optimization (e.g., Mixture-of-Experts models) significantly reducing per -inference computation ( Kaplan et al. , 2020 ); second, hardware upgrades (from A100 to H100 to B200) continuously improving compute per dollar ( AI , 2023 ); and third, ov ersupply-driven price competition—numerous ne w entrants (DeepSeek, Mistral, open-source model hosts) triggering intense price wars. Ho wever , this sustained price decline is not necessarily permanent. Current token pricing lar gely reflects a supply-dri ven buyer’ s market—model providers with e xcess capacity are forced to subsidize inference services belo w marginal cost to acquire market share. This situation resembles the excessi ve competition phase in early electricity market liberalization ( Borenstein , 2002 ). 1.3 Problem Statement When the application layer explodes, token price trajectories will face a fundamental rev ersal. The commercial deployment of vision-language-action models (VLAs) ( Brohan et al. , 2023 ; Driess et al. , 2023 ), real-time inference demands of autonomous driving systems, continuous decision-making computation in industrial automation, and large-scale applications of embodied AI will all dri ve exponential growth in token demand. W ith supply-side growth constrained by data center construction c ycles, energy supply , and chip production capacity , supply-demand mismatches will ine vitably push token prices higher , potentially producing extreme v olatility similar to electricity market “price spikes” ( Longstaf f and W ang , 2004 ). This leads to the paper’ s core questions: (1) Does the tok en possess the fundamental attributes to become a standardized commodity? (2) Ho w should standardized token futures contracts be designed to manage compute cost risk? (3) What prerequisites must be met for establishing a token futures market? (4) T o what extent can hedging strategies reduce compute cost v olatility for application-layer enterprises? 1.4 Contributions This paper makes four contributions. First, we systematically demonstrate tokens’ commodity attributes, establishing a comparativ e analysis framework between tokens and existing commodities such as electricity and carbon emission allow ances, and propose a three-factor token supply model. Second, based on Black ( 1986 )’ s theory of successful futures contract conditions, we design a complete tok en futures contract scheme, including the Standard Inference T oken (SIT) definition, settlement mechanisms, margin systems, and market-maker regimes. Third, through Monte Carlo simulation, we ev aluate token futures’ hedging ef ficiency , providing quantitativ e support for market participants’ decisions. F ourth, we explore the feasibility of GPU compute futures and discuss the regulatory frame work for token futures markets. The remainder of this paper is organized as follo ws: Section 2 analyzes tokens’ commodity attributes; Section 3 examines the supply-demand structure and price dynamics; Section 4 establishes the theoretical frame work based on electricity futures analogies; Section 5 designs the token futures contract; Section 6 analyzes hedging strategies and market participants; Section 7 e xplores GPU futures feasibility; Section 8 presents Monte Carlo simulations; and Section 9 provides discussion and outlook. 2 A pr eprint 2 Commodity Attribute Analysis of T ok ens 2.1 Classical Definition of Commodities and T oken Applicability A commodity in economics is defined as a standardized product with complete or high substitutability , where individual units have no substantiv e differences and can be traded anonymously in large-scale markets ( Carlton , 1984 ). F or a product to become a tradeable commodity , it typically must satisfy the following conditions: Fungibility . T okens exhibit high functional fungibility . When an application sends an inference request to an AI model, it cares about output quality and latency , not which specific GPU generated the token. T okens of equiv alent capability from different pro viders (OpenAI, Anthropic, Google, open-source models) are functionally interchangeable. This fungibility , while not as perfect as gold or crude oil, is sufficient to support standardized trading—analogously , crude oil from different origins (WTI, Brent, Dubai) varies in quality but this does not pre vent oil futures markets from functioning. Standardized measurement. The token as a measurement unit is already highly standardized. The industry con vention of quoting in “million tokens” (M tok ens) is univ ersally adopted. Despite differences in tokenizers across models, the “token” as a measure of inference workload has achie ved broad consensus, analogous to electricity measured in kilow att-hours (kWh) or natural gas in million British thermal units (MMBtu). Large-scale trading. Global AI API call volumes ha ve reached the scale to support a commodity market. According to Stanford HAI ( Stanford HAI , 2024 ), the annual transaction v olume of the global AI inference API market e xceeded $10 billion in 2024, growing at o ver 100% annually—comparable to the carbon emission trading market’ s early stage ( Ellerman and Buchner , 2007 ). 2.2 The Dual Nature of T okens: Raw Material and Finished Pr oduct T okens possess a distincti ve dual nature, relativ ely rare among traditional commodities. Raw material perspective. From a factor of production vie wpoint, the token is a compute resource—a raw material input for producing intelligent services. An AI SaaS company must “consume” tokens to generate answers for its customers. In this perspectiv e, tokens resemble steel in manufacturing or ethylene in the chemical industry—an intermediate input whose cost directly affects do wnstream product pricing and margins. Finished pr oduct perspectiv e. From a consumer vie wpoint, the token is the final output of an intelligent service—users purchase tokens (though typically not using this term) to receiv e AI answers, recommendations, or creative content. In this perspectiv e, tokens resemble tap water or electricity—a service product directly facing end consumers. The critical judgment is that as VLAs and other applications proliferate, the raw material attribute will gradually dominate the finished product attrib ute. When AI e xpands from “chatbot” to “actor , ” token consumption will embed into larger production processes, becoming infrastructure input across manufacturing, logistics, healthcare, and other industries. This transition parallels electricity’ s historical ev olution from a “novel product” in the late 19th century to “infrastructure” by mid-20th century ( Buyya et al. , 2009 ). 2.3 Comparative Analysis with Analogous Commodities T o more clearly understand tokens’ commodity attrib utes, we systematically compare them with four analogous e xisting commodities (see T able 1 ). Electricity is the closest analogue to tokens. Both share key attributes: non-storability (produced and consumed simultaneously), short-term supply rigidity , and time-varying demand characteristics ( Bessembinder and Lemmon , 2002 ; Lucia and Schwartz , 2002 ). The successful operation of electricity futures markets demonstrates that e ven for non-storable commodities, futures contracts can effecti vely serv e price discovery and risk management functions. Carbon emission allo wances pro vide another valuable reference. As an “artificial commodity” created entirely by regulatory policy , carbon credits’ market de velopment history shows how a ne w commodity can b uild a complete futures trading system from scratch ( Ellerman and Buchner , 2007 ; Hintermann , 2010 ). Cloud compute (e.g., A WS Spot Instances) is the direct predecessor of tokens. Agmon Ben-Y ehuda et al. ( 2013 )’ s study of Amazon EC2 spot instance pricing re veals the auction characteristics and price dynamics of cloud compute 3 A pr eprint Finished Product ( chatbot output) Raw Material ( compute input) T oken Dual Nature transition 2023 2025 2027 2030 Y ear Share Product Raw Material Figure 1: Ev olution of token dual attributes. As application scenarios expand from chatbots to embodied intelligence, the raw material attrib ute of tokens will gradually surpass the finished product attribute, mirroring electricity’ s transition from “product” to “infrastructure. ” T able 1: Comparati ve analysis of token attrib utes against analogous commodities Attribute Electricity Carbon Cred- its Bandwidth Cloud Com- pute AI T oken Storability Non-storable Storable (quota) Non-storable Non-storable Non-storable Standardization High (kWh) High (tCO 2 ) Medium (Mbps) Medium (inst./hr) High (M to- kens) Price volatility V ery high High Medium Med–high Currently low , expected high Supply elasticity Low (short- term) Policy-dri ven Medium Medium Low (short- term) Demand elasticity Low Medium Medium Med–high V aries by use case Pricing mechanism Market + regula- tion Auction + sec- ondary Contract + con- gestion On-demand + spot Provider -set Futures market Mature Mature None Nascent Non-existent (proposed here) Physical basis Power plants Artificial quota Network infra. Data centers GPU clusters markets. T okens can be vie wed as a further standardization and granularization of cloud compute—from “virtual machine instance-hours” to “million tokens. ” 2.4 Three-F actor T oken Supply Model T oken supply capacity is determined by three interacting factors, which we term the “three-factor supply model. ” Definition 2.1 (T oken Supply Function) . Given total in vestment scale K , token supply capacity Q T oken can be expr essed as: Q T oken = η H · η A C E · K (1) wher e C E is unit energy cost ($/kWh), η H is har dware ef ficiency (FLOPS/$), and η A is algorithm efficiency (T o- kens/FLOP). 4 A pr eprint Energy Cost C E ($/kWh) Hardware Ef f. η H (FLOPS/$) Algorithm Eff. η A (T ok/FLOP) T oken Supply Q ÷ × × Q = η H · η A C E · K Figure 2: Three-f actor tok en supply model. T oken supply capacity is jointly determined by energy cost, hardw are efficienc y , and algorithm ef ficiency , forming a multiplicative relationship. The three-factor model rev eals structural features of token supply . Energy cost is constrained by electricity market structure and geography , changing slowly year -over -year but exhibiting seasonal fluctuations ( Josko w , 2001 ). Patterson et al. ( 2021 ) estimate that power consumption for lar ge-scale AI model training has reached the lev el of a small city . Hardwar e efficiency follows a generalized extension of Moore’ s Law but is constrained by physical limits of chip manufacturing and industry concentration. NVIDIA holds over 80% of the high-end AI chip market, with product iteration cycles (approximately 18–24 months) directly determining the gro wth rate of η H ( AI , 2023 ). Algorithm efficiency is the fastest-gro wing but most unpredictable factor among the three. Kaplan et al. ( 2020 ) and Hoffmann et al. ( 2022 )’ s scaling law research shows power -law relationships between model performance and computation, whose coefficients can be impro ved through algorithmic innov ations (attention mechanism optimization, quantization, sparsification, knowledge distillation). The multiplicative relationship means that token supply growth is the sum of the three factors’ growth rates (in log terms). When all three improv e simultaneously , supply capacity grows v ery rapidly—this is the fundamental reason for the past three years’ token price collapse. 3 T oken Market Supply-Demand Structur e and Price Dynamics 3.1 Supply Side: Model Pr oviders’ Cost Structure Understanding token pricing requires first analyzing model pro viders’ cost structure. T otal token cost can be decomposed into two components: amortized training cost and marginal inference cost. C total = C train N lifetime + C marginal (2) where C train is total model training cost, N lifetime is expected total tokens serv ed over the model’ s lifetime, and C marginal is the marginal inference cost per tok en. For successful commercial models, training cost becomes mar ginal in the long run—what truly determines tok en pricing is the marginal inference cost, directly determined by the three-f actor model: C marginal = C E η H · η A (3) 5 A pr eprint 3.2 Demand Side: Fr om Developers to Enterprise A pplications T oken demand is undergoing a qualitative transformation from experimental to production-grade deployment. The current demand structure can be divided into four tiers: Tier 1: Developer experimentation ( ∼ 15%, declining). Independent de velopers and small teams using AI APIs for prototyping—highly price-elastic demand. Tier 2: Consumer chat applications ( ∼ 25%). ChatGPT , Claude, and other consumer-facing con versational services— medium price elasticity . Tier 3: Enterprise SaaS integration ( ∼ 40%, rapidly gro wing). V arious enterprise software integrating AI inference capabilities—relativ ely low price elasticity , as AI becomes core to the product value proposition. Tier 4: VLA and autonomous systems ( ∼ 5%, expected to e xplode). Autonomous driving, industrial robotics, medical diagnosis requiring continuous real-time inference ( Brohan et al. , 2023 ; Driess et al. , 2023 )—extremely low price elasticity . The tiered elasticity structure has important implications for price dynamics. As the share of low-elasticity demand (T iers 3 and 4) increases, ov erall token market demand elasticity will decrease, meaning supply shocks will produce larger price swings—consistent with electricity mark et characteristics ( Bessembinder and Lemmon , 2002 ). 2 , 023 2 , 024 2 , 025 2 , 026 2 , 027 2 , 028 2 , 029 2 , 030 10 0 10 1 10 2 VLA / embodied AI demand surge Y ear Price ($/M tokens) Historical Continued decline Demand e xplosion Figure 3: GPT -4-lev el inference token price trend (2023–2025) and future projections. Historical data sho ws continu- ously rapid price decline, but application-layer e xplosion may cause price reversal. Dashed lines show two projection scenarios. 3.3 Price Dynamics and Supply-Demand Mismatch T oken market price dynamics can be di vided into three phases. Phase 1: Supply-driven price decline (2023–2025). The current phase. Simultaneous improvement in all three factors plus intense competition driv es exponential token price decline. Phase 2: Supply-demand r ebalancing (est. 2025–2027). Application-layer deployment scales, token demand grows rapidly . Data center construction, energy supply , and chip capacity e xpansion cannot keep pace. Price decline slo ws, with intermittent rebounds—analogous to “capacity scarcity” in electricity markets ( W ilson , 2002 ). Phase 3: Demand-driven volatility (est. post-2027). VLA and embodied AI commercialization at scale dri ves explosi ve token demand growth. With short-term supply elasticity e xtremely lo w (new data centers require 18–36 months), supply-demand mismatches will produce significant price v olatility . T oken prices will no longer decline monotonically but e xhibit peak-valle y patterns similar to electricity markets ( Borenstein , 2002 ). The core supply-demand mismatch lies in the asymmetric timescales of demand growth and supply expansion. T oken demand gro wth can be instantaneous—a killer app launch can increase API call v olume 10-fold within days. Supply 6 A pr eprint expansion is constrained by the physical world: GPU production depends on TSMC wafer capacity ( ∼ 24 months to expand), data center construction requires 18–36 months, and po wer infrastructure expansion takes years. 3.4 Information Asymmetry and Mark et Failur e The current token mark et exhibits severe information asymmetry , which both exacerbates price volatility risk and provides additional justification for establishing a futures market. Pricing opacity . Model providers’ token pricing is typically far belo w actual marginal cost—strategic subsidization to rapidly acquire market share. This makes the “true” price artificially suppressed, and demand-side participants cannot judge whether current low prices are sustainable ( Shapiro and V arian , 1998 ). Price dispersion. Dif ferent providers of fering equi valent capability tokens may have price differences exceeding 10-fold, reflecting brand premiums, service quality differences, and search costs. Asymmetric supply inf ormation. Model providers possess complete information about their capacity utilization, expansion plans, and cost structures, while demand-side participants kno w very little ( Borenstein , 2002 ). These market failures provide ample justification for establishing a token futures mark et—a core function of futures markets is reducing information asymmetry through centralized price discov ery mechanisms ( Harris , 2003 ). 4 Electricity Futures Analogy and Theor etical Framework 4.1 History of Electricity Futures Mark ets The de velopment of electricity futures markets provides the most direct historical reference for token futures. Electricity and tokens share a key attrib ute rare among commodities: non-storability . Electricity must be consumed at the instant it is produced. T okens are identical—inference tokens are “consumed” the moment they are generated, with no concept of “token in ventory . ” Electricity futures market dev elopment proceeded in three stages: market liberalization (1990s, with Nord Pool in 1993, followed by PJM and ERCOT in the US) ( Wilson , 2002 ; Hogan , 1992 ); introduction of futures contracts allowing hedging of price risk ( Lucia and Schwartz , 2002 ); and de velopment of a deri vati ves ecosystem including options, swaps, and contracts for difference. Bessembinder and Lemmon ( 2002 ) established an equilibrium pricing model for electricity futures, demonstrating that the deviation of futures from spot prices can be explained by demand variance and supply-demand skewness. This framew ork applies directly to token futures—when token demand v ariance increases and the supply-demand curve is positiv ely ske wed, token futures will exhibit a positi ve risk premium. Longstaff and W ang ( 2004 )’ s high-frequency empirical study rev ealed key characteristics of electricity spot prices: extreme peak prices (exceeding 100 × normal lev els), rapid mean rev ersion, and significant seasonal patterns—features likely to appear in mature token mark ets. 4.2 Commodity Financialization Theory The e volution from pure physical trading to financialized commodity follows a relativ ely fixed path: spot trading standardization → forward contracts → futures listing → options and complex deri vati ves → index products ( Cheng and Xiong , 2014 ). T ang and Xiong ( 2012 ) sho w that commodity financialization has dual ef fects: impro ving market liquidity and price discov ery efficiency , while potentially increasing correlation with macro-financial factors. Basak and Pa vlov a ( 2016 ) prov e that index in vestors’ participation changes commodity price dynamics—increasing volatility , altering the term structure, and creating contagion across commodities. For token futures, this implies careful design of market access and position limits to prev ent excessi ve financialization. 4.3 Conditions for Successful New Futur es Markets Black ( 1986 ) proposed fiv e necessary conditions for successful futures contract listing. W e ev aluate each for tokens: 7 A pr eprint T able 2: Black (1986) futures success conditions applied to token mark ets Cond. Original Requirement T oken Market Status Fulfillment 1 Sufficient price v olatility Currently declining; expected to increase significantly Partial 2 Sufficiently lar ge spot market Annual volume > $10B, rapidly gro wing Met 3 Standardizable underlying T oken measurement highly standardized Met 4 Sufficient hedging demand Application-layer enterprises face compute cost risk Potential 5 No substitute risk management tools No alternati ve hedging instruments exist Met Condition 1 is currently the least fulfilled—tok en prices primarily e xhibit one-directional decline. Howe ver , as analyzed in Section 3 , this is expected to change once the application layer explodes. Silber ( 1981 ) further notes that futures contract success also depends on contract design quality—specification reasonableness, settlement mechanism con venience, and market-mak er regime effecti veness. 4.4 T wo-Sided Market Theory The token market is essentially a two-sided platform market—model providers (supply) and application de velopers (demand) interact through API platforms. Rochet and T irole ( 2003 , 2006 )’ s two-sided mark et theory provides an important lens for understanding token pricing. In two-sided markets, optimal pricing is not simply splitting costs between sides, but differentiating based on each side’ s demand elasticity and network externality strength. Current providers’ “low-price customer acquisition” strate gy reflects two-sided market pricing logic. Armstrong ( 2006 )’ s competitive model sho ws that multi-platform competition leads to more subsidies for the higher -elasticity side, explaining why token prices are pushed far below mar ginal cost during competition. Howe ver , this equilibrium is unstable—once market share stabilizes, subsidies will gradually withdraw . T oken futures will change these dynamics by providing a public, market-based forward price signal, reducing strategic pricing distortions. 5 T oken Futur es Contract Design 5.1 Contract Standardization The core challenge in token futures contract design is defining the underlying—different models’ tokens v ary in quality (performance). Ho w to define a standardized “contract underlying” is the primary design question. Definition 5.1 (Standard Inference T oken (SIT)) . The Standard Infer ence T oken (SIT) is defined as: one infer ence token pr oduced by a model achieving specified performance thr esholds on a standar dized benchmark suite. The SIT performance benchmark is anc hored to GPT -4-T urbo’ s performance as of J anuary 2024 on mainstr eam benchmarks (MMLU ≥ 86%, HumanEval ≥ 67%, GSM8K ≥ 92%). The SIT design logic resembles the “ API gravity” and “sulfur content” standards in crude oil futures—by setting quality benchmarks, tokens from dif ferent sources can be traded under a unified standard. Complete contract specifications: • Underlying: Standard Inference T oken (SIT) • Contract size: 1 million SIT per lot (1 lot = 1M SIT) • Quote conv ention: USD per million SIT ($/M SIT) 8 A pr eprint SIT Futures Contract Contract Specs size, quote, months Settlement TPI cash settlement Margin System initial, maintenance Market-Maker liquidity provision Figure 4: T oken futures contract design framew ork. The contract comprises four dimensions: contract specifications, settlement mechanism, margin system, and mark et-maker regime. • Minimum price increment: $0.01/M SIT (i.e., $0.01 per lot) • Contract months: 6 consecutiv e monthly + 4 nearest quarterly contracts • T rading hours: Monday–Friday , 24-hour continuous trading • Last trading day: Third W ednesday of the deliv ery month • Settlement: Cash settlement (against T oken Price Index, TPI) 5.2 Settlement Mechanism Design Since tokens are non-storable, traditional physical deliv ery is infeasible. W e adopt cash settlement based on the T oken Price Index (TPI). Definition 5.2 (T oken Price Index (TPI)) . The T oken Price Index is defined as the multi-pr ovider volume-weighted averag e token price: TPI t = N X i =1 w i · P i,t (4) wher e P i,t is pr ovider i ’ s SIT -equivalent price at time t , w i is the pr ovider’ s weight, and N is the number of qualified pr oviders. W eights w i are determined by volume-weighting: w i = V i P N j =1 V j (5) with a single-provider weight cap of 30% to pre vent undue influence. Each pro vider’ s SIT -equiv alent price is adjusted for model capability: P i,t = P raw i,t · S SIT S i (6) 5.3 Margin and Risk Contr ol Initial margin is set at 8%–12% of contract v alue, dynamically adjusted based on historical volatility: M init = max α · σ 20 · √ T · V contract , M floor (7) where σ 20 is the 20-day annualized v olatility , T is the holding period, V contract is contract notional, and α is the co verage coefficient (typically 3, corresponding to 99.7% confidence). Maintenance margin is set at 75% of initial margin. Mark-to-market is performed daily . Price limits are set at ± 15% (first tier , triggering 10-minute trading halt) and ± 25% (second tier , halting trading until next session). 9 A pr eprint 5.4 Market-Maker Regime Market makers are essential for liquidity in nascent futures markets ( Harris , 2003 ). Designated mark et makers must: (1) maintain minimum net capital of $50 million; (2) continuously provide two-sided quotes for at least 80% of trading hours; (3) maintain bid-ask spreads within 2% (front month) to 5% (back months) of mid-price; and (4) maintain minimum quote size of 50 lots (50M SIT). Kyle ( 1985 ) and Glosten and Milgrom ( 1985 )’ s microstructure theory indicates that market makers face adverse selection risk from informed traders. In token futures, model providers may possess pri vate information about capacity changes and cost structures, requiring market makers to widen spreads to compensate for this information asymmetry . 6 Hedging Strategies and Market Participant Analysis 6.1 Market Participant Classification T oken futures market participants can be classified into three groups with distinct trading moti ves. T oken Futures Hedgers AI SaaS cos., model providers Speculators quant funds, macro funds Arbitrageurs cross-platform, cash-futures risk transfer liquidity efficienc y Figure 5: T oken futures market participant structure. Hedgers transfer risk, speculators assume risk and pro vide liquidity , and arbitrageurs ensure price consistency . Hedgers are the fundamental raison d’être of the tok en futures market. Buy-side hedgers are primarily application-layer AI companies f acing token price increase risk. Sell-side hedgers are primarily model providers facing token price decrease risk. Speculators assume the risk transferred by hedgers and provide market liquidity . Quantitativ e funds can exploit statistical features (mean re version, jumps, seasonality) ( den Boer , 2015 ); macro hedge funds can incorporate token futures into broader “ AI cycle” in vestment themes. Arbitrageurs discov er and e xploit price discrepancies to promote mark et efficiency through cross-platform, cash-futures, and inter-temporal arbitrage ( Harris , 2003 ). 6.2 Optimal Hedge Ratio Johnson ( 1960 ) and Ederington ( 1979 ) established the classical optimal hedge ratio framew ork. Proposition 6.1 (Minimum V ariance Hedge Ratio) . The optimal hedge ratio h ∗ minimizing hedged portfolio variance is: h ∗ = ρ S F · σ S σ F (8) wher e ρ S F is the correlation between spot and futur es price changes, and σ S , σ F ar e their r espective standar d deviations. Pr oof. Let the enterprise’ s spot position be Q S units with futures hedge position Q F units. Defining h = Q F /Q S , the hedged portfolio value change is ∆ V = Q S (∆ S − h · ∆ F ) , with variance: V ar (∆ V ) = Q 2 S σ 2 S − 2 hρ S F σ S σ F + h 2 σ 2 F (9) 10 A pr eprint Setting ∂ V ar (∆ V ) /∂ h = 0 yields h ∗ = ρ S F · σ S /σ F . Hedge efficienc y E is defined as the proportional v ariance reduction: E = 1 − V ar (∆ V hedged ) V ar (∆ V unhedged ) = ρ 2 S F (10) When ρ S F = 0 . 85 , hedge efficienc y is 72.25%—token futures eliminate approximately 72% of cost volatility risk. 7 GPU Futures F easibility Analysis 7.1 GPU Market Financialization Pr ospects NVIDIA ’ s monopolistic position in the high-end AI GPU market makes its products’ supply-demand dynamics similar to OPEC’ s influence on oil markets. H100 GPU prices surged from ∼ $25,000 to o ver $40,000 during the 2023 shortage, spawning speculati ve hoarding ( Singleton , 2014 ). From a commodity financialization perspectiv e ( T ang and Xiong , 2012 ; Cheng and Xiong , 2014 ), the GPU market has some prerequisites: suf ficient scale ( > $50B annual sales), significant price volatility , and clear hedging demand. 7.2 Barriers to GPU Futures Despite some financialization prerequisites, physical GPU futures f ace fundamental obstacles: rapid iteration cycles (18–24 months), making a 12-month contract’ s underlying potentially obsolete at deliv ery; standardization difficulty across multi-dimensional performance axes; and excessive supply concentration with NVIDIA ’ s > 80% market share, meaning prices are largely determined by NVIDIA ’ s pricing decisions rather than market forces. 7.3 GPU Compute Futures: From Physical to Ser vice A more feasible path is futures based on GPU compute time rather than physical GPUs. Definition 7.1 (Standard Compute Unit (SCU)) . The Standar d Compute Unit is defined as one hour of compute fr om a standar d benchmark GPU (H100-80GB-SXM as initial benchmark). Dif ferent GPU models are con verted at their equivalent compute r elative to the benchmark. T oken futures and GPU compute futures form an upstream-downstream relationship. T oken futures reflect “per-unit intelligent service” pricing; GPU compute futures reflect “per-unit compute resource” pricing. The spread between them reflects the algorithm efficiency premium . 8 Monte Carlo Simulation of the T oken Futur es Market 8.1 Model Specification T o ev aluate hedging efficienc y and market dynamics, we construct a token price stochastic process model. T oken price dynamics—long-term mean re version (driv en by three-factor cost trends) plus short-term jumps (demand shocks or supply disruptions)—are best characterized by a mean-rev erting jump-diffusion process ( Lucia and Schwartz , 2002 ). Definition 8.1 (T oken Price Stochastic Process) . T oken price P t ’ s log X t = ln P t follows the stochastic dif ferential equation: dX t = κ ( θ t − X t ) dt + σ dW t + J dN t (11) wher e κ > 0 is mean-r eversion speed, θ t is the time-varying long-term mean, σ is diffusion volatility , W t is standar d Br ownian motion, N t is a P oisson pr ocess with intensity λ , and J ∼ N ( µ J , σ 2 J ) is jump magnitude. The time-varying long-term mean θ t captures the trend and seasonality: θ t = θ 0 + β t + γ sin 2 π t T season (12) 11 A pr eprint T able 3: Monte Carlo simulation model parameters Parameter Symbol Calibrated V alue Interpretation Mean-rev ersion speed κ 2.5 Fast re version, ∼ 2.8-month half-life Initial long-term mean θ 0 ln(2 . 0) Initial log price lev el T rend coefficient β − 0 . 35 ∼ 30% annualized trend decline Diffusion v olatility σ 0.40 40% annualized continuous volatility Jump arriv al rate λ 3.0/year A verage 3 significant jumps per year Jump mean µ J 0.10 Upward-biased jumps (demand shocks) Jump std. dev . σ J 0.25 Jump magnitude uncertainty Seasonal amplitude γ 0.08 ∼ 8% seasonal v ariation Seasonal period T season 1.0 year Annual cycle where β < 0 reflects technology-driv en long-term price decline, and γ and T season capture seasonal demand fluctuations. For futures pricing, we adopt a no-arbitrage frame work under risk-neutral measure Q : F ( t, T ) = E Q [ P T | F t ] = exp e − κ ( T − t ) X t + A ( t, T ) (13) where A ( t, T ) incorporates the long-term mean, trend, v ariance, and jump contributions. 8.2 Simulation Results W e conduct 10,000-path Monte Carlo simulations ov er a 3-year horizon (2026–2028) under three scenarios: baseline (moderate demand growth), optimistic (VLA e xplosion), and pessimistic (accelerated tech progress). 0 6 12 18 24 30 36 0 2 4 6 Phase 1: Supply-dri v en Phase 2: Rebalancing Phase 3: Demand-dri v en Month Price ($/M SIT) Mean path 50% CI 90% CI Figure 6: T oken price Monte Carlo simulation (3-year , 10,000 paths). Solid line shows mean path, shaded regions show 90% and 50% confidence intervals, thin lines sho w two representati ve sample paths. The mean path exhibits a “U-shaped” trend reflecting the transition from supply-driv en to demand-driv en dynamics. Ke y findings: (1) Asymmetric price distribution. T oken price paths exhibit significant positi ve ske wness—upside risk far exceeds downside risk. Supply shocks and demand shocks tend to produce positive jumps (price increases), while technology- driv en price decline is gradual rather than jump-like. Among 10,000 paths, ∼ 15% experience at least one > 100% price increase within 36 months; ∼ 3% experience peak-to-trough swings e xceeding 5 × . 12 A pr eprint (2) V olatility term structure. Implied volatility first rises then falls with term: short-term (1–3 months) ∼ 35%, medium-term (6–12 months) rises to 50%–60% (reflecting application-layer explosion uncertainty), long-term (24–36 months) rev erts to ∼ 40%. (3) Significant hedging effectiveness. Under the baseline scenario, optimal-ratio futures hedging ( h ∗ = 0 . 85 ) reduces 12-month procurement cost standard deviation from $1.80/M SIT (unhedged) to $0.65/M SIT , a variance reduction of 87%. Under the optimistic demand scenario, efficiency is higher ( E = 0 . 91 ). Under the pessimistic scenari o, it is slightly lower ( E = 0 . 78 ) due to higher opportunity cost of hedging. Across all three scenarios, token futures reduce enterprise compute cost volatility by 62%–78% (measured by standard deviation). 8.3 Sensitivity Analysis Sensitivity analysis on three key parameters confirms robustness: hedging efficiency remains 80%–89% whether algorithm efficienc y improvement is assumed at 1.5 × or 3 × annually; GPU iteration cycle v ariations affect long-term price lev els but not hedging value; and application-layer gro wth rate is the most impactful parameter—at 150% annual demand growth, the 90% upper bound reaches $15/M SIT at 36 months. 9 Discussion and Outlook 9.1 Feasibility Assessment T oken futures are technically and economically feasible, subject to se veral preconditions maturing. Already established: tokens as standardized measurement units, spot market scale e xceeding $10 billion, clear hedging demand, and absence of alternativ e risk management tools. Still maturing: two-directional price volatility , further market-based transparent pricing, independent credible TPI establishment, and regulatory clarity . Timing: The optimal launch window is estimated at 2027–2028, when application-layer explosion will ha ve begun reshaping supply-demand structure. The 2025–2026 period is the critical preparation phase for TPI infrastructure, contract design, and regulatory appro val. Preparation TPI design, regulation Launch pilot trading, market makers Growth options, swaps, index products Maturity full ecosystem, global access 2025 2027 2028 2030 2030+ 1–2 years 1–2 years 2–3 years Figure 7: T oken futures mark et de velopment roadmap. From preparation to maturity , an estimated 5–7 year dev elopment cycle. 9.2 Regulatory Framework T oken futures are most appropriately classified as commodity futures , not financial deri vati ves or securities, because the underlying—inference compute services—is a real economic resource with physical basis (GPU compute and electricity consumption). Under the US system, token futures should f all under CFTC jurisdiction. Ke y regulatory considerations include: (1) position limits to pre vent manipulation by entities with mark et power (especially model providers) ( Kyle , 1985 ); (2) fair disclosur e requirements for material information that may af fect token prices; and (3) cr oss-market surveillance gi ven the tight link between spot and futures markets. 13 A pr eprint 9.3 Distinction from Cryptocurr ency Markets T oken futures fundamentally dif fer from cryptocurrency futures (e.g., Bitcoin futures). T okens ha ve a r eal physical basis —ev ery token produced consumes quantifiable electricity and GPU compute. T oken prices are anchored by production costs (floor) and application mar ginal utility (ceiling), making bubble-like detachment from fundamentals unlikely ( Shiller , 2003 ). T oken futures should be positioned as a risk management tool from inception, not a speculati ve vehicle, maintained through institutional design such as speculativ e position limits. 9.4 Future Resear ch Directions This analysis opens sev eral avenues for future research: heterogeneous token pricing in futures (analogous to locational marginal pricing in electricity ( Hogan , 1992 )); token option pricing under non-normal distrib utions ( Cao and W ei , 2004 ); multi-market equilibrium models linking token, GPU compute, and electricity futures; empirical analysis using accumulating token spot mark et data; and mechanism design optimization using auction theory ( V ickrey , 1961 ; Myerson , 1981 ; Milgrom , 2000 , 2004 ; McAfee and McMillan , 1996 ; Cramton , 1997 ). 9.5 Conclusion This paper systematically demonstrates that AI inference tokens are ev olving into a new commodity and proposes a complete standardized token futures contract design. Key conclusions: First, tokens possess fundamental commodity attributes—fungibility , standardized measurement, large-scale trading— and share critical features with electricity , particularly non-storability and supply rigidity . Second, current sustained token price decline is a temporary supply-driven phenomenon. When application-layer explosion reshapes supply-demand structure, significant two-directional v olatility will emerge, creating the fundamental economic justification for a token futures market. Third, SIT -based futures with TPI cash settlement can address standardization, settlement, and risk control challenges. Monte Carlo simulation shows tok en futures can reduce enterprise compute cost volatility by 62%–78%. Fourth, token futures should be positioned as a risk management tool within commodity futures re gulation, fundamen- tally distinct from cryptocurrency futures. W e stand at the early stage of the compute economy . Just as electricity reshaped e very aspect of industrial production in the 20th century , AI inference compute is poised to play an analogous role in the 21st century . And just as lar ge-scale industrial use of electricity gav e rise to electricity futures, large-scale commercial deployment of tokens will gi ve rise to token futures. References T om B. Brown, Benjamin Mann, Nick Ryder , Melanie Subbiah, Jared Kaplan, Pramit Dhariwal, Arvind Neelakantan, Pranav Shyam, Girish Sastry , Amanda Askell, et al. Language Models are Fe w-Shot Learners. Advances in Neural Information Pr ocessing Systems , 33:1877–1901, 2020. Epoch AI. T rends in machine learning hardware. T echnical report, Epoch AI, 2023. Jaime Sevilla, Lennart Heim, Anson Ho, T amay Besiroglu, Marius Hobbhahn, and Pablo V illalobos. Compute trends across three eras of machine learning. arXiv pr eprint arXiv:2202.05924 , 2022. Jared Kaplan, Sam McCandlish, T om Henighan, T om B. Bro wn, Benjamin Chess, Rew on Child, Scott Gray , Alec Radford, Jef frey W u, and Dario Amodei. Scaling laws for neural language models. arXiv pr eprint arXiv:2001.08361 , 2020. Sev erin Borenstein. The trouble with electricity markets: Understanding California’ s restructuring disaster . Journal of Economic P erspectives , 16(1):191–211, 2002. Anthony Brohan, Noah Bro wn, Justice Carbajal, et al. R T -2: V ision-Language-Action Models Transfer W eb Knowledge to Robotic Control. arXiv pr eprint arXiv:2307.15818 , 2023. 14 A pr eprint Danny Driess, Fei Xia, Mehdi S. M. Sajjadi, et al. P aLM-E: An Embodied Multimodal Language Model. arXiv pr eprint arXiv:2303.03378 , 2023. Francis A. Longstaff and Ashle y W . W ang. Electricity forward prices: A high-frequency empirical analysis. The Journal of F inance , 59(4):1877–1900, 2004. Dennis W . Carlton. Futures markets: Their purpose, their history , their gro wth, their successes and failures. The J ournal of Futur es Markets , 4(3):237–271, 1984. Stanford HAI. Artificial intelligence index report 2024. T echnical report, Stanford University Human-Centered Artificial Intelligence, 2024. A. Denny Ellerman and Barbara K. Buchner . The European Union emissions trading scheme: Origins, allocation, and early results. Revie w of Envir onmental Economics and P olicy , 1(1):66–87, 2007. Beat Hintermann. Allow ance price drivers in the first phase of the EU ETS. J ournal of En vir onmental Economics and Management , 59(1):43–56, 2010. Rajkumar Buyya, Chee Shin Y eo, Srikumar V enugopal, James Broberg, and Ivona Brandic. Cloud computing and emerging IT platforms: V ision, hype, and reality for delivering computing as the 5th utility . Futur e Gener ation Computer Systems , 25(6):599–616, 2009. Hendrik Bessembinder and Michael L. Lemmon. Equilibrium pricing and optimal hedging in electricity forward markets. The J ournal of F inance , 57(3):1347–1382, 2002. Julio J. Lucia and Eduardo S. Schwartz. Electricity prices and power deri vati ves: Evidence from the Nordic Power Exchange. Revie w of Derivatives Researc h , 5(1):5–50, 2002. Orna Agmon Ben-Y ehuda, Muli Ben-Y ehuda, Assaf Schuster , and Dan Tsafrir . Deconstructing Amazon EC2 spot instance pricing. In A CM T ransactions on Economics and Computation , volume 1, pages 1–20, 2013. Paul L. Josko w . California’ s electricity crisis. Oxfor d Review of Economic P olicy , 17(3):365–388, 2001. David P atterson, Joseph Gonzalez, Quoc Le, Chen Liang, Lluis-Miquel Munguia, Daniel Rothchild, David So, Maud T exier , and Jeff Dean. Carbon emissions and lar ge neural network training. arXiv pr eprint arXiv:2104.10350 , 2021. Jordan Hof fmann, Sebastian Borgeaud, Arthur Mensch, Elena Buchatskaya, T rev or Cai, Eliza Rutherford, Diego de Las Casas, Lisa Anne Hendricks, Johannes W elbl, Aidan Clark, et al. T raining compute-optimal large language models. arXiv pr eprint arXiv:2203.15556 , 2022. Robert W ilson. Architecture of power mark ets. Econometrica , 70(4):1299–1340, 2002. Carl Shapiro and Hal R. V arian. Information Rules: A Strate gic Guide to the Network Economy . Harv ard Business Press, 1998. Larry Harris. T rading and Exc hanges: Market Micr ostructure for Pr actitioners . Oxford Univ ersity Press, 2003. W illiam W . Hogan. Contract networks for electric po wer transmission. Journal of Re gulatory Economics , 4:211–242, 1992. Ing-Haw Cheng and W ei Xiong. Financialization of commodity markets. Annual Re view of F inancial Economics , 6: 419–441, 2014. Ke T ang and W ei Xiong. Inde x in vestment and the financialization of commodities. F inancial Analysts Journal , 68(6): 54–74, 2012. Kenneth J. Singleton. Inv estor flows and the 2008 boom/bust in oil prices. Management Science , 60(2):300–318, 2014. Suleyman Basak and Anna Pa vlov a. A model of financialization of commodities. The Journal of F inance , 71(4): 1511–1556, 2016. 15 A pr eprint Deborah G. Black. Success and failure of futures contracts: Theory and empirical evidence. Monograph Series in F inance and Economics, Salomon Br others Center , 1986. W illiam L. Silber . Innovation, competition, and ne w contract design in futures markets. The J ournal of Futur es Mark ets , 1(2):123–155, 1981. Jean-Charles Rochet and Jean T irole. Platform competition in two-sided markets. J ournal of the Eur opean Economic Association , 1(4):990–1029, 2003. Jean-Charles Rochet and Jean T irole. T wo-sided markets: A progress report. The RAND J ournal of Economics , 37(3): 645–667, 2006. Mark Armstrong. Competition in two-sided markets. The RAND Journal of Economics , 37(3):668–691, 2006. John C. Hull. Options, futures, and other deri vati ves. 2017. Albert S. Kyle. Continuous auctions and insider trading. Econometrica , 53(6):1315–1335, 1985. Lawrence R. Glosten and Paul R. Milgrom. Bid, ask and transaction prices in a specialist market with heterogeneously informed traders. J ournal of Financial Economics , 14(1):71–100, 1985. Arnoud V . den Boer . Dynamic pricing and learning: Historical origins, current research, and new directions. Surveys in Operations Resear ch and Mana gement Science , 20(1):1–18, 2015. Leland L. Johnson. The theory of hedging and speculation in commodity futures. The Review of Economic Studies , 27 (3):139–151, 1960. Louis H. Ederington. The hedging performance of the ne w futures markets. The J ournal of F inance , 34(1):157–170, 1979. Hal R. V arian. Buying, sharing and renting information goods. The Journal of Industrial Economics , 48(4):473–488, 2000. Robert J. Shiller . The New F inancial Order: Risk in the 21st Century . Princeton Univ ersity Press, 2003. Melanie Cao and Jason W ei. W eather deri vati ves v aluation and mark et price of weather risk. Journal of Futur es Markets , 24(11):1065–1089, 2004. W illiam V ickrey . Counterspeculation, auctions, and competiti ve sealed tenders. The J ournal of F inance , 16(1):8–37, 1961. Roger B. Myerson. Optimal auction design. Mathematics of Operations Resear ch , 6(1):58–73, 1981. Paul Milgrom. Putting auction theory to work: The simultaneous ascending auction. Journal of P olitical Economy , 108 (2):245–272, 2000. Paul Milgrom. Putting Auction Theory to W ork . Cambridge Uni versity Press, 2004. R. Preston McAfee and John McMillan. Analyzing the airwa ves auction. Journal of Economic P erspectives , 10(1): 159–175, 1996. Peter Cramton. The FCC spectrum auctions: An early assessment. Journal of Economics & Management Strate gy , 6 (3):431–495, 1997. 16
Original Paper
Loading high-quality paper...
Comments & Academic Discussion
Loading comments...
Leave a Comment