Simultaneous Estimation of Ballpark Effects and Team Defense Using Total Bases Residuals
Estimating ballpark effects and team defense in baseball is challenging because batted-ball outcomes are influenced by multiple factors, including contact quality, ballpark environment, defensive performance, and random variation. In this study, we p…
Authors: Jhe-Jia Wu, Tian-Li Yan, Ting-Li Chen
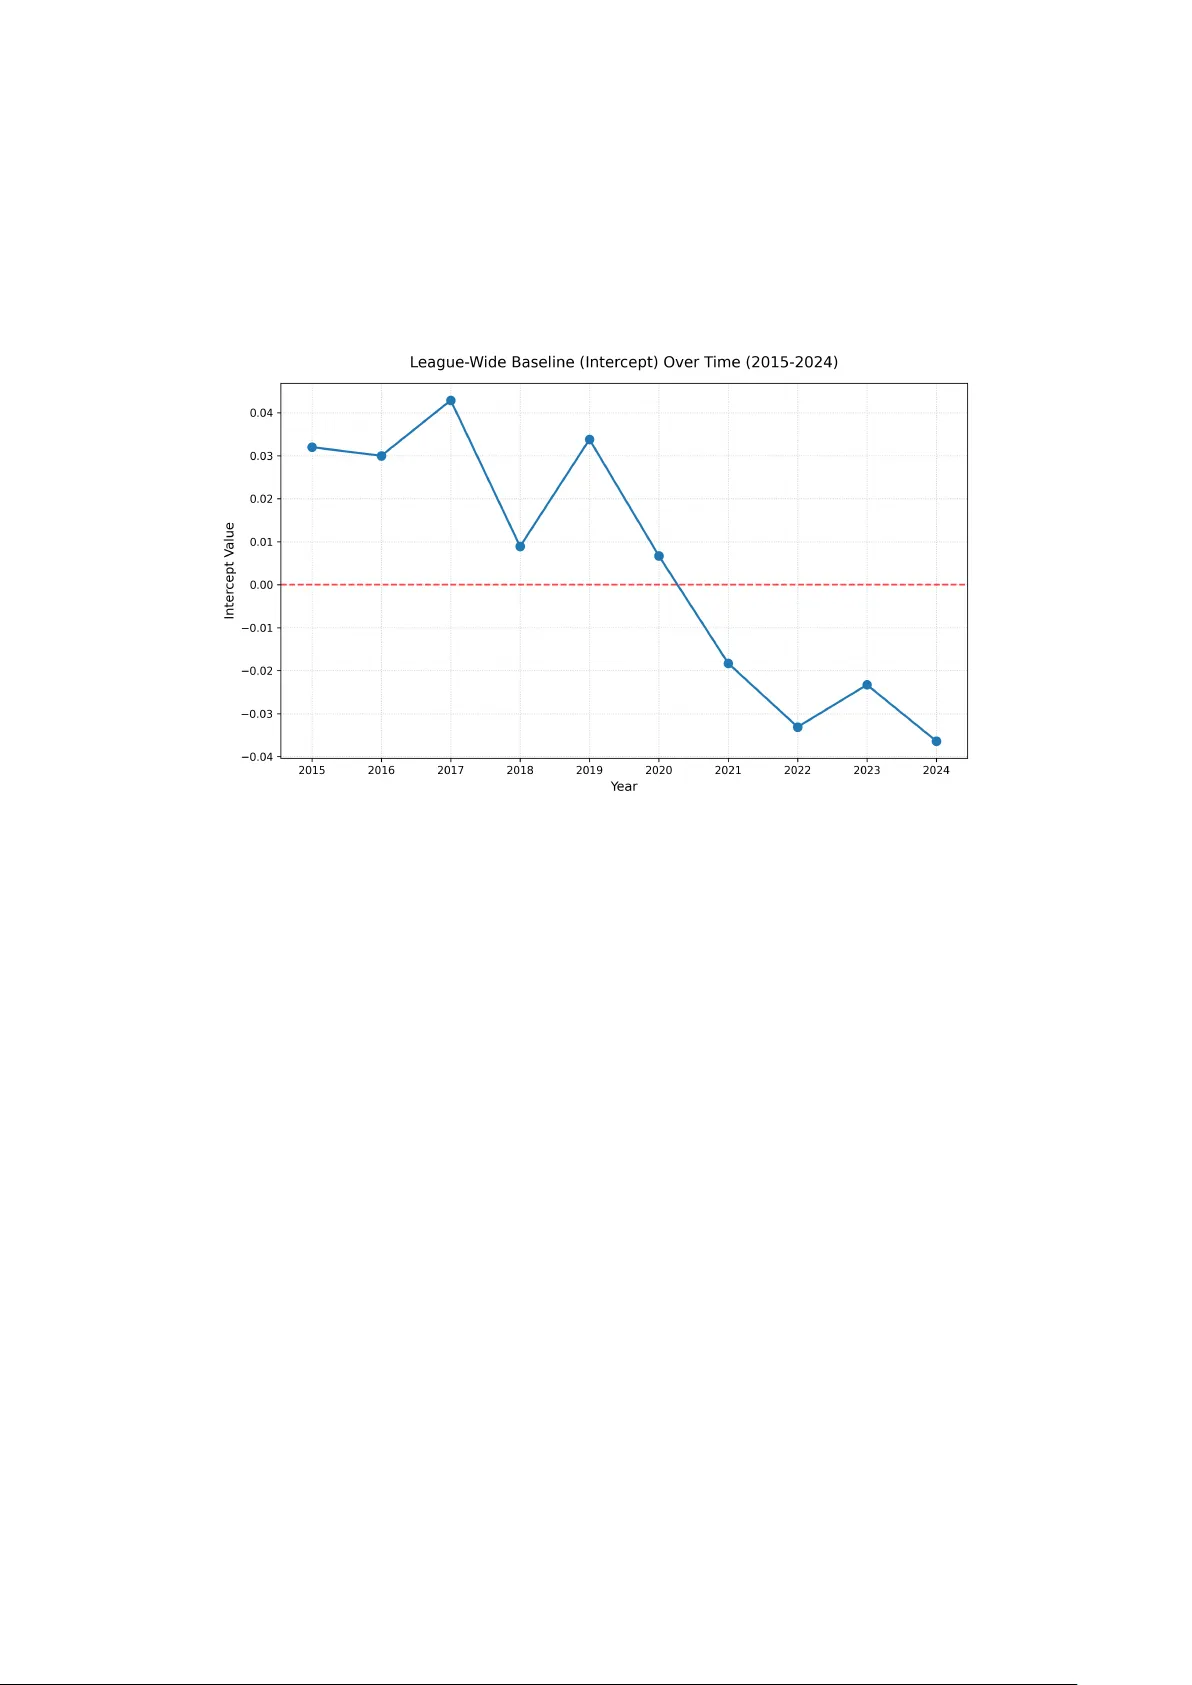
Sim ultaneous Estimation of Ballpark Effects and T eam Defense Using T otal Bases Residuals Jhe-Jia W u † 1 , Tian-Li Y an † 2 , and Ting-Li Chen ∗ 1, 3 1 Data Science Degree Program, National T aiw an Univ ersit y and Academia Sinica, T aip ei, T aiw an 2 Departmen t of Mathematics, Univ ersit y of Houston, Houston, USA 3 Institute of Statistical Science, Academia Sinica, T aip ei, T aiw an Marc h 24, 2026 Abstract Estimating ballpark effects and team defense in baseball is challenging b ecause batted-ball outcomes are influenced b y multiple factors, including contact qualit y , ballpark en vironment, defensive p erformance, and random v ariation. In this study , w e prop ose a simple and interpretable framework based on T otal Bases Residuals (TBR). Using Statcast data from 2015 to 2024, we construct exp ected total bases conditional on exit velocity and launch angle, and define residuals relativ e to this baseline. These residuals allow us to separate the effects of ballpark environmen t and team defense and to estimate them simultaneously within a unified regression framew ork. Our results show that, when our estimates differ from official MLB metrics, the differences can b e explained b y consisten t patterns in home and a wa y p erformance for b oth teams and their opp onen ts, pro viding empirical supp ort for our approac h. Similar patterns are also observ ed in comparisons with existing defensiv e metrics. The results also suggest c hanges in league-wide outcomes and are broadly consistent with dev elopments in the game, including the increased use of data-driv en positioning, the restriction on defensiv e shifts, and p ossible changes in the physical prop erties of the baseball. W e further introduce a standardized index that facilitates comparison across teams, ballparks, and seasons by expressing effects in units of standard deviation. 1 1 In tro duction Ev aluating offensive p erformance in baseball requires separating a hitter’s underlying abilit y from external influences. One imp ortan t source of these influences is the ballpark † These authors con tributed equally to this work. 1 Co de is a v ailable at: https://github.com/qqaazz800624/sports- science.git 1 en vironmen t. Ma jor League ballparks differ in dimensions, altitude, and atmospheric conditions, and these differences can affect the outcomes of batted balls in systematic w a ys. As a result, ra w offensiv e statistics ma y reflect not only the qualit y of contact but also the c haracteristics of the ballpark in whic h the ball is hit. F or this reason, estimating ballpark effects, commonly referred to as park effects, has long b een an imp ortan t topic in baseball analytics [1, 7]. Early approaches to park effect estimation relied on the home–r o ad r atio estimator , p opularized by sab ermetric pioneers such as Bill James. Although simple and in tuitiv e, this metho d dep ends on strong assumptions, including balanced schedules and similar team quality across ballparks. Ac hary a et al. (2008) sho wed that violations of these assumptions lead to substantial bias, whic h they termed “inflationary bias,” arising from the mathematical dep endence b et ween the numerator and denominator of the ratio [1]. In addition, estimates based on a single season of data ( N = 81 home games) tend to exhibit high v ariability and limited stability across years [10]. T o address these limitations, later work adopted regression-based and p ersonnel- adjusted approac hes. In particular, Achary a et al. (2008) prop osed an ANO V A-w eigh ted fixed-effects mo del that treats run scoring as the com bined result of batting strength, pitc hing quality , and park effects, and estimates these comp onen ts simultaneously [1]. More recent studies further adjust for pla yer comp osition and match up structure, show- ing that without adequate control for roster heterogeneity , regression estimates of park effects can still reflect team-sp ecific characteristics rather than the ballpark itself [9]. Ev en with these adv ances, estimates of park effects remain sensitive to confounding from other factors that affect batted ball outcomes, including defensive p erformance and random v ariation. These outcomes reflect multiple comp onen ts. First, the physical qualit y of contact pla ys a central role. Batted balls with similar exit velocity (EV) and launc h angle (LA) tend to pro duce similar outcomes on av erage. Second, the ballpark en vironmen t can systematically influence the tra jectory and landing location of the ball. Third, the defensive p erformance of the fielding team affects whether a batted ball is con v erted into an out or results in a hit. Finally , ev en after accounting for these factors, individual outcomes still contain substan tial random v ariation. Measuring defensive p erformance in baseball is itself a difficult problem. T raditional statistics such as errors or fielding p ercen tage capture only a small part of defensiv e abil- it y and largely ignore the range of fielders. Mo dern defensive metrics attempt to address this limitation using more detailed mo dels of fielding opp ortunities or play er trac king data. Examples include zone-based measures such as Ultimate Zone Rating (UZR) [6] and Defensiv e Runs Sav ed (DRS) [3], as w ell as tracking-based statistics suc h as Outs Ab o ve Av erage (OAA) [8]. Another widely used metric is Defensiv e Runs Ab o ve Av erage (Def ) [4], whic h aggregates fielding contributions and p ositional adjustments to summa- rize a pla y er’s ov erall defensiv e v alue. While these approac hes pro vide useful information ab out defensiv e p erformance, they often rely on complex mo deling framew orks or de- tailed tracking systems and are typically dev elop ed indep enden tly from the estimation of ballpark effects. These c hallenges reflect a more fundamen tal statistical issue. Both defensive ability and ballpark effects are defined through their influence on observ ed batted-ball outcomes, y et those outcomes are themselv es the result of m ultiple interacting factors. As discussed ab o ve, the outcome of a batted ball reflects the combined effects of con tact quality , ball- park environmen t, defensiv e p erformance, and random v ariation. Without first separating these comp onen ts, it is difficult to attribute observe d differences in outcomes uniquely to 2 the ballpark or to the fielding team. In this study , w e prop ose a simple framework motiv ated by the view that batted-ball outcomes reflect multiple comp onen ts, and w e use this p ersp ectiv e to estimate ballpark effects and team defense. Using Statcast measurements of EV and LA, w e construct an exp ected baseline for batted-ball outcomes with similar contact qualit y . Residuals are then defined relative to this baseline and used to estimate ballpark effects and team defense sim ultaneously . Because the model is fitted across a large n um b er of observ ations, random v ariation av erages out in the regression framew ork. This provides a simple and in terpretable w ay to separate these comp onen ts and reco v er ballpark and defensiv e effects from batted-ball outcomes. The remainder of this pap er is organized as follows. Section 2 describ es the construc- tion of outcome residuals and the sim ultaneous estimation mo del. Section 3 presen ts the empirical results, including the stabilit y of estimated park effects ov er time and a comparison of team-level defensive estimates with official metrics. Section 4 concludes with a discussion of the findings and directions for future work. 2 Metho dology 2.1 Outcome Residuals Conditional on Exit V elocity and Launc h Angle As discussed in the introduction, the outcome of a batted ball reflects m ultiple com- p onen ts, including con tact quality , ballpark environmen t, defensive p erformance, and random v ariation. Our goal is to separate these comp onen ts and recov er the effects of ballpark effects and team defense from batted-ball outcomes. T o ac hiev e this, we con trol for con tact qualit y using exit v elo cit y (EV) and launc h angle (LA). Batted balls with similar EV and LA tend to pro duce similar outcomes on a v erage, so grouping observ ations with similar contact c haracteristics provides a natural w a y to remo ve the primary effect of con tact qualit y . The remaining v ariation can then b e used to study the combined influence of ballpark and defensive factors. W e implement this idea b y partitioning the EV–LA space in to a fine grid and con- structing an empirical distribution of outcomes within eac h grid cell. In our implemen- tation, exit v elo cit y is discretized in to bins of width 3 mph o ver the range 0 to 120 mph, and launc h angle is discretized in to bins of width 3 degrees ov er the range -90 to 90 degrees. This results in a grid that balances resolution and sample size within each cell. F or each cell, the exp ected outcome is defined as the a v erage result across all batted balls with similar EV and LA, aggregated ov er m ultiple seasons. This empirical approach a v oids reliance on parametric assumptions and reflects league-wide a v erage b eha vior for comparable contact profiles. In this study , w e define the outcome of a batted ball using total bases rather than an out-based measure. Out-based approaches, suc h as those underlying OAA, fo cus on the probabilit y that a batted ball is conv erted in to an out. While suc h measures capture defensiv e success in terms of outs con verted, they do not distinguish b et ween different offensiv e outcomes once a ball is not con v erted into an out. In con trast, total bases capture the magnitude of offensiv e outcomes and pro vide a more informativ e measure of ho w batted balls contribute to run pro duction. Because it is well known that measures based on extra-base hits are more strongly asso ciated with run pro duction than those 3 based only on hit frequency , total bases are more appropriate when the goal is to assess ho w ballpark en vironment and defensiv e p erformance affect run pro duction. W e therefore define the outcome residual at the level of individual batted balls. Let T B i denote the total bases recorded for batted ball i , and let ( E V i , LA i ) denote the corresp onding exit v elo cit y and launc h angle. F or each ( E V , LA ) grid cell g , we define the exp ected total bases as the empirical mean µ g = E ( T B | E V , LA ∈ g ) , estimated b y a veraging T B i o v er all batted balls whose ph ysical c haracteristics fall within cell g . The total bases residual (TBR) for batted ball i is then defined as R i = T B i − µ g ( i ) , (1) where g ( i ) denotes the grid cell containing ( E V i , LA i ). By construction, R i measures whether batted ball i resulted in more or few er bases than w ould b e expected giv en its con tact qualit y . P ositive v alues of R i corresp ond to out- comes better than the league-wide a verage for comparable con tact profiles, while negativ e v alues indicate w orse-than-av erage outcomes. Conditional on exit v elo cit y and launc h an- gle, the exp ected outcome µ g do es not dep end on the identities of the batter or pitcher, as their primary influence is expressed through contact qualit y . As a result, v ariation in R i primarily reflects the combined effects of ballpark environmen t and team-level defen- siv e p erformance, with remaining v ariation attributable to random factors not explicitly mo deled. The defensive effects captured here are restricted to batted-ball ev en ts and do not include asp ects such as catcher framing, blo c king, or control of the running game. 2.2 Sim ultaneous Estimation Mo del Our ob jectiv e is to estimate ballpark effects and team-lev el defensive effects from the outcome residuals constructed in Section 2.1. W e b egin b y describing the mo del at the lev el of individual batted balls. Let R i denote the outcome residual for batted ball i , as defined in (1). Let p ( i ) ∈ { 1 , . . . , 30 } denote the ballpark in whic h batted ball i was fielded, and let d ( i ) ∈ { 1 , . . . , 30 } denote the defensiv e team on the field for that play . W e assume the additiv e structure R i = β 0 + β park p ( i ) − β def d ( i ) + ε i , (2) where β park p captures the en vironmental effect of ballpark p and β def d captures the team- lev el defensive effect of defensive team d . This additive specification follo ws from the decomp osition of batted-ball outcomes, where the residual R i captures the combined effects of ballpark en vironment and team defense. Mo deling these effects additively provides a simple and in terpretable framework that allows them to b e estimated simultaneously across all observ ations. In the construc- tion of the residual R i defined in Section 2.1, contact quality has b een con trolled for, so the mo del fo cuses on systematic v ariation attributable to ballpark and team defense. All effects are mo deled using categorical indicators. T o ensure identifiabilit y , one ballpark effect and one defensiv e team effect are set to zero and treated as reference categories. Throughout the analysis, w e tak e the A tlanta Bra v es as the reference defensive team and T ruist P ark, the home ballpark of the A tlan ta Bra v es, as the reference ballpark. Under this parameterization, the mo del includes an in tercept, 29 ballpark effects, and 29 4 defensiv e team effects, and estimated coefficients are in terpreted relative to the c hosen reference categories. F or estimation, we aggregate observ ations with iden tical cov ariate v alues to reduce the effective sample size. At the batted-ball lev el, each season con tains on the order of 10 5 observ ations. Under model (2), the cov ariates depend only on the pair ( p ( i ) , d ( i )), so man y observ ations share the same design ro w. Aggregating within eac h ( p, d ) cell reduces the regression to at most 30 × 30 = 900 cell-lev el observ ations p er season, and in practice substan tially few er b ecause not every defensive team app ears in ev ery ballpark within a season. This aggregation yields a muc h more efficient estimation pro cedure. Sp ecifically , for each cell ( p, d ), let n pd denote the num b er of batted balls (defensiv e opp ortunities), and define the a verage TBR y pd = 1 n pd X i : p ( i )= p, d ( i )= d R i . (3) W e then estimate y pd = β 0 + β park p − β def d + ε pd , (4) using weigh ted least squares with w eight n pd . This aggregation strategy do es not alter the estimated co efficien ts. Because all ob- serv ations within a given ( p, d ) cell share the same design ro w, minimizing the batted- ball-lev el least squares ob jective is equiv alen t to minimizing the w eighted sum of squared deviations of the cell means (see, e.g., [5, Sec. 9.2]). Consequently , the w eighted regression in (4) yields coefficient estimates that are n umerically identical to ordinary least squares applied directly to the individual-level mo del in (2) [2, Sec. 3.1.3]. 2.3 Presen tation and In terpretation of Estimated Effects 2.3.1 Cen tering Effects at the League Average The mo del in Section 2.2 is estimated under a reference-based parameterization, in whic h one ballpark effect and one defensive team effect are set to zero for identifiabilit y . Let ˆ β park p and ˆ β def d denote the estimated ballpark and defensive effects obtained under this parameterization for a given season. F or in terpretation, we re-cen ter the estimated effects so that they are expressed rela- tiv e to the league a verage . Sp ecifically , let ¯ β park = 1 30 30 X p =1 ˆ β park p , ¯ β def = 1 30 30 X d =1 ˆ β def d . (5) W e define the cen tered effects as ˜ β park p = ˆ β park p − ¯ β park , ˜ β def d = ˆ β def d − ¯ β def . (6) T o preserv e the fitted v alues, the intercept is adjusted accordingly as ˜ β 0 = ˆ β 0 + ¯ β park − ¯ β def . (7) This transformation represen ts a linear re-expression of the same fitted mo del. Under the centered parameterization, ˜ β park p > 0 indicates a ballpark effect ab o v e the league a v erage for that season, while ˜ β park p < 0 indicates a b elo w-av erage effect. An analogous in terpretation applies to the cen tered defensive effects ˜ β def d . 5 2.3.2 A Standardized Index for In terpreting Effect Magnitudes After cen tering the estimated effects at the league a verage, the sign of an effect indicates whether it is ab o ve or below a verage. Ho wev er, the magnitude of the effect is still difficult to in terpret on its original scale. This issue also app ears in commonly used 100-based baseball statistics suc h as SLG+ or ERA+, whic h are defined as ratios to the league a v erage multiplied by 100. While suc h measures clearly show whether p erformance is ab o ve or b elo w av erage, they provide limited information ab out how extreme a giv en v alue is within the ov erall distribution. T o provide a clearer sense of effect magnitude, we use a standardized scale based on the z-score. F or a given set of estimated effects ˆ β within a season, we define z = ˆ β − ¯ β s β , (8) where ¯ β and s β denote the mean and standard deviation of the estimated effects, resp ec- tiv ely . A z-score of 1 indicates an effect one standard deviation ab o ve the league a verage, while larger v alues indicate increasingly rare outcomes within the distribution. T able 1 summarizes the upp er-tail probabilities asso ciated with common z-score v alues. z-score 1 2 3 4 5 Pr( Z > z ) 15.87% 2.28% 0.135% 0.0032% 0.00003% T able 1: Upp er-tail probabilities for standard normal z-scores. F or consistency with existing baseball metrics, we map the z-score to a 100-based index defined as Index = 100 + 20 × z . (9) Under this scale, a v alue of 100 corresp onds to the league a v erage, 120 corresp onds to one standard deviation ab o ve a verage, and 140 corresponds to t wo standard deviations ab o ve a v erage. This transformation preserv es the relativ e ordering of the estimated effects while making their magnitude easier to in terpret. This standardized representation makes it easier to compare effect magnitudes across teams, ballparks, and seasons. 3 Results and Discussion 3.1 Estimated Ballpark Effects W e estimate ballpark effects separately for eac h season using Statcast data from 2015 to 2024. W e first presen t the estimated ballpark effects obtained from our mo del. T able 2 rep orts the centered estimates ˜ β park p as defined in equation (6). T o facilitate comparison, T able 3 rep orts the corresp onding standardized indices defined in equation (9), which place b oth our estimates and the official MLB metrics on a comparable scale. As a basic c hec k, we examine whether the estimated effects align with widely rec- ognized hitter-friendly and pitcher-friendly ballparks. As exp ected, hitter-friendly parks suc h as Co ors Field (COL) and Great American Ball Park (CIN) are estimated to hav e relativ ely large p ositiv e effects. On the other hand, parks that are commonly regarded as pitcher-friendly , such as Oracle Park (SFG) and T-Mobile Park (SEA), tend to ha v e lo w er estimated v alues. 6 T eam 2015 2016 2017 2018 2019 2020 2021 2022 2023 2024 A TL -0.0450 -0.0400 -0.0026 -0.0117 -0.0099 -0.0045 -0.0032 -0.0223 0.0015 -0.0183 AZ 0.0056 0.0285 0.0110 0.0017 -0.0024 -0.0013 0.0461 0.0008 0.0342 0.0060 BAL 0.0254 -0.0095 -0.0120 0.0075 0.0194 0.0105 0.0139 -0.0246 -0.0313 -0.0118 BOS 0.0256 0.0536 -0.0048 -0.0200 -0.0159 0.0869 0.0075 0.0257 0.0248 0.0226 CHC -0.0004 -0.0133 0.0062 0.0152 -0.0024 -0.0361 0.0244 0.0178 0.0187 -0.0241 CIN 0.0292 0.0400 0.0477 0.0652 0.0744 0.0517 0.0538 0.0636 0.0564 0.0595 CLE 0.0084 0.0235 0.0015 -0.0247 0.0281 0.0216 0.0188 0.0099 -0.0153 0.0239 COL 0.0655 0.0766 0.0926 0.0924 0.0853 0.0708 0.0603 0.0640 0.0446 0.0554 CWS 0.0119 0.0229 0.0233 0.0072 -0.0189 0.0238 0.0342 -0.0060 -0.0060 -0.0143 DET -0.0281 -0.0387 -0.0422 -0.0447 -0.0355 -0.0224 -0.0338 -0.0269 -0.0150 -0.0053 HOU 0.0716 0.0103 0.0230 0.0307 0.0667 -0.0127 0.0103 0.0175 0.0003 0.0181 K C -0.0038 -0.0301 -0.0251 -0.0426 -0.0344 -0.0179 -0.0182 -0.0269 -0.0312 -0.0103 LAA -0.0193 -0.0259 -0.0387 -0.0264 0.0106 -0.0079 -0.0108 0.0063 0.0022 0.0143 LAD -0.0086 -0.0157 -0.0087 0.0078 0.0297 0.0076 0.0142 0.0381 -0.0008 0.0071 MIA -0.0287 -0.0272 -0.0074 -0.0419 -0.0125 -0.0116 -0.0144 -0.0215 -0.0110 -0.0045 MIL 0.0157 0.0243 0.0330 0.0136 0.0055 -0.0053 0.0065 0.0048 0.0094 0.0318 MIN 0.0019 0.0041 0.0177 -0.0076 -0.0258 -0.0099 -0.0563 -0.0331 0.0097 0.0195 NYM -0.0157 -0.0143 -0.0121 -0.0144 0.0058 0.0331 -0.0180 -0.0238 -0.0177 -0.0064 NYY 0.0167 0.0180 -0.0015 0.0117 -0.0061 0.0184 -0.0217 -0.0063 -0.0340 -0.0215 O AK -0.0070 -0.0493 -0.0065 -0.0465 -0.0200 -0.0654 -0.0400 -0.0149 -0.0141 -0.0341 PHI -0.0084 -0.0013 0.0070 0.0326 0.0162 -0.0164 0.0113 0.0002 0.0153 0.0277 PIT -0.0392 0.0293 -0.0024 -0.0042 -0.0004 -0.0470 -0.0012 -0.0132 -0.0328 -0.0243 SD 0.0138 0.0082 0.0044 0.0365 -0.0320 -0.0167 -0.0147 -0.0274 -0.0091 0.0015 SEA -0.0278 -0.0129 -0.0183 -0.0159 -0.0223 -0.0222 -0.0305 0.0074 0.0015 -0.0445 SF -0.0254 -0.0023 -0.0604 0.0029 -0.0578 0.0114 -0.0235 -0.0158 -0.0378 -0.0256 STL -0.0015 -0.0387 -0.0408 -0.0479 -0.0539 -0.0363 -0.0379 -0.0196 -0.0378 -0.0195 TB -0.0023 -0.0101 0.0035 -0.0064 -0.0247 0.0406 0.0227 0.0190 0.0393 -0.0035 TEX 0.0025 0.0239 0.0092 0.0295 0.0106 -0.0140 -0.0105 0.0115 0.0385 -0.0121 TOR -0.0010 0.0006 -0.0139 -0.0134 0.0034 -0.0009 0.0175 0.0161 0.0041 0.0068 WSH -0.0316 -0.0344 0.0173 0.0141 0.0191 -0.0280 -0.0067 -0.0206 -0.0069 -0.0138 T able 2: Estimated ballpark effects ( ˜ β park p ), 2015–2024 7 T eam MLB official park factors (standardized) Our estimated ballpark effects (standardized) 2015 2016 2017 2018 2019 2020 2021 2022 2023 2024 2015 2016 2017 2018 2019 2020 2021 2022 2023 2024 A TL 88 96 105 92 117 104 101 95 114 96 66 73 98 93 94 97 98 82 101 85 AZ 120 137 123 100 97 109 118 91 96 128 104 119 108 101 99 99 133 101 127 105 BAL 116 104 114 108 121 71 135 95 82 110 119 94 92 105 112 106 110 80 75 90 BOS 128 134 100 112 113 138 131 136 137 110 119 136 97 87 90 153 105 121 120 119 CHC 100 78 114 108 97 80 114 95 105 59 100 91 104 110 99 78 118 114 115 80 CIN 108 111 109 120 97 124 144 132 110 124 122 127 134 141 145 132 139 151 145 149 CLE 116 119 81 112 89 100 101 82 73 110 106 116 101 85 117 113 114 108 88 120 COL 168 156 156 159 172 133 135 163 161 147 150 152 165 158 151 143 144 151 135 146 CWS 88 96 105 92 97 109 106 104 96 96 109 115 116 104 89 115 125 95 95 88 DET 100 111 128 88 105 109 85 86 96 86 79 74 70 72 79 86 76 79 88 96 HOU 92 74 91 80 109 61 101 95 100 114 154 107 116 119 140 92 107 114 100 115 KC 96 96 86 104 101 109 110 122 128 110 97 80 82 73 79 89 87 79 75 91 LAA 76 89 77 88 101 138 106 100 100 105 85 82 73 83 106 95 92 105 102 112 LAD 80 78 77 88 89 109 97 104 96 100 93 89 94 105 118 105 110 130 99 106 MIA 84 78 91 69 85 90 76 100 105 119 78 82 95 74 92 93 90 83 91 96 MIL 112 100 105 96 97 109 85 91 91 82 112 116 123 109 103 97 105 104 107 126 MIN 108 115 119 108 101 71 106 100 100 124 101 103 112 95 84 94 59 74 108 116 NYM 72 85 81 65 89 104 85 82 87 96 88 90 91 91 103 120 87 81 86 95 NYY 104 96 95 116 89 104 89 91 96 114 113 112 99 107 96 111 84 95 73 82 OAK 84 70 114 80 85 71 76 86 82 91 95 67 95 71 88 60 71 88 89 72 PHI 112 89 109 92 113 114 106 113 96 100 94 99 105 120 110 90 108 100 112 123 PIT 88 115 91 100 109 90 110 104 91 110 70 120 98 97 100 71 99 89 74 80 SD 96 93 72 100 81 95 89 63 82 96 110 106 103 123 81 90 89 78 93 101 SEA 88 96 86 84 85 76 68 68 68 49 79 91 87 90 87 86 78 106 101 63 SF 76 100 68 92 65 114 93 100 73 82 81 98 57 102 65 107 83 87 70 79 STL 92 93 91 88 81 100 72 91 114 91 99 74 71 70 68 78 73 84 70 84 TB 80 81 77 80 73 76 76 82 91 82 98 93 102 96 85 125 116 115 131 97 TEX 128 122 132 143 128 100 89 109 128 77 102 116 106 118 106 91 92 109 131 90 TOR 96 104 95 108 101 104 80 113 87 100 99 100 90 92 102 99 113 113 103 106 WSH 100 85 109 124 121 85 118 109 114 96 76 77 112 109 111 83 95 84 95 89 T able 3: Comparison of standardized MLB official park factors and our estimated ballpark effects (2015–2024) Because ballpark effects are primarily determined by ph ysical c haracteristics of the stadium, they are exp ected to remain relatively stable ov er time. W e therefore examine the temp oral v ariabilit y of the estimated effects. T able 4 rep orts the standard deviation of the estimated effects for eac h team ov er the ten seasons. On a verage, our estimates exhibit sligh tly low er v ariability than the corresp onding MLB official park factors (12.51 vs 13.08). W e also observe that the largest discrepancies tend to o ccur in ballparks such as F enw ay P ark (BOS), Y ankee Stadium (NYY), and PNC Park (PIT), which are known to exhibit strong asymmetries affecting left- and right-handed batters. Because our mo del do es not explicitly incorporate the direction of batted balls, it ma y b e less able to capture suc h asymmetric effects. Similar patterns are observed for several other teams with relativ ely large differences. T o further examine the differences b et ween our estimates and the official MLB park factors, we fo cus on sev eral cases with the largest discrepancies, including Comerica Park (DET, 2017), T ropicana Field (TB, 2020–2023), Minute Maid P ark (HOU, 2015), and T arget Field (MIN, 2021). F or each case, w e compare offensiv e p erformance at home and a wa y using the T otal Bases Residual (TBR) framework. T able 5 reports the a verage v alues of T eam TBR and Opp onen t TBR in home and aw ay games; the corresp onding v alues for all ballparks are pro vided in App endix C. W e b egin with Comerica Park (DET, 2017), which exhibits the largest discrepancy b et ween the tw o measures. F or visiting teams, the av erage TBR is 0.003 at Comerica Park and 0.064 in aw ay games, indicating low er offensiv e pro duction at this v en ue. Detroit, b y con trast, records a verage TBR v alues of 0.002 at home and -0.004 on the road, so the home–a w ay difference for the team is small and go es in the opp osite direction. Because the opp onen t pattern is m uc h stronger, the ov erall evidence is still more consistent with a pitcher-friendly environmen t, supp orting our estimate b elo w 100 (70) rather than the higher v alue implied by the official MLB metric (128). 8 T eam MLB Ours T eam MLB Ours A TL 9.27 11.85 MIL 10.06 9.30 AZ 15.78 12.48 MIN 14.44 17.82 BAL 18.78 14.35 NYM 11.12 11.15 BOS 13.91 20.49 NYY 9.91 13.92 CHC 17.85 14.17 O AK 12.44 12.76 CIN 13.51 9.56 PHI 9.47 10.76 CLE 16.24 12.15 PIT 10.01 15.93 COL 13.03 8.28 SD 11.87 13.85 CWS 6.72 12.81 SEA 13.80 12.02 DET 14.05 7.97 SF 16.12 16.15 HOU 16.16 18.32 STL 11.05 9.61 K C 12.57 7.61 TB 5.03 15.03 LAA 17.75 12.57 TEX 21.33 13.08 LAD 11.37 12.37 TOR 9.82 7.52 MIA 14.99 7.69 WSH 14.05 13.85 Av erage 13.08 12.51 T able 4: T en-Y ear Standard Deviation of P ark Effect Comparison: MLB vs Ours T eam (Season) Opp onen t TBR T eam TBR Park Effect Home Aw ay Home Awa y MLB Ours DET (2017) 0.003 0.064 0.002 -0.004 128 70 HOU (2015) 0.035 0.016 0.116 0.002 92 154 MIN (2021) -0.056 0.013 -0.072 -0.051 106 59 TB (2020) 0.028 0.006 0.058 0.025 76 125 TB (2021) -0.048 -0.044 0.026 0.009 76 116 TB (2022) -0.042 -0.040 -0.011 -0.024 82 115 TB (2023) -0.021 -0.045 0.026 0.009 91 131 T able 5: Home and a wa y TBR for selected ballpark case studies, with corresp onding MLB park factors and our estimates A con trasting example is Min ute Maid P ark (HOU, 2015). In this case, Houston records an a verage TBR of 0.116 at home compared to 0.002 on the road, indicating sub- stan tially higher offensive pro duction at its home ballpark. Visiting teams show a similar pattern, with a verage TBR v alues of 0.035 at Min ute Maid P ark and 0.016 in a wa y games. This consisten t increase in offensiv e output for both Houston and its opponents suggests a hitter-friendly en vironment, supp orting our estimate ab o v e 100 (154) rather than the lo w er v alue implied by the official MLB metric (92). Similar patterns are observed in the remaining cases, where the direction of the home–a wa y differences for both the focal team and its opp onen ts is generally consisten t with whether the estimated park effect is ab o ve or b elo w the league av erage, providing additional supp ort for the prop osed metho d. T aken together, these examples illustrate a systematic difference b et ween the tw o approac hes. The MLB park factors are based directly on observed offensive outcomes, whic h ma y reflect not only the ballpark en vironmen t but also differences in team defense and contact quality . In con trast, our mo del-based estimates explicitly con trol for these factors, allo wing the en vironmental comp onen t to b e more clearly isolated. This distinc- tion provides a p ossible explanation for why our estimates app ear more consisten t with 9 the observed home–a wa y patterns in these cases. 3.2 Estimation of T eam Defensiv e Effects In the previous subsection, we presented the estimated ballpark effects obtained from the mo del in (2). As part of the same estimation, the mo del also yields team-lev el defensiv e effects, which w e no w presen t. T able 6 rep orts the cen tered estimates ˜ β def d as defined in equation (6). Unlike ballpark effects, team defensiv e effects are not exp ected to exhibit strong y ear-to-y ear stability due to roster c hanges. Therefore, w e do not examine stabilit y and pro ceed directly to compare our estimates with existing defensiv e metrics. Sp ecifically , we compare our estimates with Defensiv e Runs Ab o ve Average (Def ) and Outs Abov e Av erage (O AA), whic h represen t t w o widely used approaches to quan tifying defensiv e p erformance. T eam 2015 2016 2017 2018 2019 2020 2021 2022 2023 2024 A TL -0.0272 -0.0175 -0.0122 0.0199 0.0156 0.0013 0.0225 -0.0055 0.0078 -0.0194 AZ -0.0008 0.0066 0.0174 0.0417 0.0343 -0.0082 -0.0042 0.0166 0.0205 -0.0137 BAL -0.0098 -0.0212 -0.0088 -0.0295 -0.0051 0.0196 -0.0002 0.0003 0.0156 0.0063 BOS 0.0009 0.0457 0.0136 -0.0113 -0.0176 0.0262 -0.0244 0.0139 -0.0171 0.0141 CHC -0.0015 0.0329 0.0216 0.0377 0.0207 -0.0078 -0.0084 -0.0012 0.0232 0.0051 CIN -0.0055 -0.0039 -0.0311 0.0145 0.0050 -0.0144 -0.0212 -0.0181 -0.0084 0.0070 CLE 0.0206 0.0095 0.0166 -0.0424 0.0133 0.0187 0.0216 0.0413 0.0228 0.0117 COL -0.0206 0.0134 0.0093 0.0140 0.0230 0.0256 0.0021 0.0086 -0.0077 0.0007 CWS -0.0263 0.0037 0.0096 0.0117 -0.0123 0.0445 0.0047 -0.0172 -0.0174 -0.0242 DET -0.0366 -0.0242 -0.0156 -0.0302 -0.0292 -0.0056 0.0060 0.0219 0.0159 -0.0021 HOU 0.0314 -0.0254 -0.0178 0.0031 0.0113 -0.0138 0.0150 0.0309 0.0162 -0.0030 K C 0.0211 0.0114 -0.0099 -0.0190 0.0032 0.0149 0.0311 -0.0097 -0.0255 0.0171 LAA 0.0065 -0.0012 0.0108 -0.0061 -0.0128 -0.0133 -0.0290 0.0132 -0.0115 -0.0011 LAD -0.0125 0.0010 -0.0076 -0.0140 0.0136 0.0337 0.0184 0.0216 0.0079 0.0088 MIA 0.0140 -0.0016 0.0107 -0.0131 0.0003 -0.0151 -0.0051 -0.0398 -0.0239 -0.0088 MIL -0.0130 -0.0041 0.0090 0.0213 -0.0067 -0.0375 0.0109 -0.0131 0.0171 0.0386 MIN 0.0321 -0.0006 0.0206 -0.0143 0.0010 0.0249 -0.0247 -0.0142 -0.0093 -0.0017 NYM -0.0190 0.0011 -0.0263 -0.0222 -0.0199 -0.0100 -0.0001 -0.0153 -0.0033 0.0095 NYY -0.0074 -0.0129 0.0204 -0.0049 -0.0293 0.0000 -0.0202 -0.0014 -0.0102 -0.0118 O AK 0.0237 -0.0064 0.0135 0.0187 0.0230 -0.0200 0.0010 -0.0072 -0.0276 -0.0253 PHI -0.0189 -0.0211 -0.0070 -0.0154 0.0075 -0.0672 -0.0376 -0.0207 -0.0026 -0.0003 PIT 0.0096 -0.0248 -0.0051 0.0094 -0.0396 -0.0219 -0.0168 -0.0002 -0.0053 -0.0095 SD -0.0253 0.0131 -0.0208 0.0115 -0.0146 0.0371 0.0058 -0.0049 -0.0048 0.0030 SEA -0.0135 -0.0054 0.0080 0.0085 -0.0163 -0.0246 -0.0079 0.0048 0.0060 -0.0104 SF 0.0025 0.0190 -0.0098 0.0273 0.0104 0.0201 0.0111 -0.0302 -0.0251 -0.0149 STL 0.0104 -0.0197 -0.0198 0.0044 0.0016 0.0302 0.0311 0.0105 -0.0237 -0.0077 TB 0.0415 0.0081 0.0111 0.0159 -0.0135 0.0147 0.0354 0.0170 0.0266 0.0140 TEX 0.0124 0.0239 0.0164 0.0013 -0.0009 -0.0180 -0.0097 0.0025 0.0186 0.0073 TOR 0.0161 0.0266 -0.0287 -0.0441 0.0022 -0.0102 0.0017 0.0227 0.0102 0.0154 WSH -0.0050 -0.0261 0.0119 0.0056 0.0317 -0.0239 -0.0089 -0.0273 0.0152 -0.0045 T able 6: Defensive Bases Sav ed (DBS) ( ˜ β def d ), 2015–2024 W e first compare our estimates with Defensive Runs Ab o v e Average (Def ). T able 7 rep orts the corresp onding standardized indices defined in equation (9), which place Def and our estimates on a comparable scale. T o further inv estigate their differences, w e iden tify eight cases with the largest discrepancies b et ween the t wo measures and rep ort them in T able 10. F or ease of interpretation, we group the cases into t w o categories. The 10 T eam Defensive Runs Abov e Average (Def ) (standardized) Our estimated team defense (standardized) 2015 2016 2017 2018 2019 2020 2021 2022 2023 2024 2015 2016 2017 2018 2019 2020 2021 2022 2023 2024 A TL 89 95 84 123 107 122 102 103 110 101 72 81 85 119 117 101 125 94 109 71 AZ 99 80 97 139 130 120 86 127 115 117 99 107 122 139 138 93 95 118 125 80 BAL 108 104 83 66 53 67 56 112 100 89 90 77 89 72 94 116 100 100 119 109 BOS 87 104 126 130 121 100 90 93 58 83 101 150 117 89 80 121 73 115 79 121 CHC 125 148 105 113 113 127 104 84 109 111 98 136 127 135 123 94 91 99 128 108 CIN 82 74 106 91 121 91 73 80 64 84 94 96 61 114 106 88 77 81 90 110 CLE 112 121 137 102 141 114 115 119 106 127 121 111 121 60 115 115 124 144 127 117 COL 63 120 103 102 100 96 108 89 100 97 79 115 112 113 126 121 102 109 91 101 CWS 94 88 107 79 74 129 72 91 80 55 73 104 112 111 86 136 105 81 79 64 DET 83 77 73 79 78 99 77 100 102 126 62 73 81 72 67 96 107 124 119 97 HOU 95 134 110 139 125 103 127 130 98 102 132 72 78 103 113 89 116 133 119 96 KC 128 112 100 84 92 117 109 79 120 129 122 113 88 82 104 112 134 90 69 125 LAA 117 100 134 112 96 63 82 86 75 71 107 99 113 94 86 89 68 114 86 98 LAD 122 116 112 111 117 109 98 110 101 91 87 101 91 87 115 127 120 123 109 113 MIA 95 112 96 122 87 74 99 101 77 86 114 98 113 88 100 88 94 57 71 87 MIL 89 85 119 135 115 124 97 110 142 124 87 96 111 120 93 70 112 86 120 157 MIN 113 79 146 99 92 112 113 97 96 105 133 99 126 87 101 120 73 85 89 97 NYM 113 98 72 84 78 97 116 114 101 106 80 101 67 79 78 92 100 84 96 114 NYY 80 114 115 92 80 89 78 150 115 128 92 86 125 95 67 100 78 98 88 82 OAK 55 57 74 105 95 93 120 95 71 60 124 93 117 118 126 84 101 92 67 62 PHI 65 85 81 74 118 72 90 79 83 104 80 77 91 86 108 46 59 78 97 100 PIT 115 106 81 100 82 116 94 90 121 82 110 73 94 109 56 82 82 100 94 86 SD 99 68 89 105 95 126 106 102 114 93 74 114 74 111 84 130 106 95 94 104 SEA 100 86 117 95 73 91 79 100 117 98 86 94 110 108 82 80 91 105 107 85 SF 126 123 82 86 112 98 124 63 120 107 103 121 88 126 112 116 112 68 70 78 STL 118 93 93 72 109 120 134 121 84 98 111 78 75 104 102 124 134 111 72 89 TB 120 96 108 98 112 108 123 102 93 103 143 109 114 115 85 112 139 118 132 121 TEX 113 110 93 85 80 71 138 102 126 116 113 126 120 101 99 85 89 103 122 111 TOR 121 110 73 84 98 79 107 119 119 130 117 129 64 59 102 92 102 124 112 123 WSH 76 103 81 93 107 71 82 52 82 76 95 71 115 105 135 81 90 71 118 93 T able 7: Comparative View of Standardized MLB Official (Def ) and Estimated Defense F actors (2015–2024) first three correspond to teams for whic h Def is b elo w 100 while our estimate is ab o v e 100, and the remaining five corresp ond to the opp osite pattern. T eam (Season) TBR (home) TBR (aw ay) T eam Defense Opp T eam Opp T eam Def Ours O AK (2015) -0.046 0.042 0.024 0.027 55 124 BAL (2020) -0.035 0.047 0.039 0.066 67 116 SD (2016) 0.013 0.038 0.026 0.028 68 114 HOU (2016) 0.051 0.019 0.044 0.019 134 72 MIL (2020) 0.049 -0.016 0.015 -0.027 124 70 K C (2023) -0.023 -0.065 -0.006 -0.045 120 69 SF (2023) -0.038 -0.062 0.007 -0.045 120 70 NYY (2024) -0.035 -0.072 -0.036 -0.059 128 82 T able 8: Home and a wa y TBR for selected team defense case studies, with corresp onding Def and our estimated team defense F or the first group, we observ e that, in all three cases, the TBR of the opp osing teams is low er than that of the listed team in b oth home and a w ay settings. Since TBR is already defined conditional on batted-ball qualit y , and here further separated by home and a wa y contexts, lo w er TBR v alues indicate b etter defensive outcomes. Therefore, these patterns suggest that the teams exhibit stronger defensive p erformance relative to their opp onen ts. Our estimates, which place these teams ab o ve the league a v erage, are consisten t with the observed outcome patterns. Similarly , for the second group, the opp osing teams consisten tly exhibit higher TBR in b oth home and a wa y games, indicating that the teams hav e w eaker defensiv e performance. This is again consistent with our estimates, whic h assign these teams defensive effects 11 b elo w the league a verage. These results sho w that the estimates from our proposed model are broadly consistent with observed batted-ball outcomes when compared with Def. T eam Outs Ab o ve Average (OAA) (standardized) Our estimated team defense (standardized) 2016 2017 2018 2019 2020 2021 2022 2023 2024 2016 2017 2018 2019 2020 2021 2022 2023 2024 A TL 109 79 137 102 123 106 106 87 100 81 85 119 117 101 125 94 109 71 AZ 92 99 125 125 121 88 141 129 132 107 122 139 138 93 95 118 125 80 BAL 105 79 65 72 83 75 108 90 89 77 89 72 94 116 100 100 119 109 BOS 92 106 100 106 91 68 89 52 84 150 117 89 80 121 73 115 79 121 CHC 148 118 122 130 115 110 78 117 121 136 127 135 123 94 91 99 128 108 CIN 85 110 115 123 81 68 82 67 87 96 61 114 106 88 77 81 90 110 CLE 117 126 92 129 113 116 119 112 110 111 121 60 115 115 124 144 127 117 COL 123 118 98 113 107 102 99 99 108 115 112 113 126 121 102 109 91 101 CWS 107 108 101 86 115 91 84 83 66 104 112 111 86 136 105 81 79 64 DET 97 89 83 85 115 87 113 91 120 73 81 72 67 96 107 124 119 97 HOU 105 101 135 141 119 133 132 106 98 72 78 103 113 89 116 133 119 96 KC 127 115 89 85 121 119 100 130 132 113 88 82 104 112 134 90 69 125 LAA 96 108 101 106 61 81 101 82 66 99 113 94 86 89 68 114 86 98 LAD 84 83 88 103 117 92 107 97 97 101 91 87 115 127 120 123 109 113 MIA 121 93 122 91 75 93 104 69 66 98 113 88 100 88 94 57 71 87 MIL 63 124 130 103 107 82 104 137 126 96 111 120 93 70 112 86 120 157 MIN 108 154 105 81 117 108 86 87 102 99 126 87 101 120 73 85 89 97 NYM 60 57 89 85 93 121 107 87 106 101 67 79 78 92 100 84 96 114 NYY 111 116 70 67 83 81 122 104 108 86 125 95 67 100 78 98 88 82 OAK 80 83 117 103 83 117 93 81 58 93 117 118 126 84 101 92 67 62 PHI 97 102 71 98 63 81 67 100 108 77 91 86 108 46 59 78 97 100 PIT 100 87 105 77 103 92 81 103 87 73 94 109 56 82 82 100 94 86 SD 64 76 108 76 137 109 127 127 106 114 74 111 84 130 106 95 94 104 SEA 105 117 92 80 103 96 100 122 86 94 110 108 82 80 91 105 107 85 SF 116 89 97 113 101 122 69 117 94 121 88 126 112 116 112 68 70 78 STL 95 92 69 126 123 145 127 97 112 78 75 104 102 124 134 111 72 89 TB 74 111 100 104 97 125 101 101 105 109 114 115 85 112 139 118 132 121 TEX 122 103 110 92 87 123 97 119 123 126 120 101 99 85 89 103 122 111 TOR 102 67 67 77 75 92 106 109 120 129 64 59 102 92 102 124 112 123 WSH 91 87 100 124 75 78 53 99 82 71 115 105 135 81 90 71 118 93 T able 9: Comparative View of Standardized MLB Official (O AA) and Estimated Defense F actors (2016–2024) W e next compare our estimates with Outs Ab o v e Average (OAA). Similarly , w e stan- dardize b oth measures using equation (9) and rep ort them side by side in T able 9. T o further examine their differences, we identify eight cases with the largest discrepancies and rep ort them in T able 10. As b efore, we group these cases in to t wo categories: the first group consists of teams for which O AA is ab o ve 100 while our estimate is b elo w 100, and the second group consists of the opp osite pattern. T eam (Season) TBR (home) TBR (aw ay) T eam Defense Opp T eam Opp T eam O AA Ours K C (2023) -0.023 -0.065 -0.006 -0.045 130 69 AZ (2024) -0.031 -0.015 -0.006 0.001 132 80 CIN (2017) 0.115 0.090 0.073 0.046 110 61 SF (2023) -0.038 -0.062 0.007 -0.045 117 70 SD (2016) 0.013 0.038 0.026 0.028 64 114 BOS (2016) 0.030 0.074 -0.035 0.042 92 150 BOS (2024) -0.041 -0.001 -0.039 -0.023 84 121 O AK (2017) 0.011 0.044 0.029 -0.001 83 117 T able 10: Home and aw ay TBR for selected team defense case studies, with corresp onding O AA and our estimated team defense W e no w examine these eight cases in more detail. F or the first group, in which O AA is ab o ve 100 while our estimate is b elo w 100, the TBR patterns in three of the four cases 12 are consistent with our estimates: in b oth home and aw ay settings, the opp osing teams exhibit higher TBR, indicating w eaker defensive p erformance by the listed teams. F or the second group, in whic h OAA is b elo w 100 while our estimate is ab o v e 100, three of the four cases are consistent with our estimates: in b oth home and aw ay settings, the opp osing teams exhibit lo wer TBR, indicating stronger defensiv e performance b y the listed teams. There are, ho wev er, t wo cases that require additional discussion. F or O AK (2017), the results are mixed. A t home, the TBR v alues suggest that O AK exhibits better defensive outcomes than its opp onen ts, while in aw ay games the opp osite pattern is observed. The difference is slightly larger in home games than in aw ay games, suggesting that the evidence slightly fa vors our estimate, although o verall the results do not clearly supp ort either measure. A more notable discrepancy arises for AZ (2024). The TBR v alues suggest that AZ p erforms b etter than its opp onen ts in both home and a wa y games, whereas our estimate places the team below the league av erage. This indicates that our estimate is less aligned with the observ ed outcomes in this case. How ever, the interpretation changes when the league-wide baseline is tak en in to accoun t. In 2024, the a v erage TBR across all games is -0.0364, which is b elo w the ov erall a verage across the 2015–2024 p eriod. At Chase Field (AZ), the opp onen ts’ TBR is appro ximately -0.031, whic h is low er than that of their opp onen ts but still ab o ve the league-wide av erage. F rom this p ersp ectiv e, AZ’s defensiv e p erformance can still b e viewed as below av erage, while the apparen t adv antage relative to their opp onen ts ma y partly reflect even w eaker defensiv e performance b y those opp onen ts. Ov erall, the comparison with OAA is less clear-cut than the comparison with Def. Ho w ever, in the ma jority of cases, the patterns of TBR are more consisten t with the estimates from our prop osed mo del than with OAA. W e next compare which existing metric is more closely aligned with our estimates b y examining the correlations ov er time. T able 11 rep orts the correlations b et ween our estimates and the t w o metrics across seasons. OAA is not av ailable in 2015, as the data required to compute O AA w ere not fully collected in that y ear. As expected, OAA, whic h is conceptually closer to our framew ork, exhibits consistently higher correlations with our estimates than Def. How ever, the magnitude of the correlations remains mo derate, with the highest v alue reaching 0.6668. Metric 2015 2016 2017 2018 2019 2020 2021 2022 2023 2024 Mean Ours vs Def 0.3626 0.2700 0.5247 0.4099 0.5513 0.4406 0.4511 0.5316 0.3996 0.4679 0.4409 Ours vs O AA – 0.2179 0.6167 0.6287 0.6668 0.5508 0.6256 0.5882 0.3982 0.5013 0.5327 T able 11: Correlation betw een our estimated team defense and existing metrics (2015– 2024) 3.3 Changes in the League-Wide Baseline Ov er Time In this subsection, we examine the estimated in tercept across seasons. Since b oth ballpark effects and team defensiv e effects are cen tered to hav e mean zero, the in tercept reflects the league-wide a v erage level of TBR in eac h season, relative to the o verall a verage across all seasons. Because ballpark effects are assumed to b e stable ov er time, c hanges in the intercept mainly reflect c hanges in league-wide defensiv e p erformance. Lo w er v alues of the intercept 13 indicate that, on a v erage, batted balls result in few er bases than exp ected, suggesting b etter o v erall defense. As sho wn in Figure 1, the in tercept exhibits a clear do wnw ard trend o v er time. F rom 2015 to 2019, the in tercept is p ositiv e, indicating that outcomes are ab o ve the baseline. Starting in the early 2020s, the in tercept b ecomes negativ e, reac hing − 0 . 0331 in 2022, whic h indicates a shift in league-wide outcomes relative to the baseline. Figure 1: Y early Comparison of League-Wide Intercept Ov er Time (2015–2024). It is worth noting that this p erio d coincides with well-documented c hanges in the ph ysical prop erties of the baseball. In particular, the seasons from 2017 to 2019 are often referred to as the “juiced ball” era, during which reduced aero dynamic drag led to increased carry of batted balls. In con trast, subsequen t seasons sa w efforts b y MLB to reduce ball liv eliness, including adjustments to ball construction and the in tro duction of h umidors across ballparks. These c hanges are consisten t with the elev ated in tercept v alues observed during 2017–2019 and the subsequent decline in later seasons. The observed trend is therefore consisten t with multiple dev elopmen ts ov er this perio d. On one hand, the increased use of data-driven defensiv e positioning ma y ha v e con tributed to suppressing offensiv e outcomes. On the other hand, c hanges in the physical prop erties of the baseball may also ha ve pla y ed an imp ortan t role. In addition, MLB in tro duced restrictions on extreme infield shifts prior to the 2023 season, and the up w ard mo v ement of the in tercept in 2023 aligns with this c hange. T aken together, these patterns suggest that the estimated in tercept captures league-wide trends that are broadly consisten t with dev elopmen ts in the game. 4 Conclusion and Discussion In this pap er, we prop ose a simple statistical framew ork for jointly estimating ballpark effects and team-lev el defense. The k ey idea is to decomp ose batted-ball outcomes into m ultiple components and isolate the effects of in terest using total bases residuals (TBR). 14 This approach allows us to estimate ballpark effects and team defense sim ultaneously within a unified regression mo del. Empirically , our estimates are broadly consistent with patterns observ ed in the data. F or b oth ballpark effects and team defense, the estimated v alues align well with home and aw ay comparisons based on TBR, often more consistently than existing metrics. This suggests that the prop osed framew ork pro vides a meaningful representation of the underlying factors affecting batted-ball outcomes. In addition, the estimated in tercept rev eals a clear do wnw ard trend o ver time, indi- cating c hanges in league-wide outcomes relativ e to the o v erall baseline. The timing of this trend is broadly consistent with developmen ts in the game, including the increased use of data-driv en p ositioning and the restriction on extreme defensive shifts, and may also reflect changes in the ph ysical prop erties of the baseball. W e also in tro duce a standardized index based on the z-score transformation. Un- lik e traditional ratio-based metrics, this index provides a direct interpretation of relative standing within the distribution, making comparisons across teams, ballparks, and sea- sons more intuitiv e. In this study , the term “team defense” refers sp ecifically to defensive performance in batted-ball even ts. As a result, asp ects of defense that do not directly affect batted-ball outcomes, suc h as catc her framing, blo c king, and control of the running game, are not included in our estimates. In con trast, metrics suc h as Def incorp orate con tributions from m ultiple defensiv e p ositions, including catc hers, which may lead to differences b et ween the t wo measures. It is also w orth noting that catc her-related con tributions are sometimes difficult to attribute cleanly to either pitc hing or defense, whereas our framew ork fo cuses only on observ able batted-ball outcomes. Our framew ork estimates team defense directly from aggregated outcomes rather than b y summing individual play er con tributions. This av oids the need to mo del each play er’s defensiv e abilit y and naturally incorp orates the effects of team-level strategies suc h as defensiv e p ositioning. At the same time, the mo del do es not provide a direct decomp o- sition of defensiv e v alue at the play er lev el. Dev eloping metho ds to connect team-lev el estimates with individual contributions is a natural direction for future w ork. Another limitation is that the expected baseline is constructed using only exit v elo cit y and launch angle, without accoun ting for the direction of the batted ball. Incorp orating directional information could impro ve the accuracy of the model, esp ecially for ballparks with asymmetric field dimensions. How ev er, doing so would increase the dimensionality of the problem and reduce the num b er of observ ations within each cell, leading to less stable estimates. Exploring this trade-off is an imp ortan t direction for future work. A related asp ect is the c hoice of total bases as the outcome measure. Compared with hit-based measures, total bases provide a more informative represen tation of offensiv e outcomes by distinguishing b et ween differen t types of hits. Ho w ever, total bases are not directly prop ortional to run scoring. In principle, one could consider applying a nonlinear transformation based on run v alue. In practice, this is not straigh tforward, as the marginal contribution of differen t outcomes dep ends on game context, and it is unclear how to map small differences in exp ected total bases to corresp onding changes in run v alue. Exploring alternative outcome measures that better align with run pro duction while retaining interpretabilit y is a p ossible direction for future work. The results also suggest that ballpark effects ma y not b e en tirely stable ov er time. While ballpark characteristics such as dimensions and altitude remain fixed, their inter- action with the distribution of batted-ball directions may c hange across seasons. This 15 implies that park effects can v ary with c hanges in hitting patterns and team composition. Finally , the curren t mo del assumes an additiv e structure b et ween ballpark effects and team defense. In practice, these comp onen ts may interact. F or example, teams may construct their defensive roster to b etter fit the characteristics of their home ballpark. Extending the mo del to allow for suc h in teractions is another promising direction for future research. References [1] A char y a, R. A., Ahmed, A. J., D’Amour, A. N., Lu, H., Morris, C. N., Oglevee, B. D., Peterson, A. W., and Swift, R. N. Improving ma jor league baseball park factor estimates. Journal of Quantitative Analysis in Sp orts 4 , 2 (2008). [2] Angrist, J. D., and Pischke, J.-S. Mostly Harmless Ec onometrics: An Empiri- cist’s Comp anion . Princeton Universit y Press, Princeton, 2009. [3] Dew an, J., and Spor ts Info Solutions . Defensive runs sa ved (DRS). https: //fieldingbible.com/drs . [4] F anGraphs . Defensive runs ab o v e av erage (Def). https://library.fangraphs. com/defense/def/ . [5] Kment a, J. Elements of Ec onometrics , 2nd ed. Macmillan, New Y ork, 1986. [6] Lichtman, M., and F anGraphs . Ultimate zone rating (UZR). https:// library.fangraphs.com/defense/uzr/ . [7] Media, M. A. Statcast park factors, 2025. https://baseballsavant.mlb.com/ leaderboard/statcast- park- factors . [8] MLB St a tcast . Outs abov e a verage (OAA). https://baseballsavant.mlb.com/ leaderboard/outs_above_average . [9] Osborne, C., and Levine, J. Personnel-adjustmen t for home run park effects in ma jor league baseball. arXiv pr eprint arXiv:2506.22350 (2025). [10] P a vitt, C. Lo oking for park effects that mak e sense. Retrosheet Research, 2009. https://retrosheet.org/Research/Pavitt/retrosheet- a- c.pdf . App endix A Original MLB Official P ark F actors T able A lists the raw, non-standardized park factors as published b y Ma jor League Base- ball. These v alues represen t the baseline against whic h our standardized comparisons w ere conducted. 16 T eam 2015 2016 2017 2018 2019 2020 2021 2022 2023 2024 A TL 97 99 101 98 104 101 100 99 103 99 AZ 105 110 105 100 99 102 104 98 99 106 BAL 104 101 103 102 105 94 108 99 96 102 BOS 107 109 100 103 103 108 107 108 108 102 CHC 100 94 103 102 99 96 103 99 101 91 CIN 102 103 102 105 99 105 110 107 102 105 CLE 104 105 96 103 97 100 100 96 94 102 COL 117 115 112 115 118 107 108 114 113 110 CWS 97 99 101 98 99 102 101 101 99 99 DET 100 103 106 97 101 102 96 97 99 97 HOU 98 93 98 95 102 92 100 99 100 103 K C 99 99 97 101 100 102 102 105 106 102 LAA 94 97 95 97 100 108 101 100 100 101 LAD 95 94 95 97 97 102 99 101 99 100 MIA 96 94 98 92 96 98 94 100 101 104 MIL 103 100 101 99 99 102 96 98 98 96 MIN 102 104 104 102 100 94 101 100 100 105 NYM 93 96 96 91 97 101 96 96 97 99 NYY 101 99 99 104 97 101 97 98 99 103 O AK 96 92 103 95 96 94 94 97 96 98 PHI 103 97 102 98 103 103 101 103 99 100 PIT 97 104 98 100 102 98 102 101 98 102 SD 99 98 94 100 95 99 97 92 96 99 SEA 97 99 97 96 96 95 92 93 93 89 SF 94 100 93 98 91 103 98 100 94 96 STL 98 98 98 97 95 100 93 98 103 98 TB 95 95 95 95 93 95 94 96 98 96 TEX 107 106 107 111 107 100 97 102 106 95 TOR 99 101 99 102 100 101 95 103 97 100 WSH 100 96 102 106 105 97 104 102 103 99 T able A: Original MLB Official P ark F actors (Non-Standardized), 2015–2024 17 App endix B Original MLB Official Defense F actors T able B presents the Defensive Runs Ab o v e Average (Def ) metrics published by F an- Graphs for the p erio d 2015–2024. Positiv e v alues indicate a defensive contribution ab o ve the league av erage, whereas negative v alues signify b elo w-av erage p erformance. T eam 2015 2016 2017 2018 2019 2020 2021 2022 2023 2024 ARI -0.4 -21.4 -3.2 51.3 41.5 10.6 -17.2 31.3 17.8 21.2 A TL -10.7 -5.0 -19.7 30.2 9.2 11.5 2.4 3.8 11.7 1.4 BAL 8.9 4.3 -21.2 -43.8 -65.6 -16.8 -52.8 14.4 0.0 -13.4 BOS -13.0 4.2 32.6 38.6 28.8 0.0 -12.6 -9.2 -50.6 -21.6 CHC 25.6 51.7 6.9 17.1 17.4 14.3 5.0 -20.0 10.5 12.9 CIN -17.7 -28.5 7.6 -11.1 29.3 -4.6 -32.2 -23.9 -42.9 -19.8 CLE 13.0 22.7 46.6 3.3 57.3 7.6 17.7 22.3 6.8 33.8 COL -36.4 22.1 4.1 2.5 -0.6 -1.9 10.0 -13.7 -0.3 -3.7 CWS -6.0 -13.3 9.3 -27.6 -36.4 15.1 -33.2 -11.3 -23.8 -56.2 DET -16.6 -24.9 -34.7 -27.0 -30.5 -0.4 -27.7 -0.6 2.2 32.4 HOU -4.3 36.6 13.1 50.7 34.8 1.7 32.7 34.8 -3.1 2.1 K C 29.0 12.7 0.6 -20.6 -11.2 8.8 11.1 -25.2 23.1 35.4 LAA 17.8 -0.4 42.9 15.4 -5.8 -18.9 -21.8 -16.8 -29.5 -36.4 LAD 22.8 17.5 15.1 13.9 23.6 4.9 -2.6 11.9 1.1 -12.0 MIA -5.0 13.0 -4.9 28.4 -17.8 -13.4 -1.4 1.4 -27.9 -17.1 MIL -10.6 -16.1 23.5 46.0 20.6 12.5 -3.0 11.5 50.4 29.1 MIN 13.3 -23.0 58.1 -1.4 -10.7 6.4 15.5 -4.3 -5.5 6.4 NYM 13.3 -2.3 -35.0 -21.3 -31.4 -1.5 19.9 16.7 1.4 7.3 NYY -20.1 15.3 19.1 -10.7 -28.0 -5.5 - 26. 1 59.3 17.3 34.8 O AK -45.3 -46.5 -32.4 7.1 -6.5 -3.8 24.3 -6.1 -34.4 -49.5 PHI -34.4 -16.1 -23.8 -34.0 24.8 -14.6 -12.2 -25.4 -20.0 4.4 PIT 15.5 6.9 -23.5 0.2 -25.8 8.6 -7.0 -11.9 25.4 -22.2 SD -0.2 -35.2 -13.6 6.0 -7.5 13.5 6.9 1.7 16.2 -8.5 SEA 0.3 -15.3 21.3 -6.2 -37.1 -4.6 -24.8 -0.3 20.0 -2.7 SF 26.6 24.6 -22.5 -17.7 17.3 -0.8 28.9 -44.1 23.1 8.4 STL 18.4 -7.5 -9.0 -36.1 11.8 10.4 41.1 24.4 -19.9 -3.3 TB 20.5 -4.9 10.1 -2.5 16.2 4.4 27.4 1.8 -8.0 3.5 TEX 13.4 11.0 -9.5 -19.1 -27.6 -15.2 45.5 2.4 31.1 19.2 TOR 21.7 11.3 -34.6 -20.1 -3.4 -10.8 8.7 22.1 23.0 36.9 WSH -23.6 3.7 -23.7 -8.5 10.2 -14.9 -21.4 -57.6 -22.3 -29.6 T able B: Defensive Runs Ab o ve Av erage (Def ), 2015–2024 App endix C Home and Aw a y Defense Residual Anal- ysis T able C presents a comprehensiv e T otal Bases Residual (TBR) analysis for all 30 MLB teams spanning the 2015–2024 seasons. T o precisely capture how stadium environmen ts dynamically interact with b oth home and visiting lineups, the data is structured in to four distinct situational metrics. Sp ecifically , T e am TBR (home) and T e am TBR (away) represen t the focal team’s o wn offensiv e TBR when batting at their home stadium and on the road, resp ectiv ely . Conv ersely , Opp TBR (home) and Opp TBR (away) denote the TBR generated by opp osing batters when the fo cal team is pla ying defense at their home ballpark and at aw ay ven ues, resp ectiv ely . By ev aluating the discrepancy b et w een actual 18 total bases and their exp ected v alues across these four dimensions, the analysis pro vides a granular view of ven ue-sp ecific impacts on b oth offensiv e and defensiv e outcomes. Metric 2015 2016 2017 2018 2019 2020 2021 2022 2023 2024 A TL Opp TBR (home) -0.013 -0.007 0.049 -0.040 0.004 -0.006 -0.045 -0.055 -0.029 -0.022 Opp TBR (a wa y) 0.062 0.035 0.045 0.008 0.020 0.023 -0.036 -0.028 -0.033 -0.029 T eam TBR (home) -0.004 -0.022 0.027 0.012 0.024 0.024 -0.016 -0.041 -0.021 -0.072 T eam TBR (aw ay) -0.001 0.018 0.038 0.039 -0.002 0.005 -0.056 -0.044 -0.037 -0.058 AZ Opp TBR (home) 0.030 0.043 0.009 -0.039 -0.008 0.000 0.026 -0.069 -0.024 -0.031 Opp TBR (a wa y) 0.014 0.026 0.051 -0.015 0.005 0.027 -0.006 -0.025 -0.031 -0.006 T eam TBR (home) 0.031 0.054 0.078 0.003 0.030 0.002 0.032 -0.008 0.026 -0.015 T eam TBR (aw ay) 0.041 0.015 0.043 -0.001 0.059 -0.021 -0.018 -0.010 -0.029 0.001 BAL Opp TBR (home) 0.050 0.038 0.030 0.044 0.066 -0.035 -0.007 -0.057 -0.080 -0.053 Opp TBR (a wa y) 0.042 0.032 0.058 0.027 0.021 0.039 -0.019 -0.031 -0.028 -0.045 T eam TBR (home) 0.047 0.007 0.034 0.022 0.042 0.047 -0.002 -0.067 -0.042 -0.052 T eam TBR (aw ay) -0.013 -0.010 0.019 -0.017 0.019 0.066 -0.015 -0.028 0.004 -0.009 BOS Opp TBR (home) 0.030 0.030 0.017 -0.004 0.022 0.069 0.010 -0.016 0.011 -0.041 Opp TBR (a wa y) 0.034 -0.035 0.026 0.013 0.061 -0.015 0.007 -0.055 0.001 -0.039 T eam TBR (home) 0.065 0.074 0.036 -0.002 0.034 0.084 -0.009 -0.022 0.007 -0.001 T eam TBR (aw ay) 0.009 0.042 0.023 -0.009 0.018 0.035 -0.048 -0.049 -0.032 -0.023 CHC Opp TBR (home) 0.028 -0.026 0.040 -0.012 -0.002 -0.035 0.002 -0.031 -0.029 -0.070 Opp TBR (a wa y) 0.022 -0.020 0.004 -0.034 0.023 0.023 0.006 -0.018 -0.048 -0.034 T eam TBR (home) 0.021 0.021 0.036 0.009 0.042 -0.022 0.016 0.003 -0.004 -0.055 T eam TBR (aw ay) 0.028 0.041 0.053 0.006 0.042 0.021 0.002 -0.027 -0.016 -0.034 CIN Opp TBR (home) 0.056 0.055 0.115 0.069 0.067 0.076 0.059 0.051 0.036 0.020 Opp TBR (a wa y) 0.001 0.029 0.073 -0.024 0.018 -0.004 0.002 -0.025 -0.014 -0.053 T eam TBR (home) 0.045 0.065 0.090 0.048 0.065 0.058 0.030 0.019 0.038 0.016 T eam TBR (aw ay) -0.002 0.013 0.046 -0.019 0.023 -0.083 -0.047 -0.047 0.010 -0.039 CLE Opp TBR (home) 0.014 0.030 0.033 0.016 0.052 0.019 -0.025 -0.066 -0.072 -0.042 Opp TBR (a wa y) -0.003 0.001 0.010 0.034 0.001 -0.043 -0.046 -0.078 -0.040 -0.029 T eam TBR (home) 0.012 0.049 0.035 -0.004 0.057 0.010 -0.001 -0.024 -0.027 0.007 T eam TBR (aw ay) 0.004 0.015 0.045 -0.004 0.024 -0.056 -0.022 0.010 -0.025 - 0.010 COL Opp TBR (home) 0.095 0.081 0.119 0.078 0.092 0.046 0.018 0.015 0.021 0.009 Opp TBR (a wa y) 0.024 -0.002 0.032 0.006 0.006 -0.022 0.006 -0.041 -0.008 -0.030 T eam TBR (home) 0.107 0.109 0.148 0.097 0.116 0.074 0.060 0.039 0.031 0.025 T eam TBR (aw ay) 0.016 0.020 0.039 -0.005 0.047 -0.003 -0.038 -0.034 -0.034 -0.058 CWS Opp TBR (home) 0.038 0.039 0.037 -0.012 0.029 -0.023 -0.006 -0.015 -0.019 -0.019 Opp TBR (a wa y) 0.048 0.023 0.042 -0.007 0.034 -0.035 -0.029 -0.031 -0.002 -0.020 T eam TBR (home) 0.028 0.053 0.081 0.038 0.013 0.035 0.003 -0.059 -0.024 -0.061 T eam TBR (aw ay) 0.020 0.025 0.016 -0.004 0.027 0.016 -0.022 -0.047 -0.025 -0.065 DET Opp TBR (home) 0.023 0.020 0.003 -0.025 0.029 -0.030 -0.076 -0.079 -0.045 -0.049 Opp TBR (a wa y) 0.066 0.033 0.064 0.045 0.051 0.033 -0.010 -0.067 -0.060 -0.032 T eam TBR (home) 0.000 -0.028 0.002 -0.018 -0.005 -0.007 -0.036 -0.072 -0.062 -0.041 T eam TBR (aw ay) 0.012 -0.010 -0.004 -0.013 0.013 0.014 -0.010 -0.047 -0.050 -0.042 Con tinued on next page 19 T able C – con tinued from previous page Metric 2015 2016 2017 2018 2019 2020 2021 2022 2023 2024 HOU Opp TBR (home) 0.035 0.051 0.057 0.037 0.067 -0.019 -0.017 -0.050 -0.017 0.000 Opp TBR (a wa y) 0.016 0.044 0.074 -0.010 0.024 0.026 -0.051 -0.066 -0.065 -0.054 T eam TBR (home) 0.116 0.019 0.078 0.036 0.122 0.024 -0.009 -0.016 -0.045 -0.032 T eam TBR (aw ay) 0.002 0.019 0.050 0.025 0.029 -0.009 -0.026 -0.052 -0.012 -0.039 K C Opp TBR (home) -0.026 -0.037 0.017 -0.024 -0.009 -0.053 -0.061 -0.063 -0.023 -0.059 Opp TBR (a wa y) 0.015 0.034 0.047 0.017 0.026 0.021 -0.066 -0.013 -0.006 -0.058 T eam TBR (home) 0.011 0.017 0.014 -0.024 -0.001 -0.001 -0.044 -0.056 -0.065 -0.051 T eam TBR (aw ay) 0.016 0.015 0.012 -0.018 0.033 0.009 -0.035 -0.061 -0.045 -0.038 LAA Opp TBR (home) -0.007 -0.002 -0.024 -0.014 0.030 0.003 -0.017 -0.046 -0.016 -0.018 Opp TBR (a wa y) 0.022 0.017 0.045 0.012 0.040 0.017 0.017 -0.042 -0.013 -0.045 T eam TBR (home) -0.003 -0.022 0.013 -0.014 0.030 0.012 -0.016 -0.028 -0.015 -0.027 T eam TBR (aw ay) 0.004 0.004 0.006 0.003 -0.008 0.015 -0.014 -0.051 -0.007 -0.072 LAD Opp TBR (home) 0.022 0.012 0.026 0.021 0.033 -0.027 -0.027 -0.008 -0.038 -0.041 Opp TBR (a wa y) 0.040 0.031 0.066 0.022 0.024 -0.020 -0.026 -0.068 -0.022 -0.041 T eam TBR (home) 0.019 0.003 0.049 0.006 0.047 0.002 0.001 -0.004 -0.016 -0.027 T eam TBR (aw ay) -0.008 0.000 0.010 0.015 0.042 -0.024 -0.039 -0.052 -0.026 -0.029 MIA Opp TBR (home) -0.021 0.004 0.016 -0.029 0.032 0.032 -0.038 -0.017 -0.025 -0.022 Opp TBR (a wa y) 0.005 0.004 0.035 0.033 0.024 0.006 0.002 0.004 0.018 -0.040 T eam TBR (home) 0.004 -0.009 0.046 -0.036 -0.001 -0.017 -0.021 -0.046 -0.022 -0.056 T eam TBR (aw ay) 0.020 0.033 0.046 0.002 0.002 0.028 0.006 -0.061 -0.047 -0.019 MIL Opp TBR (home) 0.052 0.038 0.061 0.004 0.038 0.049 -0.017 -0.015 -0.042 -0.054 Opp TBR (a wa y) 0.025 0.036 0.038 -0.015 0.034 0.015 -0.032 -0.018 -0.029 -0.063 T eam TBR (home) 0.042 0.057 0.082 0.009 0.043 -0.016 -0.019 -0.025 0.000 0.009 T eam TBR (aw ay) 0.016 0.014 0.060 0.017 0.013 -0.027 -0.008 -0.035 -0.045 -0.017 MIN Opp TBR (home) -0.022 0.014 0.034 -0.024 0.003 -0.068 -0.056 -0.057 -0.008 -0.017 Opp TBR (a wa y) 0.014 0.028 0.012 0.019 0.022 0.013 0.013 -0.020 -0.012 -0.039 T eam TBR (home) 0.043 0.043 0.054 0.012 0.002 0.033 -0.072 -0.072 -0.011 -0.016 T eam TBR (aw ay) 0.010 0.033 0.029 0.009 0.048 -0.011 -0.051 -0.074 -0.041 -0.050 NYM Opp TBR (home) 0.021 0.008 0.054 0.011 0.066 0.054 -0.037 -0.044 -0.040 -0.048 Opp TBR (a wa y) 0.029 0.008 0.068 0.034 0.034 0.011 -0.015 -0.022 -0.021 -0.052 T eam TBR (home) 0.011 0.011 0.027 -0.009 0.024 0.046 -0.032 -0.047 -0.041 -0.046 T eam TBR (aw ay) -0.004 0.031 0.073 0.034 0.033 0.037 -0.024 -0.018 -0.044 -0.043 NYY Opp TBR (home) 0.020 0.050 -0.008 0.026 0.055 -0.012 -0.005 -0.036 -0.034 -0.035 Opp TBR (a wa y) 0.055 0.046 0.040 -0.001 0.061 0.061 -0.024 -0.040 -0.026 -0.036 T eam TBR (home) 0.051 0.045 0.066 0.028 0.033 0.054 -0.056 -0.056 -0.076 -0.072 T eam TBR (aw ay) 0.003 0.013 0.016 0.005 0.068 -0.040 -0.050 -0.050 -0.065 -0.059 O AK Opp TBR (home) -0.046 -0.023 0.011 -0.058 -0.031 -0.059 -0.058 -0.046 -0.018 -0.053 Opp TBR (a wa y) 0.024 0.032 0.029 -0.017 0.008 0.045 -0.024 -0.020 0.011 -0.003 T eam TBR (home) 0.042 -0.034 0.044 -0.041 0.002 -0.037 -0.059 -0.048 -0.032 -0.064 T eam TBR (aw ay) 0.027 0.008 -0.001 0.021 0.017 -0.002 -0.036 -0.044 -0.024 -0.033 PHI Opp TBR (home) 0.027 0.037 0.059 0.046 0.037 0.056 0.021 -0.015 -0.023 -0.011 Opp TBR (a wa y) 0.029 0.039 0.042 0.027 0.031 0.076 0.029 -0.015 -0.004 -0.034 Con tinued on next page 20 T able C – con tinued from previous page Metric 2015 2016 2017 2018 2019 2020 2021 2022 2023 2024 T eam TBR (home) 0.025 0.023 0.044 0.034 0.050 -0.007 0.000 -0.023 0.011 -0.003 T eam TBR (aw ay) 0.017 0.025 0.044 -0.004 0.015 0.004 -0.011 -0.057 -0.024 -0.034 PIT Opp TBR (home) -0.026 0.030 0.039 -0.010 0.072 -0.041 -0.020 -0.062 -0.058 -0.055 Opp TBR (a wa y) 0.012 0.050 0.046 0.005 0.058 0.050 0.022 -0.016 -0.007 -0.021 T eam TBR (home) -0.011 0.027 0.031 -0.008 0.010 -0.022 -0.007 -0.029 -0.051 -0.063 T eam TBR (aw ay) 0.011 0.010 0.024 0.003 0.034 -0.044 -0.033 -0.020 0.002 -0.049 SD Opp TBR (home) 0.069 0.013 0.037 0.007 0.005 -0.068 -0.060 -0.071 -0.020 -0.019 Opp TBR (a wa y) 0.039 0.026 0.090 0.011 0.069 -0.007 0.008 -0.008 -0.026 -0.055 T eam TBR (home) 0.026 0.038 0.067 0.015 -0.002 0.003 -0.013 -0.042 -0.042 -0.050 T eam TBR (aw ay) 0.016 0.028 0.052 0.016 0.076 -0.039 -0.034 -0.023 -0.031 -0.034 SEA Opp TBR (home) -0.002 0.022 0.001 -0.009 0.012 -0.013 -0.046 -0.036 -0.012 -0.064 Opp TBR (a wa y) 0.051 0.015 0.043 -0.015 0.045 0.039 -0.009 -0.037 -0.043 -0.033 T eam TBR (home) -0.005 -0.004 0.029 -0.016 0.015 0.011 -0.044 -0.031 -0.039 -0.088 T eam TBR (aw ay) -0.017 0.008 0.025 -0.020 0.069 -0.019 -0.031 -0.061 -0.029 -0.045 SF Opp TBR (home) -0.052 -0.020 -0.025 -0.012 -0.028 -0.015 -0.063 -0.022 -0.038 -0.050 Opp TBR (a wa y) 0.041 0.018 0.076 -0.015 0.021 -0.006 -0.011 0.005 0.007 -0.021 T eam TBR (home) -0.003 -0.002 -0.013 -0.010 -0.046 0.021 -0.034 -0.047 -0.062 -0.060 T eam TBR (aw ay) 0.020 0.008 0.038 -0.002 0.020 0.020 0.010 -0.035 -0.045 -0.046 STL Opp TBR (home) -0.007 0.004 0.023 -0.026 -0.027 -0.068 -0.079 -0.072 -0.047 -0.064 Opp TBR (a wa y) 0.000 0.051 0.058 -0.005 0.030 -0.027 -0.050 -0.028 0.014 -0.015 T eam TBR (home) 0.000 -0.014 -0.005 -0.072 -0.019 -0.013 -0.064 -0.038 -0.054 -0.050 T eam TBR (aw ay) 0.022 0.051 0.045 0.026 0.026 -0.037 -0.015 0.008 -0.029 -0.033 TB Opp TBR (home) -0.026 -0.004 0.005 -0.036 0.020 0.028 -0.048 -0.042 -0.021 -0.063 Opp TBR (a wa y) -0.012 0.037 0.041 0.001 0.041 0.006 -0.044 -0.040 -0.045 -0.043 T eam TBR (home) 0.028 0.027 0.062 0.034 0.012 0.058 0.026 -0.011 0.026 -0.031 T eam TBR (aw ay) 0.027 0.036 0.037 0.015 0.009 0.025 0.015 -0.024 0.009 -0.043 TEX Opp TBR (home) 0.014 0.025 0.032 0.035 0.044 0.018 -0.024 -0.036 -0.006 -0.066 Opp TBR (a wa y) 0.019 -0.005 0.021 -0.003 0.025 0.012 -0.009 -0.028 -0.044 -0.035 T eam TBR (home) 0.016 0.052 0.046 0.037 0.041 -0.015 -0.023 -0.018 0.018 -0.037 T eam TBR (aw ay) 0.016 0.008 0.022 -0.018 0.003 -0.032 -0.023 -0.047 -0.039 -0.049 TOR Opp TBR (home) -0.022 0.004 0.049 0.038 0.034 0.011 -0.014 -0.041 -0.031 -0.045 Opp TBR (a wa y) 0.035 -0.008 0.063 0.040 0.028 0.048 -0.016 -0.058 -0.034 -0.058 T eam TBR (home) 0.039 0.008 0.023 0.002 0.043 0.006 0.004 -0.023 -0.023 -0.031 T eam TBR (aw ay) 0.036 0.011 0.011 -0.026 0.019 -0.009 -0.033 -0.032 -0.023 -0.054 WSH Opp TBR (home) -0.013 -0.008 0.045 0.022 0.019 -0.001 -0.011 -0.028 -0.066 -0.052 Opp TBR (a wa y) 0.031 0.033 0.028 -0.005 0.002 0.045 -0.011 -0.009 -0.019 -0.026 T eam TBR (home) -0.003 -0.002 0.062 0.009 0.050 -0.005 -0.028 -0.046 -0.009 -0.045 T eam TBR (aw ay) 0.001 0.012 0.038 -0.007 0.004 0.040 -0.012 -0.021 -0.019 -0.010 T able C: Home and Awa y T otal Bases Residual (TBR) Analysis by T eam (2015–2024) 21
Original Paper
Loading high-quality paper...
Comments & Academic Discussion
Loading comments...
Leave a Comment