Scene Representation using 360° Saliency Graph and its Application in Vision-based Indoor Navigation
A Scene, represented visually using different formats such as RGB-D, LiDAR scan, keypoints, rectangular, spherical, multi-views, etc., contains information implicitly embedded relevant to applications such as scene indexing, vision-based navigation. …
Authors: Preeti Meena, Himanshu Kumar, S
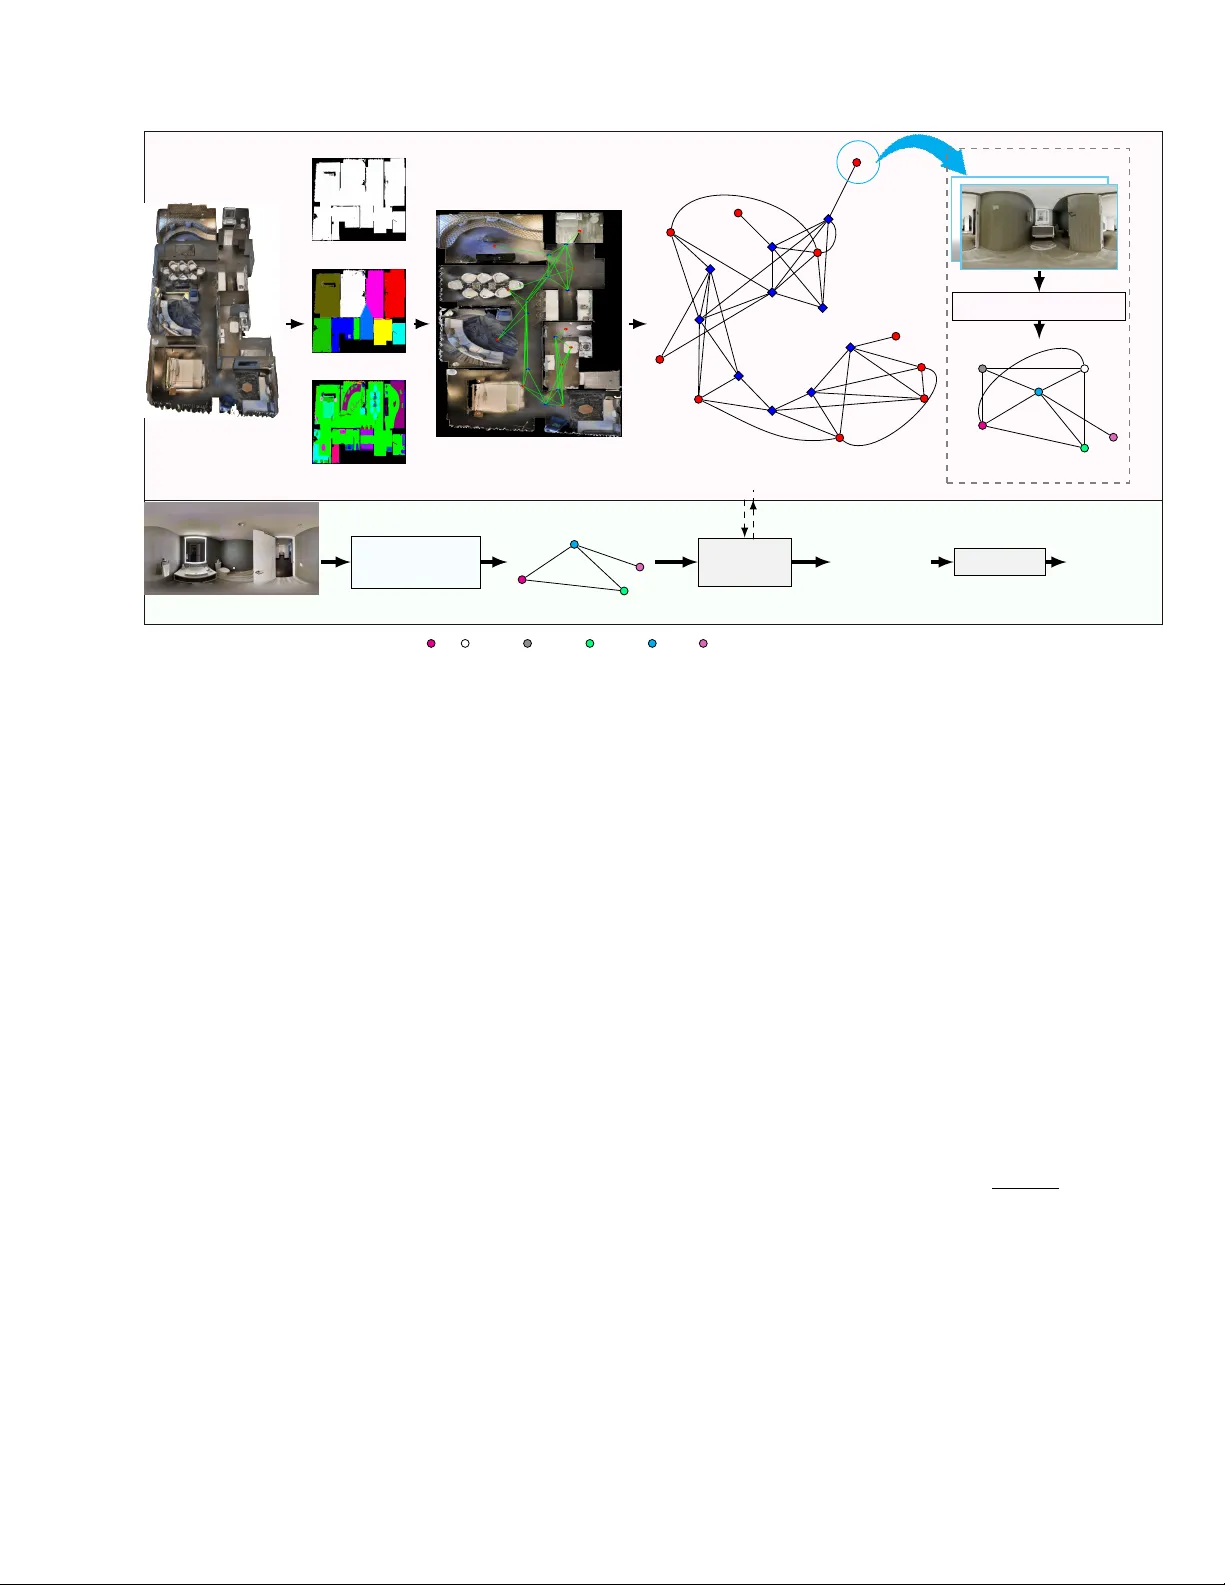
JOURNAL OF L A T E X CLASS FILES, VOL. 14, NO. 8, A UGUST 2021 1 Scene Representation using 360 ◦ Salienc y Graph and its Application in V ision-based Indoor Na vigation Preeti Meena, Graduate Student Member , IEEE, Himanshu Kumar , Member , IEEE, Sandeep Y ada v , Member , IEEE, Abstract —A Scene, r epresented visually using different formats such as RGB-D, LiD AR scan, keypoints, rectangular , spheri- cal, multi-views, etc., contains inf ormation implicitly embedded rele vant to applications such as scene indexing, vision-based navigation. Thus, these repr esentations may not be efficient for such applications. This paper proposes a no vel 360 ◦ saliency graph representation of the scenes. This rich representation explicitly encodes the relev ant visual, contextual, semantic, and geometric inf ormation of the scene as nodes, edges, edge weights, and angular position in the 360 ◦ graph. Also, this repr esentation is rob ust against scene view change and addresses challenges of indoor en vironments such as varied illumination, occlusions, and shadows as in the case of existing traditional methods. W e ha ve utilized this rich and efficient representation f or vision-based navigation and compar ed it with existing navigation methods using 360 ◦ scenes. However , these existing methods suffer from limitations of poor scene repr esentation, lacking scene-specific information. This w ork utilizes the proposed representation first to localize the query scene in the given topological map, and then facilitate 2 D navigation by estimating the next requir ed mov e- ment directions towards the tar get destination in the topological map by using the embedded geometric inf ormation in the 360 ◦ saliency graph. Experimental results demonstrate the efficacy of the proposed 360 ◦ saliency graph repr esentation in enhancing both scene localization and vision-based indoor navigation. Index T erms — 360 ◦ Summary , Saliency Graph, Scene Repre- sentation, Localization, V ision-based Na vigation, Scene Map. I . I N T RO D U C T I O N I NTERPRETING and representing visual scenes in a com- pact, meaningful, and computationally efficient manner is a key requirement for a wide range of vision-based applications, including scene retrieval, localization, and na vigation [1]. Indoor en vironment comprises scenes with v aried illumination, complex layouts, occlusions, high visual similarity between different locations, and shadows [1]. These challenges make indoor scene representation a widely explored and still open research problem. Earlier methods have relied on RGB images, RGB-D data, LiDAR point clouds, keypoint-based descriptors, and multi-view images as scene representations [2]. RGB images are generally encoded through visual features extracted from them, but such features are highly sensitiv e to varying in- door conditions, like varied illumination and presence of shad- ows. LiDAR point clouds effecti vely capture the geometric structure of the scene, but tend to be sparse and lack semantic understanding. Multi-view images are introduced to address the limited field of vie w or partial scene information captured Preeti Meena, Himanshu Kumar , and Sandeep Y adav are with Discipline of Electrical Engineering, Indian Institute of T echnology Jodhpur, Jodhpur- 342030, India meena.52@iitj.ac.in , hkumar@iitj.ac.in , sy@iitj.ac.in by a single image [1]. Howe ver , multi-vie w-based representa- tion requires additional camera parameters to infer spatial re- lationships, which increases computational complexity . These limitations highlight that scene representations relying on visual and structural layout information are prone to errors and can lead to inaccurate results in vision-based applications such as indoor navigation. T o mitigate these issues, several methods [3], [4] hav e employed 360 ◦ visual data via panorama images, which provide a complete and continuous vie w of scene by capturing richer scene context from a single observation point. The queryable semantic topological maps [5] comprise key locations, and their connections can facilitate navig ation within indoor environments. Existing navigation methods that use topological maps [6] rely on panorama images to represent the scene at each key location. This results in suboptimal scene representation because it treats all components within the image as equally important, neglecting the uniqueness of different components in navigation tasks. Instead of using the entire panorama image, se veral methods [7], [8], [9], [10] employ visual features e xtracted from the panorama image as a representation for navigation. Howe ver , visual features [8], [9], [10] are unreliable in indoor en vironments due to v arying illumination and shadows. Thus, a concise and navigation- specific scene representation of the panorama image content, such as a ‘summary’ [11], [12], [13] is required. A summary of a panorama image can be generated by detecting objects in the image [14], [15], [5], and subse- quently can be utilized to represent scenes at key locations of topological graphs [16]. Howe ver , listing all the objects in the scene is not an effecti ve scene representation, as the scene at various locations often contains similar objects in similar environments, e.g., office rooms, meeting spaces, and conference rooms are typically composed of identical objects (e.g., chairs, tables, etc.). Consequently , object-based scene representation is prone to failure in localizing such scenarios. This limitation motiv ates the use of the salient objects, which offer a more distinctiv e and discriminativ e scene representa- tion, for scene summary . Saliency highlights prominent objects by assigning importance scores based on their distincti veness, reducing the impact of irrelev ant objects [17]. For example, an ov en in a kitchen or a bathtub in a bathroom would be deemed more informativ e than common items such as chairs. Howe ver , representing a scene solely as a collection of salient objects still lacks structural and contextual information, which are crucial for robust and accurate positioning in navigation tasks. Recent methods [13] lev erage contextual information along with objects to improve ef ficiency . Howe ver , these methods consider all objects and their relations equally important, JOURNAL OF L A T E X CLASS FILES, VOL. 14, NO. 8, A UGUST 2021 2 X Z Y c (a) Panoramic RGB-D image with detected objects (b) Scene representation via saliency graph (c) Scene representation via 360 ◦ saliency graph O 9 O 3 O 4 O 5 O 6 Project to Sphere c O 9 O 3 O 4 O 5 O 6 0.21 0.46 0.76 c − 55 0 141 0 155 . 8 0 163 0 − 14 0 V isual Information Semantic Information Contextual Information v = ( D, θ ) Geometric Information bed painting sofachair tv window A. 360 ◦ saliency graph representation (node orientation in blue). v p 7→ c c T opological map Candidate Matched Saliency Graph Query Graph c’ c c’ Alignment cabinet table door B. localization and positioning method ov erview . Fig. 1. (A) Orientation-rich 360 ◦ saliency graph representation of a scene, constructed from an RGB-D panorama image. (B) Localization in a topologi- cal map and positioning within a localized scene using 360 ◦ saliency graphs. Localization: via scene graph matching using visual, semantic, and contextual information embedded in the 360 0 saliency graph; Positioning in the scene: by aligning geometric information in a 360 0 saliency graph. which can lead to suboptimal performance, as each component has a dif ferent significance in the unique scene representation. Sev eral existing methods [2] emplo y semantic graphs for scene representation and positioning in na vigation tasks. Ho wev er , the ef fectiv eness of semantic graphs is highly dependent on the accuracy of object detection and classification. T o address this limitation, the proposed approach focuses on salient objects extracted using volumetric saliency , which emphasizes lar ger objects within the scene. This helps to mitigate the impact of undetected smaller or occluded objects. Also, the semantic graph representation-based topological map is not well-suited for orientation estimation because it does not preserve geo- metric information. Thus, path planning cannot be performed. This paper introduces a navigation-specific scene repre- sentation through 360 ◦ saliency graph generated from an RGB-D panorama image. F or navig ation, a topological map of an indoor en vironment in which each key location is accompanied by a 360 ◦ saliency graph of that location is constructed. A 360 ◦ saliency graph effecti vely encodes visual, contextual, semantic, and geometric information of scene by representing salient objects as nodes, relations between object pairs as edges, object’ s label and edge weights as semantic, and descriptors like angular position, saliency score, 3 D location as geometric information. Salient objects are identified using volumetric salienc y [17], which is based on the observation that larger objects occupy a greater portion of a scene and thus contribute more significantly to its representation [18]. A ke y advantage of volumetric saliency [17] is its ability to detect scene-defining objects re gardless of their position in the fore- ground or background. The representation of a 360 ◦ saliency graph on a sphere enables us to detect orientation from the relativ e positions of salient objects. As shown in Figure 1, giv en a RGB-D panorama image of an unknown location, we utilize the 360 ◦ saliency graph as scene representation and compare it against those in the pre-constructed queryable topological map for the candidate graph or location selection. Then, a best-matched candidate graph is utilized to estimate the pose accurately by aligning the reference points and salient nodes. A panoramic image can be e xplicitly represented via a 360 ◦ saliency graph compared to a saliency graph, as shown in Fig. 1. The key contributions of the paper are as follo ws: (i) A na vigation-specific scene representation method through an orientation-rich 360 ◦ saliency graph derived from a panorama RGB-D image. The proposed graph jointly encodes V isual , Semantic , Conte xtual , and Geometric information within a uni- fied spherical structure that covers the entire 360 ◦ field of vie w , as illustrated in Fig. 1. Unlike existing navigation-oriented representations (which either rely on a single information or treat all components equally and different types of information independently), the proposed graph inte grates heterogeneous scene’ s information into a structurally consistent spherical graph. This yields a compact yet highly discriminativ e scene representation that preserves both spatial layout and local orientation relationships characteristic of indoor scenes. This new representation facilitates efficient and rob ust localization for navigation, demonstrated in the experimental results of the paper . (ii) A 360 ◦ saliency graph representation-based localiza- tion and positioning approach to facilitate indoor navigation. This work analyzes the performance of the proposed work for 2 D na vigation on a given topological map by matching a query graph to the reference 360 ◦ saliency graphs. The relati ve orientation of salient objects in the query graph with respect to those encoded in the spherical 360 ◦ saliency graph is exploited for positioning and navigation planning. The remainder of the paper is organized as follows: Section II discusses related works on scene representation used for indoor navig ation. Section III presents the proposed 360 ◦ saliency graph-based representation, along with the localiza- tion and positioning methods for navigation. Experimental results and comparisons are presented in Section IV. The paper concludes in Section V with a discussion on future works. I I . P R I O R W O R K S Effecti ve scene representation is an inte gral part of vision- based applications such as indoor navig ation [19], [20], [5]. Methods designed for navigation in a known en vironment JOURNAL OF L A T E X CLASS FILES, VOL. 14, NO. 8, A UGUST 2021 3 [21] utilize av ailable maps, while na vigation in an unknown en vironment [22], [23] requires mapping, i.e., map creation. V isual navigation in known en vironments, as per the fo- cus of this paper, utilizes a variety of navigational-specific scene representations [3], [4], [6], [24], [25] for ef fectiv e localization, positioning and orientation detection. Labrosse et al. [3] utilized whole 2 D panorama images rather than a few landmarks e xtracted from images. Y u et al. [4] utilized a sequence of snapshot images for landmark-based navigation. Cha et al. [26] use optic flow information by employing the Kanade-Lucas-T omashi(KL T) algorithm to estimate the mov ement of agents for homing navigation. Lee et al. [27] utilized Haar -like Features for scene representation. Recently , K oh et al. [19] proposed a stochastic hierarchical visual world model termed Pathdreamer that represents the scene via visual, spatial, and semantic information to generate realistic 360 ◦ panorama images for unseen trajectories in real-world b uild- ings. Krantz et al. [28] utilize feature-based scene represen- tation in which the RGB-D panorama image is encoded with a ResNet- 50 [29]. Sev eral proposed works [30], [31], [32], [33] learn the scene representations with a contrastiv e learning approach. Hong et al. [33] emplo yed a visual representation learning method (Ego 2 -Map) that trains a visual-transformer by contrasting egocentric RGB views with semantic maps. Howe ver , Ego 2 -Map requires pre-constructed semantic maps (or dense semantic annotations) for training, which imposes a significant data-collection cost and limits applicability to only annotated or well-mapped en vironments. Pramataro v et al. [34] introduced BoxGraph, extending the camera-based semantic graph approach of [2] to 3 D LiD AR point clouds representation by replacing 2 D bounding boxes with 3 D se- mantic blobs. Their method estimates 6 -DoF pose using SVD on v ertex centroids. Howe ver , it relies on accurate alignment between query and reference points, making it sensitive to noise and lacking built-in outlier rejection, requiring additional preprocessing such as RANSA C. Moreover , the use of 3 D LiD AR point clouds captures partial objects and lacks explicit orientation information. Xu et al. [35] proposed a panoramic image-based rendering algorithm for free-vie wpoint navig ation of indoor scenes. The authors represent each input RGB-D panorama with a set of spherical superpixels and warp each superpixel individually . Kim et al. [36] utilized a topological semantic graph memory (TSGM) for navigation, which has two types of nodes: image nodes and object nodes, and a cross-graph mixer module that takes the collected nodes to get contextual information. More recently , W ang et al. [16] proposed a cross-modal attention navig ation framew ork and an en vironment representation graph through object detection and GCN. An et al. [6] proposed a method, ETPNav , that performs online topological mapping of en vironments for navigation by self-organizing predicted waypoints along a trav ersed path without prior en vironmental experience. The nodes/key locations of the topological map are represented through the feature vectors extracted from panorama RGB- D images using visual encoders. Liu et al. [24] proposed a volumetric en vironment representation (VER), which aggre- gates the perspective features into structured 3 D cells and utilizes v olume state estimation for navig ation. Liu et al. [37] lev erage multiple visual features (e.g., RGB feature, texture, color , object type, depth feature) for scene representation of nodes within the topological map. Howe ver , the method does not explicitly model geometric or contextual relations between different regions within the scene. Moreover , the final visual feature used for scene representation is obtained by summing multiple visual-feature streams into a single descriptor, which may blur the fine structural or orientation-specific information (e.g., object orientation or relative location). Existing visual navigation methods represent the scenes either using a panorama image’ s visual feature or assigning equal importance to all components/objects present within a scene, resulting in poor scene representation. Moreover , localization based on visual and object semantic information leads to suboptimal performance. This paper introduces a 360 ◦ saliency graph representation that effecti vely encodes visual, contextual, object semantic, and edge semantic information. Alongwith, this graph incorporate salient-object-based orien- tation information for navigation controls. In addition to visual navigation, se veral approaches lev erage natural language instructions within the visual en vironment, giving rise to V ision-and-Language Navigation (VLN) meth- ods. VLN inv olves not only interpreting visual inputs b ut also aligning them with linguistic cues for efficient navigation. Recent VLN approaches, including [38], [39], [15], [40], [41], [42], and [43], utilize either visual features from panoramic images or object-level representations as scene representations for localization within the navigation pipeline. This often results in suboptimal performance due to limited encoding of scene context. In contrast, this paper utilizes salient objects along with their semantic and geometric properties, orienta- tion, and the structural layout of the scene captured through contextual relationships between salient objects. I I I . P RO P O S E D M E T H O D In this section, we describe the proposed 360 ◦ saliency graph representation of the scene map and its application in localization and navigation. The proposed framew ork com- prises two major stages, namely Queryable T opological Map Generation , and Localization for Navigation as sho wn in Fig. 2. Firstly , we create a queryable topological map consisting of 360 ◦ saliency graphs as scene representation. Then, subse- quently , the generated map is utilized for scene localization to facilitate navigation, as discussed in the following subsections. A. Queryable T opological Map Generation A queryable topological map is constructed by first gen- erating a topological map T , where each node V represents a distinct location (e.g., 3 D points) such as a room, hall- way , or intersection/transition, and edges represent navig able connections between these locations. At each node V , the en vironment is captured via a panoramic RGB-D image and represented by its summary called the 360 ◦ saliency graph G , which provides a 360 -de gree understanding of the surround- ing space or scene. The queryable map supports interactive querying, enabling tasks such as determining the shortest path between two locations or identifying the current location. The 360 ◦ saliency graph G offers a compact representation of the JOURNAL OF L A T E X CLASS FILES, VOL. 14, NO. 8, A UGUST 2021 4 Building Floor Map Region Semantic Mask Object Semantic Mask T opological Map 27.3 -17.8 97.9 15.2 -37.5 -1.7 168.4 10.7 4.8 -0.5 -0.9 -171 175.9 137.7 172.2 40.4 -2.6 -24.7 -145.4 -178.3 29.5 23.7 -44.5 -179 -43.3 -18.5 -1.3 8.9 1.5 19 61.7 -118.5 -154 45.6 132 -75.2 169.5 31.6 -118.4 -1.5 -51.5 -161 scene 2 Panorama RGB-D Scene Salient Object Detection 0.124 0.154 0.23 0.283 0.188 0.329 0.350 0.219 0.145 0.675 360 ◦ Saliency Graph G 360 ◦ Query Scene (b) Localization (a) Queryable T opological Map Generation 360 ◦ Saliency Graph Generation Query Graph Scene Localization Queryable T opological Map T Current Location V g : ‘scene 2’ Positioning Pose sink, toilet, bathroomvanity , mirror handtowel door Fig. 2. Overall frame work of the proposed method for Queryable T opological Map Gener ation , and Scene Localization . For Queryable T opological Map Generation , a building is processed to extract the floor map (a 2D layout of the building), the region semantic mask (a segmentation mask labeling larger semantic regions such as rooms and hallways), and the object semantic mask (a finer-grained segmentation mask labeling individual objects) to construct a queryable topological map T that facilitates the na vigation path/topological connection between the scene locations V (nodes in red and scene transition nodes in blue). At each scene location in V , an orientation-rich 360 ◦ saliency graph G is generated from an RGB-D panorama image as a scene representation. In Scene Localization , a query panoramic RGB-D image of a scene is localized within the topological map T . For this, the query 360 ◦ saliency graph is constructed from the query image and matched against the precomputed saliency graphs G associated with the map nodes to extract the location with the highest similarity above a minimum threshold. Afterwards, positioning is performed by aligning the 360 ◦ saliency graphs of query and reference scenes to estimate the directions for navigation towards the target destination on the topological map. scene by e xtracting meaningful information and removing re- dundant content within the panoramic view . This enhances the efficienc y of querying and localization, making the navigation system more robust, scalable, and efficient. 1) T opological Map: T o create a topological map T of an indoor en vironment, we segment distinct scene points r j as nodes for this topological map. In addition to scene points r j , we include scene transition points t i as a part of the topological map T . T ransition nodes t i are defined as scene points located on the boundaries where the scene changes on the region semantic mask and lie on obstruction-free areas of the floor map. W e detect these scene transition nodes t i using boundary connectivity algorithm [44]. The region semantic mask and floor map are generated using the method giv en in [45]. In addition, object semantic mask[45] is utilized to find the obstruction-free area within the scene. W e finally construct the topological map T = ( V , A ) as a graph with nodes V = { t i } S { r j } and the adjacency matrix A which contains the topological connection between the nodes in V , estimated using the visibility graph [46] framework. Figure 2 shows an example of a generated topological map for a giv en building. The figure sho ws that the connections/edges, defined in A , successfully create the tra versable paths within a building without any obstruction. In addition, the relativ e azimuth angle ϕ between the key locations v p , v q ∈ V of the topological map T is also computed as shown in Fig. 2. Next, the scene at each node v of T is encoded as a 360 ◦ saliency graph, as discussed in the ne xt subsection. 2) 360 ◦ Saliency Graph : For a given panorama image at each node v ∈ T , we first detect objects within the scene/image using the method described in [14]. Subsequently , the salient objects are detected using the v olumetric saliency [17]. A saliency graph G = ( N , E , S ) is then constructed using salient objects {O b } n b =1 ∈ N with labels { l b } n b =1 as nodes and the contextual relationship between them as edges e a,b ∈ E ( a, b ) . The S represents the volumetric saliency score of the nodes. The edge (contextual relation) between the salient objects O a and O b is ev aluated based on geometry , i.e., spatial distance d s ( a, b ) and mean dimensions l a and l b of objects O a and O b , respecti vely , as in (1). W e further enrich the saliency graph with semantic information encoded by assigning a weight w i,j ∈ W ; w i,j = p S O a S O b to each edge as in [1]. E ( a, b ) = ( 1; if min( l a , l b ) > d s ( a, b ) 0; Otherwise (1) Next, we further enhance the scene’ s saliency graph G at node v ∈ T by adding geometric (orientation) information to make it a 360 ◦ saliency graph G . The orientation information at each node of 360 ◦ saliency graph G is encoded by adding the orientation (Polar angle ˆ ϕ , and Azimuthal angle θ ) of the object’ s centroid in the spherical coordinates system with respect to the selected axis at corresponding scene node v ∈ T . While the polar angle ˆ ϕ is computed from up (Z) JOURNAL OF L A T E X CLASS FILES, VOL. 14, NO. 8, A UGUST 2021 5 direction, the azimuthal angle θ is determined with respect to X direction. Figure 1(A) illustrates the selected reference axis ¯ l and orientation angles θ in a 360 ◦ saliency graph representation of a sample scene. This paper focuses only on ground-based navigation. Therefore, orientation is based solely on the azimuthal angle θ . The constructed 360 ◦ saliency graphs are then used for localization of the queried scene to facilitate na vigation, as discussed in the subsequent subsection. B. Scene Localization and P ositioning in Scene for Navigation Each scene in the queryable topological map is represented as a 360 ◦ saliency graph, enabling saliency-based localization. Previous works such as [17] and [1] have explored indoor localization using saliency cues. The framew ork in [17] uti- lizes visual, spatial, and directional features but lacks structural encoding, resulting in limited performance. Although [1] inte- grates visual, contextual, and semantic information, but omits high-lev el geometric cues such as 360 ◦ orientation. W e address these gaps by extending [1] with a 360 ◦ scene representation for improved localization. 1) Scene Localization: The estimated 360 ◦ saliency graphs G , as discussed in the previous subsection, are utilized for the localization in the scene map T using saliency graph-matching [1]. A panorama query scene of an unknown location v q is first con verted to the query saliency graph as G q = ( N q , E q , S q ) and subsequently , we select the candidate (possible matched) graphs G ˆ i from the 360 ◦ saliency graphs of an indoor en viron- ment G i . F or candidate graphs G ˆ i selection, Jaccard similarity index is computed as ˆ i = arg max i J ( G q , G i ) . Instead of strict matching, all graphs G i with the Jaccard index greater than 0 . 6 × max( J ( . )) (check supplementary) are selected as candidate graphs to increase the rob ustness of the graph- matching method. Next, using a node alignment matrix A , a candidate subgraph ˘ G ˆ i ⊆ G ˆ i is extracted by retaining only matched nodes to G q . The matched nodes in matrix A can be determined by considering the maximum node-wise similarity as max(Ψ( f a , ˜ f b )) . Here, Ψ( . ) is the similarity metric between the feature vectors f a and ˜ f b of a th and b th nodes of G q and G ˆ i respectiv ely . A feature vector consists of an object label, saliency score, and feature vector extracted using a ‘node2vec’ algorithm [47]. After alignment, G q and ˘ G ˆ i are matched via edge’ s triplet matching [1]. The triplet matching score I ˆ i between G q and ˘ G ˆ i is computed as I ˆ i = P P ( W ◦ M ) . Here, W and M represent the edge-weight matrix of 360 ◦ saliency graph and a matrix containing matching edges, respectiv ely . The symbol ◦ signifies the Hadamard product. The final best- matched graph among all the matched candidate subgraphs ˘ G ˆ i is determined by G m = arg max ˆ i I ˆ i . The best-matched graph’ s location v p on the topological map T is assigned to the query graph’ s location v q . 2) P ositioning: The localization step identifies the location of the query scene on the map T . Ho wev er , the position and orientation of the reference points (estimated node locations v p in T ) in the query graph G q and matched scene candidate graph G m do not get aligned as illustrated in Fig. 3. Thus, we align the reference points c and c ′ of the matched scene and query scene, respectiv ely , by first estimating the required shift using P osition Estimation , then followed by Orientation Alignment as described belo w . v 1 v 2 v 3 v ′ 1 v ′ 2 v ′ 3 G q : G m : G q : Query Graph G m : Matched Graph c & c ′ : Reference points ∆ : Shift b/w c & c ′ θ & θ ′ : Orientation angle ˆ θ : Orientation alignment angle Fig. 3. Alignment of query graph G q and matched candidate graph G m by estimating shift ∆ and orientation using underlying geometry of reference points ( c , c ′ ) and matched salient objects. A. Position Estimation: The reference points c ′ and c for the query scene graph G q and matched scene candidate graph G m , respectively , form a special Euclidean group S E (3) . The shift ∆ between reference points c and c ′ can be estimated using geometric properties of the nodes in the matched scene candidate graph for matched node pair positions ( v i , v ′ i ) in the 360 ◦ saliency graphs. Theorem 1 describes a frame work to estimate the least-square estimate for the shift ˆ ∆ . Theorem 1. Given the two structur es G 1 := { u i } N i =1 and G 2 := { v i } N i =1 with N components form a special Euclidean gr oup S E ( M ) with corr esponding components pair location ( u i , v i ) . The least squar e L 2 estimate of shift ˆ ∆ between the structur e G 1 and G 2 such that the shifted structur e ˜ G 1 and G 2 form a special Ortho gonal gr oup S O ( M ) is given by (2) , wher e L = N 2 . ˆ ∆ = 1 2 B † b, B = . . . ( u i − u j ) . . . T M × L (2) and b = . . . || u i || 2 − || u j || 2 − || v i || 2 + || v j || 2 . . . L × 1 Pr oof. Let G be a S E ( M ) group s.t. structures G 1 , G 2 ∈ G . Thus, G 2 = T ( G 1 ) , where transformation T ( . ) can be decom- posed as rotation R and translation or shifting ∆ operation as T = [ R ∆] . Thus, the shifted structure ˜ G 1 and G 2 are related through a rotation transformation only , and, thus ˜ G 1 := { u i − ∆ } N i =1 and G 2 form a special Orthogonal group S O ( M ) . For S O ( M ) , structures will satisfy the distance inv ariance property , i.e., D ( u i − ∆) = D ( v i ) under distance function D ( . ) . For L 2 distance function: || v i || 2 2 = || u i − ∆ || 2 2 ∀ ( u i , v i ) N i =1 ∈ ( G 1 , G 2 ) (3) || v i || 2 2 = ( u i − ∆) T ( u i − ∆) (4) || v i || 2 2 = || u i || 2 2 − 2∆ T u i + || ∆ || 2 2 (5) T aking two component pairs of ( u i , v i ) , ( u j , v j ) in (5) and subtracting to reduce the term || ∆ || 2 2 : || v i || 2 2 − || v j || 2 2 = || u i || 2 2 − || u j || 2 2 − 2∆ T ( u i − u j ) (6) For least square estimate of shift ˆ ∆ , on rearranging and stacking (6) all L = N 2 component pair , we obtain: . . . ( u i − u j ) T . . . | {z } B ∆ = 1 2 . . . || u i || 2 2 − || u j || 2 2 − || v i || 2 2 + || v j || 2 2 . . . | {z } b (7) JOURNAL OF L A T E X CLASS FILES, VOL. 14, NO. 8, A UGUST 2021 6 And thus least square L 2 estimate of the shift, ˆ ∆ is obtained using Moor e-P enr ose in verse B † as ˆ ∆ = 1 2 B † b . Remark 1. In the case of the 2 D navigation task in our work, the query scene graph G q and matched scene candidate graph G m form a S E (2) gr oup. And, the least squar e L 2 estimate ˆ ∆ of the shift between the r efer ence points c ′ and c , for G q and G m , respectively , is computed with geometric information of matched salient objects as per the Theorem 1. The shifted query graph ˜ G q is utilized for the orientation estimation as described in the next subsection. B. Orientation Alignment: The shifted query scene graph ˜ G q and matched scene candidate graph G m belong to the same special orthogonal group S O (3) as reference points c ′ and c are aligned. The orientation between these graphs is estimated by estimating the dif ference in orientation θ between position vectors ( v ′ i , v i ) of corresponding salient objects, i.e., matched nodes in ˜ G q and G m , respectively . Rotation framew ork such as X α Y β Z γ with rotation transformation R ( θ ) can be utilized on this S O (3) group to compute the angle θ = ( α, β , γ ) as giv en in (8). P = R ( θ ) ˜ P (8) Here, matrices P and ˜ P are formed by column-wise stack- ing of position vectors v i and v ′ i of matched nodes in G m and ˜ G q , respectively . For the case of 2 D navigation, the shifted query scene graph and matched scene candidate graph belong to S O (2) , and orientation θ between these graphs can be simply estimated as the dif ference between angles of corresponding salient objects from the X-axis as given in (9). θ = arccos( ˆ v .e 1 ) − arccos( ˆ v ′ .e 1 ) , (9) Here, e 1 denotes the unit vector along the X-axis, and . denotes the dot product. W e take a saliency weighted a verage of the estimated orientation difference between all N pairs of matched nodes of shifted query scene graph ˜ G q and matched scene candidate graph G m as orientation alignment angle ˆ θ to minimize the error as given in (8). ˆ θ = P N i =1 S i θ i P N i =1 S i (10) Next, we utilize the Floyd-W arshall [48] algorithm to find the shortest paths between current location v p and target loca- tion v q on the topological map T to facilitate navigation. F or navigation, based upon estimated shift ˆ ∆ (2) and orientation alignment ˆ θ (10), the viewer’ s current orientation θ c at v p having position c = ( X c , Y c ) is utilized to orient tow ards the next node in the shortest path to target location v q on topological map T . The current orientation θ c refers to the direction of viewer relati ve to reference direction at node v p . The proposed positioning approach is e valuated for S E (3) transformations. Panorama images are rendered at each orig- inal (ground truth) position c , as defined by the topological map, and at shifted position c ′ , obtained by applying rotations and translations. Figure 4 presents a few sample panorama images, rendered at ground truth and shifted position using ‘Blender’ 1 (see supplementary), showing the effect of the 1 https://www .blender.or g/ 8 9 T opological Map original scene at v 8 orientation difference = 22 . 4 orientation dif ference = 7 . 9 original scene at v 9 orientation difference = 13 . 8 orientation dif ference = 55 . 8 Fig. 4. Sample panorama images for different vie wer positions and orientation difference ( θ e ). change in orientation with respect to the viewer position. The estimated translational shift ˆ ∆ (2) and orientation alignment ˆ θ (10) are then used to compute the positional error E p and orientation error E θ between the original and shifted images. T able I presents the mean absolute error in position E p and orientation E θ for 105 test images. The results indicate that query scenes captured with a mean positional error of 0 . 6995 m and an orientation error of 16 . 59 0 were used for ev aluation. This demonstrates the proposed method’ s capability to support efficient navigation despite v ariations in rotations and transla- tions. As presented in Section IV, T able XII, the ev aluation indicates that the proposed method can effecti vely handle pose variations, making it well-suited for navigation scenarios in volving S E (3) transformations. T ABLE I M E AN P OS I T I ON ( E p ) A N D O R I E NTA T I ON ( E θ ) E R RO R S , C O M P UT E D B E TW E E N S H IF T E D A N D O R I GI N AL / G RO U ND - T RU T H P O SE S . # of instances E p E θ 105 0 . 6995 m 16 . 59 0 The localization and positioning, after which the vie wer ex ecutes the necessary rotation to be oriented tow ards the target node, are utilized for vision-based navigation. After ev ery determined movement to wards the target, the local- ization process is repeated iterativ ely for each intermediate node for continuous navigation. Figure 5 sho ws an example of navig ation on a topological map T of a building. As shown in the figure, at each intermediate node, the viewer begins by identifying the orientation angle θ c and moves to the next location to reach the destination v g . I V . E X P E R I M E N T S This section presents the performance analysis of the pro- posed 360 ◦ saliency graph-based scene localization and navi- gation method and compares it with state-of-the-art methods. Implementation Details: Our experimental setup in volves MA TLAB R2022a in W indows 10 en vironment with an ‘Intel Xeon’ CPU having 64 GB RAM. For ev aluation, we have utilized Matterport3d [49] dataset, containing a total of 500 scenes from 28 buildings. Each b uilding contains 5 to 41 scenes or rooms. Further , we hav e also utilized ‘Blender’ to get ne w images of dif ferent configurations for robustness ev aluation. JOURNAL OF L A T E X CLASS FILES, VOL. 14, NO. 8, A UGUST 2021 7 Query Scene Query Scene Query Scene Query Graph Query Graph Query Graph mirror, sink, handtowel, door, table, bathroomvanity , sofa, kitchen counter, tv , kitchen cabinet Fig. 5. An example of navigation on topological map. First, determine current orientation θ c at the current location ( X c , Y c ) using the saliency graph after performing localization. Next, the rotation angle θ r between the direction of the topological path and θ c is calculated after performing alignment using positioning. The navigation algorithm then adjusts the heading based on this θ r , ensuring accurate mo vement towards the next target location ( X t , Y t ) on the shortest path algorithm. A. P erformance Comparison: W e hav e compared the performance of the proposed method in terms of Localization accuracy and Navigation accuracy , as discussed in the following subsections. I. Localization Perf ormance: W e compare the localization performance of the proposed method in terms of accuracy with conv entional matching methods including detector-based matching [50], [51], [52], [53] and detector-free matching [54], [55], [56], [57], and [58]. These methods perform localization by matching image features. The features can also be obtained by detecting ke ypoints in the images, and matching is done by establishing correspondences between keypoints in a query image and those in a database image. The database image with the highest number of reliable matches is considered the best match, and its known location is used as the estimated location of the query . T o ev aluate the matches Mean Matching Accuracy (MMA) metric is used. This metric indicates the proportion of correct matches among all matches. T able II lists the MMA @ i in percentage for thresholds i ∈ (3) obtained for SO T A and the proposed method. W e observ e from the table that detector-free matching [58], [54], [55], [56], [57] achieves better MMA @ i than detector-based matching [50], [51], [52], [53]. In contrast, the proposed method results in a significant improv ement in localization accuracy in terms of the MMA @ i by introducing saliency graph matching. Thus, this reflects that the 360 ◦ saliency graph efficiently encodes the relev ant visual, semantic, and contextual information of the scene. T ABLE II L O CA L I Z A T I O N P E R FO R M A NC E C O M P A R I SO N IN T ER M S O F MM A @3 W I TH S T A T E - OF - T H E - A RT F E A T U RE M A T CH I N G - B A SE D ME T H OD S . Methods MMA@3 Methods MMA@3 SP [50]+NN 32 . 43 QuadT [55] 41.72 SP [50]+SG [53] 29 . 95 LoFTR [56] 36.07 ASLFeat [52]+NN 35 . 79 CO TR [57] 46 . 07 ALike [51]+NN 34 . 55 GT+SGAM COTR [58] 49 . 82 ASpan [54] 37 . 25 Proposed 87 . 8 (NN: Neural Network) W e also compare the localization performance of the proposed method with recent scene localization methods, including [59], [60], [43], [61], and [17] in T ab . III in terms of Accuracy Acc = (# Correctly Localized Queries)/(# T otal T est Queries). The table shows that the method LDL [59], which utilized the distribution of lines with 2 D and 3 D line distance functions, achieves the lowest localization Accuracy among all. FGPL [60] further increases the local- ization performance by incorporating the geometry of 2 D- 3 D lines. MiC [43] shows superior performance compared to LDL [59] and FGPL [60] by incorporating CLIP [62] features. The method MFP-CNN [61] sho ws an increment in the v alue of Accuracy using multi-scale feature fusion. On including the salient object’ s volumetric information for localization as in SO VS [17], the Accuracy increases by 2% . The localization using the proposed 360 ◦ saliency graph representation further enhances the accuracy by 4% by le veraging visual, contextual, and semantic information. T ABLE III C O MPA R IS O N O F M E A N A CC U R AC Y F O R S C EN E LO C A L IZ ATI O N . Methods LDL[59] FGPL[60] MiC[43] MFP-CNN[61] SO VS[17] Proposed Acc ( ↑ ) 0 . 35 0 . 71 0 . 78 0 . 80 0 . 82 0 . 86 W e additionally present a qualitative comparison of the proposed 360 ◦ saliency graph-based scene localization method against methods proposed in [59], [60], [43], [61], and [17]. T able IV shows the comparison results for a fe w test images obtained using SOT A and the proposed method. The ground truth label BiSj denotes the location or input taken from the j th scene of the i th building. W e observe that the proposed method outperforms others as it considers the salient objects as nodes (visual), saliency score (node semantics), weighted triplet (edge semantics), contextual, and geometric information of the complete surrounding (i.e., 360 ◦ ) scene. T ABLE IV S A MP L E R E S ULT S F O R S C E NE L OC A L I ZATI O N . 360 ◦ scenes with labels Predicted scene labels LDL [59] FGPL [60] MiC [43] MFP- CNN [61] SO VS [17] Proposed B31S22 B31S26 B31S22 B31S26 B31S22 B31S25 B31S22 B2S17 B2S13 B2S11 B2S17 B2S17 B2S20 B2S17 B10S5 B10S13 B10S13 B10S16 B10S10 B10S5 B10S5 Furthermore, we also analyze the rob ustness of the proposed localization method under varying focal lengths. W e hav e con- sidered a database that contains 360 ◦ saliency graphs for each JOURNAL OF L A T E X CLASS FILES, VOL. 14, NO. 8, A UGUST 2021 8 location, and query scenes are the images captured at different focal lengths. T able V reports results of the proposed 360 ◦ saliency graph-based localization against a recent method, SO VS [17], for 100 scenes. The table indicates that accuracy decreases for both methods as focal length increases due to a reduction in scene-defining objects at higher magnification. Howe ver , the proposed 360 ◦ saliency graph-based localization is much more rob ust compared to SO VS [17]. This indicates that incorporating a 360 ◦ field of vie w improv es localization robustness across v arying focal lengths. T ABLE V R O B US T N E SS O F S C EN E LO C A LI Z A T I O N AC C U RA C Y U N D E R V A RI E D F O CA L LE N G TH . Method f 2 f 3 f SO VS[17] 0 . 47 0 . 36 0 . 29 Proposed 0 . 65 0 . 50 0 . 42 II. Navigation Performance: T o assess the effecti veness of 360 ◦ saliency graph-based localization in ‘V ision-Language Navigation’ (VLN), we perform a comparativ e ev aluation of the proposed approach against several SO T A navigation meth- ods. All methods are e valuated using the same topological map (i.e., a global map) b ut differ in localization and na vigation strategies. The ev aluation includes methods such as [38], [39], [15], [40], [41], [42], and [43] on REVERIE [39] dataset. Figure 6 presents the navigation framew ork comprising two stages: saliency graph-based localization and na vigation. In the localization stage, a saliency graph representation of the query scenes associated with each location is employed. This ap- proach facilitates localization through a saliency graph match- ing. Subsequently , na vigation is performed using a method in ‘March-in-Chat’ (MiC) [43]. The results are shown in T ab . VI for ev aluation metrics Success Rate (SR) [43], Oracle Success Rate (OSR) [43], and Success rate weighted by tr ajectory P ath Length (SPL) [43]. The table sho ws that the ‘March-in-Chat’ (MiC) [43] model outperforms SOT A methods for all metrics. The MiC [43] model includes a room-and-object a ware scene perceiv er (R OASP) for predicting room type and the objects visible at the current location using CLIP [62]. Replacing room-type prediction (i.e., localization) in RO ASP with the proposed 360 ◦ saliency graph-based localization method in MiC [43] as shown in Fig. 6 results in an increase in the value of metrics OSR, SR, and SPL by 4 . 41% , 2 . 81% , and 5 . 06% , respectiv ely . This demonstrates that 360 ◦ saliency graph- based localization benefits indoor navigation by improving the localization ability of agents. Fig. 6. An example of proposed localization + MiC[43] navigation method. T ABLE VI I M P AC T OF PR O PO S E D L O CA L I Z A T IO N ME T H O D O N NAVI G A T I ON P E RF O R M AN C E . Methods Navigation Acc. OSR( ↑ ) SR( ↑ ) SPL( ↑ ) F AST -MA TTN[39] 28 . 20 14 . 40 7 . 19 CKR[15] 31 . 44 19 . 14 11 . 84 Airbert[40] 34 . 51 27 . 89 21 . 88 HOP[41] 36 . 24 31 . 78 26 . 11 DUET[42] 51 . 07 46 . 98 33 . 73 MiC[43] 62 . 37 56 . 97 43 . 60 Proposed localization+MiC[43] 66 . 78 59 . 78 48 . 66 bedroom kitchen room-type: bedroom meetingroom objects: [‘ceiling bedroom entry’, ‘floor room above’, ‘ceiling inset for fan’] [‘ceiling bedroom entry’, ‘floor room above’, ‘ceiling inset for fan’] room-type: bedroom kitchen objects: [‘table’, ‘painting’, ‘bed’, ‘tv’, ‘door’, ‘sofa’, ‘sofachair’, ‘lamp’, ‘tv’, ‘door’] [’kitchen counter’, ‘kitchen counter’, ‘door’, ‘table’, ‘painting’, ‘door’, ‘chair’, ‘chair’] Fig. 7. An example showing the room-type prediction using MiC [43] and proposed localization method. Figure 7 shows a visual comparison of the localization (room-type prediction) performed using the proposed and MiC [43] method for a few samples of 360 ◦ scene. W e observe that the MiC [43] is susceptible to failure for scenes composed of identical objects. For example, in MiC [43], the bedroom and kitchen scenes are represented/characterized by similar objects, such as a ceiling inset for a f an, etc., leading to the inaccurate localization of the kitchen as a meeting room. In contrast, the proposed scene representation that employed a 360 ◦ saliency graph ef fectively captures meaningful informa- tion about the scene based on salient objects present within each scene and provides a unique/distinctiv e representation for each scene. For example, the bedroom scene is represented by a bed, lamp, etc., whereas a kitchen counter characterizes the kitchen. Consequently , the proposed 360 ◦ saliency graph- based localization results in improved indoor navigation. T ABLE VII P E RF O R M AN C E C O M P A R I SO N O F PR O PO S E D NA V I G A T IO N FR A M E WO R K AG A I NS T M I C [ 4 3] . Methods Navigation Acc. SR( ↑ ) SPL( ↑ ) MiC[43] 56 . 97 43 . 60 Proposed Navigation 76 . 92 72 . 85 W e also present a direct comparison between the proposed navigation framew ork and MiC [43] to assess overall perfor- mance. T able VII shows the performance metrics for both methods. The results demonstrate that our approach, which lev erages 360 ◦ saliency graph-based localization and position- ing, outperforms MiC [43]. This highlights the effecti veness of a proposed topological map, where each key location is represented by a 360 ◦ saliency graph, providing a robust and informativ e map for the indoor en vironment. JOURNAL OF L A T E X CLASS FILES, VOL. 14, NO. 8, A UGUST 2021 9 B. Ablation Study W e demonstrate the significance of components used in the proposed method by observing performance v ariation via the inclusion or exclusion of these components. T ABLE VIII I M P AC T O F DI FF E R EN T CO M P O NE N T S O N L O C AL I Z A T I ON . (U S G : U N WE I G H TE D S A L I EN C Y G R A P H ) Methods Image Objects Salient objects USG 360 ◦ saliency graph Acc ( ↑ ) 0 . 68 0 . 76 0 . 82 0 . 84 0 . 86 T able VIII lists the Acc obtained for localization using image features, objects, salient objects, unweighted saliency graph (USG), and 360 ◦ saliency graph. For image feature extraction, we employ the ResNet- 101 model pre-trained on ImageNet. Object-based localization is performed using the Jaccard similarity between the sets of detected object labels in the query and dataset images. As indicated in the table, image feature-based localization achie ves the lo west accuracy , as it neglects additional object attributes such as geometric features. Localization based on a collection of detected objects results in an improved performance compared to image feature- based localization. A further increase in performance metric is observed when using a collection of salient objects for localization, as this approach incorporates salienc y scores to emphasize more informativ e objects. This highlights the sig- nificance of salienc y in impro ving scene representation. Ho w- ev er , while saliency helps prioritize relev ant objects, it does not capture contextual relationships between them. Although an unweighted salienc y graph yields further improvement by capturing structural context, it ignores edge significance. In contrast, the proposed method outperforms by using 360 ◦ saliency graph that lev erages salient objects, contextual in- formation, edge weights through volumetric saliency scoring, and spherical orientation. This demonstrates the significance of the saliency and 360 ◦ orientation used in this paper . T ABLE IX I M P AC T O F 360 0 S A LI E N C Y G R A P H - B AS E D P O S IT I O N IN G ON NA V I GAT IO N P E RF O R M AN C E . Method without 360 0 saliency graph with 360 0 saliency graph SR 58 . 73 76 . 92 Furthermore, we assess the impact of 360 ◦ saliency graph- based positioning on navigation performance in T ab . IX, using the SR as the ev aluation metric. The table indicates that incor- porating 360 ◦ saliency graph-based positioning significantly increases the navigation performance by improving orientation estimation and localization. This improv ement results from the 360 ◦ saliency graph’ s ability to effecti vely capture and integrate visual, contextual, semantic, and orientation infor- mation of salient objects, leading to a more informati ve and compact scene representation by removing redundant data (see supplementary for visual comparison). C. Further Analysis W e also analyze the robustness of the proposed 360 ◦ saliency graph-based localization with respect to the camera parameter ‘Field Of V ie w’ (FO V). A total of 82 , 360 ◦ scenes are included for ev aluation. Each 360 ◦ scene is projected into a series of normal perspective scenes with FO V 60 0 , 120 0 , and 180 0 using the toolbox in [11]. The results for ev aluation metrics are sho wn in T ab . X. The table sho ws that the lower FO V leads to poor performance metrics value due to challenges like identical scenes, non-scene-defining objects, and the absence of objects within the scene. In contrast, a larger FO V provides more detailed scene information, which leads to more accurate localization. T ABLE X E FF EC T OF F OV I N LO C A LI Z A T I O N P E RF O R M AN C E . FO V 60 0 120 0 180 0 360 ◦ Acc 0 . 37 0 . 68 0 . 79 0 . 91 Precision 0 . 44 0 . 68 0 . 80 0 . 94 Recall 0 . 63 0 . 96 0 . 98 0 . 96 T ABLE XI L O CA L I Z A T I O N O N L A RG E - S CA L E S C E NE S . # scenes or rooms Acc 6 1 . 00 12 1 . 00 42 0 . 86 106 0 . 82 W e also assess the scalability of the proposed method to large-scale indoor scenes. T able XI presents the local- ization Accuracy achie ved using the proposed method for varying numbers of scenes per building. The proposed method achiev ed good Accuracy for 106 scenes, indicating that 360 ◦ saliency graph-matching can scalably handle lar ge buildings with multiple scenes/rooms. T ABLE XII P E RTU R BATI O N A N ALY SI S . Method Localiza- Navigation Acc. tion Acc( ↑ ) SR( ↑ ) SPL( ↑ ) without perturbation 0 . 86 76 . 92 72 . 85 with spatial perturbation 0 . 82 71 . 43 63 . 68 with orientation perturbation 0 . 74 68 . 75 62 . 05 with object perturbation ( 50 %) P 1 0 . 78 69 . 71 61 . 21 with object perturbation ( 66 %) P 2 0 . 67 40 . 28 31 . 77 W e further analyzed the effect of v arious perturbations, including spatial, orientation, and object variations, on the robustness of the proposed method. T able XII lists the lo- calization and navigation performance metrics using the pro- posed method under different types of perturbation. W e notice from the table that the proposed method is robust to small perturbations. The lar ge amount of object perturbation results in the lack of correct scene information, leading to limited performance. V . C O N C L U S I O N This paper introduces a scene representation framew ork for indoor en vironments based on a topological map, where each ke y location is accompanied by an orientation-rich 360 ◦ saliency graph generated from a panorama RGB-D image to facilitate navigation. The proposed 360 ◦ saliency graph encodes rich visual, contextual, semantic, and geo- metric information by representing salient objects as nodes and their relations as edges. In addition, this paper presents a graph-matching–based localization and positioning method to demonstrate the applicability of the 360 ◦ saliency graph representation in vision-based indoor navigation. Experimental results highlight the efficacy of the proposed approach by sig- nificantly improving localization performance and robustness compared to existing methods. Consequently , the enhanced localization yields an improved navigation performance. How- ev er , the method e xhibits limited capability in dynamic en vi- ronments, where rapid scene changes can degrade localization reliability and, subsequently , navigation performance. In the future, we would like to address these limitations. R E F E R E N C E S [1] P . Meena, H. Kumar , and S. Y adav , “ An indoor scene localization method using graphical summary of multi-vie w r gb-d images, ” in ICIP . IEEE, 2024, pp. 3306–3312. JOURNAL OF L A T E X CLASS FILES, VOL. 14, NO. 8, A UGUST 2021 10 [2] C. Qin, Y . Zhang, Y . Liu, and G. Lv , “Semantic loop closure detection based on graph matching in multi-objects scenes, ” Journal of V isual Communication and Image Representation , vol. 76, p. 103072, 2021. [3] F . Labrosse, “Short and long-range visual navigation using warped panoramic images, ” Robotics and Autonomous Systems , 2007. [4] S.-E. Y u and D. Kim, “Image-based homing navigation with landmark arrangement matching, ” Information sciences , vol. 181, no. 16, 2011. [5] Y . Mehan, K. Gupta, R. Jayanti, A. Govil, S. Garg, and M. Krishna, “Questmaps: Queryable semantic topological maps for 3d scene under- standing, ” arXiv preprint , 2024. [6] D. An, H. W ang, W . W ang, Z. W ang, Y . Huang, K. He, and L. W ang, “Etpnav: Evolving topological planning for vision-language navigation in continuous environments, ” P AMI , 2024. [7] O. Kwon, D. Jung, Y . Kim, S. Ryu, S. Y eon, S. Oh, and D. Lee, “W ayil: Image-based indoor localization with wayfinding maps, ” in ICRA . IEEE, 2024. [8] S. Raj, P . R. Giordano, and F . Chaumette, “ Appearance-based indoor navigation by ibvs using mutual information, ” in ICARCV . IEEE, 2016. [9] K. Chen, J. P . De V icente, G. Sepulveda, F . Xia, A. Soto, M. V ´ azquez, and S. Savarese, “ A behavioral approach to visual na vigation with graph localization networks, ” arXiv preprint , 2019. [10] D. S. Chaplot, R. Salakhutdinov , A. Gupta, and S. Gupta, “Neural topological slam for visual navigation, ” in CVPR , 2020. [11] Y . Zhang, S. Song, P . T an, and J. Xiao, “Panocontext: A whole-room 3d context model for panoramic scene understanding, ” in ECCV . Springer , 2014. [12] J. Niu and K. Qian, “ A hand-dra wn map-based navigation method for mobile robots using objectness measure, ” IJARS , v ol. 16, no. 3, 2019. [13] H. Du, X. Y u, and L. Zheng, “Learning object relation graph and tentativ e policy for visual navigation, ” in ECCV . Springer , 2020. [14] J. Guerrero-V iu, C. Fernandez-Labrador , C. Demonceaux, and J. J. Guerrero, “What’ s in my room? object recognition on indoor panoramic images, ” in ICRA . IEEE, 2020. [15] C. Gao, J. Chen, S. Liu, L. W ang, Q. Zhang, and Q. W u, “Room- and-object aware knowledge reasoning for remote embodied referring expression, ” in CVPR , 2021. [16] T . W ang, Z. W u, F . Y ao, and D. W ang, “Graph-based en vironment representation for vision-and-language navigation in continuous envi- ronments, ” in ICASSP . IEEE, 2024. [17] P . Meena, H. Kumar, and S. Y adav , “ A volumetric saliency guided image summarization for rgb-d indoor scene classification, ” TCSVT , 2024. [18] A. Oliv a, P . Isola et al. , “Ganalyze: T ow ard visual definitions of cognitiv e image properties, ” Journal of V ision , vol. 20, no. 11, pp. 297–297, 2020. [19] J. Y . Koh, H. Lee, Y . Y ang, J. Baldridge, and P . Anderson, “Pathdreamer: A world model for indoor navigation, ” in ICCV , 2021. [20] K. Zhou, C. Guo, and H. Zhang, “Relational attention-based markov logic network for visual na vigation, ” The Journal of Supercomputing , vol. 78, no. 7, 2022. [21] H. Moravec and A. Elfes, “High resolution maps from wide angle sonar , ” in ICRA , vol. 2. IEEE, 1985. [22] K. K onolige, E. Marder -Eppstein, and B. Marthi, “Navig ation in hybrid metric-topological maps, ” in ICRA . IEEE, 2011. [23] C. Xu, C. Amato, and L. L. W ong, “Robot navigation in unseen en vironments using coarse maps, ” in ICRA . IEEE, 2024. [24] R. Liu, W . W ang, and Y . Y ang, “V olumetric en vironment representation for vision-language navigation, ” in CVPR , 2024. [25] F . T aioli, S. Rosa, A. Castellini, L. Natale, A. Del Bue, A. Farinelli, M. Cristani, and Y . W ang, “Mind the error! detection and localization of instruction errors in vision-and-language navigation, ” arXiv preprint arXiv:2403.10700 , 2024. [26] Y . Cha and D. Kim, “Omni-directional image matching for homing navigation based on optical flow algorithm, ” in ICCAS . IEEE, 2012. [27] C. Lee and D. Kim, “V isual homing navigation with haar-like features in the snapshot, ” IEEE Access , vol. 6, 2018. [28] J. Krantz, A. Gokaslan, D. Batra, S. Lee, and O. Maksymets, “W aypoint models for instruction-guided na vigation in continuous en vironments, ” in ICCV , 2021, pp. 15 162–15 171. [29] K. He, X. Zhang, S. Ren, and J. Sun, “Deep residual learning for image recognition, ” in CVPR , 2016, pp. 770–778. [30] Y . Du, C. Gan, and P . Isola, “Curious representation learning for embodied intelligence. ieee, ” in ICCV , 2021, pp. 10 388–10 397. [31] A. Khandelwal, L. W eihs, R. Mottaghi, and A. Kembhavi, “Simple b ut effecti ve: Clip embeddings for embodied ai, ” in CVPR , 2022. [32] J. Li, H. T an, and M. Bansal, “En vedit: Environment editing for vision- and-language navigation, ” in CVPR , 2022, pp. 15 407–15 417. [33] Y . Hong, Y . Zhou, R. Zhang, F . Dernoncourt, T . Bui, S. Gould, and H. T an, “Learning navigational visual representations with semantic map supervision, ” in ICCV , 2023, pp. 3055–3067. [34] G. Pramataro v , D. De Martini, M. Gadd, and P . Newman, “Boxgraph: Semantic place recognition and pose estimation from 3d lidar, ” in IROS . IEEE, 2022, pp. 7004–7011. [35] H. Xu, Q. Zhao, Y . Ma, S. W ang, C. Y an, and F . Dai, “Free-viewpoint navigation of indoor scene with 360° field of view , ” Electr onics , 2023. [36] N. Kim, O. Kwon, H. Y oo, Y . Choi, J. Park, and S. Oh, “T opological semantic graph memory for image-goal navigation, ” in CoRL . PMLR, 2023. [37] R. Liu, P . K ong, and W . Zhang, “Multiple visual features in topological map for vision-and-language navigation, ” in IR OS . IEEE, 2024. [38] X. W ang, Q. Huang, A. Celik yilmaz, J. Gao, D. Shen, Y .-F . W ang, W . Y . W ang, and L. Zhang, “Reinforced cross-modal matching and self- supervised imitation learning for vision-language navigation, ” in CVPR , 2019. [39] Y . Qi, Q. Wu, P . Anderson, X. W ang, W . Y . W ang, C. Shen, and A. v . d. Hengel, “Reverie: Remote embodied visual referring expression in real indoor environments, ” in CVPR , 2020. [40] P .-L. Guhur , M. T apaswi, S. Chen, I. Laptev , and C. Schmid, “ Airbert: In- domain pretraining for vision-and-language na vigation, ” in ICCV , 2021. [41] Y . Qiao, Y . Qi, Y . Hong, Z. Y u, P . W ang, and Q. Wu, “Hop: History-and- order aware pre-training for vision-and-language navigation, ” in CVPR , 2022. [42] S. Chen, P .-L. Guhur, M. T apaswi, C. Schmid, and I. Laptev , “Think global, act local: Dual-scale graph transformer for vision-and-language navigation, ” in CVPR , 2022. [43] Y . Qiao, Y . Qi, Z. Y u, J. Liu, and Q. W u, “March in chat: Interacti ve prompting for remote embodied referring expression, ” in ICCV , 2023. [44] R. C. Gonzalez, Digital image pr ocessing . Pearson education india, 2009. [45] N. Kim, “Object2habitatmap, ” https://github.com/bareblackfoot/ Object2HabitatMap, 2022. [46] W . Lee, G.-H. Choi, and T .-w . Kim, “V isibility graph-based path- planning algorithm with quadtree representation, ” Applied Ocean Re- sear ch , vol. 117, p. 102887, 2021. [47] A. Grover and J. Leskovec, “node2vec: Scalable feature learning for networks, ” in ACM SIGKDD-KDD , 2016. [48] Y . S. Triana and I. Syahputri, “Implementation floyd-warshall algorithm for the shortest path of garage, ” IJISRT , vol. 3, no. 2, 2018. [49] A. Chang, A. Dai, T . Funkhouser , M. Halber , M. Niessner, M. Savva, S. Song, A. Zeng, and Y . Zhang, “Matterport3d: Learning from rgb-d data in indoor en vironments, ” arXiv preprint , 2017. [50] D. DeT one, T . Malisiewicz, and A. Rabinovich, “Superpoint: Self- supervised interest point detection and description, ” in CVPR , 2018. [51] X. Zhao, X. W u, J. Miao, W . Chen, P . C. Chen, and Z. Li, “ Alike: Accurate and lightweight keypoint detection and descriptor extraction, ” TMM , vol. 25, 2022. [52] Z. Luo, L. Zhou, X. Bai, H. Chen, J. Zhang, Y . Y ao, S. Li, T . F ang, and L. Quan, “ Aslfeat: Learning local features of accurate shape and localization, ” in CVPR , 2020. [53] P .-E. Sarlin, D. DeT one, T . Malisiewicz, and A. Rabinovich, “Superglue: Learning feature matching with graph neural networks, ” in CVPR , 2020. [54] H. Chen, Z. Luo, L. Zhou, Y . T ian, M. Zhen, T . Fang, D. Mckinnon, Y . Tsin, and L. Quan, “ Aspanformer: Detector-free image matching with adaptiv e span transformer , ” in ECCV . Springer, 2022. [55] S. T ang, J. Zhang, S. Zhu, and P . T an, “Quadtree attention for vision transformers, ” arXiv preprint , 2022. [56] J. Sun, Z. Shen, Y . W ang, H. Bao, and X. Zhou, “Loftr: Detector-free local feature matching with transformers, ” in CVPR , 2021. [57] W . Jiang, E. Trulls, J. Hosang, A. T agliasacchi, and K. M. Y i, “Cotr: Correspondence transformer for matching across images, ” in ICCV , 2021. [58] Y . Zhang, X. Zhao, and D. Qian, “Searching from area to point: A hierarchical framew ork for semantic-geometric combined feature matching, ” arXiv preprint , 2023. [59] J. Kim, C. Choi, H. Jang, and Y . M. Kim, “Ldl: Line distance functions for panoramic localization, ” in ICCV , 2023. [60] J. Kim, J. Jeong, and Y . M. Kim, “Fully geometric panoramic localiza- tion, ” in CVPR , 2024. [61] W . Xie and T . Liu, “Mfp-cnn: Multi-scale fusion and pooling network for accurate scene classification, ” in ICCVIT . IEEE, 2024. [62] A. Radford, J. W . Kim, C. Hallacy , A. Ramesh, G. Goh, S. Agarwal, G. Sastry , A. Askell, P . Mishkin, J. Clark et al. , “Learning transferable visual models from natural language supervision, ” in ICML . PMLR, 2021.
Original Paper
Loading high-quality paper...
Comments & Academic Discussion
Loading comments...
Leave a Comment