Multimodal branched transport infers anatomically aligned brain reaction maps
How external stimulation is transformed into distributed reaction patterns remains unresolved at the level of propagation architecture. Existing large-scale control models quantify transition costs on prescribed networks but do not infer the routing …
Authors: Cristian Mendico
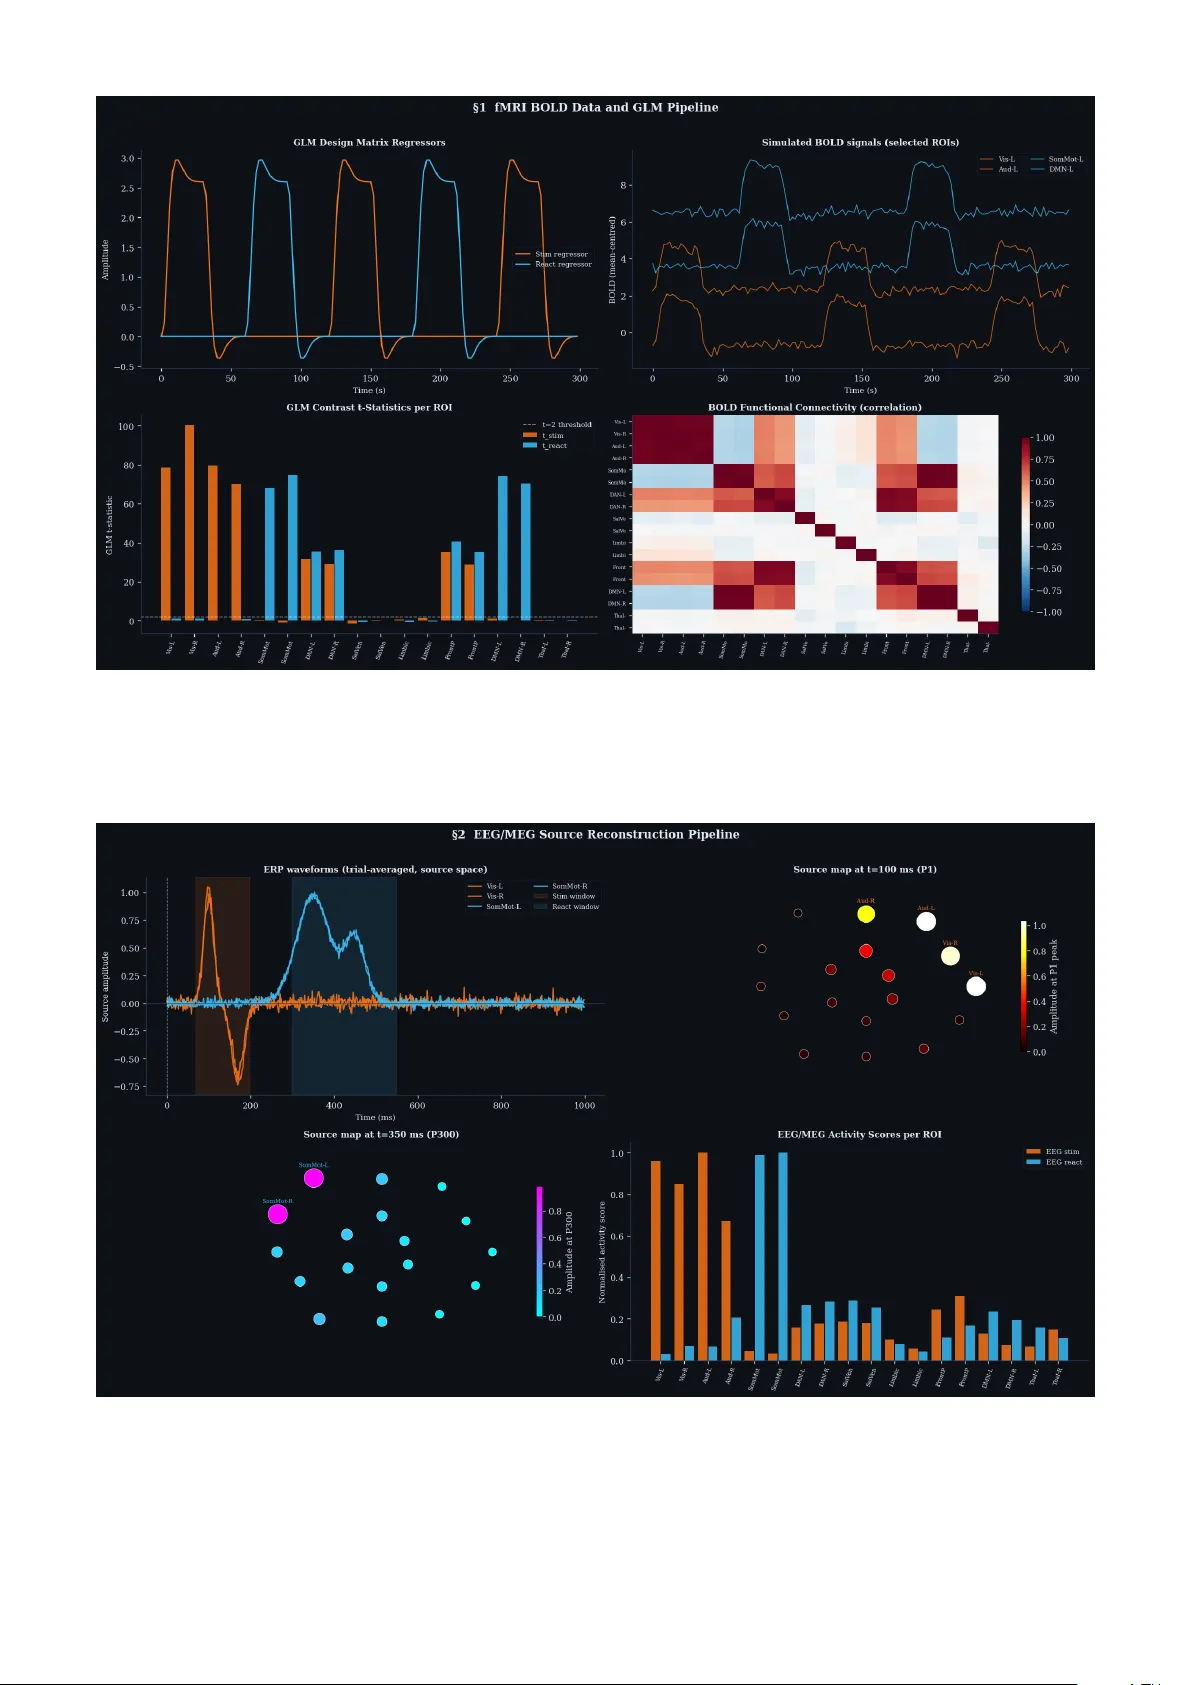
Multimo dal branc hed transp ort infers anatomically aligned brain reaction maps Cristian Mendico Institut de Mathématique de Bourgogne, UMR 5584 CNRS, Université Bourgogne Europe cristian.mendico@u-bourgogne.fr Abstract Ho w external stim ulation is transformed in to distributed reaction patterns remains unresolved at the lev el of propagation architecture. Existing large-scale control mo dels quantify transition costs on prescrib ed net w orks but do not infer the routing map itself from source and target activity . Here we combine task-related blo od-oxygen- lev el-dep enden t resp onses, source-reconstructed electrophysiology and tractography-deriv ed anisotropy to estimate stim ulation and reaction measures, define an anatomical transp ort cost, and infer a branched propagation arc hitecture b y v ariational optimisation. Unlik e standard transp ort formulations, branched transp ort fav ours aggregation of signal into shared neural high wa ys b efore redistribution. W e further attach a sto chastic graph-induced dynamics to the inferred map and quantify the trade-off b etw een geometric efficiency and dynamical con trollability . W e sho w that multimodal data generate anatomically aligned brain reaction maps, that anisotropic costs qualitatively reshap e routing backbones relative to isotropic baselines, and that hybrid geometric–dynamical optimisation reveals non-trivial rank reversals across branching regimes. In tro duction A central problem in systems neuroscience is to deter- mine how an external stimulation is propagated through the brain so as to pro duce a reaction. Curren t determinis- tic and sto chastic control approaches quan tify the cost of driving brain states on a prescrib ed structural substrate, but they do not treat the routing arc hitecture itself as an unknown [ 9 , 12 , 11 ]. In the companion theoretical pap er, we prop osed a different v ariational viewp oint: the unkno wn is a graph or current connecting a stimulation source measure to a reaction target measure, selected as the minimiser of an anisotropic branched transp ort problem [ 1 ]. In that framework, the supp ort of the min- imiser defines a br ain r e action map , namely an inferred stim ulus-to-reaction routing architecture rather than a con trolled tra jectory on a fixed netw ork [ 1 ]. The present article develops the data-driv en computa- tional counterpart of that theory . Instead of assuming ab- stract source and target measures, we estimate them from m ultimo dal neuroimaging signals. Instead of p ostulating a generic transp ort metric, we derive a geometry-aw are cost from tractograph y-informed anisotropy [ 10 , 17 , 18 ]. Instead of stopping at the geometric minimiser, w e use the inferred graph as the substrate of a sto chastic whole-brain dynamics and ev aluate the trade-off b et ween anatomical transp ort efficiency and dynamical con trol cost. This places the work at the intersection of multi- mo dal neuroimaging, connectomics and large-scale brain mo delling [ 3 , 4 , 8 , 14 , 15 ]. This leads to three concrete questions. First, can task-related blo o d-oxygen-lev el-dep endent resp onses and source-reconstructed EEG/MEG b e fused into coherent source and target measures for a transport problem? Second, do es tractography-deriv ed anisotropy substan- tially alter the inferred routing architecture relative to isotropic baselines? Third, once a graph is inferred, is the geometrically optimal map also dynamically plausible as a substrate for sto chastic state transitions? T o answer these questions, we implement the full mul- timo dal pip eline already sketc hed in the theoretical w ork [ 1 ]: (i) estimation of µ + stim and µ − react from fMRI and EEG/MEG, (ii) construction of an anisotropic trans- p ort cost from diffusion-informed tensors, (iii) branched transp ort optimisation on a candidate graph, and (iv) a h ybrid sto chastic extension built on the inferred rout- ing architecture. The resulting article is inten tionally complemen tary to the theoretical companion pap er: the theory establishes the v ariational mechanism [ 1 ], whereas the present work demonstrates that the mechanism yields biologically in terpretable, anatomically constrained and dynamically non-trivial reaction maps in a multimodal setting. Results T ask-ev ok ed fMRI defines spatially re- solv ed s tim ulation and reaction signatures W e first sim ulated a task-based blo o d-o xygen-level- dep enden t exp eriment on a common cortical supp ort with 18 regions of interest. As shown in Fig. 1 , the blo c k-design general linear mo del cleanly separates a stim ulation regressor from a reaction regressor and gen- erates region-wise con trast statistics with strong spatial selectivit y . Early task ep o chs concentrate on visually and auditorily driv en regions, whereas later task ep o chs em- phasise sensorimotor and default-mo de-related regions. The resulting blo o d-oxygen-lev el-dep endent correlation 1 structure is non-trivial and already exhibits mesoscale organisation rather than indep enden t regional resp onses. These outputs are imp ortant for tw o reasons. First, they show that the source and target measures can b e grounded in standard task-based fMRI statistics rather than hand-crafted weigh ts [ 7 , 5 ]. Second, they provide a spatially lo calised but temp orally coarse characterisation of the stimulus-to-reaction transformation, which is pre- cisely the role that fMRI should pla y in the multi mo dal pip eline. Source-reconstructed EEG/MEG resolv es the temp oral separation b et ween stimulus and reaction W e next constructed source-reconstructed electroph ys- iological data using a lead-field forward mo del and a minim um-norm in v erse pro cedure. Figure 2 shows that this modality complements bloo d-oxygen-lev el- dep enden t data exactly in the wa y needed for the trans- p ort problem: early comp onen ts concen trate in sensory en try regions, whereas later comp onents dominate in reaction-related regions. The spatial source maps at ap- pro ximately 100 ms and 350 ms rev eal a clean temp oral shift from stimulus-lock ed to reaction-lo ck ed activity . This temp oral separation is crucial. The source mea- sure µ + stim should reflect entry of the external stimula- tion in to the effective propagation architecture, whereas µ − react should reflect the later reaction-producing con- figuration. Blo o d-o xygen-lev el-dep enden t data alone lo calise these patterns but blur their timing; source- reconstructed EEG/MEG resolves them sharply . In this sense, Fig. 2 pro vides the temp oral half of the inv erse problem. The source-reconstruction viewp oint is stan- dard in modern EEG/MEG analysis and is particularly useful when one aims to distinguish early stimulus-d riv en comp onen ts from later reaction-related comp onents [ 13 ]. Multimo dal fusion yields balanced source and target probabilit y measures W e then combined the spatial sp ecificity of blo o d-oxygen- lev el-dep enden t resp onses and the temp oral precision of source-reconstructed electrophysiology through w eigh ted geometric fusion of mo dality-specific activity scores. If a fMRI i and a EEG i denote normalised regional scores, the fused stim ulation profile is a stim i = a fMRI , stim i w f a EEG , stim i 1 − w f , with w f ∈ [0 , 1] , and similarly for the reaction profile. After normalisation we obtain the balanced measures µ + stim , µ − react , b ( v ) = µ + stim − µ − react . Figure 3 shows the resulting modality-specific patterns and fused measures. The fused µ + stim remains concen- trated on sensory entry regions, while the fused µ − react shifts tow ard motor and higher-order reaction regions. A t the same time, intermediate relay regions acquire non-zero mass through cross-mo dal agreemen t rather than arbitrary assignment. The low er row of Fig. 3 sho ws tw o additional p oin ts. First, the supply–demand vector b ( v ) is sharply struc- tured, pro ducing a transp ort problem that is neither trivial nor diffuse. Second, the sensitivit y map with resp ect to the fusion parameter demonstrates that the dominan t supp ort is stable ov er a broad range of mo dal- it y weigh tings, although quan titative mass redistribution p ersists in secondary regions. The transp ort problem is therefore not b eing driv en by a fragile or mo dality- sp ecific artefact. A dditional analyses across the full α -grid confirm that the transition from weakly aggre- gated to strongly aggregated routing is contin uous ov er the stable parameter regime (Supplementary Figs. S1 and S2). Diffusion-informed anisotropy induces a directional transp ort geometry T o enco de anatomical directionalit y , we assigned to each region of interest a synthetic diffusion tensor and used it to build a lo cal anisotropic cost c ( x, τ ) = q τ ⊤ ( D ( x ) + εI ) − 1 τ . F or each candidate arc e , this induces a graph-level cost β e = Z ℓ e 0 c γ e ( s ) , ˙ γ e ( s ) ∥ ˙ γ e ( s ) ∥ ds, appro ximated numerically by midpoint quadrature along the edge. Figure 4 shows the resulting tractography-informed prior: white-matter-like rela y regions hav e high frac- tional anisotropy , principal diffusion axes introduce di- rectional preferences, and graph-level arc costs b ecome heterogeneous ev en among geometrically similar connec- tions. This construction is directly inspired by the use of diffusion-informed structure to constrain large-scale comm unication mo dels in connectomics [ 10 , 17 , 18 ]. This step is decisive b ecause it transforms the trans- p ort problem from a distance-based optimisation into a geometry-a ware in verse problem. In the isotropic baseline, short edges are generically fav oured. In the anisotropic mo del, some short edges b ecome exp ensive if they cut across implausible directions, while longer edges can b ecome fa vourable if they align with dominan t tensor axes. Thus, the anatomical prior do es not simply mo dulate the cost magnitude; it changes the directional logic of admissible propagation. Anisotropic branched transp ort infers a distinct reaction-map bac kb one W e then solved the discrete branched transp ort problem min w ≥ 0 X e ∈E β e w α e sub ject to Aw = b, with 0 < α < 1 , where the concavit y of w 7→ w α pro- motes aggregation and branching [ 16 , 1 ]. 2 Figure 1: T ask-evok ed fMRI BOLD pip eline. Sim ulated blo o d-oxygen-lev el-dep endent data analysed with a general linear mo del. Left, stimulus and reaction regressors after conv olution with the haemo dynamic resp onse. T op right, representativ e blo o d-o xygen-lev el-dep enden t signals in selected regions of interest. Bottom left, region-wise con trast statistics showing strong task selectivity . Bottom right, bloo d-oxygen-lev el-dep endent functional connectivity . This figure defines the fMRI comp onent of the source and target estimation step. Figure 2: Source-reconstructed EEG/MEG pip eline. T op left, trial-a veraged source-space ERP w av eforms showing early stimulus-lock ed and later reaction-lo ck ed comp onents. T op right, source map at ∼ 100 ms. Bottom left, source map at ∼ 350 ms. Bottom righ t, region-wise electrophysiological activity scores for the stimulation and reaction windows. This figure pro vides the temp orally resolved comp onent of the source and target estimation step. Figure 5 is the cen tral result of the pap er. The isotropic solution yields a branched architecture but 3 Figure 3: Multimo dal fusion and probabilit y measures. T op row, normalised fMRI scores, normalised EEG/MEG scores, and fused source and target measures. Bottom left, supply–demand v ector b ( v ) = µ + stim − µ − react . Bottom middle, sensitivity of µ + stim to the fusion weigh t. Bottom righ t, agreement betw een blo o d-o xygen-lev el-dep enden t and electrophysiological regional scores. This figure defines the balanced source and target measures used in the branc hed transp ort problem. Figure 4: Diffusion-informed anisotropic transp ort geometry . Left, synthetic fractional-anisotropy map across regions of interest. Middle, diffusion tensor ellipses and principal diffusion axes. Righ t, anisotropic arc costs on the candidate graph, sho wing strong directional heterogeneity . This figure defines the tractography-informed transp ort cost used in the anisotropic optimisation. remains relatively close to direct geometrical routing. The anisotropic solution, by contrast, reorganises the routing bac kb one around relay regions aligned with the tractograph y-deriv ed geometry . Sev eral branches that are only weakly expressed in the isotropic case b ecome dominan t under anisotropic costs, while some direct alternativ es disapp ear entirely . The flux comparison in Fig. 5 f shows that the t wo solutions differ not only b y small p erturbations in weigh t but by substantial redistributions of mass across edges. In other words, anisotrop y qualitativ ely reshapes the inferred reaction map. This is exactly the type of effect that fixed-substrate control mo dels cannot reveal: once the substrate is prescrib ed, anatomical anisotropy can mo dulate dynamics on that substrate, but it cannot alter whic h routing architecture is selected as the canonical bac kb one in the first place. Comparison with simpler non-branc hed baselines further shows that the concav e transp ort cost is sp ecifically resp onsible for the emer- gence of shared relay corridors (Supplementary Fig. S3). 4 Figure 5: Data-driv en branched optimal transp ort infers the brain reaction map. (a) F used µ + stim . (b) F used µ − react . (c) F ractional-anisotropy map and principal diffusion axes. (d) Isotropic branched transp ort solution. (e) Anisotropic branc hed transp ort solution. (f) Edgewise flux comparison betw een isotropic and anisotropic mo dels. The anisotropic model yields a routing backbone that is qualitatively distinct from the isotropic baseline and more strongly aligned with anatomical directional priors. Hybrid sto c hastic dynamics rev eals geometric–dynamical trade-offs and rank rev ersals Finally , we used the anisotropic optimal graph as the substrate of the h ybrid stochastic extension. On the inferred graph we defined a linear sto c hastic dynamics of the form dX t = A G,w X t dt + B stim a t dt + u t dt + C G,w dW t , with A G,w = − κI − β dyn L G,w , C G,w = σ 0 I + σ 1 D 1 / 2 G,w . The associated hybrid functional is F λ ( G, w ) = E α ( G, w ) + λJ dyn ( G, w ) . Figure 6 shows three complementary results. First, con trolled sto chastic tra jectories reach terminal states substan tially closer to the prescrib ed reaction profile than uncontrolled tra jectories, confirming that the in- ferred graph is dynamically usable as a state-transition substrate. Second, the hybrid functional reveals that graphs with lo w er geometric cost are not necessarily dy- namically preferred. Third, the Pareto fron tier across branc hing exp onents α exhibits a non-trivial geometry , with local trade-offs b etw een ramification and dynamic cost. The geometric meaning of Fig. 6 f is intuitiv e: each p oin t corresp onds to one candidate routing map, mov- ing left reduces geometric transp ort cost, and moving do wn reduces dynamic control cost. The Pareto fron- tier is the set of non-dominated maps for which one criterion cannot b e impro v ed without worsening the other. Most imp ortantly , Fig. 6 d sho ws rank rev er- sals across λ . As the weigh t of the dynamical term increases, the ordering of candidate graphs changes. A graph that is geometrically optimal can lose to a dy- namically cheaper comp etitor, and vice versa. This is a strong argumen t against using purely geometric or purely dynamical criteria in isolation. The natural ob- ject is the coupled geometric–dynamical landscap e. The graph-induced control viewp oint is consistent with re- 5 cen t w ork on sto chastic steering and Schrödinger bridge form ulations for brain state transitions [ 12 , 11 ]. 6 Figure 6: Hybrid stochastic extension on the anisotropic graph. (a) Mean tra jectories under uncon trolled and con trolled dynamics. (b) Uncon trolled path ensem ble. (c) Controlled path ensemble. (d) Hybrid functional F λ for comp eting graphs, showing rank reversals as λ v aries. (e) Brain-state snapshots. (f) Pareto frontier across branching exp onents α . This figure sho ws that geometric efficiency and dynamical controllabilit y define distinct and comp eting criteria for reaction-map selection. Discussion The main outcome of this study is that multimodal neuroimaging, tractography-informed anisotrop y and branc hed transp ort can b e integrated into a single in- v erse framework that infers propagation arc hitecture rather than presupp osing it. The inferred ob ject is not a tra jectory , not a control signal and not a predefined connectome, but a br ain r e action map : an effective rout- ing backbone that connects stim ulation to distributed resp onse under anatomical and dynamical constraints. Three conclusions emerge. First, multimodal esti- mation of source and target measures is b oth feasible and structurally informative. The combination of blo o d- o xygen-lev el-dep enden t spatial lo calisation and electro- ph ysiological temp oral resolution pro duces source and target measures that are sufficiently concentrated to driv e a non-trivial transp ort problem while remaining robust to the fusion weigh t. Second, anisotropy mat- ters at the arc hitectural level. The anisotropic branched solution is not simply a weigh ted p erturbation of the isotropic one; it activ ates a different routing logic, with stronger relay structure and clearer anatomical align- men t. Third, dynamic plausibility do es not reduce to geometric efficiency . The hybrid extension shows that the graphs preferred by transp ort cost alone need not minimise the dynamic control cost, and that rank rever- sals across λ are intrinsic rather than exceptional. The biological interpretabilit y of the inferred archi- tecture is an imp ortant p oint. In the present syn thetic setting, the relay regions selected b y the anisotropic BOT solution are not anonymous intermediates: the strongest b ottlenecks and branching interfaces emerge preferen tially in dorsal attention, salience/v entral at- ten tion, frontoparietal and thalamic no des, that is, in systems commonly interpreted as integrativ e bridges b e- t w een sensory input and distributed action or cognitive output [ 2 , 6 , 8 , 14 ]. In this sense, the mo del do es not simply reco ver short routes b etw een sources and sinks; it selects a mesoscale backbone in which anatomically and 7 functionally plausible asso ciation systems act as shared high w a ys for signal aggregation b efore redistribution. A dditional discussion of the mesoscale interpretation of rela y systems is provided in Supplementary Note 5. The in terpretation of the Pareto frontier is also imp or- tan t for readers outside optimal transp ort or v ariational analysis. Each p oin t in the ( E α , J dyn ) plane represents one candidate routing architecture, with one axis measur- ing geometric economy and the other dynamic steering cost. The frontier therefore marks the set of graphs that are optimal trade-offs b etw een these tw o criteria. Rank reversals o ccur when the preferred arc hitecture c hanges as the relative weigh t of dynamics is increased: a graph may b e the most economical one geometrically , y et cease to b e optimal once controllabilit y is taken seri- ously . This is not a tec hnical curiosit y but a conceptual message: geometry and dynamics should b e treated as coupled principles of large-scale propagation rather than as in terchangeable surrogates. Sev eral limitations remain. The present article uses syn thetic multimodal data and a low-dimensional cor- tical supp ort with 18 regions of interest, the candidate graph is finite, and the stochastic dynamics is linear. The tractography prior is represented b y a coarse tensor field rather than sub ject-sp ecific whole-brain tract re- construction. These simplifications are inten tional: they isolate the effect of multimodal source–target inference, anisotropic geometry and h ybrid selection in a trans- paren t setting. The next step is therefore clear: the framew ork should be tested on real task-based fMRI, source-lo calised EEG/MEG and tractograph y-deriv ed costs. A related concern is scalability . The current imple- men tation solv es a constrained nonlinear optimisation problem with SLSQP on a sparse candidate graph and then estimates dynamic costs by Mon te Carlo sim ulation. F or the presen t pro of-of-concept, this strategy is stable and sufficient. Scaling to human connectomes with 200 or more regions is conceptually straightforw ard but com- putationally more demanding, b ecause the n umber of candidate arcs, optimisation v ariables and rep eated dy- namic ev aluations all increase substan tially . In practice, this p oints to several natural extensions: anatomically in- formed graph sparsification, con tinuation or warm-start strategies across α , parallel ev aluation of dynamic costs, and alternative large-scale optimisation schemes based on decomp osition, pro ximal updates or differen tiable sur- rogates. The current results should therefore b e read not as a final engineering solution for whole-brain resolution, but as a v ariational proof-of-principle that motiv ates these larger-scale developmen ts. Practical routes tow ard scaling the framework b eyond the present 18-ROI pro of- of-concept are discussed in Supplementary Note 6 and Supplemen tary Fig. S4. More broadly , the framework suggests that a substan- tial part of what is often interpreted as state-transition difficult y may in fact b e a question of architecture in- ference. If the propagation substrate itself is allow ed to v ary , then the correct inv erse problem is no longer only to steer dynamics on a graph, but to determine which graph b est explains how stimulation is transformed in to reaction. In this sense, the main computational con tribu- tion of the present article should b e read together with the theoretical foundation developed in the companion pap er [ 1 ]. Metho ds Ov erview of the computational pip eline The computational workflo w consists of five successive stages: simulation of task-related blo o d-oxygen-lev el- dep enden t data, sim ulation of source-reconstructed elec- troph ysiology , multimodal fusion of stimulation and re- action measures, construction of anisotropic transp ort costs from diffusion-informed tensors, and inference of a reaction map through branched transp ort optimisation follo w ed by graph-induced sto chastic analysis. All sim- ulations were implemented in Python in a companion noteb o ok. Syn thetic cortical supp ort and region la y- out All computations were p erformed on a common supp ort made of N roi = 18 regions of in terest embedded in a t wo- dimensional cortical slice. T welv e regions w ere placed on an outer elliptical shell and six on an inner shell, pro duc- ing a coarse geometry with p eripheral sensory-asso ciation regions and inner relay regions. Regions w ere labelled to mimic visual, auditory , sensorimotor, dorsal attention, salience/v entral attention, limbic, frontoparietal, default mo de and thalamic systems. T ask-based fMRI sim ulation and general linear mo del The fMRI acquisition was simulated o ver T fmri = 300 s with rep etition time T R = 2 . 0 s, yielding N vol = 150 vol- umes. Stim ulus and reaction ep o c hs follo w ed a rep eating blo c k design consisting of 30 s stimulus, 30 s rest, 30 s reaction and 30 s rest. Neural task regressors were con- v olv ed with a canonical double-gamma haemodynamic resp onse function h ( t ) = t a 1 − 1 e − t/b 1 Γ( a 1 ) b a 1 1 − c t a 2 − 1 e − t/b 2 Γ( a 2 ) b a 2 2 , t ≥ 0 , with a 1 = 6 , a 2 = 16 , b 1 = b 2 = 1 , c = 1 / 6 , sampled on [0 , 32] s and normalised to unit p eak magnitude. The design matrix was X GLM = x stim , x react , 1 , where x stim and x react denote the haemo dynamically con v olved task regressors and 1 is the intercept. Region- wise blo o d-o xygen-lev el-dep enden t data w ere generated as Y = X GLM β true + ε, with Gaussian noise of standard deviation 0 . 15 . Positiv e stim ulus- and reaction-related contrast statistics w ere extracted as the fMRI activity scores. 8 Source-reconstructed EEG/MEG simula- tion Source-reconstructed electroph ysiological data were sim- ulated o ver a T eeg = 1 . 0 s epo ch with sampling rate f s = 512 Hz, giving N samp = 512 samples per ep o ch. Sensor-lev el data were generated on N sensor = 64 sensors placed on a circle around the cortical supp ort. The lead field L ∈ R N sensor × N roi w as defined b y in v erse-square dis- tance falloff b etw een sensors and source regions and then normalised b y its maximum entry . Source reconstruction used a minimum-norm inv erse L † = L ⊤ ( LL ⊤ + λ reg I ) − 1 , with Tikhono v regularisation parameter λ reg = 0 . 05 . Early stim ulus-lo c k ed source comp onents were placed in visual and auditory regions, whereas later reaction-lo ck ed comp onen ts w ere placed in sensorimotor and default- mo de-related regions. F orty noisy trials w ere generated and av eraged to improv e signal-to-noise ratio. Stimula- tion and reaction source scores w ere obtained from mean absolute source amplitudes ov er the windows [70 , 200] ms and [ 300 , 550] ms, resp ectively . Multimo dal fusion of source and target measures Let a fMRI , stim i , a fMRI , react i , a EEG , stim i , and a EEG , react i de- note the mo dality-specific regional scores after normal- isation to unit maximum. The fused stimulation and reaction profiles w ere defined b y w eighted geometric a v eraging, a stim i = a fMRI , stim i + ε 0 w f a EEG , stim i + ε 0 1 − w f , a react i = a fMRI , react i + ε 0 w f a EEG , react i + ε 0 1 − w f , with w f = 0 . 55 and ε 0 = 10 − 6 . The final source and target measures were µ + stim ( i ) = a stim i P j a stim j , µ − react ( i ) = a react i P j a react j , and the supply–demand vector was b = µ + stim − µ − react . Sensitivit y of the fused stimulation measure to the fusion weigh t was assessed ov er a grid w f ∈ { 0 , 0 . 125 , . . . , 1 } . Diffusion-informed anisotropic cost con- struction Syn thetic diffusion tensors D i ∈ R 2 × 2 w ere assigned to eac h region of interest. Rela y regions corresp onding to dorsal attention, salience/ven tral atten tion, frontopari- etal and thalamic systems w ere given higher anisotrop y , whereas other regions were assigned low er anisotrop y . F ractional anisotropy w as computed from the eigenv alues of eac h tensor. A candidate graph was built by a k -nearest-neigh b our rule with k = 5 , pro ducing an undirected edge set that w as duplicated into directed arcs. F or an arc e = ( i, j ) with tangen t direction τ ij and Euclidean length ℓ ij , the anisotropic edge cost w as defined by midp oint ev aluation: β aniso ij = ℓ ij q τ ⊤ ij D mid ij + εI − 1 τ ij , where D mid ij = 1 2 ( D i + D j ) and ε = 0 . 05 . F or comparison, an isotropic baseline cost w as also constructed from Euclidean distance and a scalar white-matter score. Discrete branched transp ort optimisation Let A denote the incidence matrix of the directed candi- date graph. F or a fixed branc hing exp onent α ∈ (0 , 1) , the optimisation problem was min w ≥ 0 X e ∈E β e w α e sub ject to Aw = b. The principal analyses used α = 0 . 65 . Optimisation was p erformed with SLSQP and 12 random restarts. Eac h restart was initialised from a combination of a clipp ed least-squares solution of the balance constraints and a small p ositive random p erturbation. After optimisation, fluxes b elow 10 − 4 times the maximal flux were set to zero for supp ort visualisation only . The same candidate graph and optimisation pro cedure were used for b oth isotropic and anisotropic costs. Graph-induced sto c hastic dynamics and dynamic cost The anisotropic optimal graph was conv erted in to a di- rected w eigh ted adjacency matrix W , then symmetrised to S = 1 2 ( W + W ⊤ ) . The weigh ted degree v ector d and graph Laplacian L were defined by d i = X j S ij , L = diag( d ) − S. The graph-induced sto chastic dynamics was dX t = A G,w X t dt + B stim a t dt + u t dt + C G,w dW t , with A G,w = − κI − β dyn L, C G,w = σ 0 I + σ 1 diag( √ d ) . The parameters were κ = 0 . 8 , β dyn = 0 . 4 , σ 0 = 0 . 08 , and σ 1 = 0 . 04 . The simulation horizon w as T sim = 3 . 0 s with timestep dt = 0 . 005 , giving N steps = 600 steps. P ath ensembles contained N paths = 80 trajectories. The uncontrolled pro cess corresponded to u t ≡ 0 . The con trolled process used a bridge-type feedback tow ard the target profile, u t = C G,w C ⊤ G,w m T − X t T sim − t + ε bridge , with ε bridge = 0 . 05 . Dynamic cost w as estimated b y Mon te Carlo appro ximation of the quadratic con trol functional associated with the controlled pro cess. 9 P areto and λ -analysis The anisotropic transp ort problem was rep eated ov er a grid of branching exp onents α ∈ { 0 . 20 , 0 . 20 + ∆ , . . . , 0 . 92 } , with 22 evenly spaced v alues. F or each inferred graph, the dynamic cost J dyn w as estimated numerically . The h ybrid functional F λ ( G, w ) = E α ( G, w ) + λJ dyn ( G, w ) w as ev aluated o ver λ ∈ [0 , 6] on a grid of 300 v alues. P areto p oints were obtained from the set of ( E α , J dyn ) pairs and rank reversals were iden tified by sign changes in pairwise differences of the corresp onding F λ curv es. Data a v ailability This study uses syn thetic m ultimo dal datasets gener- ated within the companion computational notebo ok. All scripts required to repro duce the simulations, figures and deriv ed measures will b e made publicly a v ailable up on publication. Co de a v ailabilit y The full pipeline, including fMRI simulation, source- reconstructed EEG/MEG, m ultimo dal fusion, anisotropic branched transp ort optimisation and sto c hastic graph dynamics, will b e dep osited in a public rep ository upon publication. Comp eting in terests The author declares no comp eting interests. References [1] C. Mendico, Branched Optimal T ransp ort for Stim- ulus to Reaction Brain Mapping, manuscript, 2026. [2] V. Bazinet, J. Y. Hansen, and B. Misic, T o wards a biologically annotated brain connectome, Natur e R eviews Neur oscienc e , 24 (2023), 747–760. [3] M. Breaksp ear, Dynamic mo dels of large-scale brain activit y , Natur e Neur oscienc e , 20 (2017), 340–352. [4] G. Deco and M. L. Kringelbach, T urbulen t-like dynamics in the human brain, Cel l R ep orts , 33 (2020), 108471. [5] O. Esteban et al., Analysis of task-based functional MRI data prepro cessed with fMRIPrep, Natur e Pr oto c ols , 15 (2020), 2186–2202. [6] P . F otiadis et al., Structure–function coupling in macroscale h uman brain net w orks, Natur e R eviews Neur oscienc e , 2024. [7] K. J. F riston, Mo dalities, mo des, and mo dels in functional neuroimaging, Scienc e , 326 (2009), 399– 403. [8] M. Gilson et al., Mo del-based whole-brain effective connectivit y to study distributed cognition in health and disease, Network Neur oscienc e , 4 (2020), 338– 373. [9] S. Gu et al., Con trollability of structural brain net w orks, Natur e Communic ations , 6 (2015), 8414. [10] P . Hagmann et al., Mapping human whole-brain structural netw orks with diffusion MRI, PL oS ONE , 2 (2007), e597. [11] S. Kamiya et al., Optimal control costs of brain state transitions in linear sto chastic systems, Journal of Neur oscienc e , 43 (2023), 270–281. [12] G. Ka wakita et al., Quantifying brain state transi- tion cost via Schrödinger bridge, Network Neur o- scienc e , 6 (2022), 118–134. [13] T. R. Knösche and J. Haueisen, EEG/MEG Sour c e R e c onstruction , Springer, 2022. [14] G. Pato w, I. Martin, Y. Sanz Perl, M. L. Kringel- bac h, and G. Deco, Whole-brain mo delling: an essen tial tool for understanding brain dynamics, Natur e R eviews Metho ds Primers , 4 (2024), Article 53. [15] A. P . P athak, D. R. Roy , and A. Banerjee, Whole- brain net work mo dels: from ph ysics to b edside, F r ontiers in Computational Neur oscienc e , 16 (2022), 866517. [16] Q. Xia, Optimal paths related to transp ort prob- lems, Communic ations in Contemp or ary Mathemat- ics , 5 (2003), 251–279. [17] C.-H. Y eh et al., Mapping structural connectivity using diffusion MRI: challenges and opp ortunities, Journal of Magnetic R esonanc e Imaging , 53 (2021), 1666–1682. [18] F. Zhang et al., Quantitativ e mapping of the brain’s structural connectivity using diffusion MRI tractog- raph y: a review, Neur oImage , 249 (2022), 118870. 10 Supplemen tary ov erview This Supplementary Information is designed to reinforce the central claims of the main manuscript along four dimensions that are esp ecially relev ant for ev aluation b y a broad multidisciplinary readership. First, it exam- ines how the inferred anisotropic routing architecture v aries with the branching exp onen t α , thereby clarifying that the rep orted reaction maps do not arise from a sin- gle isolated parameter c hoice. Second, it compares the anisotropic branc hed solution with simpler non-branched baselines, making explicit whic h features of the inferred arc hitecture are gen uinely due to the ramified ob jec- tiv e. Third, it quan tifies the relay-region structure of the inferred map, thereb y strengthening the biological inter- pretabilit y of the selected transp ort backbone. F ourth, it provides a pro of-of-principle scalability analysis, ad- dressing the natural question of whether the present framew ork can plausibly extend b eyond the 18 -ROI syn- thetic demonstration. T aken together, these supplemen tary analyses support four stronger versions of the claims made in the main text. The first is that the anisotropic reaction map is r o- bust acr oss a stable br anching r e gime , rather than b eing a fragile solution at one preferred α . The second is that the emergence of shar e d r elay c orridors is a distinctive signature of branched transp ort and is not repro duced b y simpler linear-cost or shortest-path surrogates. The third is that the strongest rela y regions are biolo gic al ly interpr etable mesosc ale b ottlene cks , not anonymous graph in termediates. The fourth is that the curren t implemen- tation should b e read as a variational pr o of-of-principle with plausible c omputational p aths to sc ale-up , rather than as an already final large-connectome engineering solution. Supplemen tary Note 1. Extended dep endence on the branc hing ex- p onen t α A defining ingredient of the mo del is the concavit y of the edge cost w α e , with 0 < α < 1 . Smaller v alues of α fa v our stronger route sharing and earlier aggregation of flux; v alues closer to 1 weak en the ramification incentiv e and pro duce more distributed routing. In the main man uscript, the principal reaction maps are sho wn for a representativ e v alue α = 0 . 65 . Here w e make explicit ho w the global observ ables and inferred supp orts b eha ve across the broader explored regime. Global observ ables across the α -grid Supplemen tary Fig. S1 reports the anisotropic geometric cost E α , the dynamic cost J dyn , and the supp ort size | e ∗ | o v er the full α -grid. The dominant trend aw ay from the transition region is clear: the geometric cost decreases as α increases, while the support size remains in a relatively stable range. The dynamic cost v aries muc h more w eakly o v er the stable regime than the geometric cost, which is one of the reasons why the Pareto structure in the main man uscript is non-trivial. A particularly imp ortant feature is the sharp anomaly around α ≈ 0 . 4 , where b oth the geometric and dynamic observ ables undergo abrupt changes and the support collapses. W e interpret this in terv al as a ne ar-de gener ate tr ansition r e gime of the optimisation landscap e rather than as the biologically relev an t op erating p oint of the framew ork. This regime is scientifically informativ e: it indicates that the mo del separates naturally in to weakly branc hed and strongly branched phases, with a narrow transition region betw een them. Ho wev er, the main conclusions of the article do not rely on that transition itself, but on the stable family of solutions around and ab o v e the main-text reference v alue α = 0 . 65 . Represen tative anisotropic maps across branc hing regimes Supplemen tary Fig. S2 sho ws anisotropic reaction maps for four represen tativ e v alues of α : 0 . 25 , 0 . 45 , 0 . 65 , and 0 . 85 . The figure makes the branching logic visually trans- paren t. Low er α v alues pro duce stronger aggregation and a smaller num b er of dominant high-load corridors, whereas larger α v alues supp ort more distributed routing across the graph. A t the same time, the large-scale organ- isation of the backbone remains recognisable across the stable range, indicating that the main pathw ays are not completely rearranged by mo dest changes in branc hing strength. This is imp ortant for interpretation. The branching exp onen t do es not merely rescale flux magnitudes; it c hanges the architecture itself. The reaction map should therefore b e understo o d as b elonging to a parameterised family of economical routing backbones, within which the main-text solution at α = 0 . 65 o ccupies an intermediate and structurally stable regime. 11 Figure 7: Supplementary Fig. S1. α -dep endence of anisotropic BOT observ ables. Left: anisotropic geometric cost E α v ersus branching exp onent α . Middle: dynamic cost J dyn v ersus α . Righ t: support size | e ∗ | v ersus α . The vertical dashed line marks the main-text v alue α = 0 . 65 . The main stable regime is interrupted by a narro w near-degenerate transition around α ≈ 0 . 4 , where the supp ort collapses and the observ ables show abrupt excursions. T able 1: Supplemen tary T able S1. Represen tative anisotropic supp orts across branching regimes. α A ctiv e arcs Qualitativ e regime 0.25 17 strong aggregation 0.45 19 p ost-transition stable regime 0.65 18 main-text reference regime 0.85 20 more distributed routing 12 Figure 8: Supplementary Fig. S2. Anisotropic brain reaction maps across branc hing regimes. Reaction maps inferred at α = 0 . 25 , 0 . 45 , 0 . 65 , and 0 . 85 . Smaller α pro duces stronger aggregation and fewer shared highw ays, whereas larger α supp orts more distributed routing. The backbone remains structurally interpretable across the stable parameter range. Supplemen tary Note 2. Compari- son with non-branc hed baselines A critical question for the interpretation of the main results is whether the inferred shared corridors are a distinctiv e outcome of anisotropic branc hed transp ort or whether they would also emerge under simpler routing principles. Supplemen tary Fig. S3 addresses this b y comparing the anisotropic BOT solution with t wo non- branc hed surrogates defined on the same source–target pair and the same candidate graph: an anisotropic linear- cost transp ort surrogate ( α = 1 ) and a greedy shortest- path surrogate. What the baseline comparison shows The comparison reveals a clear structural hierarch y . The anisotropic BOT solution concen trates transp ort on to a relativ ely small set of shared relay corridors. The linear- cost surrogate weak ens this concentration and spreads transp ort ov er a broader active supp ort. The shortest- path surrogate fragments routing even further, fav our- ing direct pairwise routes ov er mesoscale redistribution. Th us, the shar e d-highway ar chite ctur e that motiv ates the main manuscript is not simply a graph sparsity effect, nor a generic consequence of anisotropic weigh ts. It is the sp ecific consequence of combining anisotropy with a conca v e transp ort ob jective. This distinction matters b ecause it clarifies the con- ceptual gain ov er standard transp ort or routing baselines. The branched formulation do es not only connect sources to sinks c heaply; it explains why separate signal con- tributions may b ecome temp orarily co-routed through common mesoscale corridors b efore div erging to ward reaction-pro ducing regions. 13 Figure 9: Supplementary Fig. S3. Comparison with non-branched baselines. Left: anisotropic BOT with α = 0 . 65 . Middle: anisotropic linear-cost surrogate ( α = 1 ). Righ t: greedy shortest-path surrogate. The branc hed mo del concentrates transp ort on to a smaller num b er of relay corridors, whereas the non-branched surrogates distribute flux more diffusely and reduce the emergence of shared highw ays. Supplemen tary Note 3. Rela y- region statistics and mesoscale in- terpretation The main manuscript argues that the anisotropic solu- tion is biologically interpretable b ecause the strongest rela y regions are not arbitrary graph in termediates. Sup- plemen tary Fig. S5 and Supplementary T able S2 make this point quantitativ e. Dominan t rela y systems The left panel of Supplementary Fig. S5 ranks the top rela y nodes by relay score. The strongest rela ys are the bilateral thalamic no des, follow ed b y bilateral default- mo de and frontoparietal no des. The right panel sho ws no de-lev el incoming and outgoing flux, distinguishing rela y , source, and sink nodes. Relay no des lie near the diagonal because they b oth receive and redistribute sub- stan tial flo w, whereas source- and sink-dominated no des are displaced tow ard input- or output-heavy regimes. This structure is highly informativ e. A direct-routing mo del migh t hav e concen trated almost all load on domi- nan t source and target regions themselves. Instead, the branc hed anisotropic solution identifies in termediate sys- tems that act as economical redistribution b ottlenecks. In the present synthetic setting, the bilateral thalamic, default-mo de, and frontoparietal no des therefore emerge as the principal mesoscale bridge systems of the inferred reaction map. T able 2: Supplementary T able S2. Dominan t relay no des for the anisotropic solution at α = 0 . 65 . No de Rela y score Thal-R 0.3864 Thal-L 0.3839 DMN-R 0.2803 DMN-L 0.2302 F rontP ar-R 0.1205 F rontP ar-L 0.0025 Lim bic-L 0.0000 Lim bic-R 0.0000 SalV entA ttn-R 0.0000 SalV entA ttn-L 0.0000 The dominance of bilateral thalamic and default-mo de no des is especially relev ant b ecause it indicates that the inferred architecture is not merely a shortest trans- fer from sensory en try to motor output. Instead, the mo del selects a hierarchical backbone in which integra- tiv e bridge systems mediate aggregation and redistribu- tion at a mesoscale level. 14 Figure 10: Supplemen tary Fig. S5. Relay-region statistics for the anisotropic solution at α = 0 . 65 . Left: ranking of the top relay no des by rela y score. Right: no de-level incoming and outgoing flux, with relay no des shown in purple, source-dominated nodes in orange, and sink-dominated no des in blue. The dominant rela y structure is led by bilateral thalamic, default-mo de, and fron toparietal no des. Supplemen tary Note 4. Pro of-of- principle scalabilit y analysis One of the most natural concerns raised by the main man uscript is computational scalability: can the frame- w ork, demonstrated here on 18 regions of in terest, plau- sibly extend to larger connectomic resolutions? Supple- men tary Fig. S4 provides a pro of-of-principle answer. Observ ed scaling o v er the tested graph family The left panel rep orts solve r runtime as a function of graph size, while the right panel rep orts the gro wth in the num b er of directed arcs under the adopted k - nearest-neigh b our graph construction. Over the tested syn thetic graph family , the display ed log–log fits suggest a runtime scaling appro ximately prop ortional to N 2 . 02 and an edge-count scaling approximately prop ortional to N 1 . 09 . These fits should not b e ov erinterpreted as universal asymptotic la ws. Their role is differen t: they show that o v er the explored regime the candidate graph remains sparse and the solver displays roughly near-quadratic gro wth. F or the present pro of-of-principle article, this is enough to supp ort the claim that the framework is not inheren tly restricted to the 18 -ROI demonstration. In terpretation for larger connectomes A connectome with 200+ no des would still b e substan- tially more demanding, esp ecially once rep eated solves across α and rep eated dynamic-cost ev aluations are tak en in to account. How ever, the current scaling curve sup- p orts a reasonable path forward. The most natural routes to improv ed scalability are: (a) anatomically informed sparsification of candidate arcs, (b) w arm-start or contin uation strategies across neigh- b ouring α v alues, (c) parallel ev aluation of graph-dep enden t dynamic costs, (d) alternativ e large-scale solvers tailored to sparse non- linear transport problems. Th us, Supplementary Fig. S4 should b e read as evi- dence that the current implementation is a tr ansp ar ent variational pr o of-of-principle with plausible computa- tional extensions, rather than as a claim that the current SLSQP-based co de is already the final large-connectome pro duction solv er. 15 Figure 11: Supplementary Fig. S4. Scalability of the anisotropic BOT solver. Left: measured BOT run time versus graph size, with fitted p ow er-law scaling approximately proportional to N 2 . 02 . Righ t: n umber of directed arcs versus n umber of no des, with fitted scaling approximately proportional to N 1 . 09 . The graph family remains sparse, while runtime gro ws near-quadratically o ver the tested range. Supplemen tary Note 5. Strength- ened in terpretation of the supple- men tary analyses T aken together, the supplemen tary analyses reinforce the main manuscript in four decisive wa ys. First, the α -sensitivit y analysis shows that the anisotropic reaction map b elongs to a structured fam- ily of routing architectures, rather than dep ending on one isolated parameter choice. Second, the baseline comparison makes explicit that the shared relay corri- dors of the main manuscript are a genuine signature of branc hed transp ort and are not recov ered by standard non-branc hed alternatives. Third, the relay statistics demonstrate that the strongest intermediates are bio- logically in terpretable mesoscale systems rather than anon ymous connectors. F ourth, the scalabilit y analysis clarifies that the present w ork is b est understo o d as a v ariational pro of-of-principle that op ens the wa y to larger connectomic implementations. The purp ose of this Supplemen tary Information is therefore not merely additiv e. It sharp ens the man uscript’s scientific p osition. The main result is not just that one can solve a syn thetic transp ort problem on a small graph, but that a multimodal anisotropic branc hed-transp ort framework can reveal interpretable routing backbones, distinguish them from simpler base- lines, and organise them into a geometric–dynamic trade- off landscap e whose structure p ersists across a stable branc hing regime. 16
Original Paper
Loading high-quality paper...
Comments & Academic Discussion
Loading comments...
Leave a Comment