Stress Classification from ECG Signals Using Vision Transformer
Vision Transformers have shown tremendous success in numerous computer vision applications; however, they have not been exploited for stress assessment using physiological signals such as Electrocardiogram (ECG). In order to get the maximum benefit f…
Authors: Zeeshan Ahmad, Naimul Khan
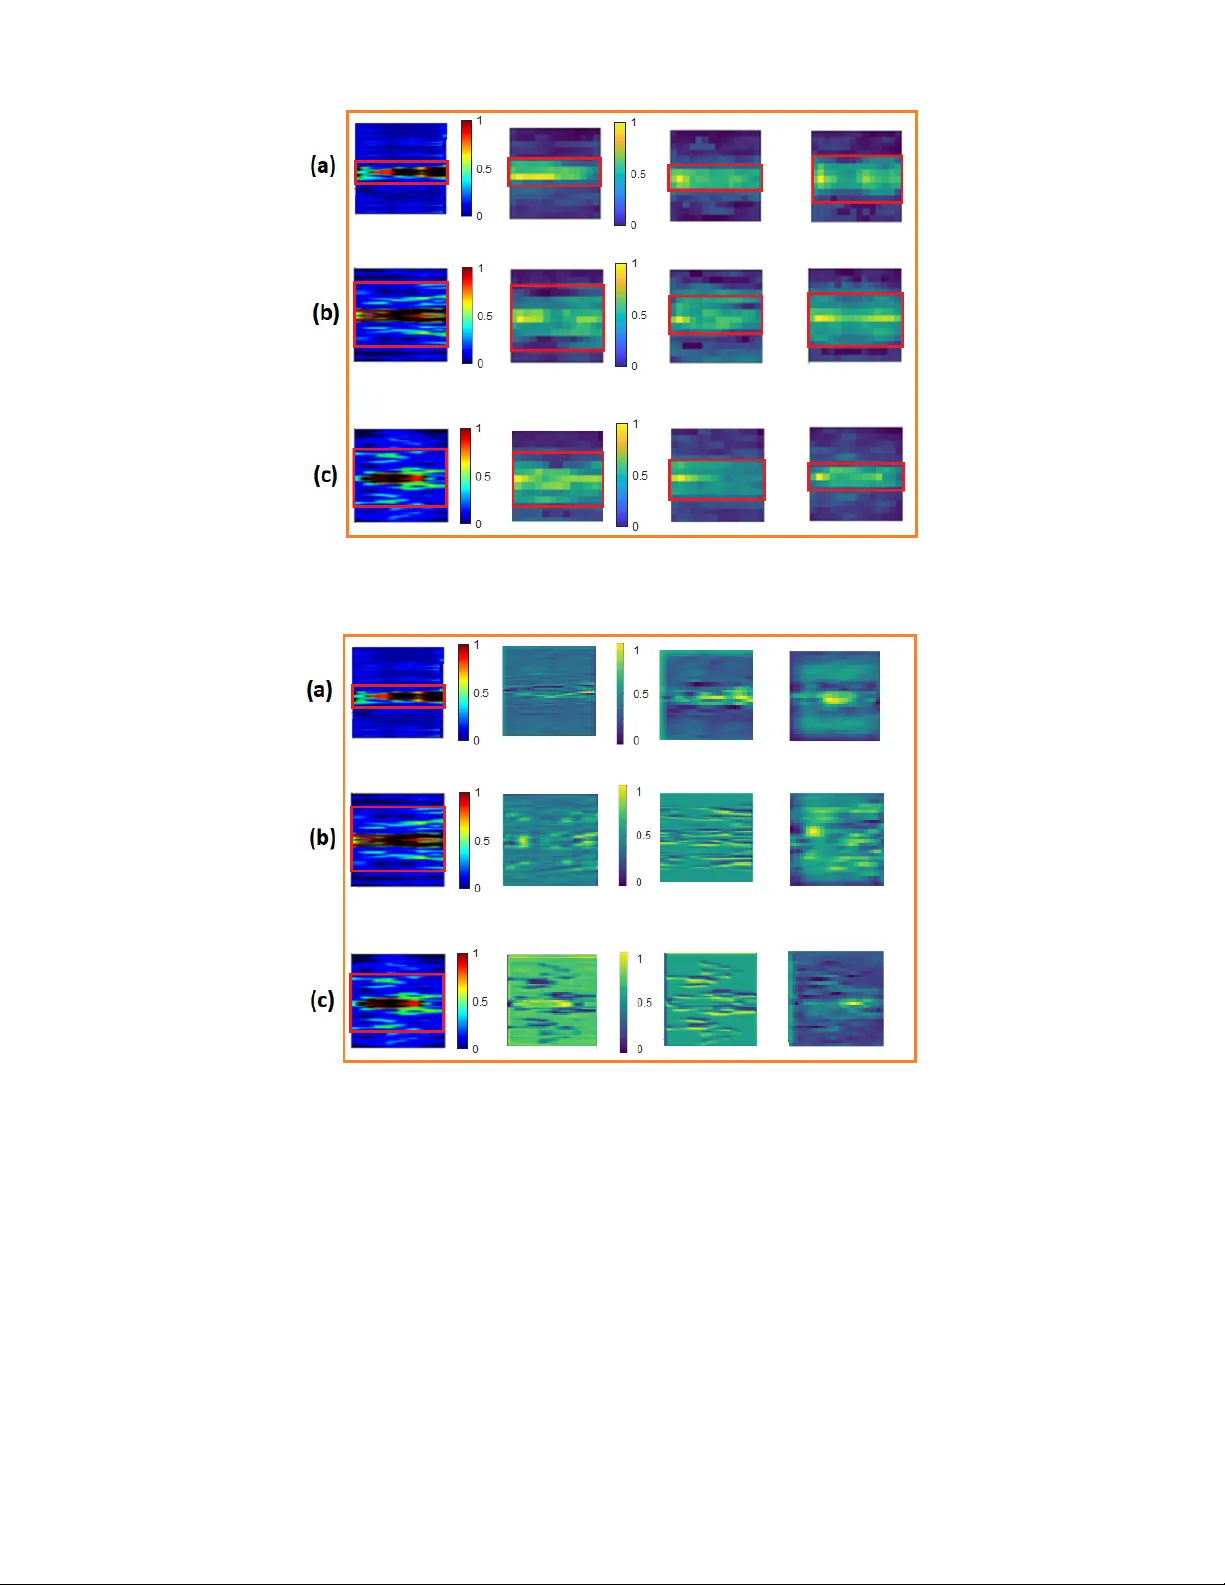
1 Stress Classification from ECG Signals Using V ision T ransformer Zeeshan Ahmad, Senior Member , IEEE , Naimul Khan, Senior Member , IEEE Abstract —V ision T ransformers ha ve sho wn tremendous suc- cess in numerous computer vision applications; however , they hav e not been exploited for str ess assessment using physiological signals such as Electrocardiogram (ECG). In order to get the maximum benefit from the vision transf ormer f or multilevel stress assessment, in this paper , we transform the raw ECG data into 2D spectrograms using short time Fourier transform (STFT). These spectr ograms ar e divided into patches for feeding to the transformer encoder . W e also perform experiments with 1D CNN and ResNet-18 (CNN model). W e perform leave-one- subject-out cross validation (LOSOCV) experiments on WESAD and Ryerson Multimedia Lab (RML) dataset. One of the biggest challenges of LOSOCV based experiments is to tackle the problem of intersubject variability . In this research, we address the issue of intersubject variability and show our success using 2D spectrograms and the attention mechanism of transformer . Experiments show that vision transformer handles the effect of intersubject variability much better than CNN-based models and beats all previous state-of-the-art methods by a considerable margin. Moreover , our method is end-to-end, does not requir e handcrafted features, and can learn robust representations. The proposed method achieved 71.01% and 76.7% accuracies with RML dataset and WESAD dataset respectively f or three class classification and 88.3% for binary classification on WESAD. Index T erms —ECG signal, self attention, spectrogram, stress analysis, vision transformer . I . I N T R OD U C T I O N Stress is an acti ve and challenging research area in the field of cognitiv e science, psychology , biomedical signal processing and affecti ve computing. Stress is recognized as one of the top ten social factors of health discrepancies by organizations such as the W orld Health Organisation (W .H.O), the American Psychological Association (A.P .A) [1]. A physiological stress is a response of a body elicited by environmental events or conditions called stressors. Stressors are external or inter- nal stimuli, ev ents or conditions. Common stressors include physical stressors, en vironmental stressors, social stressors, and mental stressors [2]. Long-term stress can have negati ve effects on both mental and physical human’ s health and can lead to chronic diseases such as eternal depression, cardiac arrest, and poor functioning of organisms such as kidneys and lungs [3]. Thus, early and precise detection of stress is crucial for human’ s health. ECG signal is readily av ailable and is non-in v asi ve in nature, therefore, it is an attractive choice among the physiological signals for stress analysis and recognition. Studies show that ECG is an instrumental signal for multilev el stress analy- sis [2], [4], [5], [6]. One of the major challenges of stress classification using ECG data is the ef fect of high intersubject variability on the performance of classification models. This effect is more evident when we experiment using LOSOCV setting in which models are trained with data from all-b ut-one subject, and tested on the held out subject. The common reasons for the high intersubject variablility are the unusual behavior of the participants during data collection and the use of uncallibrated sensors [7]. In this paper, we take up the issue of high intersubject variability and its effect on stress classification problem and we successfully reduce the effect by using 2D spectrograms and vision transformer . T ransformer was first introduced in [8] and was applied to natural language processing (NLP) tasks where it shows remarkable performance due to its attention mechanism. In- spired from the substantial success of transformer architectures in the field of NLP , a vision transformer was proposed in [9] and it achiev ed state-of-the-art performance on multiple image recognition benchmarks and is being considered as alternati ve to conv olutional neural networks (CNNs) and their high per- formance models [10], [11] for computer vision applications. V ision T ransformers (V iTs), due to their attention mecha- nism, are more capable than CNNs to learn weaker biases on backgrounds and textures. They are equipped with stronger inductiv e biases to wards shapes and structures, which is more consistent with human cognitive traits and therefore V iTs generalize better than CNNs [12]. This success is due to the attention mechanism which enables transformers to focus more on relev ant features during feature extraction process. W e also prov e this fact both quantitatively and qualitatively in sections IV and V for multilevel stress analysis. In order to get the maximum benefit of attention mechanism of vision transformer , in this research, we use vision trans- former for multilevel stress analysis using ECG signal. First, we transform the raw ECG data into 2D spectrograms using STFT and then we use these spectrgrams as input images for the encoder of vision transformer . T o use spectrogram as an input to vision transformer , we split spectrogram into patches and provide the sequence of linear embeddings of these p a tches as an input to a transformer . Spectrogram patches are treated the same way as tokens (words) were used for NLP application in [8]. W e used a pre-train vision transformer and performed stress classification from spectrograms in supervised fashion. The advantage of using pre-trained transformer is its robustness to ov erfitting when fine tuning on specific datasets and its ability to generalize well. The key contributions of the presented work are: 1) T o the best of our knowledge this is the first paper where vision transformer is used for stress analysis by transforming ra w ECG data into spectrograms using STFT and complete quantitativ e and qualitati ve analysis 2 is performed on two datasets for three classes and binary stress classification. Furthermore, the comparison between the performance of vision transformer and ResNet-18 (CNN model) is explained through experi- ments and visualizations for stress classification. 2) Using attention mechanism of vision transformer and transforming 1D ECG signal to 2D spectrograms, we achiev ed higher accuracy of stress recognition beating all the previous state-of-the-art by considerable margin. T ransformation of ECG from 1D to 2D enables trans- former to concentrate more on the most relev ant features that are not present in 1D form. 3) Through detailed experiments and visualization across the layers of vision trnasformer , we show that the vision transformer , by using its attention mechanism, addresses the intersubject variability much better than CNN and focus only on the relev ant features during the feature extraction process. The rest of the paper is organized as follows. Section II describes the related works regarding stress analysis using deep learning models. Section III provides detailed elab- oration of proposed method by covering all the technical and mathematical aspects. In section IV , we provide detailed experimental analysis, where the aforementioned contributions are analyzed in detail through large number of experiments and comparison with state-of-the-art models. In section V , we discussed our results both quantitativ ely and qualitativ ely . Section VI concludes the paper . I I . R E L A T E D W O R K Earlier methods for stress recognition were based on tra- ditional machine learning techniques where the focus w as on designing handcrafted features. These traditional machine learning techniques include Hidden Markov Model (HMM), support vector machine (SVM), linear discriminant analysis (LD A), k-means clustering, Gaussian mixture model (GMM), random forest etc [13], [14], [15], [16], [17]. In [18], various machine learning models are used for the detection of binary and three class stress using a publicly a v ail- able multimodal dataset, WESAD [19]. Sensor data including electrocardiogram (ECG), body temperature (TEMP), respi- ration (RESP), electromyogram (EMG), and electrodermal activity (ED A) are used for binary and three class problems. Enough experiments are performed to pro vide comparison among different machine learning models. The problems with classical machine learning is that the hand crafted features represents only a subset of the features resulting in difficulty to generalize for unseen data. The other problem was the requirement of domain knowledge about the data. After the resurgence of neural networks, especially the knock out performance of deep learning models in the field of computer vision and time series classification, the focus of research shifted towards using deep learning models for stress recognition. In [20], an optimized deep neural network was proposed for binary and three class stress classification using wrist-worn data from WESAD. Experiments show that proposed method outperforms traditional machine learning methods by considerable margin. In [21], a deep learning (DL) multi-kernel architecture for recognizing stress states through ECG is proposed. The proposed multikernel 1D CNN used 6-fold cross-validation and achiev ed an state-of-the-art classification accuracy as compared to single kernel CNN. In [22], a deep learning architecture is presented for the accurate detection of work-related stress using multimodal and heterogeneous signals that were acquired for this study . ECG, RESP , and facial feature data was processed through the DL structure and then feature lev el and decision level fusions were performed for better stress detection. In [23], machine learning (ML) and deep learning (DL) models were used for the clas- sification of the physiological data-induced stress conditions in high pressure driving virtual reality (VR) scene. A compre- hensiv e analysis was carried out among the significant features of the physiological signal and the raw signals as well. The observed results reveal that the VR battlefield can effecti vely arouse stress in humans, and the DL model can predict the stress condition with good accuracy . In [24], ECG-based emo- tion recognition problem is solved using self-supervised deep multi-task learning. Four datasets are used in this study to per- form emotion recognition. Experiments show that the proposed self supervised approach significantly improves classification performance compared to a fully-supervised solution. In [25], a novel deep learning model called Deep Breath is introduced which automatically recognises people’ s psychological stress lev el from their breathing patterns by transforming the patterns into thermal images. These thermal images are used as input to the CNN for binary stress classification on data collected from people exposed to two types of cognitiv e tasks (Stroop Colour W ord T est, Mental Computation test) with sessions of different difficulty levels. In [5], performance comparison of CNN with six con ventional HR V -based methods in acute cognitiv e stress detection using only 10s of ECG data, is presented. Stress was induced by mental calculation for twenty participants. Super-short temporal windows were used for it was highly desirable in many practical applications, where the real-time stress monitoring was an important feature. The results sho wed that the performance of CNN was significantly better than the conv entional methods. A novel end-to-end deep learning architecture based on CNN is proposed in [26] that uses raw ECG signals for stress detection and validated its performance with two different data sets. Experiments show that the proposed DL models perform better than traditional machine learning models. The drawback of the existing deep learning approaches is that they do not take context into account and after training the weights of their layers remain static, no matter the input. Thus to overcome this deficiency , attention-based models are being now used for stress recognition. In [27], multimodal stress analysis is performed to classify valence and arousal. Features are extracted from visual, au- dio, and text modalities using the temporal con volution and recurrent network with positional embeddings. Finally , late fusion is performed to achieve better performance. In [28], a novel end-to-end emotion recognition system based on a con v olution-augmented transformer architecture is proposed for valence and emotion classification using multiple physi- 3 Fig. 1: Overvie w of the proposed method. W e transform an ECG signal into spectrogram which is then split into flattened patches, add position embeddings and then feed to the transformer encoder . Stress recognition is performed by adding an extra learnable “classification token” to the sequence. ological signals (including blood volume pulse, electrodermal activity , heart rate, and skin temperature) collected by smart mobile. Experimental results demonstrate that the presented approach outperforms the baselines and achiev es either state- of-the-art or competitiv e performance and also generalize well on other datasets. In [29], two vision transformers are used for binary emotion recognition i.e valence and arousal from EEG data. The first method utilizes 2-D images generated through continuous wa velet transform (CWT) of the raw EEG signals and the second method directly operates on the raw signal. The proposed approaches report high accuracies for valence and arousal classification on bench mark dataset. In [30], a deep neural network based on con v olutional layers and a transformer mechanism is presented to perform binary classification of stress using ECG signals. LOSOCV based experiments are performed on two publicly av ailable datasets Our e xperiments sho w that the proposed model achie ves strong results, comparable or better than the state-of-the-art models for ECG-based stress detection. In [31], transformer-based self supervised model is proposed to process electrocardiograms (ECG) for emotion recognition. Paper highlighted the fact that the transformers are capable of learning representations for a signal by gi ving more importance to relev ant parts. Further - more, the presented approach used self-supervised learning for pre-training from unlabeled data, followed by fine-tuning with labeled data. Experimental results sho w the dominance of the proposed method. In [32], multimodal transformer , using physiological, visual, and audio modalities, is proposed for recognizing and e v oking emotions. This research also highlighted the importance of pretraining the transformer using self supervised learning so that it could perform well on downstream task. I I I . M A T E R I A L S A N D M E T H O D S In this section we explain the proposed method of multile vel stress classification from ECG signal using vision transformer . The overvie w of the proposed method is shown in Fig. 1. First, we will explain the con version of ECG signal into spectrograms and then the classification of multilev el stress by spectrograms and vision transformer . A. ECG signal to spectr ogram conver sion For using 2D representation as an input to vision trans- former , we generate spectrograms from one-second (1s) ECG segments using STFT . The formation of spectrogram from ECG signal is based on STFT below: S i ( k , l ) = M − 1 X m =0 x i ( m ) w ( l − m ) e − j 2 π M km (1) where w ( . ) is the window function, e.g., Hanning window and S i ( k , l ) is the STFT of ECG segment x i . The spectrogram is then calculated as the square modulus i.e. | S i ( k , l ) | 2 . This equation computes one value STFT , which sho ws what frequencies are present in a signal at a specific moment in time. T o do this, the signal x i ( m ) is first cut into a small 4 segment using a windo w function w ( l − m ) . which selects the part of the signal around l . Then, this windowed segment is multiplied by a complex exponential term, which extracts the frequency information for the frequency bin k . By summing all these values from m = 0 to M − 1 , the equation produces the spectrograms As examples, spectrograms of three le vels of stress for RML data are shown in Fig. 2. Fig. 2: Spectrograms representing lo w , medium, and high stress lev els from the RML dataset. Each spectrogram displays the time–frequency distribution of the ECG signal. Fig. 3: V isualization of features in spectrogram Fig. 3 sho ws the visualization of features in spectrogram. W e can see the distribution or the concentration of high intensity features is at the center of the spectrogram and these features fade out as we move away from the center of the images. The location of high intensity features at the center of the spectrogram will help transformer to use its attention mechanism and focus more on the more relev ant features for improv ed performance of stress recognition. B. V ision T ransformer The vision transformer used in proposed method consists of transformer encoder and a fully connected classifier . Trans- former encoder is pretrained on a large collection of images in a supervised fashion, namely ImageNet-21k, at a resolution of 224 x 224 pixels. It is a BER T (Bidirectional Encoder Representation of T ransformer) like encoder introduced for image classification in [9]. Images are presented to the model as a sequence of fixed- size patches (16 x 16), which are linearly embedded. [CLS] token is added at the beginning of a sequence to use it for classification tasks. Position embeddings are also added before feeding the sequence to the layers of the transformer encoder . The transformer encoder contains alternating layers of Mul- tiheaded Self-Attention (MSA) and MLP blocks (two layers of MLP with Gaussian Error Linear Unit (GELU) as an acti v ation function). Layer normalization (LN) is applied before ev ery block, and residual connections after every block [9]. The transformer encoder is shown in Fig. 4. Fig. 4: Figure shows one encoder block of a V ision Trans- former . This block is repeated L times in the full encoder as indicated by L X at the top. In order to use 2D spectrogram as an input image to vision transformer , we reshape the spectrograms S ∈ R H × W × C into a sequence of flattened 2D patches S P ∈ R N × ( P 2 × C ) as shown in Fig. 1. where, ( H × W ) is the resolution of the original spectrogram, C is the number of channels, ( P × P ) is the resolution of each spectrogram patch, and N = H W/P 2 is the resulting number of patches, which also serves as the effecti v e input sequence length for the transformer . For our experiments H = W = 224 C = 3 P = 16 Finally , before inputting the obtained flattened patches to the transformer encoder , they are first passed through a trainable linear projection layer for getting the final patch embeddings and then positional embeddings are added to the patch em- beddings for introducing positional information of the tokens in the sequence as sho wn in Fig. 1. 5 C. F eatur e extr action and classification W e fine tune the pre-trained vision transformer using the pa- rameters shown in T able. I. The encoder of vision transformer extracts the most relev ant features from input spectrogram images using its attention mechanism and other elements. Fig. 4 shows one encoder block of a V ision T ransformer . This block is repeated L times in the full encoder as in- dicated by L X at the top. Each encoder block consists of normalization layer, multi-head self-attention, MLP blocks, and residual connections. The input is normalized at two stages to stabilize training and improve learning [9]. These useful and informativ e features extracted by encoder are sent to the classifier for classification. T ABLE I: Parameters for fine tuning the vision transformer Fine T uned Parameters V alues Learning Rate 0.001 Momentum 0.9 W eight Decay 0.005 BatchSize 16 The classification task of the proposed methods is multilevel stress classification using ECG signal. The classification metrics used for classification are accu- racy , precision, recall, and F 1 score as shown in T able II to T able VIII. The accuracies, precisions and recalls are calculated using following equations. Accur acy = T P + T N T P + T N + F P + F N (2) P r ecision = T P T P + F P (3) Recal l = T P T P + F N (4) F 1 scor e = 2 × ( P r ecision × Recall ) P r ecision + Recal l (5) where, T P = True positiv e T N = T rue negati ve F P = False positi ve F N = False negati ve I V . E X P E R I M E N T A L R E S U LT S A. ECG Databases Experiments are performed with the Ryerson Multimedia Lab (RML) dataset [6] and the WESAD dataset [19]. W e perform three class classification with RML data while with WESAD dataset, we perform binary as well as three class classification. For both datasets, we perform experiments using leav e-one-subject-out cross validation (LOSOCV) setting. In LOSOCV , models are trained with data from all-but-one sub- ject, and tested on the held out subject [7]. LOSOCV is more practical than any other cross-validation method especially when the model has to be deployed for real time classification. A model trained and validated on LOSOCV always generalize well on a new subject / patient. 1) RML Dataset: For RML data collection, 9 subjects were participated and were exposed to varying stress stimuli while their physiological signals was recorded. The participants’ electrocardiogram (ECG), galvanic skin response (GSR) and respiration signals were measured. An ECG sensor , placed around the chest of the subject, was used to record the electrical activity of the heart. Data was collected at the sampling frequency of 256 Hz. In this research, we only attempted to assess stress lev els utilizing ECG. Utilizing just ECG creates a more practical solution, since it opens up the possibilities of utilizing ev en commercial wearable devices such as the Apple watch. There are three categories of stress in RML dataset. These are Low Stress, Medium Stress and High Stress. a) Baseline Experiments: W e performed baseline experi- ments with RML dataset to validate the effect of our proposed method sho wn in Fig. 1. First baseline experiment is performed using 1D CNN on raw ECG data. W e used one-second (1s) window to generate 1D snippets from raw ECG data. W e trained ID CNN on these snippets. The input to ID CNN is a snippet of size 1 x 256. Fi ve kernels of size 1 x 5 are used in first con v olutional layer, followed by 1 x 2 subsampling layer . The second conv olutional layer contains 10 filters of same size follo wed by 1 x 2 subsampling layer . The third con v olutional layer contains 10 filters of size 1 x 4 followed by 1 x 2 subsampling layer, a fully connected layer and a classification layer . The results with 1D CNN are shown in T able II. T ABLE II: Performance metrics with 1DCNN on RML dataset T esting Sub Accuracy Precision Recall F 1 Score 2 58.9 60.9 58.9 58.6 3 65.4 66.4 65.4 65.4 4 59.3 59.4 59.3 58.9 5 64.7 64.2 64.7 63.2 11 45.3 48.8 45.3 38 12 69.6 72.6 69.6 69.1 13 70.6 76.3 70.6 70.3 14 66.7 69 66.7 67.2 16 64.8 67.2 64.8 64.1 A verage 62.8 62.5 62.8 61.6 W e also performed e xperiments with time series transformer on RML Dataset. The experimental results are shown in T able III The poor performance of 1D CNN and time series trans- former on raw ECG data compelled us to change the strategy . Thus, we transform raw ECG data to 2D spectrograms as described in section III-A. W e used ResNet-18 [11] to train on spectrograms and experimental results are shown in T able IV. b) Experiments with the pr oposed method: The proposed method is shown in Fig. 1. W e fine tuned the pretrained vision transformer with the parameters shown in T able I. The experimental results are shown in T able V. 6 T ABLE III: Performance metrics with time series transformer on RML dataset T esting Sub Accuracy Precision Recall F 1 Score 2 61.5 61.7 61 61.8 3 67.18 67.83 66.94 66.95 4 57.67 57.47 57.56 56.84 5 59.94 59.45 59.65 58.84 11 40.6 36.9 38.68 37.47 12 58.68 59.78 58.31 58.51 13 60.93 60.98 60.82 60.85 14 53.4 54.3 53.12 53.22 16 57.18 56.18 56.57 55.8 A verage 57.45 57.18 56.96 56.7 T ABLE IV: Performance metrics with ResNet-18 on spectro- grams of RML dataset T esting Sub Accuracy Precision Recall F 1 Score 2 72.1 74.87 72.1 72.25 3 71.3 75.6 71.25 71.17 4 57.2 69.3 57.2 56.06 5 62.5 63.3 62.5 62.54 11 49.3 37.6 49.3 39.35 12 61.11 63.48 61.11 61.25 13 76.1 83.7 76.15 76.22 14 64 66.13 64 63.59 16 70.3 73.28 70.3 70.8 A verage 65.34 66.2 65.34 63.7 2) WESAD Dataset: WESAD is a multimodal dataset recorded with a chest-worn sensor recording ECG, accelerom- eter , EMG, respiration, and body temperature and a wrist-worn sensor recording PPG, accelerometer, electrodermal activity , and body temperature. The data were collected from 17 sub- jects; each took part in a 2-hour section. Unfortunately , due to device malfunction, data from subject 1 and 12 were discarded. For our experiments, we only used raw data obtained from the chest-worn ECG signal. In this research, experiments on this dataset were carried out for detecting and differentiating three af fectiv e states (Amusement, Baseline, Stress) and binary classification (Stress, No-stress). a) Baseline Experiments: W e perform baseline exper- iments on WESAD dataset using ResNet-18. W e train the ResNet-18 on the spectrograms of three classes (Amusement, Baseline, Stress). The experimental results are shown in T a- ble VI. b) Experiments with the pr oposed method: For v alidating the performance of our proposed method, we experiments with vision transformer using the spectrograms obtained from WESAD dataset and using the training parameters shown in T able I. The experimental results are shown in T able VII. These results shown in T ables V and VII highlighted the fact that the visions transformer outperforms ResNet-18 on both datasets. The results are discussed in detail in section V. The comparison of the results obtained from WESAD dataset using proposed method with the previous state-of-the- T ABLE V: Performance metrics with vision transformer on spectrograms of RML dataset T esting Sub Accuracy Precision Recall F 1 Score 2 73 76 73 73.5 3 76.45 82.4 76.45 76.3 4 75.14 81.6 75.14 74.4 5 69.5 69.7 69.5 69.5 11 51 62.4 51 44.7 12 72.9 78.7 72.9 73.3 13 75.5 82.5 75.5 75.5 14 71.4 74.5 71.4 70.7 16 74.2 79.1 74.2 74.4 A verage 71.01 76.32 71.01 70.5 T ABLE VI: Performance metrics with ResNet-18 on spectro- grams of WESAD data for three class classification T esting Sub Accuracy Precision Recall F 1 Score 2 75.1 74.75 75.1 73.88 3 74.34 79.75 74.34 74.72 4 76.46 80 76.46 76.74 5 79.44 81.66 79.44 79.71 6 69.2 70.1 69.2 69.38 7 72.95 75.64 72.95 73.15 8 69.2 72.81 69.2 69.9 9 65.4 69.24 65.4 66.2 10 63.69 66.36 63.69 64.5 11 82.5 83.73 82.5 82.42 13 75.33 78.64 75.33 75.38 14 82 83.14 84 82 15 66.6 67.7 66.6 66.5 16 82.85 85.81 82.85 82.74 17 85 85.34 85 84.68 A verage 74.9 77.54 75.2 75.3 art is sho wn in T able IX. W e can see that the proposed method beats the previous state-of-the-art with considerable margin. c) Binary classification with WESAD dataset: W e also performed binary classification (Stress, No-stress) with WE- SAD dataset using the proposed method. The e xperimental results for binary classification and the comparison with the previous state-of-the-art are shown in T ables VIII and X respectiv ely . Even for the binary classification, we see in T able X that the proposed method beats the previous state- of-the-art convincingly . V . D I S C U S S I O N A. Quantitative Analysis T ables IX, X show that the proposed method beats pre- vious state-of-the-art methods for both three class and bi- nary classification. Furthermore, T ables II, IV, V and T a- bles VI, VII clearly indicate that the vision transformer outper- forms ResNet-18 (CNN Model) and 1D CNN by convincing margin on both RML and WESAD datasets. The reason of this outstanding performance of vision trans- former (V iT) as compared to CNN is that during training, V iT 7 Fig. 5: V isualization of attention maps for three stress lev els. (a) Lo w stress, (b) Medium stress, and (c) High stress, each showing the spectrogram with attention maps extracted from the 1st, 5th, and 10th encoder layers. Fig. 6: V isualization of Class Activ ation Maps (CAMs) for three stress le vels: (a) lo w , (b) medium, and (c) high. Each spectrogram is shown with CAMs extracted from the 2nd, 8th, and 16th conv olutional layers of ResNet-18. learn stronger inductiv e biases tow ards shapes and structures, which is more consistent with human cognitive traits, while learn weaker biases on backgrounds and textures and thus gen- eralize better than CNNs. Furthermore, V iTs strengthen these biases and thus gradually narrow the independent identically distributed (IID) and out of distribution (OOD) generalization gaps, especially in the case of corruption shifts and background shifts. Thus, we can say that V iTs are better at diminishing the effect of local changes. [12], [34]. T ables II, IV, V and tables VI, VII clearly sho w that the ResNet-18 fails to address the problem of inter-subject variability of the data. Howe ver , transformer addressed this issue well and hence perform well on every subject. B. Qualitative Analysis In Figures 5, 6 and 7, we provide feature visualizations using attention maps, class activ ation maps and t-SNE [35] to compare the performance of vision transformer and ResNet- 18. W e extract the attention maps for Low , Medium and High Stress categories from the first, fifth and tenth layer of encoder as shown in Fig. 5(a), (b), and (c). T o provide comparison with ResNet-18, we extract the class activ ation maps (CAMs) for Low , Medium and High stress categories from the second, eighth and sixteenth con volutional layer of ResNet-18 as sho wn in Fig. 6(a), (b), and (c). From attention maps, it is clear that the transformer encoder , using its attention mechanism, concentrate more on the features with 8 Fig. 7: t-SNE visualization of extracted features for Subject 4 of the RML dataset. (a) V ision Transformer (b) ResNet-18 T ABLE VII: Performance metrics with V ision T ransformer on spectrograms of WESAD data for three class classification T esting Sub Accuracy Precision Recall F 1 Score 2 76.22 78.5 76.2 76.1 3 75.5 78.8 75.5 75.8 4 77.14 79.11 77.14 77.4 5 83.83 84.5 83.83 84.03 6 72.7 73.4 72.7 72.1 7 73.1 75.9 73.1 73.85 8 73.3 76.1 73.3 73.1 9 69.8 72.7 69.8 70.4 10 66.6 68.8 66.6 66.6 11 83.5 84.7 83.5 83.3 13 75.7 79.01 75.7 75.5 14 82.7 84 82.7 82.6 15 70.4 71.9 70.4 70.3 16 84 87.3 84 83.9 17 85.9 86.7 85.9 85.7 A verage 76.7 78.8 76.7 76.8 higher intensity and more relev ance. From class activ ation maps shown in Fig. 6(a), (b), and (c), we can see that, due to lack of attention mechanism, ResNet-18 could not focus entirely on relev ant features and also tried to capture irrelev ant background features. Furthermore, it is also observed that the CAMs extracted from ResNet-18 for High stress class are bit better than Lo w and Medium stress. This also shows that ResNet-18 requires more feature distributed input image to perform well which is not the case for vision transformer . Thus, the vision transformer addresses the intersubject vari- ability issue much better than CNN. This can be seen for all Low , Medium and High Stress spectrogram images. Fig. 7(a) and (b) shows the visualization of feature grouping of subject 4 of RML dataset using vision transformer and ResNet-18 respecti v ely . It can be clearly observed that the feature grouping with vision transformer is of more qualitativ e value than with ResNet-18. The features are tightly coupled with their categories in Fig. 7(a) than (b). In Fig. 7(b), the clus- T ABLE VIII: Performance metrics with V ision Transformer on spectrograms of WESAD data for binary classification T esting Sub Accuracy Precision Recall F 1 Score 2 87.43 87.53 87.43 87.42 3 89.3 89.7 89.3 89.3 4 86.5 86.6 86.5 86.4 5 89.1 89.7 89.1 89.1 6 85.9 85.9 85.9 85.9 7 90.9 91.2 90.9 90.9 8 87 87.8 87 86.9 9 84.9 84.9 84.9 84.9 10 83.7 84.1 83.7 83.6 11 91.5 91.8 91.5 91.4 13 87.4 87.6 87.4 87.4 14 91.4 91.8 91.4 91.3 15 84.8 85.1 84.8 84.8 16 91.1 91.3 91.1 91.1 17 93.4 93.6 93.4 93.4 A verage 88.3 88.6 88.3 88.4 T ABLE IX: Performance comparison of the proposed method On the WESAD dataset with other methods for three class classification using LOSOCV splitting. Methods Accuracy F 1 Score P .Schmidt et al. [19] 66.29 56.03 P .Garg et al. [18] 67.56 65.73 Z.Ahmad et al. [6] 72.7 73.1 Proposed Method 76.7 76.8 ters of Medium and High stress are formed at more than one places which sho ws that the features in the similar categories are loosely bound with each other . Thus, the vision transformer shows better classification performance than ResNet-18. 9 T ABLE X: Performance comparison of the proposed method on the WESAD dataset with other methods for binary classi- fication using LOSOCV splitting. Methods Accuracy F 1 Score B.Behinaein et al. [30] 80.4 69.7 P .Garg et al. [18] 84.17 83.34 P .Schmidt et al. [19] 85.44 81.31 Bota et al. [33] 85.7 - Proposed Method 88.3 88.4 V I . C O N C L U S I O N In this paper, we used vision transformer for stress as- sessment using ECG. W e transform ECG signal into 2D spectrograms for feeding to the vision transformer . W e also addresses the issue of intersubject v ariability and through experiments and vision representation, we prove that the vision transformer , using its attention mechanism, handles the effect of intersubject variability much better than CNNs model and thus beats all previous state-of-the-art methods with considerable margin. W e perform leav e-one-subject-out cross validation experiments on WESAD and Ryerson Multimedia Lab (RML) dataset to prov e the v alidity of the proposed method. In our future work, we are planning to do stress classification using raw ECG with time series transformer and design a multimodal fusion framework that could fuse features from vision transformer and time series transformer . R E F E R E N C E S [1] B. Mahesh, T . Hassan, E. Prassler, and J.-U. Garbas, “Requirements for a reference dataset for multimodal human stress detection, ” in 2019 IEEE International Conference on P ervasive Computing and Communications W orkshops (P erCom W orkshops) , 2019, pp. 492–498. [2] G. Giannakakis, D. Grigoriadis, K. Giannakaki, O. Simantiraki, A. Roni- otis, and M. Tsiknakis, “Re vie w on psychological stress detection using biosignals, ” IEEE T ransactions on Affective Computing , vol. 13, no. 1, pp. 440–460, 2019. [3] M. Giordano, P . Tirelli, T . Ciarambino, A. Gambardella, N. Ferrara, G. Signoriello, G. P aolisso, and M. V arricchio, “Screening of depressive symptoms in young–old hemodialysis patients: Relationship between beck depression in ventory and 15-item geriatric depression scale, ” Nephr on Clinical Practice , vol. 106, no. 4, pp. c187–c192, 2007. [4] Z. Ahmad and N. M. Khan, “Multi-level stress assessment using multi- domain fusion of ecg signal, ” in 2020 42nd Annual International Confer ence of the IEEE Engineering in Medicine & Biology Society (EMBC) , 2020, pp. 4518–4521. [5] J. He, K. Li, X. Liao, P . Zhang, and N. Jiang, “Real-time detection of acute cognitive stress using a conv olutional neural network from electrocardiographic signal, ” IEEE Access , vol. 7, pp. 42 710–42 717, 2019. [6] Z. Ahmad, S. Rabbani, M. R. Zafar, S. Ishaque, S. Krishnan, and N. Khan, “Multilevel stress assessment from ecg in a virtual reality en vironment using multimodal fusion, ” IEEE Sensors Journal , vol. 23, no. 23, pp. 29 559–29 570, 2023. [7] Z. Ahmad and N. Khan, “ A survey on physiological signal-based emotion recognition, ” Bioengineering , vol. 9, no. 11, p. 688, 2022. [8] A. V aswani, N. Shazeer, N. Parmar , J. Uszkoreit, L. Jones, A. N. Gomez, L. Kaiser, and I. Polosukhin, “ Attention is all you need, ” Advances in Neural Information Processing Systems , vol. 30, 2017. [9] A. Dosovitskiy , L. Beyer , A. Kolesnikov , D. W eissenborn, X. Zhai, T . Unterthiner, M. Dehghani, M. Minderer , G. Heigold, S. Gelly et al. , “ An image is worth 16x16 words: Transformers for image recognition at scale, ” International Conference on Learning Representations (ICLR) , 2021. [10] A. Krizhevsk y , I. Sutskev er , and G. E. Hinton, “Imagenet classification with deep con volutional neural netw orks, ” Communications of the ACM , vol. 60, no. 6, pp. 84–90, 2017. [11] K. He, X. Zhang, S. Ren, and J. Sun, “Deep residual learning for image recognition, ” in Pr oceedings of the IEEE Conference on Computer V ision and P attern Recognition , 2016, pp. 770–778. [12] C. Zhang, M. Zhang, S. Zhang, D. Jin, Q. Zhou, Z. Cai, H. Zhao, X. Liu, and Z. Liu, “Delving deep into the generalization of vision transformers under distribution shifts, ” in Pr oceedings of the IEEE/CVF Conference on Computer V ision and P attern Recognition , 2022, pp. 7277–7286. [13] B. D. W omack and J. H. Hansen, “Classification of speech under stress using target driv en features, ” Speech Communication , vol. 20, no. 1–2, pp. 131–150, 1996. [14] D. McDuf f, S. Gontarek, and R. Picard, “Remote measurement of cog- nitiv e stress via heart rate variability , ” in 2014 36th Annual International Confer ence of the IEEE Engineering in Medicine and Biology Society , 2014, pp. 2957–2960. [15] D. Giakoumis, A. Drosou, P . Cipresso, D. Tzovaras, G. Hassapis, A. Gaggioli, and G. Riv a, “Using activity-related behavioural features tow ards more effecti ve automatic stress detection, ” PLoS ONE , 2012. [16] H. Kurnia wan, A. V . Maslov , and M. Pechenizkiy , “Stress detection from speech and galvanic skin response signals, ” in Pr oceedings of the 26th IEEE International Symposium on Computer-Based Medical Systems , 2013, pp. 209–214. [17] M. Tsiknakis, “Stress detection from speech using spectral slope mea- surements, ” P ervasive Computing P aradigms for Mental Health , vol. 207, p. 41, 2018. [18] P . Garg, J. Santhosh, A. Dengel, and S. Ishimaru, “Stress detection by machine learning and wearable sensors, ” in 26th International Confer ence on Intelligent User Interfaces-Companion , 2021, pp. 43–45. [19] P . Schmidt, A. Reiss, R. Duerichen, C. Marberger , and K. V an Laer- hoven, “Introducing wesad, a multimodal dataset for wearable stress and affect detection, ” in Proceedings of the 20th ACM International Confer ence on Multimodal Interaction , 2018, pp. 400–408. [20] L. Huynh, T . Nguyen, T . Nguyen, S. Pirttikangas, and P . Siirtola, “Stressnas: Affect state and stress detection using neural architecture search, ” in Adjunct Pr oceedings of the 2021 A CM International Joint Confer ence on P ervasive and Ubiquitous Computing , 2021, pp. 121– 125. [21] G. Giannakakis, E. T rivizakis, M. Tsiknakis, and K. Marias, “ A nov el multi-kernel 1d conv olutional neural network for stress recognition from ecg, ” in 2019 8th International Conference on Affective Computing and Intelligent Interaction W orkshops and Demos (ACIIW) , 2019, pp. 1–4. [22] W . Seo, N. Kim, C. Park, and S.-M. Park, “Deep learning approach for detecting work-related stress using multimodal signals, ” IEEE Sensors Journal , 2022. [23] R. V aitheeshwari, S.-C. Y eh, E. H.-K. Wu, J.-Y . Chen, and C.-R. Chung, “Stress recognition based on multiphysiological data in high-pressure driving vr scene, ” IEEE Sensors Journal , vol. 22, no. 20, pp. 19 897– 19 907, 2022. [24] P . Sarkar and A. Etemad, “Self-supervised ecg representation learning for emotion recognition, ” IEEE T ransactions on Affective Computing , 2020. [25] Y . Cho, N. Bianchi-Berthouze, and S. J. Julier, “Deepbreath: Deep learning of breathing patterns for automatic stress recognition using low-cost thermal imaging in unconstrained settings, ” in 2017 Seventh International Confer ence on Affective Computing and Intelligent Inter- action (ACII) , 2017, pp. 456–463. [26] H.-M. Cho, H. Park, S.-Y . Dong, and I. Y oun, “ Ambulatory and laboratory stress detection based on raw electrocardiogram signals using a convolutional neural network, ” Sensors , vol. 19, no. 20, p. 4408, 2019. [27] A.-Q. Duong, N.-H. Ho, H.-J. Y ang, G.-S. Lee, and S.-H. Kim, “Multi- modal stress recognition using temporal convolution and recurrent net- work with positional embedding, ” in Proceedings of the 2nd Multimodal Sentiment Analysis Challenge , 2021, pp. 37–42. [28] K. Y ang, B. T ag, Y . Gu, C. W ang, T . Dingler, G. W adley , and J. Goncalves, “Mobile emotion recognition via multiple physiological signals using con volution-augmented transformer , ” 2022. [29] A. Arjun, A. S. Rajpoot, and M. R. Panicker , “Introducing attention mechanism for eeg signals: Emotion recognition with vision trans- formers, ” in 2021 43rd Annual International Confer ence of the IEEE Engineering in Medicine & Biology Society (EMBC) , 2021, pp. 5723– 5726. [30] B. Behinaein, A. Bhatti, D. Rodenbur g, P . Hungler, and A. Etemad, “ A transformer architecture for stress detection from ecg, ” in 2021 International Symposium on W earable Computers , 2021, pp. 132–134. 10 [31] J. V azquez-Rodriguez, G. Lefebvre, J. Cumin, and J. L. Crowley , “T ransformer-based self-supervised learning for emotion recognition, ” in 2022 26th international confer ence on pattern r ecognition (ICPR) , 2022, pp. 2605–2612. [32] J. V azquez-Rodriguez, “Using multimodal transformers in affectiv e com- puting, ” in 2021 9th International Conference on Affective Computing and Intelligent Interaction W orkshops and Demos (ACIIW) , 2021, pp. 1–5. [33] P . Bota, C. W ang, A. Fred, and H. Silva, “Emotion assessment using feature fusion and decision fusion classification based on physiological data: Are we there yet?” Sensors , vol. 20, no. 17, p. 4723, 2020. [34] X. Chen, C.-J. Hsieh, and B. Gong, “When vision transformers outper- form resnets without pre-training or strong data augmentations, ” ICLR Confer ence P aper , 2022. [35] L. V an der Maaten and G. Hinton, “V isualizing data using t-sne, ” J ournal of Machine Learning Resear ch , vol. 9, no. 11, 2008. Dr . Zeeshan Ahmad (senior member, IEEE) is as an Assistant Professor at University of Niagara Falls Canada. He earned his B.Eng in Electrical Engi- neering from NED University of Engineering and T echnology , Karachi, Pakistan in 2001 and M.Sc in Electrical Engineering from National Uni versity of Sciences and T echnology (NUST), Pakistan in 2005. Zeeshan joined Department of Electrical, Computer and Biomedical Engineering at T oronto Metropolitan Univ ersity in 2015 and earned his M.Eng in 2017 and Ph.D. in 2021 with specialization in Deep Learn- ing for Computer Vision. From 2021 to 2024, Zeeshan worked as Postdoctoral Fellow at T oronto Metropolitan University . His teaching and research include Data Analytics, Deep Learning for Computer V ision and NLP , Multimodal Machine Learning, and Physiological Signal Processing. Dr . Naimul Khan (senior member , IEEE) is an asso- ciate professor in Electrical and Computer Engineer- ing at T oronto Metropolitan Uni versity with a cross- appointment at the creative school (Digital Media). He is the director of the TMU Multimedia Research Laboratory . His interdisciplinary work spans arti- ficial intelligence, physiological signal processing, and immersive technologies, with applications in health, accessibility , and human-computer interac- tion. He leads projects that integrate multimodal data (such as EEG, ECG, and video) with machine learning to dev elop real-time, personalized systems for emotion recognition, digital mental health, and therapeutic VR.
Original Paper
Loading high-quality paper...
Comments & Academic Discussion
Loading comments...
Leave a Comment