CAPSUL: A Comprehensive Human Protein Benchmark for Subcellular Localization
Subcellular localization is a crucial biological task for drug target identification and function annotation. Although it has been biologically realized that subcellular localization is closely associated with protein structure, no existing dataset o…
Authors: Yicheng Hu, Xinyu Lin, Shulin Li
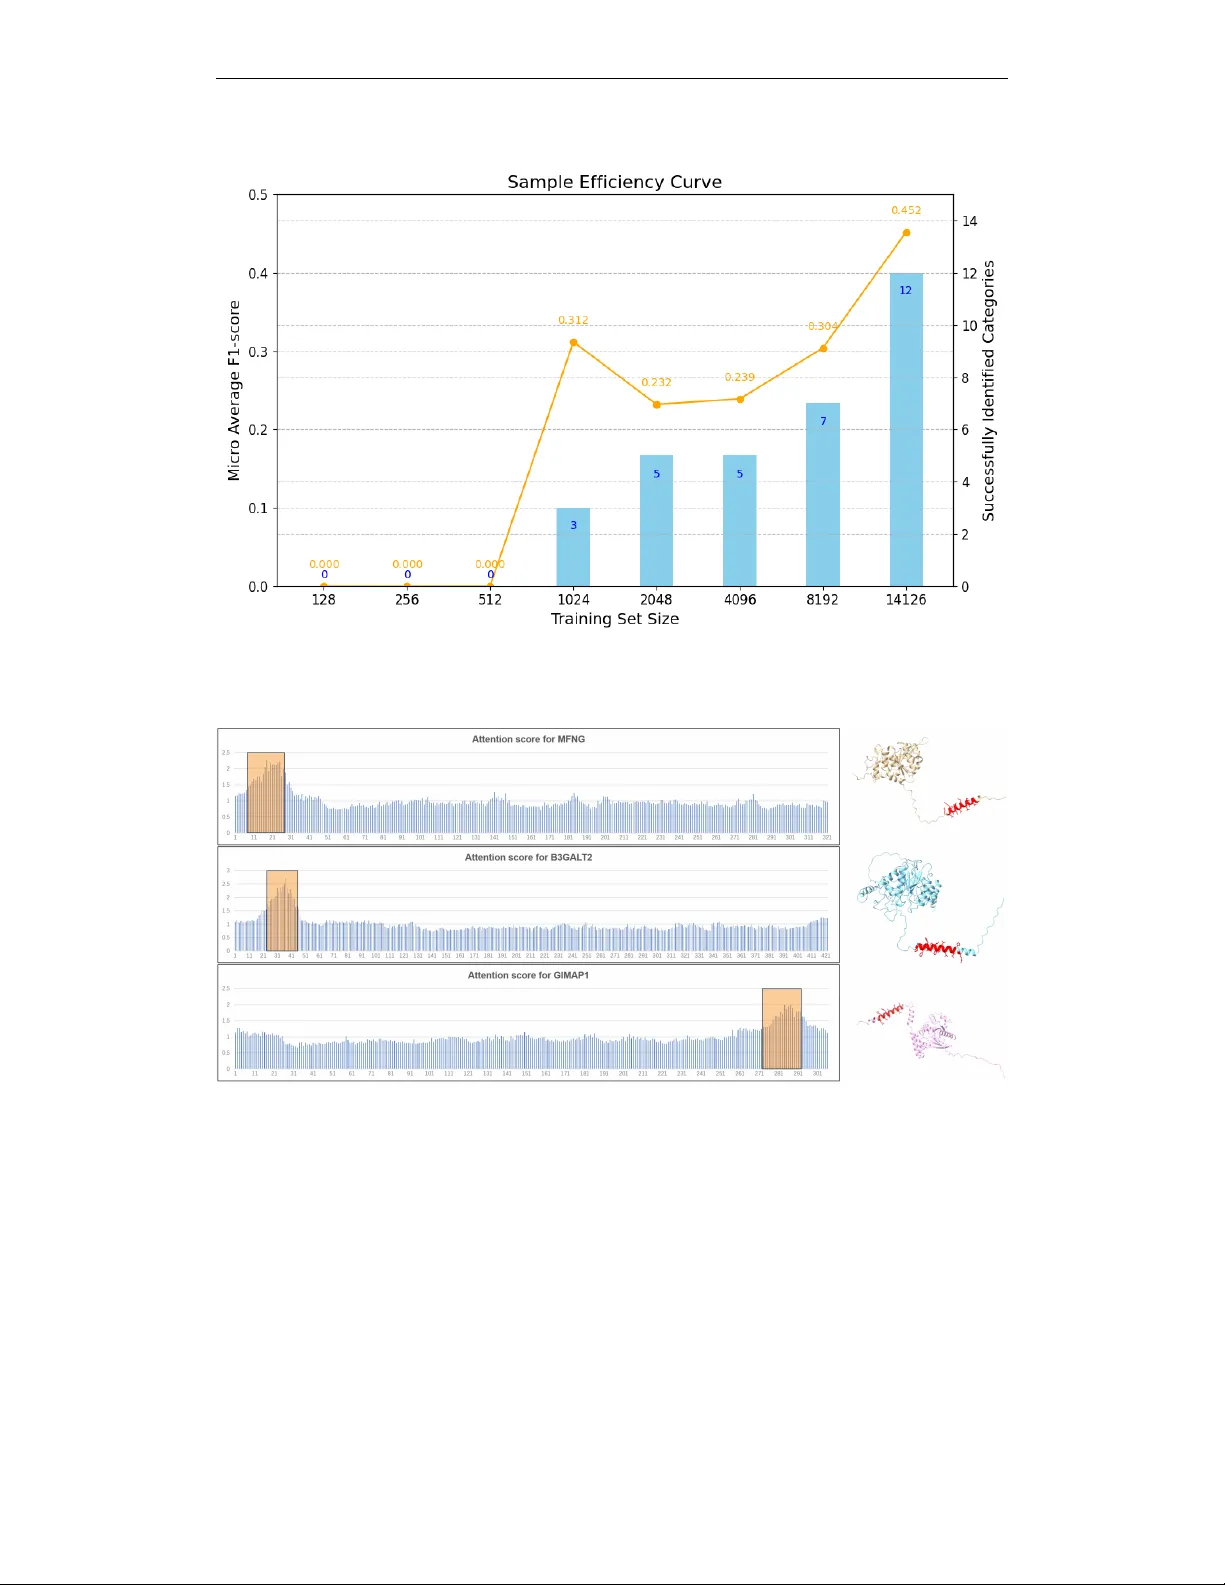
Published as a conference paper at ICLR 2026 C A P S U L : A C O M P R E H E N S I V E H U M A N P RO T E I N B E N C H M A R K F O R S U B C E L L U L A R L O C A L I Z A T I O N Y icheng Hu 1 , Xinyu Lin 2 , Shulin Li 3 ∗ , W enjie W ang 1 , Fengbin Zhu 2 † , Fuli Feng 1 1 Univ ersity of Science and T echnology of China, 2 National Univ ersity of Singapore, 3 Tsinghua Univ ersity A B S T R AC T Subcellular localization is a crucial biological task for drug target identification and function annotation. Although it has been biologically realized that subcel- lular localization is closely associated with protein structure, no existing dataset offers comprehensi ve 3D structural information with detailed subcellular localiza- tion annotations, thus severely hindering the application of promising structure- based models on this task. T o address this gap, we introduce a new benchmark called CAPSUL , a C omprehensiv e hum A n P rotein benchmark for SU bcellular L ocalization. It features a dataset that integrates div erse 3D structural represen- tations with fine-grained subcellular localization annotations carefully curated by domain experts. W e ev aluate this benchmark using a variety of state-of-the-art sequence-based and structure-based models, showcasing the importance of in- volving structural features in this task. Furthermore, we explore reweighting and single-label classification strategies to facilitate future in vestigation on structure- based methods for this task. Lastly , we showcase the powerful interpretability of structure-based methods through a case study on the Golgi apparatus, where we discov er a decisiv e localization pattern α -helix from attention mechanisms, demonstrating the potential for bridging the gap with intuitive biological inter- pretability and paving the w ay for data-driv en discov eries in cell biology . 1 I N T RO D U C T I O N Understanding the subcellular localization of proteins is a fundamental question in cell biology , as a protein’ s function is often tightly coupled to its spatial context within the cell ( Scott et al. , 2005 ). Localization information is essential for elucidating molecular mechanisms such as signal transduc- tion, metabolic regulation, and organelle-specific functions ( Hung et al. , 2017 ). It also provides a foundation for translational applications such as drug design ( Hung et al. , 2017 ; Rajendran et al. , 2010 ). Recently , the data-driv en AI approaches ha ve emerged as a po werful paradigm for predicting whether or not a protein will be localized to a specific subcellular location. These methods substan- tially reduce the time and cost associated with traditional experimental techniques while holding promise for rev ealing novel biological patterns, thereby showcasing promising performance and at- tracting extensiv e research attention ( Thumuluri et al. , 2022 ; St ¨ ark et al. , 2021 ; Almagro Armenteros et al. , 2017 ; K obayashi et al. , 2022 ; Elnaggar et al. , 2021 ). Howe ver , there remains a significant scarcity of high-quality datasets designed for this task. T o the best of our knowledge, the only widely accepted dataset targeting this problem in the AI field is DeepLoc ( Thumuluri et al. , 2022 ; Almagro Armenteros et al. , 2017 ), which contains the amino acid sequence information for each protein. DeepLoc has spurred the dev elopment of numerous sequence-based models for subcellular localization that infer localization solely from amino acid se- quences. Nevertheless, se veral studies hav e shown that spatial conformations play a critical role in determining subcellular localization patterns. For example, the nuclear localization signals of tran- scription factor NF- κ B are conditionally exposed only under specific structural conformations ( Lusk et al. , 2007 ). This demonstrates that the 3D structures of proteins, as dynamic regulatory elements, are the key to go verning their subcellular localization. ∗ Corresponding author . Email: lsl19@tsinghua.org.cn † Corresponding author . Email: zhfengbin@gmail.com 1 Published as a conference paper at ICLR 2026 T o fully lev erage protein structural data, recent research has de veloped structure-based protein rep- resentation models. Benefiting from the emer gence of AlphaFold2 ( Jumper et al. , 2021 ), which offers reliable structural predictions for a v ast number of proteins, the structure-based methods learn representations directly from the spatial geometry of proteins. Such approaches have demonstrated impressiv e performance across a range of tasks, including protein classification ( Jing et al. , 2020 ; Zhang et al. , 2022 ; Fan et al. , 2022 ) and protein generation ( Dauparas et al. , 2022 ; W atson et al. , 2023 ), showcasing their ability to capture complex structural patterns beyond what sequence alone can provide. These successful implementations underscore the substantial potential of incorporating structural information into subcellular localization prediction framew orks. Howe ver , the existing subcellular localization datasets, such as DeepLoc, suffer from several lim- itations, which hinder the in vestigation of structure-based methods. Most notably , 1) the y lack explicit protein 3D information, which is the key input to structure-based methods. Furthermore, 2) the current dataset typically uses coarse-grained compartment classifications, grouping subcellu- lar areas into broad categories ( e.g ., do not distinguish nuclear membrane and nucleoli in nucleus), which ov erlooks the unique localization characteristics and mechanisms associated with different organelles. Therefore, it leads to poor interpretability and great difficulty in discovering distinct patterns and underlying biological principles. T o address these limitations, we aim to construct a human protein subcellular localization dataset that can facilitate research on structure-based methods for localization prediction and enable the discov ery of more specific and biologically relev ant localization patterns. Specifically , we hav e two considerations for the dataset: 1) Comprehensive 3D information , which seeks to enhance the comprehensiv eness of the dataset by recording detailed localization data from dif ferent databases and integrating 3D structural information of proteins, thereby bringing conv enience and providing a unified ev aluation benchmark for structure-based prediction models within the community; 2) Fine-grained subcellular categorization , which aims to incorporate finer-grained localization la- bels with annotations based on biological empirical evidence. As such, researchers are allowed to in vestigate protein localization patterns at a more detailed and functionally meaningful le vel. T o this end, we take the initiative of building a dataset called CAPSUL that simultaneously ful- fills the two considerations. Specifically , to obtain the 3D information, we lev erage AlphaFold2 to extract the Cartesian coordinates of the C α (alpha carbon) and utilize the FoldSeek to derive corresponding 3Di structural tokens for each protein, promoting structure understanding such as backbone conformation, folding patterns, and local structure. Moreover , to obtain comprehensiv e subcellular localization labels, we cross-reference each protein with annotation data from both the UniProt ( Consortium , 2019 ) and Human Protein Atlas (HP A) ( Thul et al. , 2017 ) databases. Building upon the categories in the existing dataset DeepLoc, we further refine the subcellular area space by introducing 20 aggre gated subcellular compartments, carefully curated and v alidated by domain ex- perts. W e extend several state-of-the-art (SOT A) protein representation models to this downstream task and e valuate their performance on CAPSUL. T o facilitate future research, we inv estigate sev eral potential optimization strategies for structure-based model training and make innov ativ e use of the attention mechanism to enhance the interpretability of protein subcellular localization patterns by integrating Trans former modules into existing models. Empirical results on CAPSUL validate the necessity of 3D information incorporation and the potential of lev eraging structure-based methods for causal biology pattern discov ery on the subcellular localization task. In summary , the contributions of this paper are threefold: • W e represent the first systematic attempt to construct a human protein subcellular localization dataset with comprehensiv e 3D information, fine-grained categorization of cell compartments, and cross-referenced localization labels with experiment-le vel annotations. • W e ev aluate sev eral SO T A baseline models on our proposed dataset CAPSUL, validating the positiv e influence of incorporating protein structural inputs. • W e in vestigate various training strategies to facilitate future exploration and enhance the inter- pretability for subcellular localization tasks by introducing the attention mechanism. 2 R E L A T E D W O R K Sequence-based protein representation learning. Due to the relati ve ease of modeling protein amino acid sequences, early protein representation learning efforts typically relied solely on one- 2 Published as a conference paper at ICLR 2026 dimensional sequence inputs. Examples include models based on CNN, LSTM, or ResNet archi- tectures ( Shanehsazzadeh et al. , 2020 ; Rao et al. , 2019 ). Subsequently , T ransformer-based models hav e demonstrated strong performance, especially after large-scale pretraining, achieving impres- siv e results across a range of downstream tasks ( Rives et al. , 2019 ; Lin et al. , 2022 ; Madani et al. , 2023 ). In parallel, v arious self-supervised approaches hav e further enhanced the model’ s ability to capture meaningful features from protein sequences without a vast number of annotations ( Rives et al. , 2019 ; Lin et al. , 2023 ; Elnaggar et al. , 2021 ; Lu et al. , 2020 ; He et al. , 2021 ). Ho wev er , in the subcellular localization task, which is kno wn to be closely linked to protein structure, sequence- only models fall short of capturing the full complexity of protein features. As a result, incorporating 3D structural information has become increasingly recognized as essential for achieving richer and more comprehensiv e protein representations. Structure-based protein repr esentation learning. Efforts to model protein structures hav e been explored from multiple perspectives, including representations at the protein surface lev el, residue lev el, and atomic lev el. The protein language model also starts to consider structural information as input to enhance its understanding of proteins ( Hayes et al. , 2025 ). These approaches have achiev ed impressiv e results in tasks such as protein design, structure generation, and function pre- diction ( Gligorijevi ´ c et al. , 2021 ; Gainza et al. , 2020 ; Hermosilla et al. , 2020 ; Hsu et al. , 2022 ). Among them, models based on Graph Con volutional Network (GCN) hav e demonstrated consis- tently strong performance across various downstream tasks, highlighting their ability to effecti vely capture and interpret structural information ( Fan et al. , 2022 ; Jing et al. , 2020 ; Zhang et al. , 2022 ). Howe ver , most of these models require atomic or residue-level coordinate inputs, which are often missing from current benchmark datasets. T o address this gap, we aim to construct a dataset specif- ically for the task of subcellular localization that incorporates 3D structural information, facilitating both the application and ev aluation of structure-based models. Subcellular localization dataset. Although man y prestigious a nd task-specific protein benchmarks exist ( Rao et al. , 2019 ; Kryshtafo vych et al. , 2023 ), their lack of subcellular localization annotations makes them inapplicable on this downstream task. T o the best of our knowledge, the only well- known dataset for subcellular localization originates from the training data used in DeepLoc ( Thu- muluri et al. , 2022 ). Building on this, the PEER framework established a benchmark to ev aluate baseline models on that dataset ( Xu et al. , 2022 ). Howe ver , the absence of 3D structural information makes it impossible to assess the performance of structure-based models that hav e already shown significant promise. T o address this gap, we aim to reorganize and enrich the existing dataset by incorporating high-quality 3D structural information alongside fine-grained subcellular localization annotations. W e further ev aluate a range of representativ e baseline models on this updated dataset, with the goal of establishing a leading benchmark for subcellular localization prediction. 3 C A P S U L D A TA S E T T o construct the CAPSUL dataset that offers 1) div erse and accessible 3D structural information, and 2) both detailed and aggregated subcellular localization annotations, we follow a multi-step curation process, as illustrated in Figure 1 . 3 . 1 P RO C E S S I N G O F P R OT E I N S E Q U E N C E A N D S T R U C T U R E D A TA Collection and filter of protein data. W e first retriev e all predicted human protein structures from the AlphaFold2 database ( Jumper et al. , 2021 ; V aradi et al. , 2024 ), totaling 20,504 unique proteins. T o ensure data quality and relev ance, we filter this set by retaining only proteins marked as acti ve in the UniProt database ( Consortium , 2019 ), one of the most comprehensive and authoritati ve protein databases with well-documented annotations, resulting in a refined set of 20,401 proteins. Removal of fragmented structur e pr edictions. Among the refined set, AlphaFold2 typically adopts a sliding-window strategy to long protein sequences that segments the sequence with over - lapping fragments to predict protein structure. T o avoid inconsistencies of predicted coordinates that may arise during the stitching of these fragmented protein structures, we exclude such proteins from the dataset. After this step, we obtain 20,181 proteins of high quality and good consistency . Extraction and prepr ocessing of protein features. W e preserve the full PDB files for each pro- tein, the original files downloaded from AlphaFold, including the positions of backbone atoms, side 3 Published as a conference paper at ICLR 2026 Figure 1: Procedures of CAPSUL dataset construction, including 3 ke y steps: Step 1 extracts and filters the sequence and structure data for each high-quality protein from AlphaFold2; Step 2 collects the annotations from UniProt and HP A for the resulting proteins in Step 1; Step 3 merges the struc- ture data and the annotations for each protein, which consists of protein ID, localization annotations, amino acid sequence, sequence length, 3Di tokens, and C α coordinates, etc. chains, and other relev ant structural features essential for molecular modeling and analysis. The coordinates of C α atoms are extracted, which are important components for protein structure un- derstanding. Furthermore, we employ the FoldSeek ( V an Kempen et al. , 2024 ) toolkit to tokenize the 3D structure of each amino acid. This provides a compact, informativ e structural representa- tion that supports rapid, accurate modeling while reducing computational o verhead, which has been empirically justified as effecti ve and widely adopted in recent studies ( Su et al. , 2023 ). Follo wing the procedures above, we curate a dataset comprising 20,181 proteins, each labeled with amino acid sequence, C α coordinates, and 3Di tokens sequence. F or the next step, we append localization annotations to each protein. 3 . 2 P RO C E S S I N G O F S U B C E L L U L A R L O C A L I Z A T I O N A N N O T A T I O N S Acquisition of detailed subcellular localization annotations. Based on the obtained proteins abov e, we collect the corresponding detailed subcellular localization annotations for human proteins from both the UniProt and HP A databases. This detailed dataset provides high-resolution localiza- tion annotations on widely accepted subcellular compartments, which is vital to facilitate research into the specific localization patterns within distinct organelles. Fine-grained categorization. After that, we aggregate the dataset by adopting a refined catego- rization approach. Specifically , we consolidate the subcellular locations into 20 distinct categories inspired by DeepLoc’ s and HP A ’ s subcellular localization classification scheme ( Thumuluri et al. , 2022 ; Thul et al. , 2017 ), which is a fine-grained framework compared with DeepLoc’ s ten-class categorization. Then, the sublocations of 20 categories are specified separately , so the various ter- minologies in different databases can align with 20 unified categorizations. The entire procedure was conducted in accordance with a well-established cell biology te xtbook ( Alberts et al. , 2022 ) and further verified by domain e xperts, with detailed categorization information a vailable in Supp. A . Annotations of evidence level for localization data. T o fulfill the v arious research demands for the reliability of localization labels, we further extract and consolidate annotations on the experimental evidence level. Specifically , for UniProt, each subcellular localization annotation is accompanied by an evidence code indicating the source of the localization label. Among them, the localization supported by experimental evidence (marked with the term ECO:0000269 ) is labeled as 1, indicating experimental v alidation. For the localization with other forms of evidence ( e.g ., non-traceable author statement evidence), the label 2 is assigned. The label 0 is assigned to the localizations without evidence annotations. Moreover , since HP A primarily relies on experimental data obtained through immunofluorescence and confocal microscopy ( Thul et al. , 2017 ), we assign label 1 to all annotated 4 Published as a conference paper at ICLR 2026 T able 1: Comparisons between existing datasets and CAPSUL. Feartures Categoization Experimental Annotation Dataset Sequence Structure Aggregated Detailed DeepLoc ( Thumuluri et al. , 2022 ) ✓ ✗ ✓ ✗ ✗ setHARD ( St ¨ ark et al. , 2021 ) ✓ ✗ ✓ ✗ ✗ CAPSUL ✓ ✓ ✓ ✓ ✓ T able 2: Statistics of CAPSUL. Number of Proteins 20,181 A verage Number of Annotations per Protein 2.51 Max Number of Annotations for Pr otein 14 Proportion of Experimental Annotations 0.857 Number of Annotations on: Nucleus 7,590 Cytosol 5,386 Golgi Apparatus 1,881 Peroxisome 110 Nuclear Membrane 452 Cytoskeleton 2,119 Cell Membrane 5,777 V esicle 2,863 Nucleoli 1,641 Centrosome 1,000 Endosome 687 Primary Cilium 983 Nucleoplasm 6,786 Mitochondria 1,768 Lipid Droplet 94 Secreted Proteins 2,087 Cytoplasm 6,613 Endoplasmic Reticulum 1,710 L ysosome/V acuole 453 Sperm 652 localizations and label 0 to the localizations without evidence annotations. During the union of UniProt and HP A datasets, we prioritize annotations with experimental evidence when a v ailable. 3 . 3 D A TA M E R G I N G After the separate processing of protein sequence and structure data, along with the subcellular localization annotations, we merge the data to include complete information. In Figure 1 , we present a sample record in CAPSUL, which consists of protein ID, localization annotations, amino acid sequence, sequence length, 3Di tokens, and C α coordinates, etc. 3 . 4 D A TA S E T A NA LY S I S In summary , we construct a unified dataset comprising 20,181 proteins, each annotated with 20 sub- cellular localization labels. Our dataset CAPSUL provides a more comprehensive cov erage com- pared to DeepLoc ( Thumuluri et al. , 2022 ) and setHARD ( St ¨ ark et al. , 2021 ) in terms of inv olved features, localization categorization, and experimental annotations, which is shown in T able 1 . The dataset is randomly split into training, validation, and test sets in a 70%:15%:15% ratio for training and ev aluation. W e present a statistical analysis of numerical features of our dataset in T able 2 . T o ensure the high quality of our constructed CAPSUL dataset, we hav e incorporated three safe- guards 1 : 1) Reliable data sour ces : reliable protein structures predicted by AlphaF old2 were utilized in CAPSUL, with high accuracy , strong consistency , and incorporation of av ailable e xperimen- tal data as templates in its prediction process ( Jumper et al. , 2021 ); the localization labels source UniProt, a world-leading database with the most comprehensiv e protein annotations from multiple resources, and HP A, a human-specific protein database offering high-resolution and experiment- validated data. 2) Strict validation and filtering : we perform a series of validation and filtering steps on human proteins to exclude fragmented AlphaFold structures, which could introduce in- consistent coordinate information, and to remove proteins annotated as inactive in UniProt, thereby ensuring the reliability of subcellular localization annotations; 3) Evidence-level support : we in- corporate annotations indicating whether experimental validation exists for the localization labels, thereby enhancing their credibility and catering to div erse research needs. 4 E X P E R I M E N T S 4 . 1 B A S E L I N E M O D E L S T o study how e xisting methods perform on our proposed dataset 2 , we ev aluate 1) DeepLoc 2.1 ( Ødum et al. , 2024 ), one of the most well-known tools dedicated to subcellular localization. It leverages the pre-trained protein language model ESM-1b ( Riv es et al. , 2021 ) and provides pre- dictions across ten subcellular compartments. Besides, we ev aluate existing representati ve protein 1 For a detailed analysis of the data reliability in the dataset, please refer to Supp. B . 2 The detailed descriptions and hyperparameter settings of all baseline models are provided in Supp. C . 5 Published as a conference paper at ICLR 2026 representation methods for the subcellular localization task, including sequence-based and structure- based methods. Sequence-based models . Since existing sequence-based works are not specifically designed for subcellular tasks, we extend the widely adopted pre-trained protein language model 2) ESM-2 (650M parameters) ( Lin et al. , 2022 ) and its latest iteration, 3) ESM-C (600M parameters) ( ESM T eam , 2024 ). W e adopt the sequence encoder module from existing methods to obtain protein rep- resentation, and extend it with a localization classifier , as detailed in the following. • Sequence Encoder . For each protein, we have its amino acid sequence represented as S = ( s 1 , s 2 , . . . , s n ) ∈ R n × 1 , where s i denotes the i -th residue and n is the length of the protein. W e then apply the sequence encoder f seq ( · ) of existing work to obtain contextual embeddings, H = f seq ( S ) , where H = ( h 1 , h 2 , . . . , h n ) ∈ R n × d , and h is the per-residue embeddings of dimension d . T o obtain a fixed-length representation for the entire protein, we apply mean pooling and generate a global representation ¯ h = 1 n P n i =1 h i , ¯ h ∈ R d . • Localization Classifier . T o predict subcellular localization, we lev erage an MLP classifier ϕ ( · ) on top of sequence encoder , i.e., ˆ y = ϕ ( ¯ h ) , where ˆ y ∈ R m is a multi-label prediction v ector and m denotes the total number of predicted subcellular compartments. Structure-based models . W e consider 4) CDCon v ( F an et al. , 2022 ) and 5) GearNet-Edge ( Zhang et al. , 2022 ), two representativ e GCN baselines in protein representation task. W e adopt the GCN- based structure encoder and extend it with an additional T ransformer encoder to enhance inter - pretability . W e also ev aluate 6) F oldSeek ( V an Kempen et al. , 2024 ), which le verages a pre-trained structure tokenizer to encode the 3D structural information of each residue into a sequence of struc- ture tokens. The outputs of the above models are then av eraged and processed through a localization classifier for prediction. • Structur e Encoder . W e represent a protein’ s 3D structure as a graph G = ( V , E ) , where each node v i ∈ V corresponds to the i -th residue (typically using the C α atom position), and edges ( v i , v j ) ∈ E are defined based on spatial or sequential adjacenc y . Each node v i is initialized with a feature vector x i ∈ R d including its positional information. Then we employ different graph encoders to capture higher-order topological relationships and produce updated representations ( h 1 , . . . , h n ) . The protein-lev el embedding is then obtained via global pooling ¯ h = 1 n P n i =1 h i . • Localization Classifier . W e then obtain the final prediction ˆ y = ϕ ¯ h , as described abov e. Extension of structure-based models . W e also extend three no vel methods, 7) Graph T rans- former ( Ramp ´ a ˇ sek et al. , 2022 ), 8) Graph Mamba ( Gu & Dao , 2023 ), and 9) Graph Diffu- sion ( Y ang et al. , 2023 ) to this task. The Graph Transformer employs attention mechanisms ov er graph-structured data, enabling the model to effecti vely capture both local and global dependen- cies among residues. Graph Mamba, on the other hand, incorporates selective state space models into graph learning, which facilitates long-range information propagation with improved efficienc y . For Graph Diffusion, it le verages diffusion processes over graph-structured data to propagate in- formation across nodes. T o impro ve classification performance on minor categories, we further incorporate a contrasti ve loss mechanism into the CDConv model, i.e., 10) CDCon v with Con- trastive Loss , aiming to enhance the similarity between representations of positiv e protein pairs and thereby encourage the learning of distinctiv e localization features. W e also explore a fusion model that combines representati ve structure-based models with sequence-based pretrained protein language models, i.e., 11) ESM-C+CDCon v Fusion Model , in vestigating both early and late fusion strategies to inte grate structural information into large-scale sequence models. Optimization . T o optimize the models, we adopt the Binary Cross Entropy (BCE) loss, defined as L BCE = − 1 m P m i =1 [ y i log( ˆ y i ) + (1 − y i ) log(1 − ˆ y i )] , where m is the number of classes, y i ∈ { 0 , 1 } is the label for class i , and ˆ y i ∈ (0 , 1) is the predicted probability . 4 . 2 B E N C H M A R K O V E R A L L R E S U LT S A N D D I S C U S S I O N Giv en the class imbalance in each location ( i.e. , the proportion of proteins localized to each sub- cellular compartment is often small), we consider the widely used ev aluation metrics in this task: Precision, Recall, and F1-score ( Jiang et al. , 2021 ; Thumuluri et al. , 2022 ). In addition, we utilize micro-av eraged and macro-averaged F1-score to ev aluate the overall performance across different 6 Published as a conference paper at ICLR 2026 T able 3: Overall performance of sequence-based, structure-based methods on CAPSUL. Sequence-based Methods Structure-based Methods Subcellular Locations DeepLoc 2.1 ESM-2 650M ESM-2 650M f ESM-C 600M ESM-C 600M f ESM-C 600M 0 FoldSeek CDCon v t GearNet- Edge t F1-score Nucleus 0.152 - 0.609 0.649 0.648 0.555 0.484 0.620 0.521 Nuclear Membrane / - - - - - - - - Nucleoli / - - 0.091 0.039 0.024 - 0.147 0.121 Nucleoplasm / - 0.562 0.621 0.623 0.500 0.433 0.583 0.515 Cytoplasm 0.154 - 0.248 0.536 0.551 0.438 0.174 0.483 0.495 Cytosol / - - 0.392 0.380 0.169 0.003 0.353 0.385 Cytoskeleton / - 0.006 0.251 0.205 0.048 0.070 0.135 0.228 Centrosome / - - 0.014 - - - - 0.127 Mitochondria 0.120 - 0.317 0.562 0.544 0.099 - 0.476 0.318 Endoplasmic Reticulum 0.121 - - 0.351 0.333 0.059 - 0.292 0.279 Golgi Apparatus 0.061 - - 0.099 0.027 - - 0.073 0.026 Cell Membrane 0.142 - 0.555 0.631 0.648 0.372 0.343 0.562 0.556 Endosome / - - 0.018 - - - - 0.067 Lipid Droplet / - - - - - - - - L ysosome / V acuole 0.118 - - - - - - - 0.073 Peroxisome 0.131 - - - - - - - - V esicle / - - 0.009 - 0.005 - 0.027 0.068 Primary Cilium / - - 0.164 0.112 - - - 0.147 Secreted Proteins 0.191 - 0.713 0.826 0.797 0.433 0.328 0.767 0.687 Sperm / - - 0.052 0.070 - - - 0.086 Micro A vg F1-score / - 0.375 0.495 0.492 0.338 0.248 0.452 0.417 Macro A vg F1-score / - 0.150 0.263 0.249 0.135 0.092 0.226 0.235 Micro A vg Precision / - 0.647 0.690 0.693 0.598 0.605 0.632 0.546 Micro A vg Recall / - 0.264 0.386 0.382 0.236 0.156 0.352 0.337 Extension of Structure-based Methods Subcellular Locations Graph Transformer Graph Mamba Graph Diffusion CDCon v t with Contrastiv e Loss ESM-C+CDCon v Early Fusion ESM-C+CDCon v Late Fusion F1-score Nucleus 0.597 0.559 0.624 0.592 0.643 0.645 Nuclear Membrane - 0.037 - - - - Nucleoli 0.203 0.168 0.047 0.140 0.125 0.153 Nucleoplasm 0.552 0.502 0.578 0.556 0.643 0.617 Cytoplasm 0.393 0.418 0.503 0.480 0.455 0.515 Cytosol 0.248 0.426 0.288 0.250 0.157 0.370 Cytoskeleton 0.042 0.270 0.099 0.243 0.100 0.287 Centrosome - 0.181 0.014 - - 0.037 Mitochondria 0.475 0.341 0.303 0.468 0.563 0.557 Endoplasmic Reticulum 0.184 0.059 0.150 0.361 0.446 - Golgi Apparatus 0.041 0.185 - 0.156 0.249 - Cell Membrane 0.547 0.540 0.496 0.539 0.629 0.673 Endosome - 0.100 - 0.034 0.054 - Lipid Droplet - - - - - - L ysosome / V acuole - - - - 0.026 - Peroxisome - - - - - - V esicle 0.044 0.135 0.018 0.027 0.067 - Primary Cilium 0.012 0.088 - 0.036 - 0.115 Secreted Proteins 0.705 0.557 0.623 0.780 0.819 0.725 Sperm 0.018 0.130 - 0.018 - - Micro A vg F1-score 0.410 0.411 0.424 0.435 0.470 0.476 Macro A vg F1-score 0.203 0.235 0.187 0.234 0.249 0.235 Micro A vg Precision 0.637 0.414 0.596 0.650 0.710 0.634 Micro A vg Recall 0.302 0.408 0.329 0.326 0.351 0.381 f W e finetune the pre-trained protein language model. t The original MLP is replaced by Transformer layers. 0 The parameters of ESM-C are initialized randomly . “/” indicates that DeepLoc 2.1 does not support prediction for that location, and therefore, a verage metrics are not considered in this case. “–” indicates that no prediction is made for that location. Bold value indicates the best results. T able 4: Ablation study of CDCon v and GearNet-Edge to randomly sample C α coordinates. CDConv t (random C α coordinates) CDConv t GearNet-Edge t (random C α coordinates) GearNet-Edge t Micro A vg F1-score 0.329 0.452 0.348 0.417 Micro A vg Precision 0.586 0.632 0.450 0.546 Micro A vg Recall 0.229 0.352 0.283 0.337 t The original MLP is replaced by Transformer layers. Bold value indicates the better result for each baseline. categories. The overall performance 3 of all baselines on our proposed dataset is presented in T able 3 , from which we hav e the following observ ations: 3 The detailed results w .r .t. Precision and Recall, including other experimental results mentioned later in the main text, are pro vided in Supp. D . 7 Published as a conference paper at ICLR 2026 Large pre-training benefits sequence-based methods for subcellular location prediction . Among all sequence-based methods, ESM-C generally obtains higher F1-scores than ESM-2. W e believ e this is attrib uted to the extensi ve data and training compute used in the ESM-C pre-training, which facilitates a better representation of the protein’ s sequence features. Similar observations are also seen in ( Hayes et al. , 2025 ). Besides, this hypothesis can be further confirmed by the signifi- cantly inferior performance of ESM-C 600M 0 , i.e., without pre-training, than the pre-trained ESM- C. On the other hand, it is expected that DeepLoc yields inferior performance due to its o verlook of the fine-grained categorization during pre-training, which may result in its inability to sufficiently differentiate the representations of proteins in multi-label classification tasks ( Hong et al. , 2023 ). This further validates the necessity of detailed cate gorizations of subcellular locations in CAPSUL. The 3D structur e is essential for subcellular localization task. Despite that structure-based meth- ods slightly fall behind the pre-trained ESM-C, both CDCon v and GearNet-Edge outperform the ESM-C 600M 0 in most cases. Also, a group of ablation studies is conducted on CDConv and GearNet-Edge, with coordinates randomly sampled from each protein’ s spatial range. As shown in T able 4 , randomly sampling the input of protein 3D structural data leads to a significant drop in model performance. These two results validate that structural information plays a decisiv e role in determining subcellular localization. Besides, CDConv demonstrates the strongest overall perfor- mance among the structure-based models, justifying the effecti veness of relative distance and the dynamic radius for con volution. Nev ertheless, the inferior performance of FoldSeek may be due to the lack of sequence information and its coarse tokenization of structural information. The models generally demonstrate better performance on subcellular locations with larger lo- calization sample sizes. For classes with a large number of localization samples ( e.g. , nucleus), most models tend to demonstrate relatively strong predictiv e performance. In contrast, for under- represented classes ( e.g . , lipid droplet), the prediction performance is generally poor, with some classes ev en failing to produce any correctly identified proteins. This is a common outcome in im- balanced multi-label classification tasks, as the standard BCE loss tends to neglect fewer -number labels. Additionally , potential conflicts among multiple optimization targets may further exacerbate this issue. T o address these challenges, we conduct in-depth analysis in Section 4.3.1 and 4.3.2 , ex- ploring strategies such as re weighting and single-label classification to mitigate the effects of class imbalance and task conflict. Structure-based models showcase their potential to captur e non-trivial patterns for subcel- lular locations with few samples . Graph Mamba and GearNet-Edge tend to perform better on certain classes with smaller localization sample sizes compared with sequence-based models. W e believ e that this is because of the relational message passing layer adopted in them, which uniquely models different spatial interactions among residues. This demonstrates that structure-based mod- els showcase potential to identify specific structural features that are indicativ e of localization to a particular organelle, thus achieving a notably good performance. Further inv estigation on the pat- terns with intuitiv e biological interpretability captured by the structure-based model can be found in Section 4.3.3 . Contrastive learning and fusion strategies demonstrate strong potential on the baseline mod- els. W e observe that the introduction of contrastiv e loss to CDCon v improv es performance on sev eral minority classes ( i.e., the notable F1-score improv ements on macro-av erage lev el and certain cate- gories such as Endosome, Primary Cilium, and Golgi Apparatus compared to the original CDCon v). W e attribute this to the contrastive learning paradigm, which encourages the model to maximize embedding similarity for positive pairs and to capture shared characteristics within minority-class positiv e samples through the contrastiv e objectiv e. Also, although the fusion model slightly under- performs ESM-C on average metrics, it achiev es the best performance across multiple subcellular compartments among all baselines, highlighting the considerable potential of integrating protein structural information into sequence-based protein language models. 4 . 3 I N - D E P T H A N A L Y S I S 4 . 3 . 1 P R OT E I N I M BA L A N C E M I T I G A T I O N V I A R E W E I G H T I N G Reweighting Schemes . In this task, for each subcellular location, the number of positive samples ( i.e. , proteins localized to that compartment) is substantially smaller than the number of negati ve samples ( i.e. , proteins not localized to that compartment). Reweighting is a widely used strategy to 8 Published as a conference paper at ICLR 2026 T able 5: Performance of ESM-C 600M, CDCon v , and GearNet-Edge with reweighting scheme. Subcellular Locations ESM-C 600M CDConv t GearNet- Edge t Subcellular Locations ESM-C 600M CDConv t GearNet- Edge t F1-score F1-score Nucleus 0.630 0.625 0.618 Endosome - 0.114 0.150 Nuclear Membrane - 0.062 0.058 Lipid Droplet 0.235 0.023 0.111 Nucleoli - 0.188 0.224 L ysosome/V acuole - 0.175 0.111 Nucleoplasm 0.576 0.607 0.574 Peroxisome 0.190 0.072 0.108 Cytoplasm 0.500 0.582 0.544 V esicle - 0.288 0.281 Cytosol 0.133 0.495 0.484 Primary Cilium 0.024 0.167 0.176 Cytoskeleton 0.083 0.292 0.294 Secreted Proteins 0.778 0.564 0.614 Centrosome - 0.160 0.175 Sperm - 0.120 0.125 Mitochondria 0.481 0.297 0.313 Endoplasmic Reticulum - 0.308 0.345 Golgi Apparatus - 0.246 0.238 Micro A vg F1-score 0.429 0.381 0.453 Cell Membrane 0.566 0.560 0.536 Macro A vg F1-score 0.210 0.297 0.304 t The original MLP is replaced by Transformer layers. “–” indicates that no prediction is made for that location. Bold value indicates that it improves compared with the result without reweighting. T able 6: Performance of ESM-C 600M, CDConv , and GearNet-Edge with single-label classification. Subcellular Locations ESM-C 600M CDConv t GearNet- Edge t Subcellular Locations ESM-C 600M CDConv t GearNet- Edge t F1-score F1-score Nuclear Membrane - 0.052 0.042 L ysosome/V acuole 0.115 - 0.162 Nucleoli 0.267 0.151 0.228 Peroxisome 0.054 - 0.023 Centrosome 0.184 0.089 0.167 V esicle 0.068 0.230 0.268 Golgi Apparatus 0.280 0.114 0.210 Primary Cilium 0.253 0.097 0.171 Endosome 0.167 0.049 0.126 Sperm 0.159 0.068 0.117 Lipid Droplet 0.021 - 0.051 t The original MLP is replaced by Transformer layers. “–” indicates that no prediction is made for that location. Bold value indicates that it improves compared with the result from multi-label classification. address class imbalance by reducing the bias tow ard majority classes. Inspired by previous work on class-lev el reweighting, we ev aluate three reweighting schemes. 1) Inv erse frequency reweight- ing ( Cao et al. , 2019 ), i.e., w c = 1 f c . 2) Log-in verse frequency reweighting ( Cui et al. , 2019 ), i.e., w c = 1 log(1+ f c ) . 3) Focal loss ( Lin et al. , 2017 ), which is defined as L c = − w c · X i [ y ic · (1 − ˆ y ic ) γ log( ˆ y ic ) + (1 − y ic ) · ˆ y γ ic log(1 − ˆ y ic )] , where f c is the frequency of positive samples in class c , w c is the computed class-specific weight, y ic ∈ { 0 , 1 } denotes the ground truth label for sample i and class c , ˆ y ic ∈ (0 , 1) is the predicted probability , and γ is the focusing parameter . It deserv es attention that the w c in the focal loss strategy is chosen from either in verse or log-in verse frequency weight. Results . W e apply the three reweighting schemes on three competitiv e models (ESM-C, CDCon v , and GearNet-Edge) and report the best results for each model in T able 5 . From the results, we ob- serve that the two structure-based baseline models e xhibit substantial improvements under re weight- ing strategies, especially for the higher Precision across underrepresented categories. In particular , CDCon v and GearNet-Edge successfully identify positi ve instances for every class. These find- ings highlight that reweighting can significantly enhance model performance on minority classes, especially for structure-based models. 4 . 3 . 2 S I N G L E - L A B E L C L A S S I FI C A T I O N T o explore how different methods perform on each subcellular location respecti vely , we adopt the single-label setting, aiming to mitigate the potential conflict between optimization across different classes. In this setting, we train separate binary classifiers for each subcellular localization cate- gory with ESM-C, CDCon v , and GearNet-Edge. W e apply this single-label prediction framework specifically to those subcellular localization classes where the F1-score of at least one of the models (ESM-C, CDCon v , or GearNet-Edge) is lower than 0.1. Our goal is to shift the model’ s attention tow ard underrepresented classes and improv e the predictiv e influence of positiv e samples. From the results in T able 6 , we observe 1) notable improvements in the prediction performance of pre viously underperforming classes, particularly for GearNet-Edge. Ho wev er , 2) ESM-C and CDCon v still f ail to generate any predictions for a few categories, primarily due to the extremely low proportion of positive samples (ranging from 0.5% to 3%). Gi ven that such severe class imbalance is a common challenge in subcellular localization tasks, we consider the single-label prediction 9 Published as a conference paper at ICLR 2026 Figure 2: V isualization of the top 20 attention-scored residues of the three representative proteins. strategy a promising and practical solution. Moreover , this approach lays the groundwork for future research focused on identifying localization patterns specific to indi vidual subcellular compartments. 4 . 3 . 3 B I O L O G I C A L I N T E R P R E TA B I L I T Y W e analyze a CDCon v model on Golgi apparatus prediction with an e xceptional precision of 100%. Specifically , with our nov el attempt of the T ransformer module e xtended to the GCN-based models, we identify and visualize the tokens ( i.e. , residues) that receiv e the 20 highest attention weights in Figure 2 , offering insights into which structure the model considers most decisi ve for subcellular lo- calization. W e find that the model consistently highlights similar α -helix spatial conformation, such as residues 8-27 of MFNG, residues 24-45 of B3GAL T2, and residues 273-292 at the C-terminus of GIMAP1. Remarkably , these findings sho w strong concordance with prior experimental evi- dence ( Paulson & Colley , 1989 ; Linstedt et al. , 1995 ). It is highlighted that despite significant se- quence diver gence, the model specifically focuses on α -helix transmembrane domains (20-30 amino acids in length) that maintain consistent topological orientations across all targets. Recent studies hav e demonstrated that the topological conformation of transmembrane domains can influence Golgi localization by regulating electrostatic potential gradients in transmembrane regions and lipid mem- brane anchoring efficiency ( Cosson et al. , 2013 ; Hanulova & W eiss , 2012 ; Bian et al. , 2024 ). This evidence not only confirms the model’ s capability for structural pattern recognition beyond sequence similarity but also pro vides theoretical support for its structural identification mechanisms. 5 C O N C L U S I O N A N D F U T U R E W O R K W e pointed out the crucial importance of constructing a subcellular localization benchmark with protein 3D information to facilitate the in vestigation of structure-based models for the subcellu- lar localization task. T o achieve this, we constructed a benchmark called CAPSUL that contains comprehensiv e structural information and fine-grained annotations of 20 categories of subcellular compartments with biological e xperiment evidence labels. Based on CAPSUL, we e v aluated SO T A sequence-based and structure-based models as well as their feasible optimization strate gies, demon- strating the effecti veness of incorporating protein structural information. Moreover , a case study on Golgi apparatus validates the biology-aligned interpretability of structure-based models trained on a specific fine-grained subcellular location, supported by CAPSUL. This work proposes a compre- hensiv e human protein benchmark with 3D information and fine-grained annotations for subcellular localization. Based on CAPSUL, we highlight sev eral research directions that are worth future ex- ploration: 1) T o fully leverage structural information, aligning or disentangling the understanding across different dimensions ( i.e., amino acid sequence, C α , and 3Di) specifically for subcellular localization is a promising direction. 2) Causal discov ery on the relationship between 3D structure and subcellular localization is w orthwhile to be e xplored on CAPSUL, with the goal of establishing direct links to underlying biological principles. A C K N O W L E D G M E N T Shulin Li was supported by China Postdoctoral Science Foundation (grant number BX20240186 and 2024M761616) and the Shuimu Tsinghua Scholar Program. 10 Published as a conference paper at ICLR 2026 E T H I C S S T A T E M E N T This research presents a dataset and benchmark for protein subcellular localization prediction using AI methods. W e confirm that our work raises no ethical concerns as it inv olves only the analysis of publicly available protein data, with no human subjects, animal experiments, or biological in- terventions. W e have fully considered the potential societal impacts and do not foresee any direct, immediate, or negati ve consequences. W e are committed to the ethical dissemination of our findings and encourage their responsible use. R E P RO D U C I B I L I T Y S TA T E M E N T All the results in this work are reproducible. The access to the necessary code and complete dataset can be found in Supp. L . W e discuss the experimental details in Supp. C , including implementa- tion details such as the hyperparameters chosen for each experiment, to help reproduce our results. Additionally , further experimental results, detailed dataset interpretations, and usage guidelines are provided in Supp. E , F , and J to facilitate better understanding and utilization of our dataset. R E F E R E N C E S Bruce Alberts, Rebecca Heald, Alexander Johnson, Da vid Mor gan, Martin Raf f, K eith Roberts, and Peter W alter . Molecular biology of the cell: Seventh edition . Norton and Company , 2022. Jos ´ e Juan Almagro Armenteros, Casper Kaae Sønderby , Søren Kaae Sønderby , Henrik Nielsen, and Ole Winther . Deeploc: prediction of protein subcellular localization using deep learning. Bioinformatics , 33(21):3387–3395, 2017. T . G. Ashlin, N. J. Blunsom, and S. Cockcroft. Courier service for phosphatidylinositol: Pitps deliv er on demand. Biochimica et Biophysica Acta (BB A) - Molecular and Cell Biolo gy of Lipids , 1866(9):158985, 2021. Claudie Bian, Anna Marchetti, Marco Dias, Jackie Perrin, and Pierre Cosson. Short transmembrane domains target type ii proteins to the golgi apparatus and type i proteins to the endoplasmic reticulum. Journal of Cell Science , 137(15), 2024. Kaidi Cao, Colin W ei, Adrien Gaidon, Nikos Arechiga, and T engyu Ma. Learning imbalanced datasets with label-distribution-aw are margin loss. Advances in neural information pr ocessing systems , 32, 2019. UniProt Consortium. Uniprot: a worldwide hub of protein knowledge. Nucleic acids r esear ch , 47 (D1):D506–D515, 2019. Pierre Cosson, Jackie Perrin, and Juan S Bonifacino. Anchors aweigh: protein localization and transport mediated by transmembrane domains. T r ends in cell biology , 23(10):511–517, 2013. Y in Cui, Menglin Jia, Tsung-Y i Lin, Y ang Song, and Serge Belongie. Class-balanced loss based on ef fectiv e number of samples. In Pr oceedings of the IEEE/CVF confer ence on computer vision and pattern r ecognition , pp. 9268–9277, 2019. Justas Dauparas, Iv an Anishchenko, Nathaniel Bennett, Hua Bai, Robert J Ragotte, Lukas F Milles, Basile IM W icky , Alexis Courbet, Rob J de Haas, Neville Bethel, et al. Robust deep learning– based protein sequence design using proteinmpnn. Science , 378(6615):49–56, 2022. Ahmed Elnaggar, Michael Heinzinger , Christian Dallago, Ghalia Rehawi, Y u W ang, Llion Jones, T om Gibbs, T amas Feher , Christoph Angerer , Martin Steinegger , et al. Prottrans: to wards crack- ing the language of life’ s code through self-supervised learning. IEEE T ransactions on P attern Analysis and Machine Intelligence , 44:7112–7127, 2021. ESM T eam. Esm cambrian: Revealing the mysteries of proteins with unsupervised learning, 2024. URL https://evolutionaryscale.ai/blog/esm- cambrian . 11 Published as a conference paper at ICLR 2026 Hehe Fan, Zhangyang W ang, Y i Y ang, and Mohan Kankanhalli. Continuous-discrete con volution for geometry-sequence modeling in proteins. In The Eleventh International Confer ence on Learning Repr esentations , 2022. Pablo Gainza, Freyr Sverrisson, Frederico Monti, Emanuele Rodola, Davide Boscaini, Michael M Bronstein, and Bruno E Correia. Deciphering interaction fingerprints from protein molecular surfaces using geometric deep learning. Nature Methods , 17(2):184–192, 2020. Vladimir Gligorije vi ´ c, P Douglas Renfre w , T omasz K osciolek, Julia K oehler Leman, Daniel Beren- berg, T ommi V atanen, Chris Chandler , Bryn C T aylor , Ian M Fisk, Hera Vlamakis, et al. Structure- based protein function prediction using graph conv olutional networks. Nature communications , 12(1):3168, 2021. Albert Gu and Tri Dao. Mamba: Linear-time sequence modeling with selectiv e state spaces. arXiv pr eprint arXiv:2312.00752 , 2023. Maria Hanulov a and Matthias W eiss. Membrane-mediated interactions–a physico-chemical basis for protein sorting. Molecular Membrane Biology , 29(5):177–185, 2012. Thomas Hayes, Roshan Rao, Halil Akin, Nicholas J Sofroniew , Deniz Oktay , Zeming Lin, Robert V erkuil, V incent Q T ran, Jonathan Deaton, Marius Wiggert, et al. Simulating 500 million years of ev olution with a language model. Science , pp. eads0018, 2025. Liang He, Shizhuo Zhang, Lijun W u, Huanhuan Xia, Fusong Ju, He Zhang, Siyuan Liu, Y ingce Xia, Jianwei Zhu, Pan Deng, et al. Pre-training co-evolutionary protein representation via a pairwise masked language model. arXiv preprint , 2021. Pedro Hermosilla, Marco Sch ¨ afer , Mat ˇ ej Lang, Gloria Fack elmann, Pere Pau V ´ azquez, Barbora K ozl ´ ıkov ´ a, Michael Krone, T obias Ritschel, and Timo Ropinski. Intrinsic-extrinsic con volution and pooling for learning on 3d protein structures. arXiv preprint , 2020. Guan Zhe Hong, Y in Cui, Ariel Fuxman, Stanley H Chan, and Enming Luo. T o wards understanding the effect of pretraining label granularity . arXiv preprint , 2023. Chloe Hsu, Robert V erkuil, Jason Liu, Zeming Lin, Brian Hie, T om Sercu, Adam Lerer , and Ale xan- der Riv es. Learning in verse folding from millions of predicted structures. In International con- fer ence on machine learning , pp. 8946–8970. PMLR, 2022. V ictoria Hung, Stephanie S Lam, Namrata D Udeshi, T anya Svinkina, Gaelen Guzman, V amsi K Mootha, Ste ven A Carr, and Alice Y Ting. Proteomic mapping of c ytosol-facing outer mito- chondrial and er membranes in living human cells by proximity biotinylation. elife , 6:e24463, 2017. Alexander M Ille, Christopher Markosian, Stephen K Burley , Renata Pasqualini, and W adih Arap. Human protein interactome structure prediction at scale with boltz-2. bioRxiv , pp. 2025–07, 2025. Y uexu Jiang, Duolin W ang, Y ifu Y ao, Holger Eubel, Patrick K ¨ unzler , Ian Max Møller , and Dong Xu. Mulocdeep: a deep-learning framew ork for protein subcellular and suborganellar localization prediction with residue-lev el interpretation. Computational and structural biotec hnology journal , 19:4825–4839, 2021. Bowen Jing, Stephan Eismann, Patricia Suriana, Raphael JL T o wnshend, and Ron Dror . Learning from protein structure with geometric vector perceptrons. arXiv preprint , 2020. John Jumper, Richard Evans, Alexander Pritzel, Tim Green, Michael Figurnov , Olaf Ronneberger , Kathryn T unyasuvunakool, Russ Bates, Augustin ˇ Z ´ ıdek, Anna Potapenko, et al. Highly accurate protein structure prediction with alphafold. nature , 596(7873):583–589, 2021. Hirofumi K obayashi, Keith C Cheveralls, Manuel D Leonetti, and Loic A Royer . Self-supervised deep learning encodes high-resolution features of protein subcellular localization. Natur e meth- ods , 19(8):995–1003, 2022. 12 Published as a conference paper at ICLR 2026 Andriy Kryshtafovych, T orsten Schwede, Maya T opf, Krzysztof Fidelis, and John Moult. Critical assessment of methods of protein structure prediction (casp)—round xv . Pr oteins: Structur e, Function, and Bioinformatics , 91(12):1539–1549, 2023. Tsung-Y i Lin, Priya Goyal, Ross Girshick, Kaiming He, and Piotr Doll ´ ar . Focal loss for dense object detection. In Pr oceedings of the IEEE international confer ence on computer vision , pp. 2980–2988, 2017. Zeming Lin, Halil Akin, Roshan Rao, Brian Hie, Zhongkai Zhu, W enting Lu, Nikita Smetanin, Allan dos Santos Costa, Maryam Fazel-Zarandi, T om Sercu, Sal Candido, et al. Language models of protein sequences at the scale of ev olution enable accurate structure prediction. bioRxiv , 2022. Zeming Lin, Halil Akin, Roshan Rao, Brian Hie, Zhongkai Zhu, W enting Lu, Nikita Smetanin, Robert V erkuil, Ori Kabeli, Y aniv Shmueli, et al. Evolutionary-scale prediction of atomic-level protein structure with a language model. Science , 379(6637):1123–1130, 2023. AD Linstedt, M Foguet, M Renz, HP Seelig, BS Glick, and HP Hauri. A c-terminally-anchored golgi protein is inserted into the endoplasmic reticulum and then transported to the golgi apparatus. Pr oceedings of the National Academy of Sciences , 92(11):5102–5105, 1995. Amy X Lu, Haoran Zhang, Marzyeh Ghassemi, and Alan Moses. Self-supervised contrastiv e learn- ing of protein representations by mutual information maximization. BioRxiv , pp. 2020–09, 2020. C Patrick Lusk, G ¨ unter Blobel, and Megan C King. Highway to the inner nuclear membrane: rules for the road. Nature Re views Molecular Cell Biology , 8(5):414–420, 2007. Ali Madani, Ben Krause, Eric R Greene, Subu Subramanian, Benjamin P Mohr, James M Holton, Jose Luis Olmos Jr , Caiming Xiong, Zachary Z Sun, Richard Socher, et al. Lar ge language models generate functional protein sequences across div erse families. Nature biotechnology , 41 (8):1099–1106, 2023. Marius Thrane Ødum, Felix T eufel, V ineet Thumuluri, Jos ´ e Juan Almagro Armenteros, Alexan- der Rosenberg Johansen, Ole W inther , and Henrik Nielsen. Deeploc 2.1: multi-label membrane protein type prediction using protein language models. Nucleic Acids Resear ch , 52(W1):W215– W220, 2024. Saro Passaro, Gabriele Corso, Jeremy W ohlwend, Mateo Re veiz, Stephan Thaler , V ignesh Ram Somnath, Noah Getz, T ally Portnoi, Julien Roy , Hannes Stark, et al. Boltz-2: T ow ards accurate and efficient binding af finity prediction. BioRxiv , 2025. James C Paulson and Karen J Colley . Glycosyltransferases: structure, localization, and control of cell type-specific glycosylation. Journal of Biological Chemistry , 264(30):17615–17618, 1989. Lawrence Rajendran, Hans-Joachim Kn ¨ olker , and Kai Simons. Subcellular targeting strategies for drug design and deliv ery . Natur e r evie ws Drug discovery , 9(1):29–42, 2010. Ladislav Ramp ´ a ˇ sek, Michael Galkin, V ijay Prakash Dwiv edi, Anh T uan Luu, Guy W olf, and Do- minique Beaini. Recipe for a general, powerful, scalable graph transformer . Advances in Neural Information Pr ocessing Systems , 35:14501–14515, 2022. Roshan Rao, Nicholas Bhattacharya, Neil Thomas, Y an Duan, Peter Chen, John Canny , Pieter Abbeel, and Y un Song. Evaluating protein transfer learning with tape. Advances in neural infor- mation pr ocessing systems , 32, 2019. Alexander Rives, Joshua Meier, T om Sercu, Siddharth Goyal, Zeming Lin, Jason Liu, Demi Guo, Myle Ott, C. Lawrence Zitnick, Jerry Ma, and Rob Fergus. Biological structure and function emerge from scaling unsupervised learning to 250 million protein sequences. PNAS , 2019. doi: 10.1101/622803. URL https://www.biorxiv.org/content/10.1101/622803v4 . Alexander Rives, Joshua Meier, T om Sercu, Siddharth Goyal, Zeming Lin, Jason Liu, Demi Guo, Myle Ott, C Lawrence Zitnick, Jerry Ma, et al. Biological structure and function emerge from scaling unsupervised learning to 250 million protein sequences. Pr oceedings of the National Academy of Sciences , 118(15):e2016239118, 2021. 13 Published as a conference paper at ICLR 2026 Michelle S S cott, Sara J Calafell, David Y Thomas, and Michael T Hallett. Refining protein subcel- lular localization. PLoS computational biology , 1(6):e66, 2005. Amir Shanehsazzadeh, David Belanger , and Da vid Dohan. Is transfer learning necessary for protein landscape prediction? arXiv preprint , 2020. S. Sohn, M. K. Joe, T . E. Kim, et al. Dual localization of wild-type myocilin in the endoplasmic reticulum and extracellular compartment likely occurs due to its incomplete secretion. Molecular V ision , 15:545, 2009. Hannes St ¨ ark, Christian Dallago, Michael Heinzinger , and Burkhard Rost. Light attention predicts protein location from the language of life. Bioinformatics Advances , 1(1):vbab035, 2021. Jin Su, Chenchen Han, Y uyang Zhou, Junjie Shan, Xibin Zhou, and Fajie Y uan. Saprot: Protein language modeling with structure-aware v ocab ulary . bioRxiv , pp. 2023–10, 2023. Peter J Thul, Lovisa ˚ Akesson, Mikaela Wiking, Diana Mahdessian, Aikaterini Geladaki, Hammou Ait Blal, T ove Alm, Anna Asplund, Lars Bj ¨ ork, Lisa M Breckels, et al. A subcellular map of the human proteome. Science , 356(6340):eaal3321, 2017. V ineet Thumuluri, Jos ´ e Juan Almagro Armenteros, Alexander Rosenberg Johansen, Henrik Nielsen, and Ole W inther . Deeploc 2.0: multi-label subcellular localization prediction using protein lan- guage models. Nucleic acids resear ch , 50(W1):W228–W234, 2022. Michel V an Kempen, Stephanie S Kim, Charlotte Tumescheit, Milot Mirdita, Jeongjae Lee, Cameron LM Gilchrist, Johannes S ¨ oding, and Martin Steinegger . Fast and accurate protein struc- ture search with foldseek. Nature biotec hnology , 42(2):243–246, 2024. Mihaly V aradi, Damian Bertoni, Paulyna Magana, Urmila Paramv al, Ivanna Pidruchna, Malarvizhi Radhakrishnan, Maxim Tsenkov , Sreenath Nair, Milot Mirdita, Jingi Y eo, et al. Alphafold protein structure database in 2024: providing structure coverage for ov er 214 million protein sequences. Nucleic acids r esear ch , 52(D1):D368–D375, 2024. Joseph L W atson, David Juergens, Nathaniel R Bennett, Brian L T rippe, Jason Y im, Helen E Eise- nach, W oody Ahern, Andrew J Borst, Robert J Ragotte, Lukas F Milles, et al. De novo design of protein structure and function with rfdiffusion. Natur e , 620(7976):1089–1100, 2023. Jeremy W ohlwend, Gabriele Corso, Saro Passaro, Noah Getz, Mateo Reveiz, Ken Leidal, W ojtek Swiderski, Liam Atkinson, T ally Portnoi, Itamar Chinn, et al. Boltz-1 democratizing biomolecular interaction modeling. BioRxiv , pp. 2024–11, 2025. Minghao Xu, Zuobai Zhang, Jiarui Lu, Zhaocheng Zhu, Y angtian Zhang, Ma Chang, Runcheng Liu, and Jian T ang. Peer: a comprehensi ve and multi-task benchmark for protein sequence understand- ing. Advances in Neural Information Pr ocessing Systems , 35:35156–35173, 2022. R Y ang, Y Y ang, F Zhou, et al. Directional diffusion models for graph representation learning. Advances in Neural Information Pr ocessing Systems , 36:32720–32731, 2023. Zuobai Zhang, Minghao Xu, Arian Jamasb, V ijil Chenthamarakshan, Aurelie Lozano, Payel Das, and Jian T ang. Protein representation learning by geometric structure pretraining. arXiv pr eprint arXiv:2203.06125 , 2022. 14 Published as a conference paper at ICLR 2026 Supplementary Material f or CAPSUL: A Comprehensi ve Human Pr otein Benchmark for Subcellular Localization A D A TA S E T C O N S T R U C T I O N A . 1 S U B C E L L U L A R L O C AT I O N C AT E G O R I Z AT I O N A N D T E R M I N O L O G Y M A P P I N G T o facilitate model classification, we first categorize the detailed subcellular localizations of pro- teins. Existing datasets often use coarse-grained classifications ( e.g., DeepLoc categorizes sub- cellular locations into 10 broad classes). Howe ver , since each subcellular compartment typically follows distinct localization patterns, such coarse categorizations can hinder the model’ s ability to capture consistent intra-class features, ultimately leading to reduced prediction accuracy . Moreover , coarse-grained classification also hinders researchers from exploring localization mechanisms spe- cific to finer subcellular compartments. Inspired by the subcellular location categories in HP A and DeepLoc, we propose a finer-grained classification scheme consisting of 20 subcellular categories. Notably , ”Nucleus” and ”Cytoplasm” categories serve as umbrella terms for sev eral finer locations to ensure compatibility with DeepLoc during ev aluation. When aligning protein localization annotations from the UniProt and HP A databases to our refined categorization, we observe inconsistencies in terminology ( e .g., ”Cell Membrane” in UniProt v ersus ”Plasma Membrane” in HP A). T o resolve such discrepancies, we refer to the prestigious textbook Molecular Biology of the Cell (7th Edition) ( Alberts et al. , 2022 ) and create a unified mapping, as shown in T able 7 , which allows for consistent cate gorization across the two databases. Domain experts were extensiv ely engaged to ensure and validate the accuracy of the classification standards and data alignment procedures. W e invited cell biologists from several prestigious uni- versities and research institutes to revie w and revise the dataset, which ensures that CAPSUL is firmly grounded in cell biology . All of them have over eight years of research experience in their field. They are rigorously in v olved throughout the entire process, including 1) curating authoritati ve datasets, 2) determining primary subcellular localizations, and 3) v alidating the biological plausibil- ity of localization assignments. Through the above processes, we have established a fine-grained subcellular localization classifica- tion standard and successfully unified annotations from multiple databases under a unified labeling framew ork. A . 2 D A TA S E T S P L I T S T o construct separate datasets for training, validating, and testing, we randomly split the original dataset into three subsets in a 70%: 15%: 15% ratio, each containing 14,126, 3,027, 3,028 pro- teins. The partitioning of different protein data used in our e xperiments is also av ailable in the CAPSUL dataset. The number of labels for each subcellular location in three subsets is shown in T able 8 . Although the data is randomly assigned to different subsets, we have verified the distribu- tion characteristics among classes to maintain a similar proportional relationship, ensuring balance and representativ eness across the subsets. B D A TA S E T R E L I A B I L I T Y B . 1 O V E RV I E W O F D AT A S O U R C E S In Section 3 , we provide a detailed description of the data preprocessing procedures implemented to ensure the high quality of CAPSUL. Here, we would like to emphasize that the data sources themselves are highly reliable. Specifically , the protein-related data used in this study were primarily obtained from the following databases: AlphaFold. AlphaFold provides protein structural data in CAPSUL. 1) AlphaFold has already in- corporated experimentally resolved structur es of proteins as templates during its prediction pro- cess ( Jumper et al. , 2021 ). AlphaF old explicitly describes how its pipeline automatically searches 15 Published as a conference paper at ICLR 2026 T able 7: Categorization of CAPSUL and terminology mapping between HP A and Uniprot. 20 fine-grained categories HP A UniProt Nucleus Nuclear Membrane Nuclear membrane Nucleus membrane, Nucleus en velope, Nucleus inner membrane, Nucleus outer membrane Nucleoli Nucleoli, Nucleoli fibrillar center , Nucleoli rim Nucleolus Nucleoplasm Kinetochore, Mitotic chromosome, Nuclear bodies, Nuclear speckles, Nucleoplasm Nucleus matrix, Nucleus lamina, Chromosome, Nucleus speckle Cytoplasm Cytosol Aggresome, Cytoplasmic bodies, Cytosol, Rods Rings Cytosol Cytoskeleton Actin filaments, Cleav age furrow , Focal adhesion sites, Cytokinetic bridge, Microtubule ends, Microtubules, Midbody , Midbody ring, Mitotic spindle, Intermediate filaments Cytoskeleton Centrosome Centriolar satellite, Centrosome Centrosome Mitochondria Mitochondria Mitochondrion, Mitochondrion en velop, Mitochondrion inner membrane, Mitochondrion outer membrane, Mitochondrion membrane, Mitochondrion matrix, Mitochondrion intermembrane space Endoplasmic Reticulum Endoplasmic reticulum Endoplasmic reticulum, Endoplasmic reticulum membrane, Endoplasmic reticulum lumen, Microsome, Rough endoplasmic reticulum, Smooth endoplasmic reticulum, Sarcoplasmic reticulum Golgi Apparatus Golgi apparatus Golgi apparatus, Golgi apparatus membrane, Golgi apparatus lumen Cell Membrane Cell Junctions, Plasma membrane Cell membrane, Apical cell membrane, Apicolateral cell membrane, Basal cell membrane, Basolateral cell membrane, Lateral cell membrane, Cell projection Endosome Endosomes Endosome Lipid Droplet Lipid droplets Lipid droplet L ysosome/V acuole L ysosomes L ysosome, V acuole, V acuole lumen, V acuole membrane, L ysosome lumen, L ysosome membrane Peroxisome Peroxisomes Peroxisome, Peroxisome matrix, Peroxisome membrane V esicle V esicles V esicle Primary Cilium Basal body , Primary cilium, Primary cilium tip, Primary cilium transition zone Cilium Secreted Proteins Secreted Proteins Secreted Sperm Acrosome, Annulus, Calyx, Connecting piece, End piece, Equatorial segment, Flagellar centriole, Mid piece, Perinuclear theca, Principal piece Acrosome, Calyx, Perinuclear theca 16 Published as a conference paper at ICLR 2026 T able 8: Label counts for training, v alidation, and test set of CAPSUL. Subcellular Locations Counts T raining Set V alidation Set T est Set Sum Nucleus 5,312 1,128 1,150 7,590 Nuclear Membrane 313 63 76 452 Nucleoli 1,143 249 249 1,641 Nucleoplasm 4,751 1,007 1,028 6,786 Cytoplasm 4,652 984 977 6,613 Cytosol 3,787 811 788 5,386 Cytoskeleton 1,499 302 318 2,119 Centrosome 713 140 147 1,000 Mitochondria 1,247 259 262 1,768 Endoplasmic Reticulum 1,146 275 289 1,710 Golgi Apparatus 1,323 271 287 1,811 Cell Membrane 4,022 863 892 5,777 Endosome 466 113 108 687 Lipid Droplet 63 16 15 94 L ysosome/V acuole 313 65 75 453 Peroxisome 71 20 19 110 V esicle 2,019 404 440 2,863 Primary Cilium 699 123 161 983 Secreted Proteins 1,477 317 293 2,087 Sperm 444 99 109 652 the PDB for experimentally resolved structures, selecting up to four structural templates, and maps atom coordinates from those templates to the target sequence during inference. These coordinates are used as template inputs alongside MSA-based ev olutionary information, enabling AlphaFold to lev erage high-quality experimental structural data in its predictions. 2) AlphaFold-predicted struc- tures ha ve been demonstrated to achieve exceptionally high accuracy , competitiv e with experimen- tal data. AlphaFold was entered for CASP14, and shows that it achiev es accuracy competitiv e with experiment in a majority of cases. Specifically , the median backbone accuracy of its predictions is 0.96 ˚ A r .m.s.d. 95 (C α root-mean-square de viation at 95% residue cov erage), which is often within the margin of error of experimental structures ( Jumper et al. , 2021 ). 3) AlphaFold provides full- length protein structures containing complete structural information, which minimizes the potential negati ve influence of structural variability caused by dif ferent v ersions of e xperimental protein data. This choice allows us to maintain a high le vel of consistency across the CAPSUL dataset. UniProt. UniProt provides protein localization annotation and evidence-le vel annotations in CAP- SUL. UniProt serves as one of the most authoritative and widely used protein knowledge bases, integrating sequence, functional, and localization information across a broad spectrum of species. In particular , the manually curated Swiss-Prot section is recognized for its rigorous curation stan- dards, where annotations (including subcellular localization annotations) are deriv ed from authori- tativ e experimental studies and peer-re viewed literature, complemented by computational analyses and homology-based inferences. Each localization entry is systematically annotated with evidence codes that explicitly denote whether the information originates from direct experimental validation, literature reports, or computational prediction, thereby providing transparency and traceability of the data source. This evidence-based framework ensures that localization annotations are not only comprehensiv e but also of consistently high quality . Human Protein Atlas (HP A). HP A provides protein localization annotation and subcellular cat- egories reference in CAPSUL. HP A provides a unique and experimentally grounded resource for human protein subcellular localization. Its Subcellular Atlas is built upon systematic immunoflu- orescence imaging combined with antibody-based profiling in multiple well-characterized human cell lines. This approach allows direct visualization of protein distribution within distinct subcel- lular compartments, thereby offering cell-type-specific and high-resolution localization evidence. These measures substantially reduce the likelihood of false annotations and provide users with a clear indication of annotation confidence. B . 2 A N A LT E R NAT I V E A T T E M P T F O R P R OT E I N S T RU C T U R E I N P U T S In our study , we used protein structural data predicted by AlphaFold2, the most accurate and widely adopted source of protein structural information, to provide structure inputs for our structure- 17 Published as a conference paper at ICLR 2026 T able 9: Partial e v aluation on protein structure input from AlphaFold2 and Boltz-2. Subcellular Locations CDCon v t (1,223 protein structures from AlphaFold2) CDCon v t (1,223 protein structures from Boltz-2) Precision Recall F1-Score Precision Recall F1-Score Nucleus 0.798 0.709 0.751 0.788 0.565 0.658 Nuclear Membrane - - - - - - Nucleoli 0.500 0.064 0.113 0.267 0.025 0.047 Nucleoplasm 0.794 0.649 0.714 0.791 0.448 0.572 Cytoplasm 0.701 0.577 0.633 0.634 0.673 0.653 Cytosol 0.645 0.429 0.515 0.541 0.622 0.579 Cytoskeleton 0.548 0.085 0.147 0.467 0.035 0.065 Centrosome - - - - - - Mitochondria 0.694 0.200 0.311 0.358 0.152 0.213 Endoplasmic Reticulum 0.630 0.168 0.266 0.500 0.149 0.229 Golgi Apparatus 0.500 0.023 0.044 0.333 0.008 0.015 Cell Membrane 0.823 0.382 0.522 0.826 0.269 0.406 Endosome - - - - - - Lipid Droplet - - - - - - L ysosome/V acuole - - - - - - Peroxisome - - - - - - V esicle 0.800 0.019 0.037 0.667 0.010 0.019 Primary Cilium - - - - - - Secreted Proteins 0.724 0.375 0.494 0.655 0.339 0.447 Sperm - - - - - - Micro A vg 0.745 0.407 0.527 0.668 0.371 0.477 Macro A vg 0.408 0.184 0.227 0.341 0.165 0.195 t The original MLP is replaced by Transformer layers. “–” indicates that no prediction is made for that location. based models. W e acknowledge that Boltz is an efficient implementation of the still-unreleased AlphaFold3, and therefore seek to e xamine the subcellular localization performance when using Boltz-predicted structures as input ( W ohlwend et al. , 2025 ; P assaro et al. , 2025 ). T o the best of our knowledge, Boltz has not publicly released a complete set of inference results of human protein structures, compared with the AlphaFold2 dataset whose complete inference results can be do wnloaded publicly . Therefore, we locate a partial dataset of Boltz inference results, which includes structures of protein comple xes predicted by Boltz-2 ( Ille et al. , 2025 ). From this work, we extracted the subset overlapping with our CAPSUL benchmark, yielding 1,223 proteins. For these 1,223 proteins, we compared dif ferent structure inputs ( i.e . , structures predicted by AlphaF old2 and by Boltz-2) on our pre viously trained structure-based model CDCon v for inference. W e report the results in T able 9 . Across the ov erall metric and the majority of subcellular locations, AlphaFold2-based structural inputs outperform Boltz-based inputs . This observation further supports the rationale behind our use of AlphaFold2-predicted structures in constructing CAPSUL. As the most accurate and widely adopted source of protein structural information, AlphaFold2 provides high-quality structural inputs that lead to strong downstream performance in subcellular localization. C E X P E R I M E N T D E T A I L S C . 1 I M P L E M E N TA T I O N D E T A I L S The experiments were performed utilizing NVIDIA R TX 3090, A40 and A100 GPUs. W e employ an early stopping strategy to mitigate overfitting with a tolerance of 5 epochs. Hyperparameters such as learning rate, number of epochs, and batch size are e xplored separately for each model type, considering their distinct architectures. C . 2 F U RT H E R D E S C R I P T I O N O F S T R U C T U R E - BA S E D M O D E L S A N D T H E I R E X T E N S I O N S C . 2 . 1 O V E R V I E W O F G R A P H C O N S T RU C T I O N In the graphs constructed by our structure-based models, each node represents an amino acid, and edges encode the relationships between amino acids. Specifically , the edges are constructed as follows: 18 Published as a conference paper at ICLR 2026 Edge Criteria. There are two types of adjacency to form the edges in the graphs. Sequential adjacency refers to the proximity of amino acids along the one-dimensional primary sequence of a protein ( e.g., if the sequential adjacency range is set to 3, then the amino acids from position [x-3, x+3] are considered sequential neighbors of the x-th residue). On the other hand, spatial adjacency captures the proximity of amino acids in the three-dimensional space of the protein ( e.g., if the spatial adjacency radius is set to 8 ˚ A, all amino acids located within an 8 ˚ Asphere centered at a giv en residue are considered its spatial neighbors). These adjacency relationships define the edges in the constructed protein graph. Edge Featur es. For the GCN-based baselines CDConv and GearNet-Edge, we adopted their in- nov ati ve edge feature implementation methods originally proposed in their respectiv e frameworks, which can be found in the corresponding publications ( Fan et al. , 2022 ; Zhang et al. , 2022 ). These methods incorporate and encode both relative orientation and Euclidean distance. For our extended models, Graph Transformer , Graph Mamba, and Graph Diffusion, the edge features are derived by processing the aforementioned different edge criteria through an embedding layer . C . 2 . 2 E X P L A NAT I O N O F G R A P H E N C O D E R W ithin the structure-based baseline models, the graph encoders v ary in their approaches to process- ing the input feature vectors: A GCN updates node representations via neighborhood aggregation, i.e., m (0) i = x i , m ( l +1) i = σ P j ∈N ( i ) W ( l ) m ( l ) j + b ( l ) . m ( l ) i is the representation of node i at layer l (the first layer is initialized with node embeddings x i various in different baselines), N ( i ) denotes the neighbors of node i , W ( l ) and b ( l ) are trainable weights and bias, and σ is a non-linear activ ation function ( e.g. , ReLU). After L layers of graph con volution, we obtain the final node repre- sentations { m ( L ) i } n i =1 . T o enhance interpretability and capture global interactions among residues, we replace the traditional average pooling with a Transformer encoder T ( · ) to obtain the residue representation, i.e., h = ( h 1 , . . . , h n ) = T { m ( L ) i } n i =1 , where h ∈ R n × d . Similarly , Graph T ransformer and Graph Mamba substitute the conv olution-based encoder with their respective architectures, while adhering to the same o verall procedure to obtain the global protein representation. Giv en a protein structure represented as a graph, we introduce a diffusion -based refinement pro- cess in which node coordinates or geometric features are gradually perturbed with Gaussian noise and then denoised through a learned rev erse process. The diffusion module serves as an auxiliary representation-learning stage designed to enhance geometric feature extraction prior to the down- stream subcellular localization prediction. This allows the network to capture multi-scale spatial dependencies while remaining robust to structural noise. C . 2 . 3 E X P L A NAT I O N O F C O N T R A S T I V E L E A R N I N G A N D F U S I O N M O D E L S CDCon v with Contrastive Loss. For each of the 20 subcellular compartments, we construct posi- tiv e pairs ( i.e., pairing protein samples that localize to the same compartment), and positive–ne gati ve pairs ( i.e., pairing one protein that localizes to the compartment with another that does not). On top of the original loss function, we incorporate a contrasti ve loss to encourage higher embedding simi- larity for positiv e pairs while enforcing lo wer similarity for positiv e–negati ve pairs. W e provide a formal mathematical description of how the contrastiv e loss is incorporated. Let ¯ h denote the protein-lev el representations from model ( i.e., average embedding obtained before MLP classifier). For each of the 20 independent classification tasks, we compute the cosine similarity between representations of positi ve–positi ve pairs and positiv e–negati ve pairs, and construct the contrastiv e loss accordingly . For class c ∈ { 1 , . . . , 20 } , let • P c = { i | y i,c = 1 } denote the set of positiv e samples, • N c = { i | y i,c = 0 } denote the negati ve samples, • ¯ h i denotes the protein-lev el embedding of the sample i . The positiv e–positi ve similarity matrix is S (+ , +) ij = cos( z i , z j ) , i, j ∈ P c . 19 Published as a conference paper at ICLR 2026 W e encourage positi ve samples to be close to each other by minimizing L (+ , +) c = 1 − 1 |P c | 2 X i,j ∈P c S (+ , +) ij . The positiv e–negati ve similarity matrix is S (+ , − ) ij = cos( z i , z j ) , i ∈ P c , j ∈ N c . W e encourage positi ve and neg ativ e samples to be dissimilar by minimizing L (+ , − ) c = 1 |P c ||N c | X i ∈P c X j ∈N c S (+ , − ) ij . Thus, the contrastiv e loss for class c is L contrast c = L (+ , +) c + L (+ , − ) c . Finally , the overall contrasti ve loss a veraged o ver all classes is L contrast = 1 C C X c =1 L contrast c . ESM-C+CDCon v Fusion Model. In the early fusion model, the structural representations pro- duced by CDCon v (without the additional Transformer architecture introduced by our paper) for each amino acid are added to the initial protein embedding of ESM-C. The combined representation is then passed through the pretrained ESM-C T ransformer for interaction, follo wed by mean pool- ing to obtain a protein-level representation for downstream classification. The late fusion setting is similar , except that the structural representations from CDCon v are added to the final sequence representation produced by ESM-C before mean pooling for the downstream classification task. C . 3 H Y P E R P A R A M E T E R S E T T I N G S For all the experiments, we choose the best hyperparameters according to the best micro F1-score on the test set. For the main experiment, the best hyperparameter setting for each model is as follows: 1) ESM-2 (650M) , the MLP hidden layers are set to (512,256), and learning rate to 1 × 10 − 4 . 2) ESM- C (600M) , the MLP hidden layers are set to (512,256) (to (512) when finetuning), and learning rate to 5 × 10 − 4 . 3) FoldSeek , the embedding dimensions are set to 256, transformer layers to 2, transformer heads to 4, and learning rate to 1 × 10 − 4 . 4) CDCon v , the kernel channels are set to 24, feature channels to (256,512), geometric adjacency to 4 ˚ Aand 8 ˚ A(gradually increase with the con volutional layers), sequential adjacency to 5, sequential kernel size to 5, transformer layers to 3, transformer heads to 2, and learning rate to 5 × 10 − 4 . 5) GearNet-Edge , the max sequence length is set to 3,000, spatial adjacency set to [5 ˚ A,10 ˚ A], KNN adjacenc y set to [5,10], sequential adjacency set to 2, con volution hidden dimensions to (512,512,512), transformer layers to 2, transformer heads to 2, and learning rate to 1 × 10 − 5 . 6) Graph T ransformer , the transformer layers are set to 10, geometric adjacency to 10 ˚ A, sequential adjacency to 5, node dimensions set to 256, positional embedding dimension set to 8, and learning rate set to 5 × 10 − 5 . 7) Graph Mamba , the Mamba layers are set to 5, geometric adjacency to 10 ˚ A, sequential adjacency to 5, node dimensions set to 256, and learning rate set to 1 × 10 − 4 . 8) Graph Diffusion , the node dimensions are set to 64, geometric adjacency to 10 ˚ A, sequential adjacency to 5, timesteps set to 200, variance of Gaussian noise set to 1 × 10 − 4 in the beginning and 0.02 in the end, weight for dif fusion loss to 0.1 compared with classification loss, and learning rate to 5 × 10 − 4 . 9) CDConv with Contrastive Loss , the weight for contrastive loss is set to 0.1 compared with classification loss, and other settings are the same as the originial CDCon v . 10) ESM-C+CDConv Fusion Model , the learning rate is set to 5 × 10 − 4 for early fusion and to 1 × 10 − 4 for late fusion, and other settings are the same as the originial ESM-C and CDCon v . For the reweighting strategy , we inherit the optimal hyperparameter settings for ESM-C (600M), CDCon v , and GearNet-Edge mentioned above. The best reweighting scheme for each model is as 20 Published as a conference paper at ICLR 2026 follows: 1) ESM-C (600M) , focal loss with α set to the weights of log-in verse frequency , and γ set to 1.0. 2) CDCon v , focal loss with α set to the weights of log-in verse frequenc y , and γ set to 3.0. 3) GearNet-Edge , in verse frequenc y reweighting. For the single-label classification strategy , we inherit the optimal hyperparameter settings for ESM-C (600M), CDCon v , and GearNet-Edge mentioned above. T o address class imbalance, we undersam- ple the negativ e class to achieve a 1:3 positive-to-ne gati ve sample ratio for ESM-C (600M), and a 1:1 positiv e-to-negati ve sample ratio for CDCon v . D D E T A I L E D B A S E L I N E R E S U L T S Detailed e xperimental results of main experiments, re weighting strategy , and single-label classifica- tion strategy are provided in T ables 10 , 11 , and 12 , respecti vely . They include ev aluation metrics of precision, recall, and F1-score. E A B L A T I O N S T U D Y Although it has been recognized in the biological community that many patterns of subcellular localization cannot be fully captured by simple sequence information, we aim to in vestigate the potential benefits of incorporating protein structural information as input for prediction. Therefore, we conduct an ablation study on two representati ve structure-based baselines to quanti fy the positi ve impact of 3D information incorporated. Specifically , to preserve the integrity of the model input, we performed preprocessing on the pro- tein structural data. For each protein, we obtained the boundary values of its 3D coordinates and uniformly sampled the C α coordinates at random within these boundaries to generate new protein structures. The 1D sequence data were kept unchanged, while the randomly sampled structures were used as the 3D structural input. Using the same hyperparameter settings as in the main experiments, we conducted an ablation study , with the detailed results shown in T able 13 . W e observed a signif- icant performance drop in this setting, which further demonstrates the decisiv e role of accurate 3D structural input in enabling correct model predictions. F E X P L A NA T I O N A N D I L L U S T R A T I V E E X A M P L E S O F E V I D E N C E - L E V E L A N N OTA T I O N S F . 1 E X P L A NA T I O N O F E V I D E N C E - L E V E L A N N OTA T I O N S The evidence-le vel annotations design was originally intended to allow researchers to flexibly se- lect annotations based on their specific use cases. For instance, when the task is rigorous and re- quires high precision such as Nucleolar retention motifs discov ery , selecting annotations with high confidence ( i.e., choosing the experimentally validated annotations only) is more appropriate. Con- versely , for large-scale protein localization prediction, using lower -confidence but more abundant annotations ( i.e., choosing both the non-experimentally validated and non-experimentally validated annotations) enriches the training data and leads to better model performance. F . 2 I L L U S T R A T I V E E X A M P L E S O F T H R E E S T R A T E G I E S T OW A R D S N O N - E X P E R I M E N T A L LY V A L I D A T E D A N N OTA T I O N S In our main e xperiments, all non-e xperimentally v alidated annotations were treated as positi ve sam- ples to enhance the models’ performance in high-throughput prediction settings. Here we present two illustrativ e examples of the flexible usages of evidence-lev el annotations: 1) weighting labels ( i.e., treating non-experimentally validated annotations as positi ve samples, but assigning a weight of 0.7 to them relative to experimental ones, which reduces the weight of non-experimental data in influencing the model) and 2) filtering labels ( i.e., treating non-e xperimentally validated annota- tions as ne gati ve samples, which restricts models learning to experimental data with high reliability). The results are compared with the original one in our paper in T able 14 . 21 Published as a conference paper at ICLR 2026 T able 10: Detailed performance of sequence-based and structure-based methods on CAPSUL. Subcellular Locations DeepLoc 2.1 ESM-2 650M ESM-2 650M f Precision Recall F1-Score Precision Recall F1-Score Precision Recall F1-Score Nucleus 0.675 0.086 0.152 - - - 0.633 0.586 0.609 Nuclear Membrane / / / - - - - - - Nucleoli / / / - - - - - - Nucleoplasm / / / - - - 0.592 0.535 0.562 Cytoplasm 0.510 0.100 0.167 - - - 0.598 0.157 0.248 Cytosol / / / - - - - - - Cytoskeleton / / / - - - 0.200 0.003 0.006 Centrosome / / / - - - - - - Mitochondria 0.799 0.065 0.120 - - - 0.850 0.195 0.317 Endoplasmic Reticulum 0.581 0.067 0.121 - - - - - - Golgi Apparatus 0.594 0.032 0.061 - - - - - - Cell Membrane 0.740 0.078 0.142 - - - 0.722 0.451 0.555 Endosome / / / - - - - - - Lipid Droplet / / / - - - - - - L ysosome/V acuole 0.198 0.084 0.118 - - - - - - Peroxisome 0.667 0.073 0.131 - - - - - - V esicle / / / - - - - - - Primary Cilium / / / - - - - - - Secreted Proteins 0.773 0.109 0.191 - - - 0.742 0.686 0.713 Sperm / / / - - - - - - Micro A vg / / / - - - 0.647 0.264 0.375 Macro A vg / / / - - - 0.217 0.131 0.150 Subcellular Locations ESM-C 600M ESM-C 600M f ESM-C 600M 0 Precision Recall F1-Score Precision Recall F1-Score Precision Recall F1-Score Nucleus 0.694 0.609 0.649 0.708 0.597 0.648 0.626 0.498 0.555 Nuclear Membrane - - - - - - - - - Nucleoli 0.800 0.048 0.091 1.000 0.020 0.039 1.000 0.012 0.024 Nucleoplasm 0.679 0.573 0.621 0.686 0.570 0.623 0.620 0.418 0.500 Cytoplasm 0.611 0.477 0.536 0.614 0.499 0.551 0.507 0.385 0.438 Cytosol 0.541 0.307 0.392 0.567 0.286 0.380 0.456 0.104 0.169 Cytoskeleton 0.681 0.154 0.251 0.629 0.123 0.205 0.471 0.025 0.048 Centrosome 1.000 0.007 0.014 - - - - - - Mitochondria 0.865 0.416 0.562 0.903 0.389 0.544 0.667 0.053 0.099 Endoplasmic Reticulum 0.687 0.235 0.351 0.674 0.221 0.333 0.500 0.031 0.059 Golgi Apparatus 0.938 0.052 0.099 1.000 0.014 0.027 - - - Cell Membrane 0.777 0.531 0.631 0.753 0.568 0.648 0.786 0.243 0.372 Endosome 1.000 0.009 0.018 - - - - - - Lipid Droplet - - - - - - - - - L ysosome/V acuole - - - - - - - - - Peroxisome - - - - - - - - - V esicle 1.000 0.005 0.009 - - - 1.000 0.002 0.005 Primary Cilium 0.682 0.093 0.164 0.556 0.062 0.112 - - - Secreted Proteins 0.903 0.761 0.826 0.877 0.730 0.797 0.604 0.338 0.433 Sperm 0.500 0.028 0.052 0.667 0.037 0.070 - - - Micro A vg 0.690 0.386 0.495 0.693 0.382 0.492 0.598 0.236 0.338 Macro A vg 0.618 0.215 0.263 0.482 0.206 0.249 0.362 0.106 0.135 Subcellular Locations FoldSeek CDCon v t GearNet-Edge t Precision Recall F1-Score Precision Recall F1-Score Precision Recall F1-Score Nucleus 0.616 0.398 0.484 0.651 0.592 0.620 0.619 0.450 0.521 Nuclear Membrane - - - - - - - - - Nucleoli - - - 0.583 0.084 0.147 0.531 0.068 0.121 Nucleoplasm 0.591 0.341 0.433 0.633 0.541 0.583 0.613 0.444 0.515 Cytoplasm 0.581 0.102 0.174 0.580 0.414 0.483 0.498 0.491 0.495 Cytosol 0.500 0.001 0.003 0.489 0.277 0.353 0.417 0.358 0.385 Cytoskeleton 0.480 0.038 0.070 0.649 0.075 0.135 0.296 0.186 0.228 Centrosome - - - - - - 0.228 0.088 0.127 Mitochondria - - - 0.707 0.359 0.476 0.470 0.240 0.318 Endoplasmic Reticulum - - - 0.441 0.218 0.292 0.475 0.197 0.279 Golgi Apparatus - - - 0.733 0.038 0.073 0.211 0.014 0.026 Cell Membrane 0.626 0.237 0.343 0.721 0.461 0.562 0.708 0.457 0.556 Endosome - - - - - - 0.364 0.037 0.067 Lipid Droplet - - - - - - - - - L ysosome/V acuole - - - - - - 0.429 0.040 0.073 Peroxisome - - - - - - - - - V esicle - - - 0.667 0.014 0.027 0.270 0.039 0.068 Primary Cilium - - - - - - 0.467 0.087 0.147 Secreted Proteins 0.600 0.225 0.328 0.795 0.741 0.767 0.722 0.655 0.687 Sperm - - - - - - 0.714 0.046 0.086 Micro A vg 0.605 0.156 0.248 0.632 0.352 0.452 0.546 0.337 0.417 Macro A vg 0.200 0.067 0.092 0.382 0.191 0.226 0.402 0.195 0.235 22 Published as a conference paper at ICLR 2026 T able 10: (Continued) Detailed performance of sequence-based and structure-based methods on CAPSUL. Subcellular Locations Graph Transformer Graph Mamba Graph Diffusion Precision Recall F1-Score Precision Recall F1-Score Precision Recall F1-Score Nucleus 0.664 0.543 0.597 0.562 0.556 0.559 0.617 0.631 0.624 Nuclear Membrane - - - 0.061 0.026 0.037 - - - Nucleoli 0.554 0.124 0.203 0.433 0.104 0.168 0.667 0.024 0.047 Nucleoplasm 0.642 0.483 0.552 0.526 0.481 0.502 0.590 0.566 0.578 Cytoplasm 0.552 0.305 0.393 0.476 0.373 0.418 0.542 0.469 0.503 Cytosol 0.457 0.170 0.248 0.421 0.431 0.426 0.440 0.214 0.288 Cytoskeleton 0.538 0.022 0.042 0.249 0.296 0.270 0.383 0.057 0.099 Centrosome - - - 0.128 0.313 0.181 1.000 0.007 0.014 Mitochondria 0.688 0.363 0.475 0.407 0.294 0.341 0.680 0.195 0.303 Endoplasmic Reticulum 0.552 0.111 0.184 0.529 0.031 0.059 0.556 0.087 0.150 Golgi Apparatus 0.857 0.021 0.041 0.182 0.188 0.185 - - - Cell Membrane 0.718 0.442 0.547 0.417 0.766 0.540 0.737 0.373 0.496 Endosome - - - 0.125 0.083 0.100 - - - Lipid Droplet - - - - - - - - - L ysosome/V acuole - - - - - - - - - Peroxisome - - - - - - - - - V esicle 0.526 0.023 0.044 0.306 0.086 0.135 0.667 0.009 0.018 Primary Cilium 0.500 0.006 0.012 0.205 0.056 0.088 - - - Secreted Proteins 0.767 0.652 0.705 0.426 0.802 0.557 0.738 0.539 0.623 Sperm 1.000 0.009 0.018 0.116 0.147 0.130 - - - Micro A vg 0.637 0.302 0.410 0.414 0.408 0.411 0.596 0.329 0.424 Macro A vg 0.451 0.164 0.203 0.279 0.252 0.235 0.381 0.159 0.187 Subcellular Locations CDCon v with Contrastive Loss ESM-C+CDCon v Early Fusion ESM-C+CDConv Late Fusion Precision Recall F1-Score Precision Recall F1-Score Precision Recall F1-Score Nucleus 0.681 0.524 0.592 0.712 0.587 0.643 0.701 0.598 0.645 Nuclear Membrane - - - - - - - - - Nucleoli 0.556 0.080 0.140 0.739 0.068 0.125 0.210 0.120 0.153 Nucleoplasm 0.646 0.487 0.556 0.704 0.591 0.643 0.676 0.567 0.617 Cytoplasm 0.590 0.404 0.480 0.682 0.341 0.455 0.572 0.469 0.515 Cytosol 0.516 0.165 0.250 0.487 0.094 0.157 0.467 0.306 0.370 Cytoskeleton 0.473 0.164 0.243 0.773 0.053 0.100 0.412 0.220 0.287 Centrosome - - - - - - 0.231 0.020 0.037 Mitochondria 0.754 0.340 0.468 0.872 0.416 0.563 0.827 0.420 0.557 Endoplasmic Reticulum 0.519 0.277 0.361 0.595 0.356 0.446 - - - Golgi Apparatus 0.553 0.091 0.156 0.462 0.171 0.249 - - - Cell Membrane 0.746 0.422 0.539 0.774 0.530 0.629 0.732 0.622 0.673 Endosome 0.250 0.019 0.034 1.000 0.028 0.054 - - - Lipid Droplet - - - - - - - - - L ysosome/V acuole - - - 1.000 0.013 0.026 - - - Peroxisome - - - - - - - - - V esicle 0.750 0.014 0.027 0.432 0.036 0.067 - - - Primary Cilium 0.500 0.019 0.036 - - - 0.255 0.075 0.115 Secreted Proteins 0.797 0.765 0.780 0.905 0.747 0.819 0.908 0.604 0.725 Sperm 1.000 0.009 0.018 - - - - - - Micro A vg 0.650 0.326 0.435 0.710 0.351 0.470 0.634 0.381 0.476 Macro A vg 0.467 0.189 0.234 0.507 0.202 0.249 0.300 0.201 0.235 f W e finetune the pre-trained protein language model. t The original MLP is replaced by Transformer layers. 0 The parameters of ESM-C is initialized randomly . “/” indicates that DeepLoc 2.1 does not support prediction for that location, and therefore, a verage metrics are not considered in this case. “–” indicates that no prediction is made for that location. 23 Published as a conference paper at ICLR 2026 T able 11: Detailed performance of selected baselines with re weighting scheme. Subcellular Locations ESM-C 600M CDCon v t GearNet-Edge t Precision Recall F1-Score Precision Recall F1-Score Precision Recall F1-Score Nucleus 0.698 0.575 0.630 0.481 0.892 0.625 0.484 0.856 0.618 Nuclear Membrane - - - 0.033 0.566 0.062 0.046 0.079 0.058 Nucleoli - - - 0.105 0.916 0.188 0.153 0.418 0.224 Nucleoplasm 0.679 0.500 0.576 0.469 0.859 0.607 0.436 0.841 0.574 Cytoplasm 0.568 0.446 0.500 0.450 0.823 0.582 0.441 0.711 0.544 Cytosol 0.513 0.076 0.133 0.353 0.829 0.495 0.366 0.714 0.484 Cytoskeleton 0.778 0.044 0.083 0.184 0.698 0.292 0.218 0.450 0.294 Centrosome - - - 0.089 0.776 0.160 0.134 0.252 0.175 Mitochondria 0.846 0.336 0.481 0.191 0.672 0.297 0.247 0.427 0.313 Endoplasmic Reticulum - - - 0.195 0.737 0.308 0.276 0.460 0.345 Golgi Apparatus - - - 0.152 0.648 0.246 0.177 0.366 0.238 Cell Membrane 0.723 0.465 0.566 0.462 0.709 0.560 0.398 0.820 0.536 Endosome - - - 0.067 0.407 0.114 0.177 0.130 0.150 Lipid Droplet 1.000 0.133 0.235 0.014 0.067 0.023 0.333 0.067 0.111 L ysosome/V acuole - - - 0.117 0.347 0.175 0.116 0.107 0.111 Peroxisome 1.000 0.105 0.190 0.040 0.421 0.072 0.111 0.105 0.108 V esicle - - - 0.198 0.532 0.288 0.206 0.445 0.281 Primary Cilium 0.667 0.012 0.024 0.096 0.640 0.167 0.123 0.311 0.176 Secreted Proteins 0.833 0.730 0.778 0.413 0.891 0.564 0.509 0.775 0.614 Sperm - - - 0.066 0.679 0.120 0.109 0.147 0.125 Micro A vg 0.679 0.313 0.429 0.253 0.772 0.381 0.348 0.650 0.453 Macro A vg 0.415 0.171 0.210 0.209 0.655 0.197 0.253 0.424 0.304 t The original MLP is replaced by Transformer layers. “–” indicates that no prediction is made for that location. T able 12: Detailed performance of selected baselines with single-label classification strategy . Subcellular Locations ESM-C 600M CDCon v t GearNet-Edge t Precision Recall F1-Score Precision Recall F1-Score Precision Recall F1-Score Nuclear Membrane - - - 0.027 0.711 0.052 0.026 0.118 0.042 Nucleoli 0.251 0.285 0.267 0.082 0.992 0.151 0.151 0.470 0.228 Centrosome 0.124 0.361 0.184 0.051 0.333 0.089 0.099 0.531 0.167 Golgi Apparatus 0.293 0.268 0.280 0.080 0.199 0.114 0.161 0.303 0.210 Endosome 0.111 0.333 0.167 0.029 0.176 0.049 0.082 0.278 0.126 Lipid Droplet 0.011 0.200 0.021 - - - 0.032 0.133 0.051 L ysosome/V acuole 0.075 0.253 0.115 - - - 0.097 0.493 0.162 Peroxisome 0.029 0.526 0.054 - - - 0.013 0.158 0.023 V esicle 0.270 0.039 0.068 0.141 0.625 0.230 0.207 0.380 0.268 Primary Cilium 0.175 0.460 0.253 0.055 0.379 0.097 0.104 0.472 0.171 Sperm 0.121 0.229 0.159 0.045 0.138 0.068 0.077 0.239 0.117 t The original MLP is replaced by Transformer layers. “–” indicates that no prediction is made for that location. T able 13: Detailed performance comparison of CDCon v and GearNet-Edge under random sampling of C α coordinates. Subcellular Locations CDConv t (ablation) CDConv t GearNet-Edge t (ablation) GearNet-Edge t Precision Recall F1-Score Precision Recall F1-Score Precision Recall F1-Score Precision Recall F1-Score Nucleus 0.595 0.512 0.550 0.651 0.592 0.620 0.515 0.459 0.485 0.619 0.450 0.521 Nuclear Membrane - - - - - - - - - - - - Nucleoli 0.417 0.020 0.038 0.583 0.084 0.147 0.268 0.076 0.119 0.531 0.068 0.121 Nucleoplasm 0.578 0.419 0.486 0.633 0.541 0.583 0.479 0.428 0.452 0.613 0.444 0.515 Cytoplasm 0.535 0.214 0.306 0.580 0.414 0.483 0.432 0.414 0.422 0.498 0.491 0.495 Cytosol 0.478 0.069 0.120 0.489 0.277 0.353 0.394 0.279 0.327 0.417 0.358 0.385 Cytoskeleton - - - 0.649 0.075 0.135 0.252 0.119 0.162 0.296 0.186 0.228 Centrosome - - - - - - 0.184 0.061 0.092 0.228 0.088 0.127 Mitochondria 0.537 0.084 0.145 0.707 0.359 0.476 0.283 0.065 0.106 0.470 0.240 0.318 Endoplasmic Reticulum 0.625 0.017 0.034 0.441 0.218 0.292 0.321 0.062 0.104 0.475 0.197 0.279 Golgi Apparatus - - - 0.733 0.038 0.073 0.132 0.017 0.031 0.211 0.014 0.026 Cell Membrane 0.621 0.425 0.505 0.721 0.461 0.562 0.595 0.413 0.487 0.708 0.457 0.556 Endosome - - - - - - - - - 0.364 0.037 0.067 Lipid Droplet - - - - - - - - - - - - L ysosome/V acuole - - - - - - - - - 0.429 0.040 0.073 Peroxisome - - - - - - - - - - - - V esicle - - - 0.667 0.014 0.027 0.185 0.077 0.109 0.270 0.039 0.068 Primary Cilium - - - - - - 0.368 0.043 0.078 0.467 0.087 0.147 Secreted Proteins 0.703 0.218 0.333 0.795 0.741 0.767 0.515 0.232 0.320 0.722 0.655 0.687 Sperm - - - - - - 0.125 0.009 0.017 0.714 0.046 0.086 Micro A vg 0.586 0.229 0.329 0.632 0.352 0.452 0.450 0.283 0.348 0.546 0.337 0.417 Macro A vg 0.254 0.099 0.126 0.382 0.191 0.226 0.252 0.138 0.166 0.402 0.195 0.235 t The original MLP is replaced by Transformer layers. “–” indicates that no prediction is made for that location. 24 Published as a conference paper at ICLR 2026 T able 14: Detailed performance of two illustrativ e examples of evidence-le vel annotations: weight- ing labels and filtering labels. Subcellular Locations ESM-C 600M ESM-C 600M (weighting) ESM-C 600M (filtering) Precision Recall F1-Score Precision Recall F1-Score Precision Recall F1-Score Nucleus 0.694 0.609 0.649 0.717 0.585 0.645 0.703 0.575 0.633 Nuclear Membrane - - - - - - - - - Nucleoli 0.800 0.048 0.091 0.786 0.088 0.159 0.867 0.055 0.104 Nucleoplasm 0.679 0.573 0.621 0.692 0.558 0.618 0.686 0.551 0.611 Cytoplasm 0.611 0.477 0.536 0.619 0.453 0.523 0.572 0.400 0.470 Cytosol 0.541 0.307 0.392 0.534 0.256 0.346 0.590 0.239 0.340 Cytoskeleton 0.681 0.154 0.251 0.649 0.116 0.197 0.381 0.034 0.062 Centrosome 1.000 0.007 0.014 1.000 0.007 0.014 - - - Mitochondria 0.865 0.416 0.562 0.907 0.374 0.530 0.798 0.373 0.508 Endoplasmic Reticulum 0.687 0.235 0.351 0.726 0.156 0.256 0.500 0.039 0.072 Golgi Apparatus 0.938 0.052 0.099 1.000 0.010 0.021 - - - Cell Membrane 0.777 0.531 0.631 0.757 0.570 0.650 0.661 0.254 0.367 Endosome 1.000 0.009 0.018 - - - - - - Lipid Droplet - - - - - - - - - L ysosome/V acuole - - - - - - - - - Peroxisome - - - - - - - - - V esicle 1.000 0.005 0.009 1.000 0.005 0.009 - - - Primary Cilium 0.682 0.093 0.164 0.538 0.043 0.080 1.000 0.008 0.016 Secreted Proteins 0.903 0.761 0.826 0.920 0.669 0.775 - - - Sperm 0.500 0.028 0.052 0.800 0.037 0.070 0.500 0.010 0.019 Micro A vg 0.690 0.386 0.495 0.700 0.366 0.481 0.657 0.306 0.418 Macro A vg 0.618 0.215 0.263 0.582 0.196 0.245 0.363 0.127 0.160 Subcellular Locations CDCon v t CDCon v t (weighting) CDCon v t (filtering) Precision Recall F1-Score Precision Recall F1-Score Precision Recall F1-Score Nucleus 0.651 0.592 0.620 0.674 0.539 0.599 0.644 0.530 0.581 Nuclear Membrane - - - - - - - - - Nucleoli 0.583 0.084 0.147 0.556 0.020 0.039 0.484 0.640 0.112 Nucleoplasm 0.633 0.541 0.583 0.657 0.497 0.566 0.652 0.424 0.514 Cytoplasm 0.580 0.414 0.483 0.557 0.469 0.509 0.528 0.445 0.483 Cytosol 0.489 0.277 0.353 0.470 0.293 0.361 0.468 0.337 0.392 Cytoskeleton 0.649 0.075 0.135 0.714 0.063 0.116 0.400 0.008 0.016 Centrosome - - - - - - - - - Mitochondria 0.707 0.359 0.476 0.762 0.355 0.484 0.588 0.363 0.449 Endoplasmic Reticulum 0.441 0.218 0.292 0.561 0.159 0.248 0.278 0.024 0.045 Golgi Apparatus 0.733 0.038 0.073 0.615 0.028 0.053 - - - Cell Membrane 0.721 0.461 0.562 0.723 0.447 0.553 0.562 0.194 0.288 Endosome - - - - - - - - - Lipid Droplet - - - - - - - - - L ysosome/V acuole - - - - - - - - - Peroxisome - - - - - - - - - V esicle 0.667 0.014 0.027 - - - - - - Primary Cilium - - - 0.333 0.006 0.012 - - - Secreted Proteins 0.795 0.741 0.767 0.857 0.573 0.687 0.400 0.044 0.079 Sperm - - - - - - - - - Micro A vg 0.632 0.352 0.452 0.637 0.333 0.438 0.577 0.291 0.386 Macro A vg 0.382 0.191 0.226 0.374 0.173 0.211 0.250 0.122 0.148 Subcellular Locations GearNet-Edge t GearNet-Edge t (weighting) GearNet-Edge t (filtering) Precision Recall F1-Score Precision Recall F1-Score Precision Recall F1-Score Nucleus 0.619 0.450 0.521 0.622 0.337 0.437 0.607 0.478 0.535 Nuclear Membrane - - - - - - - - - Nucleoli 0.531 0.068 0.121 0.421 0.032 0.060 0.333 0.064 0.107 Nucleoplasm 0.613 0.444 0.515 0.618 0.326 0.427 0.576 0.453 0.507 Cytoplasm 0.498 0.491 0.495 0.473 0.466 0.469 0.452 0.479 0.465 Cytosol 0.417 0.358 0.385 0.424 0.339 0.377 0.394 0.403 0.398 Cytoskeleton 0.296 0.186 0.228 0.342 0.167 0.224 0.284 0.105 0.153 Centrosome 0.228 0.088 0.127 0.213 0.068 0.103 0.200 0.054 0.085 Mitochondria 0.470 0.240 0.318 0.667 0.176 0.278 0.508 0.142 0.221 Endoplasmic Reticulum 0.475 0.197 0.279 0.435 0.128 0.198 0.268 0.073 0.115 Golgi Apparatus 0.211 0.014 0.026 0.211 0.014 0.026 0.250 0.004 0.008 Cell Membrane 0.708 0.457 0.556 0.629 0.392 0.483 0.463 0.170 0.248 Endosome 0.364 0.037 0.067 0.333 0.028 0.051 0.500 0.029 0.056 Lipid Droplet - - - - - - - - - L ysosome/V acuole 0.429 0.040 0.073 0.125 0.013 0.024 - - - Peroxisome - - - - - - - - - V esicle 0.270 0.039 0.068 0.268 0.093 0.138 0.280 0.055 0.092 Primary Cilium 0.467 0.087 0.147 0.524 0.068 0.121 0.364 0.031 0.058 Secreted Proteins 0.722 0.655 0.687 0.826 0.519 0.637 0.273 0.066 0.106 Sperm 0.714 0.046 0.086 0.667 0.037 0.070 0.500 0.020 0.038 Micro A vg 0.546 0.337 0.417 0.529 0.282 0.368 0.485 0.300 0.371 Macro A vg 0.402 0.195 0.235 0.390 0.160 0.206 0.313 0.131 0.160 t The original MLP is replaced by Transformer layers. “–” indicates that no prediction is made for that location. 25 Published as a conference paper at ICLR 2026 T able 15: Detailed performance of different weights for non-experimentally validated annotations on ESM-C. Subcellular Locations ESM-C weighting 0.1 ESM-C weighting 0.3 ESM-C weighting 0.5 Precision Recall F1-Score Precision Recall F1-Score Precision Recall F1-Score Nucleus 0.733 0.549 0.628 0.73 0.553 0.629 0.728 0.564 0.636 Nuclear Membrane - - - - - - - - - Nucleoli 0.789 0.060 0.112 0.792 0.076 0.139 0.824 0.056 0.105 Nucleoplasm 0.708 0.518 0.598 0.714 0.519 0.601 0.710 0.522 0.602 Cytoplasm 0.605 0.511 0.554 0.592 0.506 0.546 0.600 0.505 0.548 Cytosol 0.530 0.350 0.422 0.518 0.336 0.408 0.511 0.382 0.437 Cytoskeleton 0.636 0.110 0.188 0.587 0.116 0.194 0.618 0.107 0.182 Centrosome - - - - - - 1.000 0.007 0.014 Mitochondria 0.917 0.382 0.539 0.917 0.382 0.539 0.914 0.366 0.523 Endoplasmic Reticulum 0.750 0.114 0.198 0.698 0.128 0.216 0.696 0.166 0.268 Golgi Apparatus - - - - - - 1.000 0.003 0.007 Cell Membrane 0.771 0.367 0.497 0.768 0.367 0.496 0.791 0.442 0.567 Endosome - - - - - - - - - Lipid Droplet - - - - - - - - - L ysosome/V acuole - - - - - - - - - Peroxisome - - - - - - - - - V esicle - - - - - - 1.000 0.005 0.009 Primary Cilium 0.583 0.043 0.081 0.647 0.068 0.124 0.625 0.031 0.059 Secreted Proteins 0.933 0.474 0.629 0.936 0.447 0.605 0.958 0.471 0.632 Sperm 0.167 0.009 0.017 0.375 0.028 0.051 0.667 0.018 0.036 Micro A vg 0.687 0.338 0.453 0.682 0.338 0.452 0.685 0.353 0.466 Macro A vg 0.406 0.174 0.223 0.414 0.176 0.227 0.582 0.182 0.231 Subcellular Locations ESM-C weighting 0.7 ESM-C weighting 0.9 Precision Recall F1-Score Precision Recall F1-Score Nucleus 0.717 0.585 0.645 0.711 0.578 0.638 Nuclear Membrane - - - - - - Nucleoli 0.786 0.088 0.159 0.833 0.080 0.147 Nucleoplasm 0.692 0.558 0.618 0.699 0.548 0.614 Cytoplasm 0.619 0.453 0.523 0.596 0.517 0.554 Cytosol 0.534 0.256 0.346 0.517 0.372 0.432 Cytoskeleton 0.649 0.116 0.197 0.646 0.132 0.219 Centrosome 1.000 0.007 0.014 1.000 0.007 0.014 Mitochondria 0.907 0.374 0.530 0.899 0.374 0.528 Endoplasmic Reticulum 0.726 0.156 0.256 0.680 0.235 0.350 Golgi Apparatus 1.000 0.010 0.021 0.909 0.035 0.067 Cell Membrane 0.757 0.570 0.650 0.759 0.540 0.631 Endosome - - - 0.667 0.019 0.036 Lipid Droplet - - - - - - L ysosome/V acuole - - - - - - Peroxisome - - - - - - V esicle 1.000 0.005 0.009 1.000 0.007 0.014 Primary Cilium 0.538 0.043 0.080 0.571 0.050 0.091 Secreted Proteins 0.920 0.669 0.775 0.907 0.734 0.811 Sperm 0.800 0.037 0.070 0.750 0.028 0.053 Micro A vg 0.700 0.366 0.481 0.683 0.388 0.495 Macro A vg 0.582 0.196 0.245 0.607 0.213 0.260 “–” indicates that no prediction is made for that location. As shown in the table, models that treat non-experimentally validated annotations as positiv e sam- ples generally achiev e the best o verall performance. This may be because many non-validated anno- tations also originate from reliable sources ( e.g., the ”ECO:0000303” code in the UniProt database indicates that the localization information is e xtracted from published literature); thus, they still hold relativ ely high credibility . This also demonstrates that for large-scale deep learning training, as our work does, including such annotations can increase sample di versity and impro ve data richness, and therefore, improv e models’ performance. F . 3 A N A L Y S I S O F D I FF E R E N T W E I G H T S F O R N O N - E X P E R I M E N T A L L Y V A L I D A T E D A N N O T A T I O N S T o hav e a comprehensive analysis of the effect of evidence lev el, we further extend the weighting- label strategy by setting different weights to samples with non-experimentally validated annotations. W e report the results in T able 15 and 16 . From the results, we hav e the following observ ation: 26 Published as a conference paper at ICLR 2026 T able 16: Detailed performance of different weights for non-experimentally validated annotations on CDCon v . Subcellular Locations CDCon v t weighting 0.1 CDCon v t weighting 0.3 CDCon v t weighting 0.5 Precision Recall F1-Score Precision Recall F1-Score Precision Recall F1-Score Nucleus 0.640 0.646 0.643 0.616 0.662 0.638 0.671 0.543 0.600 Nuclear Membrane - - - - - - - - - Nucleoli 0.652 0.060 0.110 0.471 0.096 0.160 0.667 0.016 0.031 Nucleoplasm 0.614 0.533 0.571 0.596 0.600 0.598 0.640 0.509 0.567 Cytoplasm 0.594 0.450 0.512 0.592 0.398 0.476 0.558 0.514 0.535 Cytosol 0.493 0.322 0.390 0.478 0.278 0.352 0.468 0.348 0.399 Cytoskeleton 0.750 0.009 0.019 0.818 0.028 0.055 0.619 0.041 0.077 Centrosome - - - - - - - - - Mitochondria 0.728 0.347 0.470 0.708 0.370 0.486 0.703 0.344 0.462 Endoplasmic Reticulum 0.559 0.131 0.213 0.475 0.131 0.206 0.540 0.163 0.250 Golgi Apparatus - - - - - - 0.750 0.010 0.021 Cell Membrane 0.762 0.333 0.463 0.732 0.413 0.528 0.753 0.445 0.560 Endosome - - - - - - - - - Lipid Droplet - - - - - - - - - L ysosome/V acuole - - - - - - - - - Peroxisome - - - - - - - - - V esicle - - - - - - - - - Primary Cilium 1.000 0.006 0.012 1.000 0.006 0.012 - - - Secreted Proteins 0.823 0.618 0.706 0.835 0.672 0.745 0.868 0.539 0.665 Sperm - - - - - - - - - Micro A vg 0.631 0.340 0.442 0.617 0.354 0.450 0.629 0.343 0.444 Macro A vg 0.381 0.173 0.205 0.366 0.183 0.213 0.362 0.174 0.208 Subcellular Locations CDCon v t weighting 0.7 CDCon v t weighting 0.9 Precision Recall F1-Score Precision Recall F1-Score Nucleus 0.674 0.539 0.599 0.682 0.523 0.592 Nuclear Membrane - - - - - - Nucleoli 0.556 0.020 0.039 0.750 0.012 0.024 Nucleoplasm 0.657 0.497 0.566 0.669 0.479 0.558 Cytoplasm 0.557 0.469 0.509 0.551 0.571 0.561 Cytosol 0.470 0.293 0.361 0.470 0.398 0.431 Cytoskeleton 0.714 0.063 0.116 0.480 0.075 0.130 Centrosome - - - - - - Mitochondria 0.762 0.355 0.484 0.707 0.332 0.452 Endoplasmic Reticulum 0.561 0.159 0.248 0.481 0.173 0.254 Golgi Apparatus 0.615 0.028 0.053 0.588 0.035 0.066 Cell Membrane 0.723 0.447 0.553 0.725 0.493 0.587 Endosome - - - - - - Lipid Droplet - - - - - - L ysosome/V acuole - - - - - - Peroxisome - - - - - - V esicle - - - - - - Primary Cilium 0.333 0.006 0.012 0.333 0.006 0.012 Secreted Proteins 0.857 0.573 0.687 0.845 0.597 0.700 Sperm - - - - - - Micro A vg 0.637 0.333 0.438 0.625 0.359 0.456 Macro A vg 0.374 0.173 0.211 0.364 0.185 0.218 t The original MLP is replaced by Transformer layers. “–” indicates that no prediction is made for that location. T able 17: Analysis of precision and recall on Nucleus on ESM-C. ESM-C weighting 0.1 0.3 0.5 0.7 0.9 Treat as Positi ve Precision for Nucleus 0.733 0.730 0.728 0.717 0.711 0.694 Recall for Nucleus 0.549 0.553 0.564 0.585 0.578 0.609 1) For certain subcellular compartments, baselines trained exclusiv ely on experimentally validated annotations or assigned low positiv e weights to non-experimentally v alidated annotations generally achieve higher precision , as shown in T able 17 . Actually , precision and recall often represent a trade-off in modeling strategies. That is, adopting a more conservati ve prediction strategy typically increases precision b ut reduces the number of correctly recalled samples, and vice v ersa. Therefore, selecting high-confidence evidence levels can be seen as a method of enfor cing a more conser - vativ e prediction approach, helping to reduce the likelihood of false-positive predictions . This highlights the novelty of evidence-le vel annotations: using experimentally validated data is con- sidered a strategy to ensur e high precision and r eliability . 2) Howe ver , for ov erall results and most subcellular compartments, the results among the three strategies sho w no significant differ ences . This indirectly supports the notion we mentioned abov e that ev en non-validated annotations in CAPSUL still possess relativ ely high reliability . This 27 Published as a conference paper at ICLR 2026 T able 18: Detailed performance of hierarchical classifiers on CDCon v . CDCon v t Hierarchical Classifiers Subcellular Locations Precision Recall F1-Score Subcellular Locations Precision Recall F1-Score Nucleus’s classifier Cytoplasm’s classifier Nuclear Membrane - - - Cytosol 0.260 0.980 0.411 Nucleoli - - - Cytoskeleton 0.331 0.126 0.182 Nucleoplasm 0.339 1.000 0.507 t The original MLP is replaced by Transformer layers. “–” indicates that no prediction is made for that location. T able 19: Analysis of performance of three pLDDT groups on CDCon v . Subcellular Locations High pLDDT Group Medium pLDDT Group Lo w pLDDT Group Precision Recall F1-Score Precision Recall F1-Score Precision Recall F1-Score Nucleus 0.561 0.393 0.462 0.636 0.570 0.601 0.700 0.742 0.720 Nuclear Membrane - - - - - - - - - Nucleoli 0.667 0.082 0.146 0.632 0.136 0.224 0.375 0.034 0.062 Nucleoplasm 0.512 0.310 0.387 0.575 0.497 0.533 0.713 0.717 0.715 Cytoplasm 0.601 0.513 0.553 0.578 0.422 0.488 0.546 0.298 0.385 Cytosol 0.520 0.451 0.483 0.467 0.241 0.318 0.414 0.112 0.177 Cytoskeleton 0.833 0.060 0.112 0.577 0.128 0.210 0.800 0.034 0.065 Centrosome - - - - - - - - - Mitochondria 0.789 0.475 0.593 0.644 0.322 0.430 0.529 0.167 0.254 Endoplasmic Reticulum 0.506 0.344 0.409 0.410 0.152 0.222 0.176 0.054 0.082 Golgi Apparatus 0.857 0.057 0.107 0.714 0.048 0.089 - - - Cell Membrane 0.806 0.463 0.588 0.743 0.581 0.653 0.530 0.272 0.360 Endosome - - - - - - - - - Lipid Droplet - - - - - - - - - L ysosome/V acuole - - - - - - - - - Peroxisome - - - 0.333 0.006 0.012 - - - V esicle 0.833 0.035 0.068 - - - - - - Primary Cilium - - - 0.856 0.720 0.782 - - - Secreted Proteins 0.746 0.775 0.760 - - - 0.816 0.702 0.755 Sperm - - - - - - Micro A vg 0.617 0.345 0.443 0.628 0.345 0.446 0.651 0.367 0.469 Macro A vg 0.412 0.198 0.233 0.538 0.191 0.228 0.280 0.157 0.179 “–” indicates that no prediction is made for that location. ensures that, when CAPSUL is used for downstream tasks, the inclusion of non-experimentally validated annotations does not introduce substantial bias. G A T T E M P T T OW A R D H I E R A R C H I C A L C L A S S I FI E R S F O R N E S T E D C A T E G O R I E S In order to make precise predictions of nested subcategories, we attempt to train a hierarchical classifier for the two nested categories, Nucleus and Cytoplasm. These classifiers were built upon CDCon v , using positive samples of the corresponding parent categories as the training set. W e report the experimental results in T able 18 . W e ha ve the follo wing observations: 1) For the three subcategories within the nucleus, the hierarchical classifier actually leads to de- creased performance compared with the original CDCon v . W e attribute this to the reduced number of training samples when training this hierarchical classifier , which, combined with the already se- vere class imbalance in these subcategories, likely exacerbated the issue. Considering the results discussed in Section 4.3 of the main text, we find that for such highly imbalanced subcellular local- ization tasks, directly applying a single-label classification strate gy , while adjusting the correspond- ing reweighting and classification thresholds, yields more significant impro vements. 2) For the two subcategories within the cytoplasm, classification performance greatly improves, demonstrating that the hierarchical classification strategy can be beneficial for certain subcellular compartments. This result provides an additional strategy , hierarchical classifiers, to address the minority class issue apart from what we hav e discussed in Section 4.3 of the main text. 28 Published as a conference paper at ICLR 2026 H A N A L Y S I S O F T H E P L D D T S C O R E S O F P RO T E I N S T RU C T U R E I N P U T In AlphaFold-predicted structures, regions with low pLDDT often indicate intrinsically disordered segments, which naturally lack stable tertiary structure and are therefore harder for any predictor to model with high confidence. W e conduct an analysis on the representati ve structure-based model, CDCon v , examining the relationship between residue-lev el pLDDT and model performance across the test set. Specifically , we di vide all 3,028 proteins in the test set into three groups of equal size based on their protein-lev el mean pLDDT values. The highest and lowest mean pLDDT values within each group are [83.56, 99.39], [70.40, 83.54], and [28.11, 70.40]. W e then compare the performance of these groups to determine whether substantial performance discrepancies exist, which would suggest that the model is sensitive to variations in structural confidence. W e report the results of three groups in T able 19 . Upon further examination of specific subcellular cate gories, we find that: 1) For some subcellular locations ( e.g., Nucleus, Cytoplasm, Cytosol, and Cell Membrane), the performance differences among the three groups may appear larger . This is probably attributable to the une ven distribution of positive samples across the groups. For example, in the Nucleus category , the high-pLDDT group contains only 318 positi ve samples, whereas the lo w-pLDDT group contains 476 positiv e samples, which contributes to this noticeable discrepanc y . 2) For other subcellular locations ( e.g ., Cytoskeleton and Secreted Proteins), the results across the three groups do not exhibit pronounced dif ferences. This observation is consistent with the trend shown by the overall ev aluation metrics abov e, indicating that proteins with different av erage pLDDT lev els hav e not greatly influenced the prediction of these subcellular localizations. In summary , the low-pLDDT group does not exhibit worse predictions systematically . This in- dicates that the CAPSUL is rob ust to fluctuations in pLDDT and does not rely disproportionately on regions of high structural confidence. In other words, CAPSUL provides stable and reliable struc- tural inputs for downstream tasks even when proteins contain disordered or low-confidence regions, demonstrating the quality and suitability of our structural dataset for subcellular lo- calization prediction. Howe ver , results of particular subcellular compartments highlight the need for further exploration of de veloping more informati ve and robust structural representations to better capture the determinants of subcellular localization in future work. I S A M P L E E FFI C I E N C Y A sample efficiency curve would explicitly reflect a possible strate gy to choose the proper size of the training set, which strikes a balance between model performance and computational costs. W e randomly select training subsets of varying sizes and ev aluate their sample efficiency curve on CDCon v in Figure 3 . W e observed that the smaller dataset, compared with the original CAPSUL, exhibits noticeably poorer performance, reflected in both lower micro F1-scores and fewer categories for which any positiv e samples were successfully predicted. This indicates that, in order to achie ve satisfactory ov erall performance as well as decent performance on minority classes, the current size of training samples is relativ ely appropriate. J I N T E R P R E T A B I L I T Y W I T H A T T E N T I O N S C O R E In T ransformer architectures, the attention mechanism allo ws each token to compute a weighted representation of all other tokens in the sequence. Specifically , for a giv en token, a set of attention weights is derived via scaled dot-product operations between its query vector and the key vectors of all tokens, followed by a softmax normalization. These attention weights reflect how much in- formation the token attends to from each of its peers. T o assess the relative importance of each token within the sequence, we aggregated the attention it receiv es from all other tokens, i.e., sum- ming over the attention scores directed tow ard that token across the entire sequence. This provides a global measure of how influential a token is in shaping the contextual representations learned by 29 Published as a conference paper at ICLR 2026 Figure 3: Sample efficienc y curve on CDCon v . Figure 4: V isualization of full attention scores and structures of proteins MFNG, B3GAL T2, and GIMAP1, where the residues of known pattern α -helix are highlighted. the model. W e interpret this aggregated attention as a proxy for biological interpretability , where highly attended residues may correspond to structurally or functionally important positions within the protein. In Section 4.3.3 of the main text, we introduce a CDCon v model for predicting Golgi apparatus localization. By analyzing the attention score within the model’ s T ransformer architecture, we iden- tify a localization pattern associated with an α -helix, which is consistent with existing biological findings. Here, we visualize the full attention score of the three example proteins discussed in the main text ( i.e ., MFNG, B3GAL T2, and GIMAP1), as sho wn in Figure 4 . The residues of known lo- calization patterns α -helix are highlighted in orange for clear comparison. Notably , the 20 residues with the highest attention scores exhibit a 90% overlap with the ground truth, further highlighting the CDCon v model’ s precision in identifying localization patterns. 30 Published as a conference paper at ICLR 2026 More interpretability results. There are two more potential localization patterns identified on CAPSUL: 1) ”W -pair” f or Golgi apparatus ( i.e., two spatially adjacent T ryptophan residues), which aligns with e xisting studies suggesting that T ryptophan can influence Golgi targeting ( Ashlin et al. , 2021 ), and 2) a flexible region at the N-terminus of the protein for Mitochondria , which aligns with existing studies suggesting that this area can influence multiple compartments target- ing ( Sohn et al. , 2009 ). Howe ver , these newly identified patterns still require further experimental validation. Nevertheless, these findings together demonstrate that both our curated dataset and the selected structure-based baseline model are capable of capturing meaningful subcellular localization signals, offering promising insights and directions for future research in cell biology . K G E N E R A L I Z A T I O N A B I L I T Y The CAPSUL workflow is readily applicable to other species. While our current study exclu- siv ely uses human protein data, we do not assert that CAPSUL ’ s pipeline is intrinsically limited to human proteins. Our dataset and benchmark construction pipeline, including 1) the acquisition of one-dimensional and three-dimensional protein information, 2) the collection of localization anno- tations, and 3) the comparison of v arious baselines, is entirely species-agnostic. Once the CAPSUL pipeline becomes robust and well-received, there can be attempts to extend the same workflow to dev elop subcellular localization datasets and benchmarks across multiple species in parallel. This extension will not only enable broader biological inv estigations but also provide valuable resources for studying the ev olutionary conservation and div ergence of protein localization mechanisms across phylogenetic lineages. By comparing subcellular patterns across species, researchers can gain in- sights into the selecti ve pressures shaping cellular or ganization, the emer gence of or ganelle-specific functions, and the molecular adaptations that underpin ev olutionary innov ation. The CAPSUL workflow is applicable to context-dependent localization if sufficient related data is accessible. With re gard to the context-dependent dynamic localization, current protein databases lack extensi ve data on protein structures across div erse biological contexts and their cor- responding variations in subcellular localization. If CAPSUL were augmented with dynamic data capturing protein structural changes ( e.g., conformational shifts induced by stressors or ligands) from updated protein databases in the future, the baselines can be retrained on CAPSUL to model context-dependent localization. This would enable the models to make precise predictions about subcellular localization under specific cellular conditions or in response to external en vironmental states, moving be yond static localization to capture functional biological dynamics. The CAPSUL is readily extensible to additional protein data and baseline methods in the fu- ture. Our highly standardized pipeline ensures that any ne wly released protein data can be updated to CAPSUL. Also, CAPSUL embraces a broader range of other possible protein structural inputs ( e.g ., which can be used in the construction of graph nodes and edges) to enrich both the local and global representations of proteins. Moreover , the results of more advanced protein representation methods can be included to perform this downstream task if their input data is supported by CAP- SUL, which enables fair and informati ve comparison across v arious baseline methods. L A V A I L A B I L I T Y O F D A TA S E T A N D C O D E The complete dataset, including localization labels, extracted protein structures, etc. can be ac- cessed at https://huggingface.co/datasets/getbetterhyccc/CAPSUL . Our im- plementation is publicly av ailable at https://github.com/getbetter- hyccc/CAPSUL . For some baseline models, we adopt publicly released implementations, including Graph T rans- former at https://github.com/pyg- team/pytorch_geometric/tree/master and Graph Mamba at https://github.com/alxndrTL/mamba.py . M T H E U S E O F L A R G E L A N G UA G E M O D E L S In this study , Large Language Models (LLMs) were emplo yed solely for linguistic refinement, such as polishing the clarity , grammar , and fluency of the manuscript. Importantly , all conceptual ad- vances, methodological innov ations, experimental designs, and primary contributions presented in this work were independently conceiv ed, dev eloped, and validated by the authors. The role of LLMs 31 Published as a conference paper at ICLR 2026 was thus limited to improving readability and ensuring the precision of academic writing, without influencing the scientific content or originality of the research. 32
Original Paper
Loading high-quality paper...
Comments & Academic Discussion
Loading comments...
Leave a Comment