Halfway to 3D: Ensembling 2.5D and 3D Models for Robust COVID-19 CT Diagnosis
We propose a deep learning framework for COVID-19 detection and disease classification from chest CT scans that integrates both 2.5D and 3D representations to capture complementary slice-level and volumetric information. The 2.5D branch processes mul…
Authors: Tuan-Anh Yang, Bao V. Q. Bui, Chanh-Quang Vo-Van
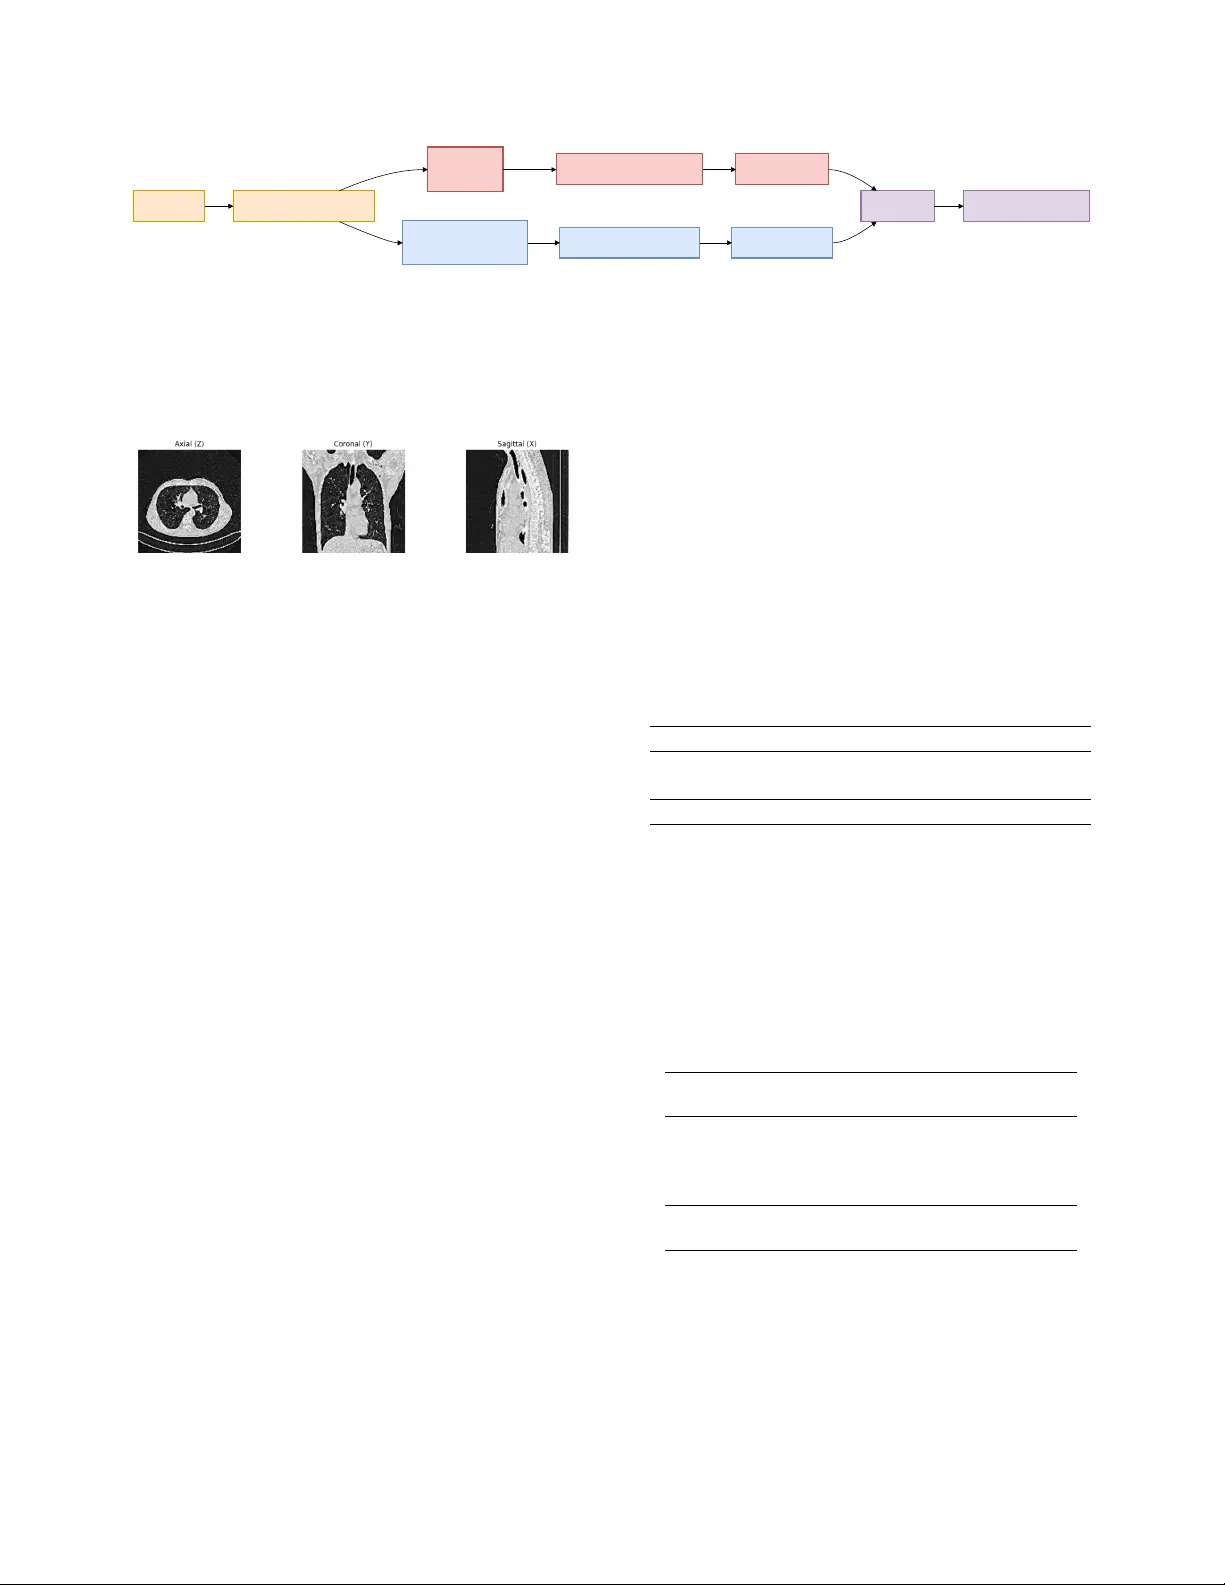
Halfway to 3D: Ensembling 2.5D and 3D Models f or Rob ust CO VID-19 CT Diagnosis T uan-Anh Y ang 1 Bao V . Q. Bui 2 Chanh-Quang V o-V an 1 T ruong-Son Hy 3 1 VNUHCM Uni versity of Science, V ietnam National Uni versity , V ietnam 2 Ho Chi Minh Uni versity of T echnology , V ietnam National Uni versity , V ietnam 3 The Uni versity of Alabama at Birmingham, United States ytanh21@apcs.fitus.edu.vn, vvcquang19@clc.fitus.edu.vn, bao.bui171@hcmut.edu.vn, thy@uab.edu Abstract W e pr opose a deep learning framework for CO VID-19 de- tection and disease classification fr om chest CT scans that inte grates both 2.5D and 3D repr esentations to capture complementary slice-le vel and volumetric information. The 2.5D branc h pr ocesses multi-view CT slices (axial, coro- nal, sagittal) using a DINOv3 vision tr ansformer , while the 3D branc h employs a ResNet-18 arc hitectur e pr etrained with V ariance Risk Extrapolation (VREx) and further r e- fined with supervised contrastive learning to impr ove cr oss- sour ce r obustness. Predictions fr om both branches ar e com- bined via logit-level ensembling . Experiments on the PHAR OS-AIF-MIH benchmark demonstrate the ef fectiveness of the pr oposed appr oach. On the test set, our method achieved runner-up in the Multi- Sour ce CO VID-19 Detection Challenge, with the best en- semble r eaching a Macr o F1-scor e of 0.751 . F or the F air Disease Diagnosis Challenge, our approac h ranked third place , achie ving a best Macr o F1-scor e of 0.633 with im- pr oved performance balance acr oss genders. These r esults highlight the benefits of combining pretr ained slice-based r epr esentations with volumetric modeling, as well as the importance of ensemble strate gies for impr oving r obustness and fairness in multi-sour ce medical imaging tasks. Code is available at https : / / github . com / HySonLab / PHAROS- AIF- MIH . 1. Introduction Chest computed tomograph y (CT) imaging plays a k ey role in the diagnosis and assessment of CO VID-19 and other pulmonary diseases. Compared to conv entional radiogra- phy , CT scans provide detailed volumetric information that enables the identification of abnormalities such as ground- glass opacities and lung consolidations. W ith the gro wing av ailability of medical imaging data, deep learning methods hav e shown strong potential for automated disease detection and analysis from CT scans [ 8 , 10 ]. Despite these adv ances, dev eloping robust medical imaging models remains challenging. Clinical datasets are often collected from multiple institutions with differ - ent scanners, acquisition protocols, and patient populations, leading to domain shifts that degrade model generalization. In addition, fairness has become an important concern in medical AI, as models may exhibit performance disparities across demographics. Benchmarks such as the PHAROS- AIF-MIH challenge emphasize the need for methods that are robust to heterogeneous data sources while maintaining reliable performance across patient populations [ 13 ]. Our method consists of two complementary branches. The 3D branch employs a ResNet-18 architecture trained with V ariance Risk Extrapolation (VREx) to improve do- main generalization, followed by supervised contrastive learning for enhanced feature discrimination. In parallel, the 2.5D branch extracts axial, coronal, and sagittal slices from reconstructed CT volumes and processes them using a DINOv3-based vision transformer . The predictions from both branches are combined through an ensemble strategy to lev erage both slice-level and v olumetric information. W e ev aluate the proposed framework on the PHAR OS- AIF-MIH benchmark for multi-source disease diagnosis and fairness-aw are ev aluation. Experimental results demon- strate that integrating 2.5D and 3D representations im- prov es robustness across heterogeneous imaging sources while maintaining strong diagnostic performance. The main contributions of this w ork are as follows: • W e propose a hybrid 2.5D–3D frame work that combines multi-view slice representations with volumetric model- ing for CT -based diagnosis. • W e incorporate domain generalization using VREx and supervised contrastiv e learning in the 3D branch. • W e design a multi-view 2.5D pipeline using a DINOv3 backbone to lev erage pretrained visual representations. • W e show that ensembling 2.5D and 3D models improves robustness and performance on the PHAR OS-AIF-MIH benchmark. 2. Related W ork Deep learning has been widely applied to medical imag- ing for automated disease diagnosis. Early work demon- strated that neural netw orks can ef fectively extract diagnos- tic features from medical images, enabling computer-aided decision support in healthcare [ 5 ]. Subsequent studies em- phasized the importance of interpretability and reliability in medical AI systems, introducing techniques for analyz- ing latent representations and improving the transparency of deep learning predictions in clinical settings [ 6 , 7 ]. For CO VID-19 diagnosis, se veral studies have e xplored chest CT scans for automated detection and sev erity assess- ment. The MIA-CO V19D frame work introduced a large- scale dataset and deep learning pipeline for CO VID-19 de- tection from 3D CT volumes [ 8 ]. Later works proposed improv ed architectures, datasets, and AI pipelines to en- hance model robustness and scalability for CT -based diag- nosis [ 1 , 2 , 9 – 11 ]. More recently , multimodal and vision- language approaches such as SAM2CLIP2SAM have been introduced to further improv e CT scan understanding [ 12 ]. T o address the aforementioned domain shifts inherent in multi-institution datasets like the PHAR OS benchmark, do- main generalization methods such as V ariance Risk Extrap- olation [ 17 ] enforce domain-in variant representations. The PHAROS-AIF-MIH benchmark further emphasizes the importance of multi-source robustness and fairness- aware ev aluation in medical AI systems [ 13 ]. Motiv ated by these challenges, we propose a hybrid framework that combines 2.5D multi-vie w representations and 3D volumet- ric modeling to improv e robustness and diagnostic perfor- mance for CT -based disease classification. 3. Methodology 3.1. Data Prepr ocessing The ra w datasets consist of axial CT slices. T o obtain con- sistent volumetric inputs, we reconstruct full 3D CT vol- umes by stacking slices along the axial axis. Duplicate slices are remov ed prior to reconstruction. Each reconstructed scan is resized to a fix ed spatial res- olution of 128 × 128 × 128 . W e then apply a 3D Gaussian denoising filter followed by mask sharpening to improv e anatomical clarity . Finally , vox el intensities are normalized into grayscale values in the range [0 , 255] . 3.2. 3D Representation Lear ning T o model v olumetric context, we adopt a 3D con volutional architecture based on ResNet-18. The model is adapted for single-channel CT input by modifying the first con vo- lutional layer . 3.2.1. Architectur e The 3D branch uses a ResNet-18 architecture designed for video processing [ 3 ]. The netw ork recei ves 128 × 128 × 128 volumes as input and produces feature embeddings that are passed to a task-specific classification head. 3.2.2. T raining Strategy Stage 1: Domain Generalization Pr etraining The model is first pretrained using V ariance Risk Extrapolation (VREx) [ 14 ], a domain generalization technique that en- courages consistent performance across different data dis- tributions. The objectiv e combines cross-entropy classifi- cation loss with a v ariance regularization term computed across domain-specific losses. During this stage, auxiliary domain labels (e.g., data source or demographic attributes) are used to define domains. Stage 2: T ask-Specific Fine-tuning After domain pre- training, the network is fine-tuned for the do wnstream clas- sification task. The training objective combines cross- entropy loss with supervised contrasti ve learning [ 4 ] to im- prov e feature separability . In addition, MixUp augmenta- tion [ 18 ] is applied to encourage smoother decision bound- aries and improv e generalization. 3.3. 2.5D Multi-V iew Representation Learning While 3D models capture global structure, the y can be com- putationally expensi ve and may o verlook fine-grained slice- lev el patterns. T o complement the 3D approach, we intro- duce a 2.5D multi-view frame work based on transformer- based visual representations. 3.3.1. Multi-V iew Slice Extraction From each reconstructed CT volume, we extract slices from three orthogonal anatomical planes: Axial view (original acquisition plane), coronal view , sagittal view . Representa- tiv e slices are sampled from each plane to capture rele vant lung structures. These slices are resized to 224 × 224 reso- lution before being processed by the model. 3.3.2. DINOv3 Backbone For feature e xtraction, we adopt a V ision T ransformer back- bone pretrained with the DINOv3 self-supervised learning framew ork [ 16 ]. The pretrained model provides strong visual representations that transfer ef fectiv ely to medical imaging tasks. The grayscale CT slices are adapted to the input requirements of the pretrained model, and a CT Slices 3D V olume Reconstruction 3D Model ResNet-18 2.5D Multi-view Model DINOv3 VREx + Contrastive T raining Multi-view Feature Fusion 3D Predictions 2.5D Predictions Ensemble Final COVID Prediction Figure 1. Overvie w of the proposed method. Axial CT slices are first reconstructed into a normalized 128 × 128 × 128 volume through preprocessing. From the reconstructed volume, two complementary representations are learned. The 3D branch processes the full volume using a ResNet-18 architecture trained with V ariance Risk Extrapolation (VREx) and supervised contrastiv e learning to improve cross- domain robustness. In parallel, a 2.5D multi-view branch extracts axial, coronal, and sagittal slices and processes them using a DINOv3 backbone. The predictions from both models are aggregated through an ensemble to obtain the final classification. Figure 2. From each reconstructed CT volume, we e xtract slices from three orthogonal anatomical planes: Axial view (original ac- quisition plane), coronal view , sagittal vie w . lightweight classification head is added on top of the ex- tracted embeddings. 3.3.3. Multi-V iew F eature Fusion Each view is processed independently through the backbone network. The resulting embeddings are combined using a feature-lev el fusion strategy . This multi-view aggregation allows the model to capture complementary anatomical in- formation across planes. 3.4. Ensemble Integration W e integrate the outputs using an ensemble strate gy that ag- gregates the predicted probabilities from both models. This fusion improves robustness and stabilizes predictions across heterogeneous imaging sources. 4. Experiments 4.1. Datasets W e e valuate our method on the PHAR OS-AIF-MIH bench- mark, which focuses on robust disease diagnosis from med- ical imaging under multi-source and fairness-aw are ev alu- ation settings. The dataset consists of chest CT scans col- lected from multiple institutions, introducing variations in imaging protocols, scanners, and patient populations that create realistic domain shifts. The benchmark includes two tasks: • T ask 1: Binary CO VID-19 detection from chest CT scans. The dataset contains CO VID-19 and non-CO VID- 19 cases collected from multiple sources. The distrib ution of samples is summarized in T able 1 . • T ask 2: Multi-class classification in volving four cate- gories: Healthy , Adenocarcinoma , Squamous Cell Car- cinoma , and CO VID-19 . This task also ev aluates fairness by reporting performance across different gender groups. The distribution of samples is summarized in T able 2 . These two tasks allo w ev aluation of both diagnostic per- formance and model robustness under heterogeneous data sources and demographic variations. T able 1. Data samples in the Multi-Source CO VID-19 Detection Challenge Set CO VID-19 Non-CO VID-19 T otal T rain 564 660 1,224 V alidation 128 180 308 T otal 692 840 1,532 T able 2. Data samples in the Fair Disease Diagnosis Challenge. For T ask 2, the multi-class classification in volv es four distinct di- agnostic categories: Healthy , Adenocarcinoma, Squamous Cell Carcinoma, and CO VID-19. For brevity and visual clarity in our subsequent tables and figures, we map these clinical categories to the following abbreviations: ‘Normal’ (Healthy), ‘A ’ (Ade- nocarcinoma), ‘G’ (Squamous Cell Carcinoma), and ‘CO VID’ (CO VID-19). Set Healthy Adeno- carcinoma Squamous Cell CO VID T rain (F) 100 125 5 100 T rain (M) 100 125 79 100 V al (F) 20 25 13 20 V al (M) 20 25 12 20 T otal (F) 120 150 18 120 T otal (M) 120 150 91 120 4.2. Implementation Details All models are implemented in PyT orch [ 15 ] and trained on NVIDIA GPUs using CUDA with automatic mixed preci- sion (AMP) to improv e training efficiency and reduce mem- ory usage. 3D Model. T raining follows a two-stage procedure. In the first stage, the model is pretrained using V ariance Risk Extrapolation (VREx) to encourage domain-in variant repre- sentations across sources. The loss combines cross-entropy with a v ariance penalty across domain losses, with regular - ization weight λ = 1 . 0 . This stage is trained for 5 epochs using AdamW with a learning rate of 1 × 10 − 4 . In the second stage, the model is fine-tuned for classifi- cation using cross-entropy combined with supervised con- trastiv e learning ( τ = 0 . 07 ). MixUp augmentation with α = 0 . 4 is applied to improve robustness. Fine-tuning runs for 20 epochs with a learning rate of 1 × 10 − 5 and cosine annealing scheduling. W eight decay is set to 1 × 10 − 5 . 2.5D Multi-V iew Model. For each CT v olume, slices are extracted from axial, coronal, and sagittal planes, with 8–12 slices uniformly sampled per view . Each slice is processed independently using a DINOv3 backbone, and the resulting embeddings are projected and fused across views. T raining proceeds in three stages: (1) training the clas- sification head with the backbone frozen for 10 epochs ( 1 × 10 − 3 learning rate), (2) progressively unfreezing up- per transformer layers for 15 epochs ( 1 × 10 − 4 ), and (3) full end-to-end fine-tuning for 20 epochs ( 5 × 10 − 5 ). Opti- mization uses AdamW with cosine learning rate scheduling and a 5% warmup. Data A ugmentation. Spatial augmentations include ran- dom rotations ( ± 15 ◦ ), horizontal flips (0.5), and scaling (0.8–1.2). Intensity augmentations include brightness and contrast adjustments, Gaussian noise ( σ = 0 . 01 ), and ran- dom cutout with 10% masked area. Augmentations are ap- plied consistently across slices within each view . 4.3. T raining Pr otocol The 3D model is trained using the two-stage procedure de- scribed earlier: domain generalization pretraining followed by supervised fine-tuning. For the 2.5D model, training begins with the backbone frozen while optimizing the classification head. T rans- former layers are progressiv ely unfrozen in later stages to adapt pretrained representations to the medical imaging do- main. Standard spatial and intensity augmentations are ap- plied to improv e generalization. 4.4. Evaluation Pr otocol Performance is e valuated on the v alidation sets pro vided by the challenge organizers. Follo wing the benchmark guide- lines, we report overall predictive performance as well as robustness across data sources and demographic groups. T o further improv e reliability , predictions from the 2.5D and 3D branches are combined through ensemble inference. 4.5. Results 4.5.1. 3D ResNet-18 Results T ask 1. For the binary CO VID-19 detection task, the 3D model achiev es a validation accuracy of 87.01% and a mean Macro F1-score of 0.7648 across the 4 sources. T able 3 re- ports the performance across different data sources. While the model performs strongly on most sources, performance degradation is observed on Source 2, highlighting the im- pact of domain shift across institutions. T able 3. Per-source performance for T ask 1 using the 3D ResNet- 18 model. Source Source 0 Source 1 Source 2 Source 3 F1-score 0.8630 0.8408 0.4828 0.8725 T ask 2. For the multi-class classification task (A, G, CO VID, Normal), the 3D model achiev es an overall vali- dation accuracy of 76.77% and a mean Macro F1-score of 0.6677 between the 2 genders. T able 4 sho ws the class-wise performance. T o assess fairness across demographic groups, we an- alyze performance across gender . The model achieves an F1-score of 0.7249 for male patients and 0.6104 for female patients, indicating a moderate performance gap that high- lights the importance of fairness-aw are ev aluation. T able 4. Class-wise performance for T ask 2 using the 3D ResNet- 18 model. Class Precision Recall F1-score A 0.6901 0.9800 0.8099 G 0.7500 0.1200 0.2069 CO VID 0.8462 0.8250 0.8354 Normal 0.8293 0.8500 0.8395 4.5.2. 2.5D DINOv3 Results T ask 1. W e ev aluate the 2.5D multi-vie w model based on the DINOv3 backbone on the binary CO VID-19 de- tection task. The model achiev es a validation accuracy of 93.51% and a mean Macro F1-score of 0.8221 , demonstrat- ing strong performance using multi-view slice representa- tions. T able 5 sho ws the per -source F1-score across the four data sources. T able 5. Per-source performance for T ask 1 using the 2.5D DI- NOv3 model. Source Source 0 Source 1 Source 2 Source3 F1-score 0.9430 0.9431 0.4828 0.9194 T ask 2. For the multi-class classification task (A, G, CO VID, Normal), the 2.5D DINOv3-based model achieves an overall v alidation accuracy of 76.77% and a mean Macro F1-score of 0.7229 . T able 6 presents the class-wise perfor- mance of the model. T o assess fairness across demographic groups, we an- alyze performance across gender . The model achieves an F1-score of 0.7848 for male and 0.6611 for female patients. The performance dif ference suggests the presence of do- main shifts between institutions, which remains a challenge for multi-source medical imaging models. T able 6. Class-wise performance for T ask 2 using the 2.5D DI- NOv3 model. Class Precision Recall F1-score A 0.7241 0.8400 0.7778 G 0.5625 0.3600 0.4390 CO VID 0.8333 0.8750 0.8537 Normal 0.8462 0.8250 0.8354 4.5.3. Ensemble Results Finally , we e valuate an ensemble that combines the predic- tions of the 3D ResNet-18 and the 2.5D DINOv3 models. The ensemble is implemented by averaging the logits from both models and selecting the final prediction based on the combined scores. This strategy allows the frame work to lev erage complementary information captured by volumet- ric representations and multi-view slice features. T ask 1. The ensemble model achiev es the best overall per - formance, reaching a validation accuracy of 94.48% and a mean Macro F1-score of 0.9426 . T able 7 summarizes the comparison between the models and the ensemble. The ensemble improv es performance across most sources, particularly on Source 0 and Source 1, demonstrat- ing the benefit of combining volumetric and slice-based rep- resentations. T able 7. Performance comparison for T ask 1 (CO VID-19 detec- tion). Best results are shown in bold. Model Accuracy Macro F1 3D ResNet-18 0.8701 0.7648 2.5D DINOv3 0.9351 0.8221 Ensemble 0.9513 0.8321 T ask 2. For the multi-class disease classification task, the ensemble achieves an ov erall validation accuracy of 76.77% and a mean Macro F1-score of 0.7229 . While the T able 8. Per-source F1 comparison for T ask 1. Best values are shown in bold. Model Source 0 Source 1 Source 2 Source 3 3D ResNet-18 0.8630 0.8408 0.4828 0.8725 2.5D DINOv3 0.9430 0.9431 0.4828 0.9194 Ensemble 0.9659 0.9431 0.5000 0.9194 ensemble improves stability across sources, the best ov er- all performance for this task is still achieved by the 2.5D DINOv3 model. T able 9 compares the performance of the models and the ensemble. T able 9. Performance comparison for T ask 2 (multi-class classifi- cation). Best results are shown in bold. Model Accuracy Macro F1 3D ResNet-18 0.7677 0.6677 2.5D DINOv3 0.7677 0.7230 Ensemble 0.7677 0.7229 T able 10. Class-wise F1 comparison for T ask 2. Best values are shown in bold. Class 3D ResNet-18 2.5D DINOv3 Ensemble A 0.8099 0.7778 0.7778 G 0.2069 0.4390 0.4390 CO VID 0.8354 0.8537 0.8537 Normal 0.8395 0.8537 0.8354 4.6. T est Submission Results Our methods were e v aluated on the official test server of the PHAR OS-AIF-MIH benchmark. The proposed approach achiev ed strong rankings across both tasks, demonstrating robustness to multi-source distribution shifts and fairness considerations. Multi-Source CO VID-19 Detection (T ask 1). Our team achiev ed runner-up position in the challenge. T able 11 summarizes the performance across dif ferent hospitals. The 2.5D model outperforms the standalone 3D model, while ensembling further improv es robustness. The best perfor- mance is obtained with the 0.5-weighted ensemble, achie v- ing a Macro F1-score of 0.751 . The results show that ensembling improves generaliza- tion across most hospitals, particularly for H 2 , while per- formance on H 3 remains challenging for all methods. Fair Disease Diagnosis (T ask 2). Our team ranked third place in this task. T able 12 reports the Macro F1-scores T able 11. T est results for T ask 1 across hospitals. Method A vg H 1 H 2 H 3 H 4 2.5D 0.741 0.910 0.691 0.493 0.869 3D 0.699 0.825 0.608 0.495 0.868 Ens (0.3) 0.739 0.895 0.673 0.496 0.892 Ens (0.5) 0.751 0.914 0.712 0.495 0.883 Ens (0.7) 0.744 0.912 0.696 0.495 0.873 along with gender-specific performance. The best result is achiev ed by the 0.7-weighted ensemble, with a Macro F1- score of 0.633 . T able 12. T est results for T ask 2 with gender-based e valuation. Method A vg Female Male 2.5D 0.555 0.709 0.402 3D 0.572 0.756 0.388 Ens (0.3) 0.568 0.732 0.403 Ens (0.5) 0.561 0.718 0.403 Ens (0.7) 0.633 0.709 0.557 The results highlight a noticeable performance gap be- tween genders, with higher performance on female sam- ples for most methods. Ho wev er , the 0.7-weighted ensem- ble significantly impro ves male performance, leading to the best overall Macro F1-score. This suggests that adjusting ensemble weights can help balance fairness and overall ac- curacy . 4.7. Discussion The experimental results highlight the complementary strengths of volumetric and slice-based representations for CT analysis. The 2.5D DINOv3 model consistently outper - forms the 3D ResNet-18 model across both tasks, suggest- ing that large-scale pretrained visual representations pro- vide strong feature extraction capabilities even for medical imaging data. In particular , the transformer-based archi- tecture benefits from pretraining on div erse visual datasets, enabling improved discrimination of subtle patterns in CT slices. The ensemble further improv es performance for the bi- nary CO VID-19 detection task, achie ving the highest over - all accuracy and Macro F1-score. This improv ement indi- cates that the 3D and 2.5D branches capture complementary information: the 3D model captures global volumetric con- text, while the 2.5D model focuses on high-resolution slice- lev el features. Combining these representations allows the ensemble to le verage both global and local anatomical cues. Howe ver , the ensemble does not improve performance for the multi-class disease classification task, where the 2.5D model already achie ves the best results. This suggests that slice-based features may be sufficient for distinguish- ing disease categories, while volumetric context provides limited additional benefit for this task. While the ensemble demonstrates robust generalization across most data sources, we observe a sev ere performance degradation in distinguishing Squamous Cell Carcinoma (Class G) from other pathologies se verely exacerbates these errors. This suggests that while global 3D volumetric fea- tures capture excellent broader context, they are signifi- cantly less resilient to se vere spatial distribution shifts than 2.5D slice-lev el representations. 5. Conclusion In this paper , we proposed a hybrid deep learning frame- work that integrates 2.5D slice-le vel features via a DINOv3 vision transformer and 3D v olumetric context via a ResNet- 18 architecture for robust CO VID-19 detection and multi- class sev erity classification. Rather than relying on a single dimensional paradigm, our approach successfully le verages the complementary strengths of both. Evaluations on the multi-source PHAROS-AIF-MIH benchmark re veal a clear functional dichotomy: volumetric 3D models and their ensembles excel at extracting global context for binary classification tasks (effecti vely distin- guishing CO VID-19 from non-CO VID cases), whereas slice-based 2.5D features demonstrate superior standalone efficac y for complex, multi-class pathology grading. By combining these representations through logit-lev el ensem- bling and stabilizing the feature space with VREx and con- trastiv e learning, our framework yields a highly resilient diagnostic tool. Ultimately , this work offers a practical pathway toward clinically viable, cross-source medical im- age analysis that can withstand the domain shifts inherently found in real-world hospital en vironments. References [1] Anastasios Arsenos, Dimitrios Kollias, and Stefanos Kol- lias. A large imaging database and novel deep neural ar- chitecture for covid-19 diagnosis. In 2022 IEEE 14th Im- age , V ideo, and Multidimensional Signal Processing W ork- shop (IVMSP) , page 1–5. IEEE, 2022. 2 [2] Demetris Gerogiannis, Anastasios Arsenos, Dimitrios Kol- lias, Dimitris Nikitopoulos, and Stefanos Kollias. Covid- 19 computer-aided diagnosis through ai-assisted ct imaging analysis: Deploying a medical ai system. In 2024 IEEE In- ternational Symposium on Biomedical Imaging (ISBI) , pages 1–4. IEEE, 2024. 2 [3] Kensho Hara, Hirokatsu Kataoka, and Y utaka Satoh. Can spatiotemporal 3d cnns retrace the history of 2d cnns and imagenet? 2018. 2 [4] Prannay Khosla, Piotr T eterwak, Chen W ang, Aaron Sarna, Y onglong T ian, Phillip Isola, Aaron Maschinot, Ce Liu, and Dilip Krishnan. Supervised contrasti ve learning. arXiv pr eprint arXiv:2004.11362 , 2020. 2 [5] Dimitrios K ollias, Athanasios T agaris, Andreas Stafylopatis, Stefanos Kollias, and Geor gios T agaris. Deep neural archi- tectures for prediction in healthcare. Complex & Intelligent Systems , 4(2):119–131, 2018. 2 [6] Dimitrios K ollias, N Bouas, Y Vlaxos, V Brillakis, M Se- feris, Ilianna Kollia, Lev on Sukissian, James W ingate, and S K ollias. Deep transparent prediction through latent repre- sentation analysis. arXiv pr eprint arXiv:2009.07044 , 2020. 2 [7] Dimitris Kollias, Y Vlaxos, M Seferis, Ilianna K ollia, Le von Sukissian, James W ingate, and Stefanos D Kollias. T ranspar- ent adaptation in deep medical image diagnosis. In T AILOR , page 251–267, 2020. 2 [8] Dimitrios Kollias, Anastasios Arsenos, Le von Soukissian, and Stefanos K ollias. Mia-cov19d: Covid-19 detection through 3-d chest ct image analysis. In Pr oceedings of the IEEE/CVF International Conference on Computer V ision , page 537–544, 2021. 1 , 2 [9] Dimitrios K ollias, Anastasios Arsenos, and Stefanos K ollias. Ai-mia: Covid-19 detection and se verity analysis through medical imaging. In Eur opean Confer ence on Computer V i- sion , page 677–690. Springer , 2022. 2 [10] Dimitrios K ollias, Anastasios Arsenos, and Stefanos K ollias. Ai-enabled analysis of 3-d ct scans for diagnosis of co vid-19 & its severity . In 2023 IEEE International Conference on Acoustics, Speec h, and Signal Pr ocessing W orkshops (ICAS- SPW) , page 1–5. IEEE, 2023. 1 [11] Dimitrios K ollias, Anastasios Arsenos, and Stefanos K ollias. A deep neural architecture for harmonizing 3-d input data analysis and decision making in medical imaging. Neur o- computing , 542:126244, 2023. 2 [12] Dimitrios K ollias, Anastasios Arsenos, James Wingate, and Stefanos Kollias. Sam2clip2sam: V ision language model for segmentation of 3d ct scans for covid-19 detection. arXiv pr eprint arXiv:2407.15728 , 2024. 2 [13] Dimitrios K ollias, Anastasios Arsenos, and Stefanos K ollias. Pharos-afe-aimi: Multi-source & fair disease diagnosis. In Pr oceedings of the IEEE/CVF International Confer ence on Computer V ision , pages 7265–7273, 2025. 1 , 2 [14] David Krue ger , Ethan Caballero, Joern-Henrik Jacobsen, Amy Zhang, Jonathan Binas, Dinghuai Zhang, Remi Le Priol, and Aaron Courville. Out-of-distribution general- ization via risk extrapolation (rex). In Pr oceedings of the 38th International Confer ence on Machine Learning , pages 5815–5826. PMLR, 2021. 2 [15] Adam Paszke et al. Pytorch: An imperativ e style, high- performance deep learning library . In Advances in Neural Information Pr ocessing Systems 32 , pages 8024–8035. Cur- ran Associates, Inc., 2019. 3 [16] Oriane Sim ´ eoni, Huy V . V o, Maximilian Seitzer , Federico Baldassarre, Maxime Oquab, Cijo Jose, V asil Khalidov , Marc Szafraniec, Seungeun Yi, Micha ¨ el Ramamonjisoa, Francisco Massa, Daniel Haziza, Luca W ehrstedt, Jianyuan W ang, T imoth ´ ee Darcet, Th ´ eo Moutakanni, Leonel Sentana, Claire Roberts, Andrea V edaldi, Jamie T olan, John Brandt, Camille Couprie, Julien Mairal, Herv ´ e J ´ egou, Patrick La- batut, and Piotr Bojanowski. DINOv3, 2025. 2 [17] Runtian Y uan, Qingqiu Li, Junlin Hou, Jilan Xu, Y uejie Zhang, Rui Feng, and Hao Chen. Multi-source covid-19 detection via v ariance risk extrapolation. In Proceedings of the IEEE/CVF International Confer ence on Computer V ision (ICCV) W orkshops , pages 7304–7311, 2025. 2 [18] Hongyi Zhang, Moustapha Cisse, Y ann N. Dauphin, and David Lopez-Paz. mixup: Beyond empirical risk minimiza- tion. International Conference on Learning Repr esentations , 2018. 2
Original Paper
Loading high-quality paper...
Comments & Academic Discussion
Loading comments...
Leave a Comment