SAATT Nav: a Socially Aware Autonomous Transparent Transportation Navigation Framework for Wheelchairs
While powered wheelchairs reduce physical fatigue as opposed to manual wheelchairs for individuals with mobility impairment, they demand high cognitive workload due to information processing, decision making and motor coordination. Current autonomous…
Authors: Yutong Zhang, Shaiv Y. Mehra, Bradley S. Duerstock
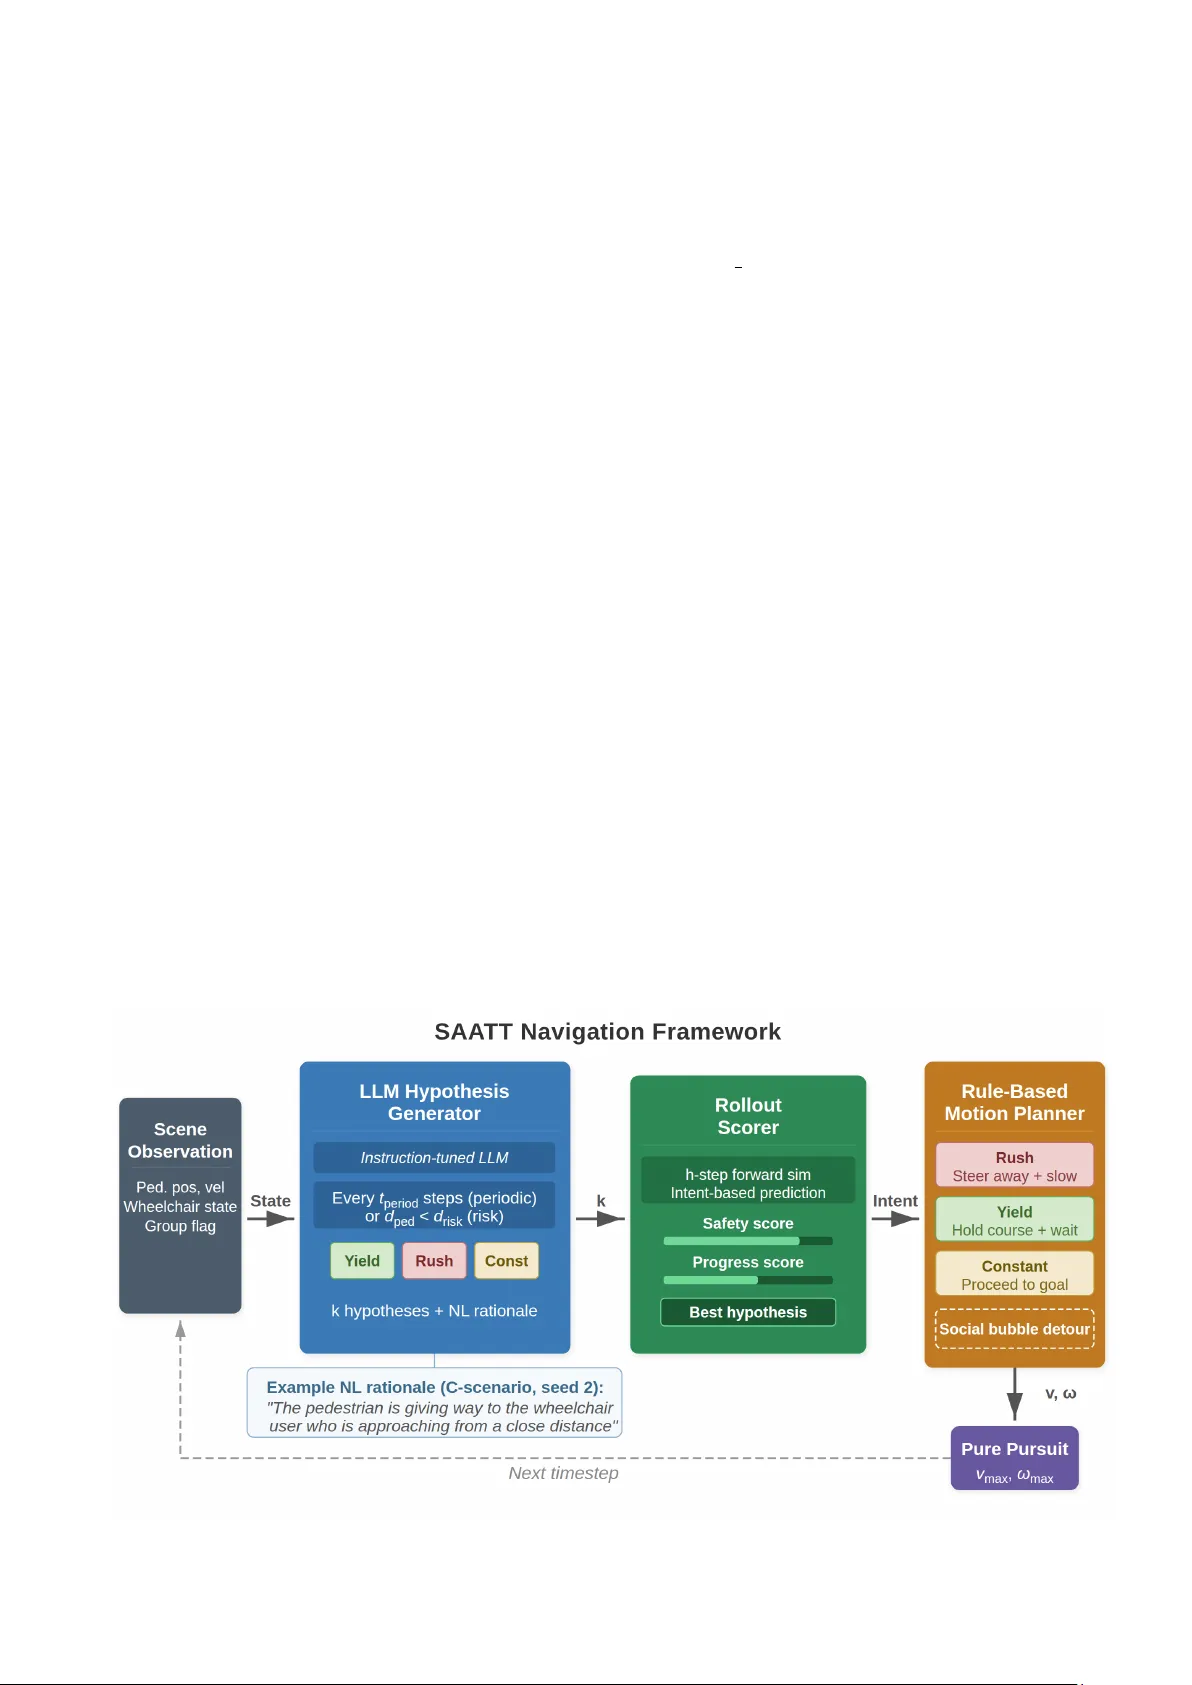
SAA TT Na v: a Socially A ware A utonomous T ranspar ent T ransportation Na vigation Framework f or Wheelchairs Y utong Zhang 1 ∗ , Shaiv Y . Mehra 2 ∗ , Bradley S. Duerstock 1 , 2 , Juan P . W achs 1 , 2 Abstract — While power ed wheelchairs reduce physical fa- tigue as opposed to manual wheelchairs for individuals with mobility impairment, they demand high cognitive workload due to information pr ocessing, decision making and motor coor - dination. Curr ent autonomous systems lack social awareness in na vigation and transparency in decision-making, leading to decreased per ceived safety and trust from the user and others in context. This work proposes Socially A war e A utonomous T ransparent T ransportation (SAA TT) Navigation framew ork for wheelchairs as a potential solution. By implementing a Large Language Model (LLM) informed of user intent and capable of predicting other peoples’ intent as a decision-maker for its local controller , it is able to detect and navigate social situations, such as passing pedestrians or a pair conv ersing. Furthermor e, the LLM textually communicates its r easoning at each waypoint for transpar ency . In this experiment, it is compared against a standard global planner , a r epresentative competing social navigation model, and an Ablation study in three simulated en vironments varied by social levels in eight metrics categorized under Safety , Social Compliance, Efficiency , and Comfort. Overall, SAA TT Nav outperforms in most social situations and equivalently or only slightly worse in the remaining metrics, demonstrating the potential of a socially aware and transparent autonomous navigation system to assist wheelchair users. Index T erms — Assistive technology , social robots, explainable AI, human robot interaction, path planning I . I N T RO D U C T I O N Approximately 80 million people w orldwide require a wheelchair for mobility , spanning older adults and indi vid- uals with neurodegenerati ve diseases, spinal cord injuries, stroke, and other conditions. This population is gro wing as medical adv ancements improve survi val rates across age groups [1] . While po wered wheelchairs reduce physi- cal strain endured by those using manual wheelchair [2] , users still face significant cognitive load from en vironmental perception, navigation, and control. Neuroimaging studies using fNIRSs sho w that navigating cluttered environments increases prefrontal cortex acti vation, reflecting higher atten- tional and executi ve demands that contribute to f atigue and performance degradation ov er time [3] . Autonomous navig ation can reduce this burden, but cro wd navigation introduces distinct dif ficulties. Collisions are most frequent in crowded settings due to the need to anticipate pedestrian trajectories, respect social spaces [4 ]–[ 6] , and in- terpret social context such as ongoing con versations, yielding *Equal contribution. 1 Edwardson School of Industrial Engineering, Purdue Univ ersity , W est Lafayette, IN 47907, USA (e-mail: { zhan3606, bsd, jpwachs } @purdue.edu). 2 W eldon School of Biomedical Engineering, Purdue University , W est Lafayette, IN 47907, USA (e-mail: mehra19@purdue.edu). Corresponding author: Y utong Zhang (zhan3606@purdue.edu). concerns o ver safety . Moreover , users’ trust in autonomous systems is hindered by lack of transparent communication and hence confusion reg arding decision-making [7] . I I . R E L A T E D W O R K A. Curr ent Autonomous Wheelchair Navigation The first intelligent wheelchair w as designed with sensors and control for obstacle av oidance by Madarasz in the early 1980’ s. Since then, controllers ha ve included model-dri ven methods like PID and MPC, as well as data-dri ven ones including supervised learning for intent recognition and rein- forcement learning. While achieving autonomous navigation, they f ace limitations in adaptability to dynamic situations and consideration for user autonomy through transparency [8] . Xu et al. proposed incorporating user preference fields and a 3D LiD AR informed local planner aware of the wheelchair user and pedestrian’ s social area, achieving better safety , ef ficiency , and social rule adherence [5] . Kappel et al. also implemented 3D LiD AR sensing and proxemics-based awareness with corridor detection and lanes, but the system was not tested for dynamic environments yet such as walking pedestrians [6] . While addressing social aw areness, neither implement user transparent decision-making. In contrast, Zhang et al. improved transparency with shared eHMI, an on-floor projection of the wheelchair’ s intended direction with short descriptions, where both users and pedestrians reported higher perceived safety , comfort, and trust [9] . Moreov er , Guo et al. demonstrated through virtual twin simulations that displayed information needs to be carefully curated to minimize distraction, decrease work- load, and promote trust while still pro viding the user enough context [10] . Nonetheless, these systems only communicate what the wheelchair will do, not why . B. Social and Human Behavior Models The Social F orce Model (SFM) by Helbing and Molnar assigns each pedestrian a circular force-lik e field based on the shortest path to their destination, desired kinematic states, and need for personal space. These fields can be repulsive or attractive, with magnitude dependent on proximity and directionality . First presented in 1995, this model represented observed pedestrian patterns well, contrib uting to man y adap- tations for modeling social situations [4] . Ho wever , SFM does not reason why pedestrians beha ve the way they do. Jha et al. proposed Representing Others’ T rajectories as Executables (RO TE), which le verages a Lar ge Language Model (LLM) to synthesize behavioral programs’ hypothesis space and Sequential Monte Carlo to reason about rela- tiv e uncertainty . By av oiding beha vior cloning or in verse planning, this algorithm a voids large datasets, limited gen- eralizability , and e xpensiv e computations, while deli vering accuracy similar to human performance [11] . C. Pr oblem Definition While wheelchairs, particularly po wered ones, enable indi- viduals with mobility disabilities to trav el locally , their con- trol and the associated informational processes yield a high cognitiv e load on the user . T o o vercome this, autonomous or intelligent robotic wheelchairs are being explored to aid users in navigating local en vironments, but they face barriers to smooth navig ation of social en vironments and trust from the user . Prior w ork suggests that this could be countered via incorporating both social awareness and transparency in autonomous navigation decisions. Our approach draws on the concept proposed by Jha et al. to model other agents’ minds by synthesizing beha vioral programs, simulating them forward, and tracking beliefs of each [11] . Instead of directly producing executable code snippets to predict future actions, we produce high level intent hypotheses that will be used to direct future actions. In this work, we present the SAA TT Nav frame work, Socially A ware Autonomous T ransparent T ransportation Navigation framew ork, hereafter referred to as SAA TT , that is efficient, safe, and socially aw are. I I I . M E T H O D A. System Overview The proposed framew ork consists of three stages as shown in Fig. 1 . First, an LLM-based hypothesis generator is used to produce a finite set of pedestrian intents. The hypotheses are formed based on the interpretation of the current environ- ment, including wheelchair and pedestrian states, obstacles, and goal position. Each hypothesis categorizes ev ery visible pedestrian based on their predicted behavior and pairs it with a rationale in natural language. A rollout-based scorer then simulates each hypothesis forward over a fixed horizon to ev aluate both safety and progress towards goal. The highest- scoring hypothesis is passed to a rule-based motion planner for execution. B. LLM-Based Hypothesis Generator An LLM model is used to generate pedestrian intent hypotheses each time the trigger condition is met from either of the two scheduling policies. The periodic trigger inv okes the LLM e very t period timesteps to maintain situational aw are- ness; while the risk trigger in vok es it when the distance from any pedestrian falls below a threshold d risk to reduce reaction latency in close encounters. The next in vocation time t next is determined by: t next = min( t periodic , t risk ) , (1) where t periodic = t last + t period , (2) t risk = min t > t last + ∆ t min : min i ∥ p i ( t ) − p wc ( t ) ∥ < d risk . (3) where t last is the timestep of the most recent LLM call, p i ( t ) is the position of pedestrian i , p wc ( t ) is the wheelchair position, and ∆ t min is the minimum timesteps enforced between consecutive calls to bound inference latency . Each time the LLM is called, it generates up to k hypothe- ses to assign one of the three beha vioral labels ( yield , rush , or constant velocity ) to each pedestrian in the en vironment, along with a rationale behind the chosen intent in natural language. The sampling temperature τ is chosen to balance creativity and coherence in the generated output. C. Rollout-Based Hypothesis Scor er After each set of k hypotheses is generated, each one is e valuated through a forward rollout simulation over a horizon of h timesteps. During each rollout, the wheelchair mov es to ward the goal under a pure pursuit controller , while the pedestrians’ v elocities are modulated according to the predicted intent. Let v i denote the observ ed velocity of pedestrian i ; the simulated velocity ˆ v i is: ˆ v i = α yield v i if intent = yield , α rush v i if intent = rush , v i if intent = constant velocity , (4) where α yield < 1 and α rush > 1 are scaling f actors chosen so that the three intents produce meaningfully distinct rollout trajectories. Since hypotheses are ranked on a relati ve scale, the exact magnitude of the scaling factors does not affect the final selection. The rollout results are used to compute both a safety score and a progress score for each hypothesis. Let n coll denote the number of timesteps in which a collision occurs during the rollout, d min the minimum wheelchair-to-pedestrian distance observed over the horizon, and d 0 , d f the wheelchair-to-goal distance at the start and end of the rollout respecti vely . The scores are defined as: S safety = max 0 , 1 − n coll h · 2 if n coll > 0 , min 1 , d min d safe if n coll = 0 and d min < d safe , 1 otherwise , (5) S progress = max 0 , d 0 − d f d 0 . (6) A collision is registered at any timestep where ∥ p i − p wc ∥ < r wc + r ped , the sum of the wheelchair and pedestrian radii. The two scores are combined into a total score: S total = w p S progress + w s S safety − λ c n coll − λ b ⊮ [ S social < 0] (7) where w s > w p so that safety takes priority o ver progress, λ c and λ b are penalty weights for collision and social bubble intrusion respectively , and ⊮ [ · ] is the indicator function. The hypothesis with the highest S total is selected and its predicted intent is forwarded to the motion planner for execution. D. Rule-Based Motion Planner The motion planner translates the selected hypothesis into a control command for the wheelchair . The predicted pedes- trian intent determines which reactive strategy is applied, and the speed limit within each strategy depends on the current distance to the nearest pedestrian d ped . Under constant velocity , the wheelchair proceeds toward the goal at its nominal speed v nom . Under rush and yield , the wheelchair progressi vely reduces speed based on the current distance to the nearest pedestrian d ped : v ref = 0 if d ped < d ∗ stop , v ∗ slow if d ped < d ∗ slow , v nom otherwise , (8) where d ∗ stop , d ∗ slow , and v ∗ slow are intent-dependent thresholds. The yield thresholds are set larger than those for rush such that the wheelchair be gins decelerating earlier when it expects the pedestrian to slo w down. Under rush , the wheelchair additionally steers laterally away from the pedes- trian. When the LLM module is acti ve and a social group is detected, defined as two or more stationary pedestrians in close proximity , the planner computes a detour waypoint around the group’ s social bubble. The bubble is centered at the midpoint of the two pedestrians with radius: r bubble = 1 2 ∥ p 1 − p 2 ∥ + r ped + m personal + m group , (9) where p 1 , p 2 are the pedestrian positions, r ped is the pedes- trian radius, m personal is the personal space margin, and m group is the group space margin. Even when the physical gap be- tween the two pedestrians is wide enough for the wheelchair to pass through, the planner treats the conv ersational space as a unified social zone and routes around it. The detour relies on the LLM’ s ability to recognize the pedestrian group as a social interaction rather than two independent obstacles; without hypothesis generation, the planner has no basis to distinguish a con versational pair from unrelated bystanders and therefore does not trigger the detour . At the low level, a pure pursuit controller conv erts each planner waypoint into linear and angular velocity commands: ω = k θ wrap θ desired − θ , (10) a = k v v ref − v , (11) where θ desired = atan2 ( y wp − y , x wp − x ) is the heading to ward the waypoint, wrap ( · ) normalizes the angle to [ − π , π ] , and k θ , k v are proportional gains. Both ω and a are clipped to [ ω min , ω max ] and [ a min , a max ] respectively . The complete procedure is summarized in Algorithm 1 . E. Baseline Methods As a global planner, the A* baseline computes the shortest path on a discretized grid and follo ws it using the same pure pursuit controller . Pedestrians are treated as inanimate obsta- cles with no proxemics or social bubbles in the occupancy Fig. 1. Overvie w of the SAA TT Navigation Framework. Algorithm 1 SAA TT Navigation Framew ork Require: config, goal position g , max steps N 1: Initialize en vironment, planner , controller 2: t last ← −∞ , H ← ∅ 3: f or t = 0 to N do 4: Observe s wc = ( x, y , θ, v ) , pedestrians { p i , v i } 5: if t ≥ t last + t period or min i ∥ p i − p wc ∥ < d risk then 6: if t − t last ≥ ∆ t min then 7: H ← LLM.generate ( k hypotheses ) 8: t last ← t 9: end if 10: end if 11: for each h j ∈ H do 12: Simulate h steps with ˆ v i per intent 13: Compute S j safety , S j progress , S j total 14: end f or 15: h ∗ ← arg max j S j total 16: ( w , v ref ) ← Planner ( obs , h ∗ ) 17: ω ← k θ wrap ( θ desired − θ ) 18: a ← k v ( v ref − v ) 19: Apply ( a, ω ) to en vironment 20: if goal reached or collision then 21: break 22: end if 23: end f or grid, so the planner produces the same path re gardless of the social context. The SFM baseline is inspired by the social force frame- work of Helbing and Moln ´ ar [4] , adapted for wheelchair navigation. The net force acting on the wheelchair is: F = F goal + X i F ped ,i + X j F wall ,j , (12) where F goal is an attracti ve force directed to ward the goal, and F ped ,i , F wall ,j are repulsi ve forces that decay e xponen- tially with distance from pedestrian i and wall j respectiv ely . The net force is normalized to produce a short-horizon subgoal tracked by the pure pursuit controller . Because SFM treats each pedestrian independently , it has no notion of a shared con versational space and cannot avoid social bubbles. The Ablation method uses the same rule-based planner as the proposed SAA TT framew ork but with the LLM module disabled. W ithout LLM inference, no h ypothesis is generated, no intent-based speed modulation is applied, and no social bubble detour is triggered. Any performance difference between the proposed framew ork and the Ablation is therefore attributable to LLM-based reasoning alone. I V . E X P E R I M E N TA L S E T U P A. Simulation Envir onment All experiments were conducted in a custom 2D simula- tion en vironment implemented in Python, modeling a 10m- by-10m space. The wheelchair is represented as a circular agent with a radius of 0.4 m, a maximum linear v elocity of 1.5 m/s [12] , and differential driv e kinematics [13] . Pedestrians are modeled as circular agents with a radius of 0.3 m. A collision is registered when the distance between the wheelchair center and any pedestrian center falls below 0.7 m, corresponding to the sum of their radii. Each trial runs at a timestep of 0.1 s for a maximum of 1000 steps (100 s) and terminates early if the wheelchair reaches within 0.5 m of the goal. The number of h ypotheses k = 8 and minimum in- terval ∆ t min = 15 steps between LLM calls were cho- sen to limit inference latency for ev entual deplo yment on embedded hardw are. The sampling temperature τ = 0 . 7 balances creativ e reasoning and coherence, as v alues above 1.0 significantly de grade causal reasoning and instruction following [14 ], [ 15] . The rollout speed scales α yield = 0 . 2 and α rush = 1 . 5 produce distinct trajectories for scoring; since hypotheses are ranked on a relati ve scale, the exact magnitudes do not af fect the final selection. The safe distance threshold d safe = 2 . 0 m lies within the social distance zone of 1.2–3.6 m identified in [16] . Safety is weighted twice as heavily as progress ( w s = 20 , w p = 10 ) to prioritize collision av oidance o ver tra vel efficiency , consistent with the safety- first principle in human-aw are na vigation [17] . All system parameters are summarized in T able I . B. Scenarios Three scenarios of increasing social complexity were designed to ev aluate the proposed framework. Scenario A features a open corridor with no pedestrians. The wheelchair na vigates from a randomized start position to a randomized goal. This scenario aims to verify that all four methods produce equiv alent performance in the absence of social context. Scenario B consists of a con versing pair where two stationary pedestrians are placed in a face-to-face arrange- ment, forming an F-formation [18] , or social b ubble. The wheelchair na vigates from start to goal in the presence of this social bubble. Scenario C includes a crossing pedestrian that walks horizontally across the wheelchair path at a randomized speed between 0.4 m/s and 0.8 m/s. This scenario tests the ability to predict pedestrian intent and respond appropriately to a dynamic agent. C. Randomization and P aired Design For each scenario, 30 unique layouts were generated using random seeds. Each seed determines the start position, goal position, and pedestrian placement. All four methods were ev aluated on the exact same 30 layouts per scenario, creat- ing a paired experimental design that ensures performance differences are not confounded by layout variation. The total number of trials is 3 scenarios by 4 methods by 30 seeds, yielding 360 experiments. D. P erformance Metrics Follo wing e valuation frame works for socially-a ware robot navigation [17 ], [ 19 ], [ 20] , we assess performance across four categories: Safety , Social Compliance, Ef ficiency , and Comfort. Safety is measured by the Collision Count (total timesteps in violation) and the Minimum Pedestrian Distance (closest approach to an y pedestrian across an entire trial). Social Compliance in Scenario B is measured by Bubble T ABLE I S Y ST E M P A RA M E T ER S Symbol Description V alue En vir onment r wc Wheelchair radius 0.4 m r ped Pedestrian radius 0.3 m v max Max linear velocity 1.5 m/s ∆ t Simulation timestep 0.1 s LLM Hypothesis Generator t period Periodic trigger interval 30 steps d risk Risk trigger distance 3.0 m ∆ t min Min steps between calls 15 steps k Hypotheses per call 8 τ Sampling temperature 0.7 Rollout Scor er h Rollout horizon 30 steps α yield Y ield speed scale 0.2 α rush Rush speed scale 1.5 d safe Safe distance threshold 2.0 m w p Progress weight 10.0 w s Safety weight 20.0 λ c Collision penalty 50.0/step λ b Bubble penalty 100.0 Motion Planner v nom Nominal speed 1.5 m/s d slow Slow-do wn radius 1.0 m d stop Stop radius 0.6 m m bubble Social bubble margin 0.3 m Pur e Pursuit Contr oller k θ Heading gain 2.0 k v Speed gain 1.0 ω max Max angular velocity 1.0 rad/s Intrusion Steps, the number of timesteps the wheelchair spent inside the social b ubble. Efficiency is measured by T rav el T ime, Path Length, and Success in goal-reaching. Comfort is assessed through Mean Angular V elocity and Mean Jerk, which captures smoothness of heading changes and acceleration profiles respecti vely . V . R E S U LT S A N D D I S C U S S I O N A. Statistical Analysis Every metric besides successes, was non-binary data, containing 120 total e xperimental trials including 30 random- ized seeds matched across all navigation methods for each en vironment. A normalized visualization summarizing every metric’ s av erage is in Fig. 2 . An example comparison of the same seed across all three scenarios, including Collision Count, T rav el Time, and Path Length is sho wn in Fig. 3 . Since they had the same e xperimental treatment, the data was considered dependent. Howe ver , it was unkno wn if the data was parametric or not, so the Shapiro-Wilk Normality test was used to ensure the correct statistical analysis would be performed for each method and environment combination (12 total). Ultimately , majority of the metrics’ p-values were less than 0.05, meaning they failed the tests and hence were considered abnormal distributions. As the data was deemed nonparametric, paired, and de- pendent, the Friedman’ s test was conducted to determine if any of the methods yielded statistically significant dif ference Fig. 2. Radar plots for performance metrics across scenarios, normalized via Min-Max Scaling. Complements were found for all but Success and Minimum Pedestrian Distance to ensure the outer ring correlates to better performance. compared to the other groups for each scenario when p-v alue is less than 0.05. If one was detected, the Conover test was then utilized to perform paired t-test comparisons between each of the methods and rank the best performers due to its high po wer and ability to detect real differences. These statistical significances or lack thereof and ranking results are shown in T able II . The final metric is Success, which consists of digital values for each trial that was performed. Due to the data’ s binary nature, it is non-parametric. In order to detect statistically significant difference in success rates Cochran’ s Q T est was used for each scenario en vironment. Due to the near 100 per- cent success rates for each method per scenario, the p-v alues were incalculable or were greater than 0.05, communicating that there was no statistically significant differences in path completion. B. Safety Scenario A had no statistically significant dif ferences for both Collision Count and Minimum Pedestrian Distance. In other terms, all na vigation methods took relati vely similar or same path in the first case due to the lack of human or dynamic obstacles. SAA TT had the least number of collisions in both scenario B and C. For Minimum Pedestrian Distance, the largest minimum distance was achieved by SAA TT in scenario B and C again. This suggests that the SAA TT model is best at av oiding collisions and maintaining space between the Fig. 3. T rajectory comparison across all four methods in Scenario A (left), B (center), and C (right) for a representative seed. wheelchair user and surrounding pedestrians when navig ating social and dynamic en vironments, which correlates with better safety for the user and pedestrians. C. Social Compliance The number of timesteps of the wheelchair user in the social bubble, Bubble Intrusion Steps, was only observed in scenario B. In the SAA TT Nav framew ork, the wheelchair spent the least timesteps in the social bubble, av oiding encroaching on the social interaction compared to the other three methods. D. Efficiency For T ravel T ime, A* completed their trajectories in the shortest time periods for Scenarios B and C, while SAA TT performed better for Scenario A. This better performance was likely due to the fact that A* ignored social situations, while SAA TT took it into consideration. It is worth noting that the range for this dataset is 2.3 seconds while it is 88.4 and 13.4 seconds for scenario B and C respecti vely , meaning that scenario A ’ s times are relati vely similar . Also, SAA TT had statistically similar performances with Ablation and SFM methods. The performance across the scenarios for Path Lengths was much more varied with the best being SFM for Scenario A, A* for Scenario B, and SAA TT for Scenario C. Also, SAA TT performed similarly to Ablation in Scenario A. The first scenario had a data range of 1.885 m, while scenario B and C had 10.87 m and 4.043 m respecti vely . For B, A* likely had the shortest lengths as it ignored the social bubble and na vigated between both human obstacles. A and C had relativ ely low Path Lengths ranges so the differences may not be as important but SAA TT performing better with the introduction of the dynamic social element is worth highlighting. As mentioned in the statistical analysis section, the success rates yielded no statistically significant dif ferences. While this does not support any claims, it does demonstrate that all methods are able to properly navig ate to the goal. E. Comfort The lowest Mean Angular V elocity metrics were achie ved by SFM for Scenario A, and SAA TT for Scenarios B and C. Additionally , the data demonstrated similarity between SAA TT and the Ablation for Scenarios A and C. The higher ranks for the two social situations sho w that SAA TT was better at avoiding rapid, sharp turns, contributing to a smoother trajectory . A* achiev ed the lowest Mean Jerk for all scenarios with SAA TT having no difference for Scenario B. This is most likely due to the global planner being designed to take the shortest path, making it inherently ignore the social situations. Ag ain, it is also worth noting that the data ranges for scenarios A, B, and C are 0.0684, 0.2376, and 0.3906 seconds respectiv ely , all of which are really small and may be negligible in real world applications. This means that all methods hav e no major fluctuations in acceleration that cause the rider to be uncomfortably lurched by the wheelchair mov ement. F . LLM vs. Ablation P erformance Although there are some cases where SAA TT and Ablation had the same beha vior , such as all metrics for scenario A and specifically Efficiency , Comfort, and Social Compliance categories for scenario C, this beha vior was not uni versal. First, in these cases the performance was most likely deemed statistically similar, not exactly the same, due to using the same local planner responsible for base functionality . Second, the SAA TT method dif fered from the Ablations in all metrics for scenario B and specifically Safety metric cate gory for scenario C, which is confirming as Safety and Scenario B were more tied to the pedestrians themselves. Since the only difference between the tw o methods is the LLM incorporating pedestrian intent, these v aried demonstrated T ABLE II P E RF O R M AN C E C O M P A R IS O N A CR OS S S C EN A RI O S A , B , A N D C . Category Metric A B C Safety Collision Count (low to high) SAA TT , Ablation/SFM, A* SAA TT , A*, SFM/Ablation Minimum Pedestrian Distance (m) (high to low) SAA TT , Ablation/SFM, A* SAA TT , SFM, A*/Ablation Social Compliance Bubble Intrusion Steps (low to high) SAA TT , Ablation/SFM, A* Efficiency Tra vel Time (s) (low to high) Ablation/SAA TT /SFM, A* A*, SFM/Ablation, SAA TT A*, SFM/Ablation, SAA TT Path Length (m) (low to high) SFM, SAA TT/Ablation , A* A*, SAA TT , Ablation/SFM SAA TT , SFM/A*/Ablation Success Rate (N/A) Comfort Mean Angular V elocity (rad/s) (low to high) SFM, Ablation/SAA TT , A* SAA TT , Ablation/A*/SFM SAA TT/Ablation , SFM, A* Mean Jerk (m/s 3 ) (low to high) A*, SFM/ SAA TT/Ablation A*/SAA TT , Ablation, SFM A*, Ablation/SAA TT /SFM Note: The gray boxes represent no statistically significant dif ference across all groups, green box es indicate where SAA TT is ranked first, and red boxes indicate when they are not. Methods separated by “/” are deemed not statistically significantly different. Combinations of SAA TT and Ablation are bolded as well. behaviors supports that intent-prediction does influence its decision making. G. T ranspar ency As demonstrated in Fig. 4 , the LLM system is capable of generating messages along the autonomous wheelchair trajectory . The message communicates the navigation sys- tems’ intentions and logic or reducing user confusion and distrust. Research in social sciences shows that people prefer selectiv e, cause-focused explanations over exhausti ve causal chains. This transforms the otherwise black-box navigation into a transparent decision-making process [21] . V I . L I M I T A T I O N S A N D F U T U R E D I R E C T I O N S Currently , SAA TT treats the humans in social situations as repellent forces. While this is applicable to non-attractiv e strangers, it is possible that the user might want to approach them to interact, which could be represented via attractive forces [4] . Furthermore, we could provide more context to Fig. 4. Qualitative results of the proposed frame work in Scenario C, showing wheelchair trajectory , LLM refresh ev ents, and predicted pedestrian intents to demonstrating transparency . the LLM that resembles natural social cues in ev eryday interactions, such as a person’ s body language, eye gaze, or vocal cues [22] . In this scenario, if two people are oriented away from each other , the system may infer that they are not engaged in con versation and that it is socially permissible to pass between them. Another future direction is to incorporate a user pref- erence field where top hypotheses are presented to the user for decision making. This mitigates over -reliance and complacency seen in autonomous driving research [23] while supporting the higher sense of agency preferred by assistiv e robotics users [24] . The system could be personalized per user via machine learning [25] to build trust. Alternatively , tuning LLM temperature and model size could better align SAA TT’ s social navigation behavior with user preferences, as temperature af fects reasoning, creati vity , and instruction following [14 ], [ 15] . Lastly , as edge-de vice deployment is explored in real- world settings, inference techniques need to be optimized to meet the latency constraints of real-time navigation. T o further real-w orld translational merit, simulation scenarios ev aluated in this work should be extended to higher-density and more comple x social dynamics to validate SAA TT’ s robustness across di verse conditions encountered in realistic assistiv e navigation. V I I . C O N C L U S I O N S By using the LLM as a human-proxy for decision mak- ing, the simulations demonstrated SAA TT’ s ability to av oid dynamic and social obstacles, such as strangers conv ersing or crossing pedestrians, that a wheelchair user would need to overcome in a more socially acceptable way . When compared to the global planner A*, SAA TT demon- strated better performance in the metric categories of Safety and Social Compliance, equi valent performance in terms of Success, Path Length for the dynamic social situation, and partially in Comfort specifically Mean Angular V elocity for both social situations. A* did perform better in the remaining metrics in the Efficienc y category and Comfort, but it is biased by categorizing individuals as inanimate objects and encroaching personal and social bubbles. For SFM, our representati ve for other social navigation methods, SAA TT performed better or equiv alent to it for all categories in scenarios B and C. In scenario A, SAA TT performed slightly worse in Path Length and Mean Angular V elocity , while equiv alently for Tra vel Time and Mean Jerk. The comparison between Ablation and SAA TT also demonstrated the benefits of understanding intent of the social obstacles when na vigating social scenarios. Finally , the system displayed its reasoning for each way- point to the user to improv e transparency . While the study lacked human users to assess the explanations, its ability to communicate its intentions and logic serves as an example of it potential to de velop trust with its user and sense of safety within its user . Despite the discussed limitations, this work proposes SAA TT , a potential method for autonomous navigation that successfully accounts for social awareness and transparency by incorporating an LLM model for making more human- like social decisions and communicating with its user . AC K N OW L E D G M E N T This research was funded, in part, by the Advanced Research Projects Agency for Health (ARP A-H) Agreement No. 140D042590012. The views and conclusions contained in this document are those of the authors and should not be interpreted as representing the official policies, either expressed or implied, of the U.S. Government. This work was partially supported by the Center for AI and Robotic Excellence in medicine (CARE) at Purdue Univ ersity . Com- putation in this work used An vil at Purdue Univ ersity through allocation cis260101-gpu from the Adv anced Cyber- infrastructure Coordination Ecosystem: Services & Support (A CCESS) program, which is supported by U.S. National Science Foundation grants #2138259, #2138286, #2138307, #2137603, and #2138296. The authors also acknowledge the use of Claude (Anthropic) for assistance in manuscript language polishing, code debugging, and the dev elopment of data visualization scripts. Additionally , data analysis for this paper was conducted using the Real Statistics Resource Pack software (Release 9.4.5), Copyright (2013 – 2026) Charles Zaiontz (www .real-statistics.com). Omitted for anonymous revie w . R E F E R E N C E S [1] W orld Health Organization, Wheelc hair Pro vision Guidelines . Genev a, Switzerland: W orld Health Organization, 2023. [Online]. A vailable: https://www .ncbi.nlm.nih.gov/books/NBK600090/ [2] D. Kang, J. Kim, S.-D. Eun, and J. Park, “Systematic revie w of us- ability tests for manual wheelchairs: Enhancing mobility and reducing shoulder injuries in individuals with spinal cord injuries, ” Journal of Clinical Medicine , vol. 14, no. 9, p. 3184, 2025. [3] S. Joshi, R. R. Herrera, D. N. Springett, B. D. W eedon, D. Z. M. Ramirez, C. Holloway , H. Dawes, and H. A yaz, “Neuroergonomic as- sessment of wheelchair control using mobile fnirs, ” IEEE T ransactions on Neural Systems and Rehabilitation Engineering , vol. 28, no. 6, pp. 1488–1496, 2020. [4] D. Helbing and P . Molnar, “Social force model for pedestrian dynam- ics, ” Physical r eview E , vol. 51, no. 5, pp. 4282–4286, 1995. [5] Y . Xu, Q. W ang, V . Kamat, and C. Menassa, “Socially aware shared control na vigation for assistive mobile robots in the built en viron- ment, ” Journal of Computing in Civil Engineering , vol. 40, no. 1, p. 04025108, 2026. [6] K. Kappel and P . R. Ferreira, “T owards comfortable and socially acceptable navigation in autonomous motorized wheelchairs, ” in 2023 Latin American Robotics Symposium (LARS), 2023 Brazilian Sympo- sium on Robotics (SBR), and 2023 W orkshop on Robotics in Education (WRE) . IEEE, 2023, pp. 319–324. [7] B. Zhang, H. Eberle, C. Holloway , and T . Carlson, “Design require- ments and challenges for intelligent power wheelchair use in crowds: learning from expert wheelchair users, ” in Pr oceedings of the RESNA Annual Confer ence 2021 . Rehabilitation Engineering and Assistiv e T echnology Society of North America . . . , 2021. [8] G. Atulan, K. R. Chowdhury , F . Nusrat, and M. P . Schoen, “Evolution and emerging trends in intelligent wheelchair control: A comprehen- siv e revie w , ” Machines , vol. 14, no. 1, p. 33, 2025. [9] X. Zhang, Z. Song, Q. Huang, Z. Pan, W . Li, R. Gong, and B. Zhao, “Shared ehmi: Bridging human–machine understanding in autonomous wheelchair navigation, ” Applied Sciences , vol. 14, no. 1, p. 463, 2024. [10] J. Guo, Y . Hu, Q. Huang, A. W ang, and X. Zhang, “Shared autonomy for cognitiv e load regulation in autonomous wheelchairs, ” Co gnition, T echnolo gy & W ork , vol. 27, no. 4, pp. 795–820, 2025. [11] K. Jha, A. Y . Huang, E. Y e, N. Jaques, and M. Kleiman-W einer, “Modeling others’ minds as code, ” 2025. [12] R. A. Cooper , T . Thorman, R. Cooper, M. J. Dvorznak, S. G. Fitzgerald, W . Ammer , G. Song-Feng, and M. L. Boninger, “Driving characteristics of electric-powered wheelchair users: how far , f ast, and often do people driv e?” Arc hives of physical medicine and r ehabilitation , vol. 83, no. 2, pp. 250–255, 2002. [13] B. Gersdorf and H. Shi, “ A castor wheel controller for dif ferential dri ve wheelchairs, ” in Proc. 7th International Confer ence on Informatics in Contr ol, Automation and Robotics , 2010, pp. 174–179. [14] M. Renze, “The effect of sampling temperature on problem solving in large language models, ” in Findings of the association for compu- tational linguistics: EMNLP 2024 , 2024, pp. 7346–7356. [15] L. Li, L. Sleem, N. Gentile, G. Nichil, and R. State, “Exploring the impact of temperature on large language models: Hot or cold?” Pr ocedia Computer Science , vol. 264, pp. 242–251, 2025. [16] J. Rios-Martinez, A. Spalanzani, and C. Laugier , “From proxemics theory to socially-aware navigation: A survey , ” International Journal of Social Robotics , vol. 7, no. 2, pp. 137–153, 2015. [17] T . Kruse, A. K. Pandey , R. Alami, and A. Kirsch, “Human-aware robot navigation: A survey , ” Robotics and A utonomous Systems , vol. 61, no. 12, pp. 1726–1743, 2013. [18] A. Kendon, Conducting Interaction: P atterns of Behavior in F ocused Encounters . Cambridge, U.K.: Cambridge University Press, 1990. [19] J. Karw owski and W . Szynkie wicz, “Quantitativ e metrics for bench- marking human-aw are robot navigation, ” IEEE Access , vol. 11, pp. 79 941–79 953, 2023. [20] Y . Gao and C.-M. Huang, “Evaluation of socially-aware robot na vi- gation, ” F r ontiers in Robotics and AI , vol. 8, p. 721317, 2022. [21] T . Miller, “Explanation in artificial intelligence: Insights from the social sciences, ” Artificial intelligence , vol. 267, pp. 1–38, 2019. [22] R. B. Adams Jr, D. N. Albohn, and K. Kveraga, “Social vision: Ap- plying a social-functional approach to face and expression perception, ” Curr ent dir ections in psychological science , vol. 26, no. 3, pp. 243– 248, 2017. [23] W . W en, Y . Kuroki, and H. Asama, “The sense of agency in dri ving automation, ” F r ontiers in psychology , vol. 10, p. 2691, 2019. [24] M. A. Collier, R. Narayan, and H. Admoni, “The sense of agency in assistiv e robotics using shared autonomy , ” in 2025 20th ACM/IEEE International Confer ence on Human-Robot Interaction (HRI) . IEEE, 2025, pp. 880–888. [25] A. Ahmadi, M. N. Jahromi, M. A. Mostaf avi, E. Morales, and N. Sabo, “ Assistiv e navig ation technologies for inclusiv e mobility: Identifying key environmental factors influencing wheelchair navigation through a scoping revie w , ” ISPRS International Journal of Geo-Information , vol. 15, no. 2, p. 75, 2026.
Original Paper
Loading high-quality paper...
Comments & Academic Discussion
Loading comments...
Leave a Comment