Voluntary Renewable Programs: Optimal Pricing and Revenue Allocation
This paper develops a multi-period optimization framework to design a voluntary renewable program (VRP) for an electric utility company, aiming to maximize total renewable energy deployments. In the business model of VRP, the utility must ensure it g…
Authors: Zhiyuan Fan, Tianyi Lin, Bolun Xu
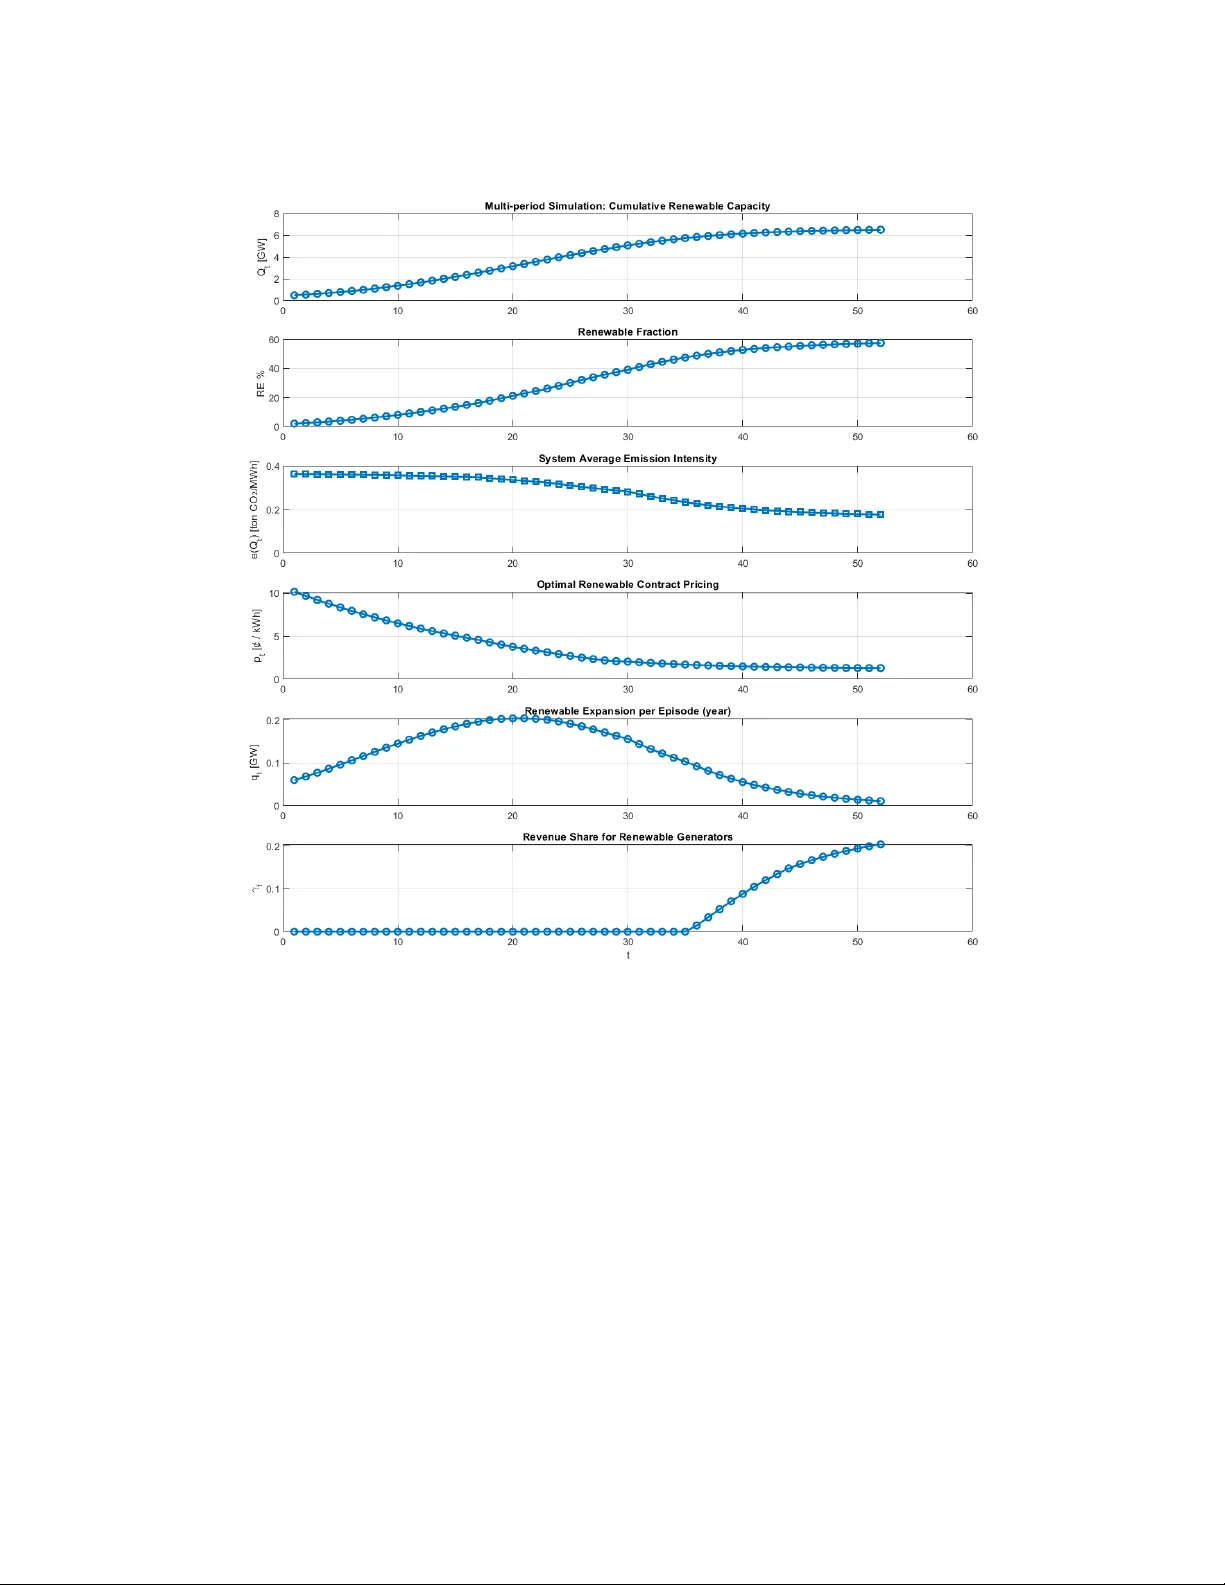
V olun tary Renew able Programs: Optimal Pricing and Rev en ue Allo cation Zhiyuan F an ∗ Tian yi Lin † Bolun Xu ‡ Marc h 19, 2026 Abstract This pap er dev elops a multi-perio d optimization framework to design a volun tary renewable program (VRP) for an electric utility company , aiming to maximize total renewable energy de- plo yments. In the business mo del of VRP , the utility m ust ensure it generates renewable energy up to the total amoun t of contract during eac h mark et episode (i.e., a y ear), while all the rev enue collected from the VRP must either b e used to inv est in procuring renewable capacities or to main tain the curren t renewable fleet and infrastructure. W e th us formulate the problem as an optimal pricing problem coupled with rev en ue allo cation and renew able deploymen t decisions. W e model the demand function of volun tary renewable contracts as an exp onen tial deca y func- tion based on survey data. W e analytically derive the optimal pricing policy of the VRP as a function of the current grid carb on intensit y . W e prov e that a my opic p olicy is conditionally optimal, whic h maximizes renewable capacity in each p eriod, attains the long-run optimum due to the utilit y’s reven ue-neutral constrain t. W e sho w differen t binding conditions and marginal v alues of decision v ariables corresp ond to different phases of the energy transition, and that the utility should strategically design its reven ue-sharing decisions, balancing inv estments in renew able expansion and subsidizing existing renewable fleets. Finally , w e sho w that volun tary renew able programs can only extend renew able penetration but cannot achiev e net-zero emis- sions or a fully renewable grid. This pricing–allo cation–expansion framework highligh ts b oth the p oten tial and limitations of volun tary renewable demand, pro viding analytical insight in to optimal policy design and the qualitative shifts occurring during the energy transition pro cess. 1 In tro duction The decarb onization of electricity systems requires the large-scale deploymen t of renew able gen- eration such as wind and solar. Rapid cost declines ha ve made these technologies increasingly comp etitiv e with conv entional fossil-fuel generation, enabling substantial commercial deploymen t in many regions In ternational Renew able Energy Agency [2023]. A t the same time, integrating high shares of renewables presents b oth op erational and economic challenges for p o wer systems. Because renewable resources are inheren tly v ariable and in termittent, main taining system reliabil- it y requires complementary inv estmen ts in flexibility resources suc h as energy storage, flexible gas turbines, and adv anced grid managemen t Denholm et al. [2015a]. ∗ Departmen t of Earth and En vironmental Engineering, Colum bia Universit y , USA. Correspondence. Email: zf2198@colum bia.edu † Departmen t of Industrial Engineering and Op erations Researc h, Columbia Univ ersity , USA. Email: tl3335@colum bia.edu ‡ Departmen t of Earth and Environmen tal Engineering, Colum bia Univ ersity , USA. Email: b x2177@columbia.edu 1 In addition to these op erational c hallenges, renewable generation in teracts in complex w ays with the design of comp etitiv e electricit y mark ets. Renew able generators t ypically ha ve near- zero marginal op erating costs Borenstein [2012]; Josko w [2019], while wholesale electricit y markets commonly rely on marginal pricing mechanisms in whic h all generators receive the mark et-clearing price determined b y the marginal unit. As renewable p enetration increases, this merit-order effect tends to suppress wholesale electricit y prices during p eriods of high renew able output, reducing the mark et v alue of renewable generation Brown and Reichen b erg [2019]; Hirth [2013a]. Consequently , ev en when renew able tec hnologies are cost-competitive on a lev elized basis, the reven ue they earn from electricity mark ets can decline as their deplo ymen t expands. This dynamic implies that comp etitiv e electricity mark ets alone ma y not generate sufficien t in vestmen t incen tives to sustain large-scale renewable expansion. 1.1 V oluntary Demand for Renewable Electricit y In parallel with these market limitations, volun tary demand for renew able electricity has grown rapidly in recen t y ears and is increasingly emerging as an imp ortan t driv er of renewable deploy- men t. Large corp orations—including tec hnology firms such as Go ogle, Apple, and Microsoft—ha ve committed to sourcing renewable electricity for their op erations through long-term pro curemen t con tracts, while manufacturers and other commercial consumers increasingly purchase renewable energy to reduce their carbon fo otprin ts O’Shaughnessy et al. [2021a]; T riv ella et al. [2023a]. At the same time, many utilities now offer volun tary renew able electricit y programs that allo w customers to purchase electricity bac ked b y renew able generation at a price premium. T able 1 summarizes represen tative examples of such programs in the United States, showing that full renewable elec- tricit y plans typically imp ose a price premium ranging from approximately 0.75 to 2.2 cents p er kilo watt-hour. In practice, volun tary renew able demand is implemen ted through several institutional mecha- nisms. Renew able energy certificates (RECs) a widely used mec hanisms for monetizing the envi- ronmen tal attributes of renew able electricit y . A REC represen ts a tradable claim on the renew able generation associated with one unit of electricit y , allowing buyers to supp ort renewable pro duction indep enden tly of the underlying electricit y supply Morthorst [2000]. Because RECs can b e traded separately from electricit y , they pro vide an additional reven ue stream for renew able generators and create a mark et-based instrument for supp orting renewable deplo yment. In compliance markets, REC prices are disciplined by regulatory obligations such as renewable p ortfolio standards, and a substan tial literature studies their price dynamics and interactions with electricity markets [Hul- shof et al., 2019; Jensen and Skytte, 2002; Shriv ats et al., 2022; T anak a and Chen, 2013]. Ho w ever, v oluntary REC mark ets often operate with thin liquidity , bilateral trading, and limited trans- parency , whic h can weak en price disco v ery and reduce the credibilit y of the resulting price signals for renewable inv estment F rei et al. [2018]; Hulshof et al. [2019]; Wimmers and Madlener [2023]. Long-term p o wer purchase agreements (PP As) represent a second ma jor mechanism through whic h renewable attributes are monetized. Under a PP A, large electricity consumers con tract di- rectly with renew able generators through long-term agreemen ts that pro vide stable rev enue streams and supp ort pro ject financing. Corporate PP As hav e b ecome an important c hannel for volun tary renew able pro curemen t, particularly for large technology firms and other energy-intensiv e indus- tries [T riv ella et al., 2023b]. While PP A can impro ve rev enue stability and facilitate renew able in- v estment, they also bundle electricit y supply , financial risk allocation, and en vironmental attributes in to a single con tract. This bundling can obscure the standalone v alue of renewable attributes and limit transparent price formation for renew able credits Bac kstrom et al. [2024]; Ghiassi-F arrokhfal et al. [2021]. 2 Another imp ortan t limitation of corp orate renew able pro curemen t through PP As is that the con tract price primarily reflects the generation cost of renewable electricit y but do es not incorpo- rate the broader system costs asso ciated with delivering and integrating that electricity into the p o w er grid. In particular, the costs of transmission expansion, distribution upgrades, and system balancing resources—suc h as energy storage, flexible generation, and reserve capacity—are typi- cally b orne elsewhere in the electricity system rather than reflected in the PP A price. Empirical mark et data suggest that recent corp orate renewable PP As in North America hav e prices on the order of $ 50–70/MWh, corresp onding to roughly $ 0.05–0.07/kWh for utility-scale wind and solar con tracts Lev elT en Energy [2024]. Because these prices are often close to prev ailing wholesale elec- tricit y prices in competitive p o wer markets, the effective “green premium” for corp orate renewable pro curemen t is frequently small and may ev en be negativ e in regions with abundant renew able re- sources O’Shaughnessy et al. [2021a]. While this price comp etitiv eness has facilitated rapid gro wth in corp orate renew able procurement, it also highligh ts that PP A prices capture only a p ortion of the true economic cost of renewable electricit y supply . As renewable penetration increases, the omitted costs of delivery , in tegration, and system balancing become increasingly significan t, suggesting that PP A-based pro curemen t alone ma y not pro vide a sustainable framew ork for co ordinating large-scale renew able deplo ymen t. As a result, b oth REC markets and PP A-based pro curemen t may generate fragmen ted or in- consisten t price signals for renew able in v estment Ranson and Sta vins [2016]. 1.2 V oluntary Renewable Programs V oluntary Renewable Programs (VRPs) represent an alternative mec hanism that more directly connects renew able pro curement with the underlying costs of electricit y delivery and system in- tegration. Under VRPs, utilities offer customers the option to purchase electricit y bac k ed b y renew able generation at a sp ecified price premium. Unlik e RECs and PP As—which are typically traded in wholesale certificate markets or negotiated through bilateral corp orate pro curemen t con- tracts—VRPs op erate at the retail level and aggregate consumer willingness to pay through the utilit y . Because utilities remain responsible for electricity deliv ery , retail pricing, and in vestmen ts in the distribution infrastructure required to accommo date growing renewable p enetration, they are uniquely p ositioned to incorporate b oth generation costs and system-level in tegration costs into renew able pricing decisions P ollitt [2012]. VRPs are b ecoming an increasingly important c hannel for financing renew able and lo w-carb on energy outside formal compliance regimes. Recen t studies do cumen t b oth their rapid gro wth and their p ersisten t w eaknesses in credibility , price formation, and pro curemen t design [Bjørn et al., 2022; Kreibic h and Herm wille, 2021; W etterb erg et al., 2024]. These c hallenges are especially salien t b ecause VRP demand now arises through a widening range of pro curemen t channels, from large corp orate p o wer purc hase agreemen ts [T aheri et al., 2025; T rivella et al., 2023b] to comm unit y c hoice aggregation programs that enable collectiv e participation in green p o wer markets [O’Shaughnessy et al., 2019]. As the generation mix shifts to ward higher shares of renewable energy , utilities must finance distribution reinforcement, grid mo dernization, adv anced con trol technologies, and lo cal storage or flexibility resources needed to maintain system reliability Das et al. [2018]. Existing renew able procurement mec hanisms suc h as RECs and PP As generally do not pro vide a transparen t framew ork for recov ering these system-level costs Jenkins and Perez-Arriaga [2017]. By con trast, a centralized VRP mec hanism administered b y utilities can translate volun tary consumer demand in to renew able procurement decisions while simultaneously accounting for the full economic cost of renew able electricit y supply . In this wa y , VRPs hav e the p oten tial to provide scalable, system-wide co verage that aligns consumer willingness to pa y with b oth renewable generation expansion and 3 T able 1: Survey of volun tary renew able electricit y programs and customer price premiums. Pro vider / Program Premium (USD/kWh) Notes Austin Energy GreenChoice (Residen tial) Austin Energy [2026] 0.0075 Simple fixed premium added to the re- tail electricity rate for customers select- ing a 100% renewable supply option. Dominion Energy Green Po w er (100% Option) Dominion Energy [2026a] 0.012 Example program charge equiv alent to $ 12 p er mon th for a household consum- ing 1000 kWh. Dominion Energy Rider TRG (100% Renewable) Dominion Energy [2026b] 0.0136 Premium component em b edded within a tariff rider structure rather than a standalone surcharge. Georgia Po w er Simple Solar Georgia Po w er [2026] 0.0125 Solar REC matching program where customers pay a fixed premium to sup- p ort renew able generation. Xcel Energy Renew able Connect Flex Xcel Energy [2026] 0.015 Subscription-based renew able pro cure- men t program priced at $ 1.50 p er 100 kWh blo c k of consumption. P ortland General Electric Green F uture Choice P ortland General Electric [2026] 0.0094 a Premium applies to the volun tary re- new able p ortion of electricit y consump- tion beyond the renewable share al- ready included in the default utilit y mix. Natic k Communit y Elec- tricit y (Comm unity Choice Pro- gram, Ev ersource service territory) Massac husetts Communit y Electricit y Aggregation [2024] 0.0226 100% renew able option priced at 16.32 ¢ /kWh compared with 14.06 ¢ /kWh for the standard renew- able plan, implying a premium of ab out 2.26 ¢ /kWh. a The Green F uture Choice program purchases renewable energy certificates to match the non-mandated p ortion of customer electricity consumption. 4 the infrastructure in vestmen ts required to sustain a high-renewable p o wer system. Another k ey adv antage of VRP compared to REC and PP A is that it pro vides a standardized pro duct and translates consumer demand for clean electricity into credible price signals and sus- tained renew able deplo yment. T able 1 summarizes a surv ey of utility volun tary renewable electricit y programs and their asso ciated customer price premiums, sho wing that a full renew able electricity plan imp oses a price premium ranging from 0.75 cen ts to 2.2 cents per kilow att hour. The v ariation in suc h pricing premiums can b e grounded in factors including geographical dep enden t renewable abundance, existing renew able capacit y , reven ue allo cation, and program p erformance. 1.3 Researc h Gap and P ap er Con tribution A gro wing empirical literature examines v olun tary demand for renew able electricit y and consumers’ willingness to pa y for green p o w er pro ducts. Early surv ey-based studies do cumen t positive willing- ness to pa y for renew able electricity among residen tial consumers F arhar [1999], while subsequen t meta-analyses and exp erimen tal studies estimate the magnitude and determinants of these premi- ums across different mark ets Andor et al. [2018]; Sundt and Rehdanz [2014]. More recent w ork also examines volun tary renew able pro curement b y corp orations and other large electricit y consumers as an emerging driver of renew able deploymen t O’Shaughnessy et al. [2021a]; T rivella et al. [2023a]. Y et, the exact systematic in teraction among these factors in the pricing decision remains po orly understo od. In particular, we lac k analytical frameworks that join tly characterize ho w volun tary demand translates in to renew able credit pricing, how the resulting reven ues are allo cated within the electricity system, and how these mechanisms influence long-run renewable capacit y expansion. This gap is particularly imp ortant in utility-operated renewable programs, where pricing deci- sions m ust simultaneously reflect consumer willingness to pa y , renewable generation costs, and the system-lev el costs of in tegrating in termittent resources. This underscores the need for an analytical framew ork that jointly characterizes renew able-credit pricing for the program, rev enue allocation, and capacity expansion within a realistic utilit y setting. Building on these trends, this paper dev elops a theoretical framework for pricing volun tary renew able programs and allo cating the resulting reven ue b et w een renewable expansion and system in tegration costs. W e form ulate a m ulti-p eriod optimization mo del in whic h a utilit y sets renew able program prices and allo cates reven ues to supp ort renew able deploymen t while satisfying financial feasibilit y constraints. Our analysis yields closed-form c haracterizations of optimal pricing policies and reven ue-sharing rules, and shows that a simple my opic expansion policy can achiev e the long- run optimum. W e further demonstrate that VRPs can substantially expand renew able penetration but, by themselv es, cannot deliver full decarb onization, highligh ting the need for complemen tary p olicy instrumen ts. T ogether, these results pro vide analytical insigh ts into how v olun tary renew able demand can b e translated into credible price signals and effectiv e renewable deplo yment in realistic utilit y settings. 2 Mo del and Problem F orm ulation 2.1 F ramework W e adopt the p ersp ectiv e of an electric p o wer utilit y that offers VRP options to its customers and uses the resulting program reven ue to support in vestmen t in renew able generation. W e consider a b enev olen t utilit y whose ob jectiv e is to maximize renew able capacity expansion while main taining strict financial feasibility . Let the initial renew able capacit y in the utilit y’s generation portfolio be denoted by Q 0 . 5 The planning horizon is a finite discrete set of time p eriods T = { 1 , 2 , . . . , n } , where eac h p eriod represen ts one decision stage (e.g., a financial year). Notation used throughout the form ulation and in subsequent figures is summarized in T able 2. W e first presen t a baseline formulation in which all financial flows are ev aluated on a single inte gr ate d b alanc e she et . This formulation corresp onds to a v ertically in tegrated b enc hmark in whic h the utility in ternalizes b oth system-lev el costs and generation-level net costs. The purp ose of this benchmark is to isolate the fundamen tal pricing and expansion incen tiv es of the program. In Section 5, we will relax this assumption and explicitly rein tro duce reven ue allo cation across utility and indep enden t pow er producers. W e start with formulating the optimal VRP pricing problem as a multi-perio d optimization problem. In each p eriod t , giv en the curren t renew able capacity Q t , the utility chooses the VRP price p t and capacit y addition q t . Define the per-p erio d VRP rev enue based on the demand function D : R ( p t , Q t ) := p t D p t e ( Q t ) . The term p t /e ( Q t ) conv erts the electricity premium into an effectiv e abatemen t price. Since p t is measured in $ /kWh and e ( Q t ) in ton-CO 2 /kWh, the ratio has units of $ /ton-CO 2 , reflecting that VRP demand is driven b y the cos t of emissions reduction pro vided by renew able pro curement. F urther details on the demand sp ecification are pro vided in Section 2.2. All other costs b orne by the vertically integrated utilit y , excluding renewable in vestmen t, are summarized by the non-investment p er-perio d cost term C ( Q t ) := C S ( Q t ) + C R ( Q t ) − f ( Q t ) π ( Q t ) , so that the total p er-p eriod financial requirement is given b y C ( Q t ) + k t q t , where k t is the unit expansion cost in p erio d t . The underlying components are summarized in T able 2. The multi-perio d optimization problem is: max { p t , q t } t ∈T X t ∈T q t (1a) s.t. D p t e ( Q t ) ≤ f ( Q t ) , ∀ t ∈ T (1b) C ( Q t ) + k t q t ≤ p t D p t e ( Q t ) , ∀ t ∈ T (1c) Q t +1 = Q t + q t , Q 1 giv en (or Q 0 ) , ∀ t ∈ T \ { max T } (1d) q t ≥ 0 , p t ≥ 0 , ∀ t ∈ T . (1e) The utility c hannels reven ue from VRP customers into additional renew able deplo yment. Ac- cordingly , its fundamental ob jective (1a) is to maximize cumulativ e renewable capacit y additions o ver the planning horizon, sub ject to reven ue adequacy in each p eriod. Although written as an inequalit y to reflect budget feasibilit y , the financial constrain t (1c) will bind whenever the optimal solution exhibits strictly p ositiv e expansion q t > 0. The optimization problem is sub ject to the following constrain ts: • Renew able-program feasibilit y (1b): The total renew able credits sold b y the program, D ( p t /e ( Q t )), must not exceed the amoun t of delivered renew able electricity , f ( Q t ). This ensures that credit sales are bac ked by usable renew able generation after accoun ting for curtailmen t and saturation effects (T able 2). 6 • In tegrated financial feasibility (1c): P er-p eriod VRP rev en ue R ( p t , Q t ) = p t D ( p t /e ( Q t )) m ust co v er the integrated net cost of op erating and expanding renewable capacit y . T o preserv e the economic interpretation used later under separated financial accounts, w e further decomp ose left-hand side in to tw o comp onents: (i) the system/pr o gr am c ost C S ( Q t ) + k t q t , b orne b y the program op erator (e.g., integration, balancing, and administration), and (ii) the gener ation-side net c ost C R ( Q t ) − f ( Q t ) π ( Q t ), representing renew able op erating costs net of wholesale energy-mark et reven ue. This decomposition is not needed for the in tegrated b enc hmark, but it becomes essential in Section 5, where these comp onen ts are ev aluated on separate balance sheets. Detailed definitions and units are summarized in T able 2. • Capacit y state transition (1d): Renewable capacit y evolv es according to capacit y accum u- lation, so that cum ulative capacit y in p eriod t + 1 equals the previous lev el plus new additions. Capacit y retiremen ts are not mo deled. • F easibilit y b ounds (1e): Decision v ariables are restricted to nonnegativity: q t ≥ 0 and p t ≥ 0. W e restrict the utilit y’s decisions to b e strictly financially feasible in each p erio d, relying solely on volun tary demand for renew ables. Under this formulation, neither the utility nor renew able generators incur losses, and no intertemporal b orrowing or banking of funds is p ermitted. This profit-neutral, p erio d-b y-p erio d feasibility condition reflects standard regulatory and accounting constrain ts faced by utilities and pro vides a transparen t benchmark for subsequent analysis. 7 T able 2: Mo del Elements and Notation Sets and indices T = { 1 , 2 , . . . , n } Discrete planning horizon (e.g., years). t ∈ T Time p erio d index. Decision v ariables p t ≥ 0 VRP price (low-carbon electricity premium) in pe- rio d t ( $ /MWh). q t ≥ 0 Renew able capacit y addition in p erio d t (MW). State and transition Q t Cum ulative installed renew able capacity at the end of p erio d t (MW). Q t = Q t − 1 + q t Capacit y state transition; Q 0 is given. Exogenous elemen ts e ( Q t ) ≥ 0 System marginal emissions in tensity under renew- able capacity Q t (ton-CO 2 /MWh). f ( Q t ) ≥ 0 Deliv ered (usable) renewable electricit y as a function of capacit y Q t , capturing curtail- men t/saturation effects (MWh). π ( Q t ) Effectiv e marginal wholesale v alue receiv ed b y re- new able generators given Q t ( $ /MWh). Demand D p t e ( Q t ) VRP demand as a function of the effective carbon price p t /e ( Q t ) ( $ /ton-CO 2 ). D ( x ) = M e − ϵx Baseline demand specification; M is mark et size and ϵ > 0 is demand sensitivit y . Cost elemen ts C R ( Q t ) ≥ 0 Renew able op erating/sustaining cost under capac- it y Q t . C S ( Q t ) ≥ 0 System in tegration/program cost under capacit y Q t . k t ≥ 0 Unit inv estment cost of new renew able capacity in p eriod t ( $ /MW). 8 2.2 VRP Demand for Renew able Demand for volun tary renewable programs (VPRs) arises from entities that are not legally obli- gated to pro cure renew ables but c ho ose to do so for strategic, reputational, or market reasons. Large tec hnology companies suc h as Microsoft, Amazon, and Go ogle purchase renewable cred- its to demonstrate environmen tal leadership and enhance brand v alue Egli et al. [2023]. Certain industrial pro ducers—suc h as emerging green hydrogen pro jects R¨ op er et al. [2025]—seek renew- able pro curemen t to qualify for subsidies, partnerships, or market differentiation. Man y utilities also offer renewable p ow er options to residential and commercial customers Dagher et al. [2017], while green-building certification programs establish standards that incen tivize renewable energy use Agarwal et al. [2024]. Collectiv ely , these v olun tary buy ers constitute the demand base that sustains the program. Condition 1. The demand for renewable follows an exp onential form: D p e ( Q ) = M exp − ϵ p e ( Q ) , (2) where M denotes the total p oten tial market size at zero premium, ϵ > 0 is a demand sensitivity parameter, and e ( Q ) is the grid-a verage emissions intensit y giv en cum ulativ e renew able capacit y Q (ton-CO 2 /MWh). Imp ortan tly , the functional form of demand is assumed to b e time-inv arian t. Any temp oral v ariation arises endogenously through changes in the state v ariable Q , rather than through explicit time dep endence of preferences or market size. This formulation isolates the effect of renewable p enetration on the emissions baseline—and hence the effectiv e carbon-price signal faced b y buy- ers—while abstracting from exogenous macroeconomic or so cial sho c ks. The exp onen tial sp ecification in equation (2) is supp orted b y empirical evidence showing that v oluntary demand for renew able declines in a strongly conv ex manner with resp ect to price. F or instance, Andor et al. [2018] applied a linear approximation to a decreasing con vex demand; Mewton and Cacho [2011] estimated a constan t-elasticity (p o wer-la w) demand function D = ap β with β = − 0 . 96, indicating nearly unitary elasticity; and F arhar [1999] and Sundt and Rehdanz [2014] rep orted exp onen tial or semi-log relationships betw een renewable uptake and price. The in tuition for adopting the exp onential form is threefold. First, when the renewable premium is zero ( p = 0), all p oten tial buyers are willing to participate the program, yielding D (0) = M , the full market size. Second, b ecause demand is v oluntary rather than mandated, demand approac hes zero as the effective carb on price increases indefinitely , i.e., lim p →∞ D p e ( Q ) = 0 . Third, the exp onen tial function captures the empirically observed rapid, con vex decline in will- ingness to pay as prices rise. T ogether, these prop erties make the exp onen tial sp ecification b oth b eha viorally intuitiv e and empirically well supp orted for modeling VRP demand. The term e ( Q ) in the denominator of equation (2) represents the a verage emissions intensit y of the p o w er grid (ton-CO 2 /MWh) giv en the existing renewable capacit y Q . VRP buy ers seek to differen tiate their electricity consumption from this grid av erage. When the grid av erage reac hes zero—corresp onding to a fully decarb onized or net-zero system—VRP demand v anishes b ecause no additional emissions b enefit remains from purchasing renew able through the program. Dividing the premium price p (in $ /MWh) b y e ( Q ) normalizes the renew able premium into an effectiv e carb on price (in $ /ton-CO 2 ). In this sense, VRP demand is driven b y the p erceived 9 v alue of av oided emissions, and the normalization p/e ( Q ) translates the renewable premium into the implicit carbon-price signal faced b y buyers. 2.3 Grid Prop erties with Renewable Penetration As the penetration lev el of renew ables increases, the pow er grid undergo es fundamental structural c hanges. On the one hand, a higher share of renew able generation low ers the system’s av erage emissions intensit y by displacing fossil generation. On the other hand, growing p enetration leads to greater curtailmen t of renewable output, as exemplified b y the well-kno wn “duck curv e” phe- nomenon observed in California Denholm et al. [2015b]. At the same time, the effectiv e energy v alue received by renew ables from the wholesale p o wer market diminishes Hirth [2013b], since re- new ables frequently bid at zero or negative prices. These general trends motiv ate the functional prop erties w e impose on the grid as a function of cum ulative renew able capacit y Q . Condition 2. W e assume the follo wing grid functional prop erties with resp ect to renew able ca- pacit y (or p enetration level) Q : 1. Grid-a verage emissions in tensity e ( Q ) is decreasing: e ′ ( Q ) < 0 . 2. Deliv ered renewable electricit y f ( Q ) is increasing and concav e: f (0) = 0 , f ′ ( Q ) > 0 , f ′′ ( Q ) < 0 . 3. Effectiv e marginal wholesale v alue received b y renewables π ( Q ) is decreasing: π ′ ( Q ) < 0 . The first tw o assumptions in Condition 2 reflect the role of curtailmen t as renew able penetration increases. Expanding renewable capacity displaces fossil generation and therefore reduces av erage grid emissions intensit y , justifying e ′ ( Q ) < 0. A t the same time, increasing p enetration leads to gro wing curtailment, so that the amount of renew able electricit y that can b e effectively deliv ered increases at a diminishing rate, reflected by f ′ ( Q ) > 0 and f ′′ ( Q ) < 0. The monotonicit y of the emissions-intensit y function and the concavit y of the delivery function capture saturation effects in both emissions reductions and usable renewable output. Consider solar photo voltaic generation as an example. Solar output is limited to dayligh t hours, with no pro duction at nigh t. As additional solar capacit y is installed, there is a maximum fraction of total load that can b e serv ed without storage. The marginal usable output from renewables saturates as curtailment grows, motiv ating conca vity in f ( Q ). While grid in vestmen ts such as storage and transmission can mitigate these effects, they are not exp ected to rev erse the o verall trends of increasing curtailment and diminishing marginal impact at higher penetration lev els. The decreasing trend of the effectiv e marginal price π ( Q ) is less immediate but equally imp or- tan t. This function does not represen t the system-wide a v erage wholesale price. Instead, it reflects the a verage price received by renew able generators during p eriods when they pro duce. Under the duc k curve phenomenon, p erio ds of high renew able output—such as midday hours for solar—are asso ciated with suppressed wholesale prices. As renewable p enetration increases, these low-price p eriods b ecome more frequent and pronounced, reducing the av erage marginal reven ue earned by renew ables. Although high-price p erio ds ma y still o ccur (e.g., during ev ening ramps), renewable generators cannot fully capture these price spikes due to limited output. This gradual erosion of wholesale-mark et rev enues pro vides the cen tral motiv ation for supplemen ting renewable generators’ income with credit-based reven ues. 10 2.4 Utilit y No-Banking Condition In regulated electricit y markets, utilities generally op erate under cost-of-service or other profit- neutral regulatory framew orks. Because electricity deliv ery is a natural-monop oly service, utilities are typically gov ernment-o wned, nonprofit, or priv ately o wned but sub ject to strict regulation that limits earnings to approv ed cost recov ery and an authorized return [Borenstein, 2016; Josko w, 2008]. In this setting, utilities cannot use VRPs to accum ulate discretionary profits; the role of the program is instead to recov er eligible costs and supp ort renew able expansion at current decision p eriod. This motiv ates our formulation in whic h the utility’s decision problem is constrained b y p er-perio d financial feasibilit y , while the ob jectiv e is to maximize renew able capacit y expansion. Condition 3. (No intertemp or al b anking) F or eac h p erio d t ∈ T , all financial and deliv ery condi- tions m ust be satisfied within the perio d. Neither monetary surpluses/deficits nor renew able credits ma y be carried across perio ds. In particular: 1. Inte gr ate d p er-p erio d r evenue ade quacy: C ( Q t ) + k t q t ≤ R ( p t , Q t ) , ∀ t ∈ T , so that all eligible non-in vestmen t costs and current-perio d expansion costs m ust b e co v ered b y con temp oraneous VRP rev enue, no banking or b orrowing rev enue is allow ed. 2. Cr e dit-sales fe asibility (p er-p erio d): D p t e ( Q t ) ≤ f ( Q t ) , ∀ t ∈ T . Th us, credits sold in perio d t m ust b e bac ked by renewable electricit y delivered in the same p eriod; no banking or b orro wing of credits is allo w ed. Condition 3 captures t wo core features of regulated utilit y finance. First, the VRP administered b y utilit y is pr ofit-neutr al : VRP rev enues serv e cost reco very rather than discretionary profit accu- m ulation, so the relev ant ob jective is renew able expansion rather than profit maximization. Second, feasibilit y is imp osed on a no-b anking basis: neither financial surpluses/deficits nor renewable cred- its may b e carried across time. This reflects the regulatory structure of utility business models, in whic h program rev enues must remain tied to contemporaneous cost reco very and delivered service. The formulation is therefore institutionally grounded and regulatory-consistent. 11 3 Single-P erio d Analysis: In tegrated Utilit y Benchmark In this section, we analyze a single-p eriod b enc hmark in whic h the electric utility is vertically inte- grated, meaning that generation, system op eration, and program administration are consolidated within a single firm and ev aluated on a single financial balance sheet. V ertically integrated utilities reco ver b oth generation-related costs and system-lev el costs through regulated tariffs under cost- of-service or profit-neutral regulation, and therefore internalize the full economic tradeoff b etw een pricing the renewable and expanding capacity . This business mo del remains prev alent in large parts of the United States—particularly in the Southeast and Midw est—where inv estor-owned and public utilities con tinue to operate as v ertically integrated monop olies rather than participating in fully restructured wholesale markets (see, e.g., Borenstein [2016]; Josk o w [2008]). Mo deling the utility as v ertically in tegrated allo ws us to form ulate a single-p erio d optimization problem with a single financial feasibility constraint, which captures total system and generation costs in aggregate. This benchmark serves tw o purp oses. First, it delivers sharp analytical results for optimal pricing and capacit y expansion in a static setting. Second, it establishes a clean reference p oin t for later sections, where we relax the in tegrated balance-sheet assumption to study rev enue sharing across separate financial accoun ts and extend the analysis to multi-perio d settings in which m yopic single-p eriod decisions can be sho wn to b e globally optimal under suitable conditions. 3.1 Reduction from Multi-P erio d to Single-P erio d F ormulation W e consider a single p erio d as a temp orally neutral represen tation of the m ulti-p erio d mo del. Because the profit-neutral regulatory condition enforces feasibilit y indep enden tly in each p eriod, the optimization problem in every p erio d t ∈ T can b e solved separately , with in tertemp oral link age arising only through the capacit y state transition Q t +1 = Q t + q t . Hence, the single-p erio d form ulation corresponds to the optimization problem faced by the utilit y in an y generic perio d, giv en the existing renewable capacit y Q . Dropping time subscripts mak es the analysis applicable to all perio ds. T o streamline notation, define (i) the per-p erio d VRP reven ue R ( p, Q ) := p D p e ( Q ) , and (ii) the integrated non-in vestmen t cost term C ( Q ) := C S ( Q ) + C R ( Q ) − f ( Q ) π ( Q ) , so that the in tegrated financial requirement is C ( Q ) + k q , where k is the unit inv estmen t cost in the p erio d under consideration. 1 The utilit y’s ob jective is to maximize the incremental renew able capacit y q , sub ject to con tem- p oraneous renew able deliv erability and an in tegrated financial feasibilit y constrain t. The resulting single-p eriod problem is: max p,q q (3a) s.t. D p e ( Q ) ≤ f ( Q ) , (3b) C ( Q ) + kq ≤ R ( p, Q ) , (3c) q ≥ 0 , p ≥ 0 . (3d) 1 All primitives and units are summarized in T able 2. 12 This single-perio d problem captures the core decision en vironment of the program under a v erti- cally integrated b enchmark: given the system state Q and market primitives { D ( · ) , e ( · ) , f ( · ) , π ( · ) , C R ( · ) , C S ( · ) , k } , the utilit y determines the premium price p and renew able expansion q that jointly satisfy feasibilit y and financial balance within the same p erio d. 3.2 Phase Structure of the In tegrated Single-P erio d Solution Theorem 1 c haracterizes the unique optimal price for a given system state Q . Theorem 1 (Single-P erio d Optimal Pricing) . If the optimal solution exhibits strictly p ositiv e expansion q ∗ ( Q ) > 0, then the optimal price p ∗ ( Q ) exists, is unique, and is given b y the follo wing t wo-regime closed form: p ∗ ( Q ) = e ( Q ) ϵ , if D 1 ϵ ≤ f ( Q ) , e ( Q ) ϵ ln M f ( Q ) , if D 1 ϵ > f ( Q ) . (4) Intuition and sketch of pr o of. The single-perio d optimization problem admits a transparen t decision logic. Although the utilit y’s ob jective is to maximize incremen tal renew able capacity q , expansion is constrained en tirely by contemporaneous program reven ue. As a result, the problem can b e decomp osed in to three steps. First, for a giv en renew able capacit y Q , the utility chooses the program price p to maximize rev enue R ( p, Q ), sub ject to the deliverabilit y constraint that program sales cannot exceed deliv ered renew able output. This step is indep enden t of costs and the expansion decision and determines the maximal reven ue that can b e extracted from the v olun tary demand market. Second, the in tegrated financial constraint requires that rev enue co ver the fixed cost term C ( Q ). When the financial constraint binds, any residual reven ue beyond C ( Q ) b ecomes av ailable for capacit y expansion. Third, residual reven ue is conv erted one-for-one into renewable capacity through the linear in vestmen t cost k , yielding a unique expansion lev el q ∗ . Corollary 1 (Single-p erio d expansion under the optimal price) . Giv en the optimal price p ∗ ( Q ) in Theorem 1, the optimal expansion lev el is determined by the binding integrated financial constrain t: q ∗ ( Q ) = R p ∗ ( Q ) , Q − C ( Q ) k . (5) Intuition and sketch of pr o of. Substituting the closed-form p ∗ ( Q ) from (4) yields an explicit expression for q ∗ ( Q ) in eac h regime. This reduction implies that the equilibrium price is c haracterized by the reven ue-maximizing solution, p ossibly adjusted by the binding renew able deliv erability constrain t. The resulting price admits the closed form in (4), establishing uniqueness. Giv en this price, q ∗ follo ws immediately from (5). The formal argumen t follows from analyzing the Karush–Kuhn–T uck er (KKT) conditions, pro vided in App endix A. Corollary 2 (Optimal Price Decreases with Renew able Capacit y) . Supp ose the demand sensitivit y parameter ϵ is fixed. Since the optimal price satisfies p ∗ ( Q ) ∝ e ( Q ) and the grid-av erage emissions in tensity e ( Q ) is strictly decreasing in cum ulative renew able capacity Q , it follo ws that p ∗ ( Q ) decreases monotonically with Q . 13 Although the pro of is immediate, the economic implication is significant. When renewable p enetration is lo w (small Q ), the equilibrium premium p ∗ is high, meaning that each unit of renew able electricity can command a substan tial pa yment. This highligh ts the cen tral role of VRP mark ets in supp orting early-stage renewable deplo ymen t: high premiums provide strong financial incen tives for initial capacit y expansion. As cumulativ e renewable capacity increases and emissions in tensity declines, the optimal pre- mium falls. Consequen tly , the marginal financial supp ort pro vided b y the VRP demand diminishes with scale. This result formalizes a widely observed real-w orld pattern: v olun tary renewable pro- grams are most effective during early phases of decarb onization, while their influence naturally atten uates as the system approac hes lo w-emissions intensit y . While our baseline assumes exp onen tial demand in the scaled premium p/e ( Q ), the core single- p eriod result do es not dep end on this sp ecific functional form. Prop osition 1 replaces the closed- form exp onen tial sp ecification with a generic p er-p erio d reven ue function R ( p, Q ), requiring only con tinuit y in p and the natural market condition R ( p, Q ) → 0 as p → ∞ . Detailed implications see Section 7. Prop osition 1 (General Pricing Reduction) . Let P ( Q ) ⊆ [0 , ∞ ) denote a nonempt y closed feasible price set, and let R : [0 , ∞ ) × R + → R + denote p er-p eriod VRP reven ue. Assume: (A1) ( Continuity ) p 7→ R ( p, Q ) is contin uous on P ( Q ); (A2) ( V anishing r evenue at high pric es ) lim p →∞ R ( p, Q ) = 0; If the optimal solution of the single-p erio d problem satisfies q ∗ ( Q ) > 0, then optimal pricing maximizes reven ue, p ∗ ( Q ) ∈ arg max p ∈P ( Q ) R ( p, Q ) , Intuition and sketch of pr o of. Fix Q . Because R ( · , Q ) is con tinuous on the nonempty closed set P ( Q ) ⊆ [0 , ∞ ) and lim p →∞ R ( p, Q ) = 0, the rev enue maximization problem max p ∈P ( Q ) R ( p, Q ) attains at least one maximizer (the v anishing tail implies no maximizing sequence can escap e to infinit y). In the single-p eriod expansion problem, price affects feasibilit y only through the av ailable rev enue R ( p, Q ), while the ob jective is to maximize q . When q ∗ ( Q ) > 0, the financial constraint m ust bind; thus maximizing q is equiv alent to maximizing R ( p, Q ) o v er feasible prices. Hence an y optimal solution selects p ∗ ( Q ) ∈ arg max p ∈P ( Q ) R ( p, Q ). 3.3 Long-Run Capacit y Limit and Mark et-Driv en Equilibrium Ha ving characterized the optimal single-p eriod pricing and expansion p olicy , we now turn to the long-run implications of the VRP program. The final regime corresponds to a no-expansion equilib- rium, where the optimal expansion decision satisfies q ∗ ( Q ) = 0. Conceptually , this state represents the maximum achievable imp act of a volun tary , market-driv en renew able expansion mechanism: all financially viable lo w-carb on capacity has b een deplo yed, and further expansion ceases because program reven ues are exactly exhausted b y system costs. Recall that under the in tegrated formulation, the optimal single-p eriod expansion is giv en b y q ∗ ( Q ) = R ( Q ) − C ( Q ) k , The long-run capacit y limit is therefore c haracterized b y the stopping condition q ∗ ( Q ) = 0 ⇐ ⇒ C ( Q ) = R ( Q ) = p ∗ ( Q ) D ( p ∗ e ( Q ) ) ′ = M e ϵ e ( Q ) . 14 Theorem 2 (Existence and uniqueness of the long-run capacity limit) . Assume there exists Q † suc h that the deliv erability constraint 3b is non-binding for all Q ≥ Q † . Supp ose: • C ( Q ) is strictly increasing for all Q ≥ Q † and lim Q →∞ C ( Q ) = + ∞ ; • C ( Q † ) ≤ M e ϵ e ( Q † ) to ensure financial feasibilit y at C ( Q † ). Then there exists a unique Q ∗ ≥ Q † suc h that q ∗ ( Q ∗ ) = 0. Moreo ver, Q ∗ is uniquely characterized b y the equation C ( Q ) = M e ϵ e ( Q ) . (6) Intuition and sketch of pr o of. F or sufficiently large Q (in particular, for Q ≥ Q † ), the deliver- abilit y constrain t do es not bind, and the optimal price is given by p ∗ ( Q ) = e ( Q ) ϵ , yielding R ( Q ) = p ∗ ( Q ) D p ∗ ( Q ) e ( Q ) = M e ϵ e ( Q ) . A t the no-expansion equilibrium, program reven ue must exactly co ver total net cost, implying R ( Q ) = C ( Q ). Because C ( Q ) is strictly increasing while e ( Q ) (and hence R ( Q )) is strictly decreas- ing in Q , the tw o curv es intersect at most once. Existence follows from the b oundary conditions C ( Q † ) ≤ R ( Q † ) and lim Q →∞ C ( Q ) = + ∞ , whic h guaran tee a unique in tersection by the interme- diate v alue theorem. Prop osition 2 (Non-v anishing emissions at the long-run limit) . At the long-run capacit y limit Q ∗ , the grid emissions in tensit y satisfies e ( Q ∗ ) > 0. Pr o of sketch. If e ( Q ∗ ) = 0, then p ∗ ( Q ∗ ) = 0 and hence R ( Q ∗ ) = 0. Since C ( Q ) ≥ 0 and is strictly p ositiv e for nontrivial systems, the equalit y R ( Q ∗ ) = C ( Q ∗ ) cannot hold. Therefore, e ( Q ∗ ) > 0. Interpr etation. The equilibrium Q ∗ represen ts the long-run c ap acity limit attainable through v oluntary renew able program markets alone. Because e ( Q ∗ ) > 0, the system do es not reac h full decarb onization at this limit: residual emissions p ersist even when all market-driv en expansion opp ortunities are exhausted. This establishes a fundamental b oundary for volun tary mec hanisms and highligh ts the necessit y of complemen tary regulatory or p olicy interv entions to ac hieve net-zero outcomes. Corollary 3 (Market-driv en nature of the long-run capacit y limit) . The equilibrium capacit y Q ∗ dep ends on mark et parameters ( M , ϵ ) and structural system prop erties ( C, e, f , π ), but is indep en- den t of the renew able deplo yment cost parameter k . Interpr etation. The deploymen t cost k affects only the sp e e d of expansion—i.e., the magnitude of q ∗ ( Q ) when q ∗ ( Q ) > 0—but not the terminal capacity lev el Q ∗ . A larger market size C or low er demand sensitivity ϵ increases the attainable equilibrium capacity , whereas c hanges in k merely rescale the rate at whic h the system approaches this limit. 4 Multi-P erio d Analysis and Optimalit y of My opic P olicies Ha ving characterized the single-p eriod problem and its KKT structure, w e now return to the m ulti- p eriod setting in whic h renew able capacity accum ulates ov er time. Let Q t denote the installed renew able capacit y at p eriod t . Let Q init := Q 0 denote the initial renew able capacity . F or a utilit y op erating under profit-neutral regulation, new renew able builds are added to an aggregate capacity sto c k and operated collectiv ely . 15 Remark 1 (Mark ovian structure and profit-neutral regulation) . The system admits a Mark ovian structure b ecause both the state transition and the p er-perio d feasibility constrain ts dep end only on the curren t capacit y state Q t . Giv en the transition rule Q t +1 = Q t + q t and a p er-perio d stage cost of − q t , the pro cess { Q t } t ≥ 0 forms a con trolled Marko v pro cess: feasi- bilit y and pay offs at time t dep end on past decisions only through Q t . Imp ortan tly , this Marko vian prope rt y is reinforced by the pr ofit-neutr al, no-b anking r e gulation in tro duced earlier. Because b oth r evenue ade quacy and r enewable deliver ability must hold within eac h p erio d, no additional state v ariables (such as accum ulated monetary surplus/deficit or banked credits) carry o ver across perio ds. As a result, the system’s in tertemp oral dynamics are go verned en tirely b y the ph ysical state v ariable Q t , with no intertemporal financial coupling. 4.1 My opic P olicy Optimality under Monotone Reac habilit y W e no w analyze the m ulti-p erio d deploymen t problem directly through the evolution of the capacit y state. Let ¯ q ( Q ) := max n q ≥ 0 : ∃ p ≥ 0 such that D p e ( Q ) ≤ f ( Q ) , C ( Q ) + k q ≤ R ( p, Q ) o denote the maximal feasible one-step expansion at state Q . Define the asso ciated reac habilit y map S ( Q ) := Q + ¯ q ( Q ) . (7) The my opic p olicy is defined by q my o t = min { ¯ q ( Q t ) , Q ⋆ − Q t } , that is, at each perio d the utility expands to the maximal feasible lev el without exceeding the terminal capacity Q ⋆ . Theorem 3 (Myopic policy optimalit y under monotone reachabilit y) . Assume feasible p olicies satisfy 0 ≤ q t ≤ Q ⋆ − Q t ( No overbuild ) and the mapping S ( Q ) = Q + ¯ q ( Q ) is non-decreasing on [ Q init , Q ⋆ ) ( Monotone r e achability ). Then the my opic p olicy is global optimal, weakly dominates an y feasible p olicy P : Q my o t ≥ Q P t (8) Pr o of sketch. Consider an y feasible p olicy P and compare the capacit y tra jectory it generates with that of the my opic p olicy . The goal is to sho w that the m yopic tra jectory w eakly dominates the tra jectory generated by any feasible p olicy , in the sense that renewable capacit y under the m yopic p olicy is alw ays at least as large as that under P until the terminal capacity Q ⋆ is reac hed. F ormally , w e establish b y induction that Q my o t ≥ Q P t for all t prior to hitting Q ⋆ . (9) W e b egin with the initial perio d. At t = 0, b oth tra jectories start from the same initial capacit y lev el, so that Q my o 0 = Q P 0 = Q init . Th us the dominance relation holds trivially at the starting p oin t. 16 Next consider an arbitrary p eriod t and supp ose that the dominance condition holds at that p eriod, i.e., Q my o t ≥ Q P t , while the my opic tra jectory has not yet reac hed the terminal level Q ⋆ . W e now examine how the t w o policies ev olve to p eriod t + 1. Because p olicy P is feasible, the expansion decision q P t cannot exceed the maximal feasible expansion at the curren t state Q P t . By definition of ¯ q ( · ), this implies Q P t +1 = Q P t + q P t ≤ Q P t + ¯ q ( Q P t ) = S ( Q P t ) , where S ( Q ) = Q + ¯ q ( Q ) denotes the maximal reac hable capacit y in one step from state Q . The m yopic policy , by construction, expands to the largest feasible level in each p eriod sub ject to the upper b ound Q ⋆ . Therefore its state transition satisfies Q my o t +1 = min { S ( Q my o t ) , Q ⋆ } . The key step follo ws from the induction h yp othesis together with the monotonicit y of the reac hability function S ( · ). Since Q my o t ≥ Q P t and S ( · ) is nondecreasing, we obtain S ( Q my o t ) ≥ S ( Q P t ) . Com bining this inequality with the previous b ounds yields Q my o t +1 ≥ min { Q P t +1 , Q ⋆ } . Consequen tly , as long as the tra jectory under p olicy P has not yet reac hed the terminal capacity (i.e., Q P t +1 < Q ⋆ ), it follo ws that Q my o t +1 ≥ Q P t +1 . This establishes the induction step and shows that the m yopic tra jectory weakly dominates an y feasible tra jectory un til the terminal capacit y Q ⋆ is reached. 4.2 Implications of My opic Optimalit y W e no w state tw o immediate consequences of Theorem 3. Both follow directly from the statewise dominance prop ert y established in the pro of. Corollary 4 (Minim um hitting time) . Under the assumptions of Theorem 3, the m yopic p olicy reac hes the terminal capacit y lev el Q ⋆ in the few est perio ds among all feasible policies. Pr o of sketch. By statewise dominance, Q my o t ≥ Q P t for all t prior to hitting Q ⋆ . Therefore, if a feasible p olicy P reac hes Q ⋆ at time T , the m yopic tra jectory m ust satisfy Q my o T ≥ Q P T ≥ Q ⋆ , implying that the my opic p olicy reac hes Q ⋆ no later than T . □ Corollary 5 (Minimum cumulativ e emissions) . If the emissions in tensit y function e ( Q ) is nonin- creasing in Q , then among all feasible p olicies the my opic p olicy minimizes cumulativ e emissions up to the hitting time of Q ⋆ . Pr o of sketch. F rom statewise dominance, Q my o t ≥ Q P t prior to hitting Q ⋆ . Since e ( Q ) is nonincreasing, it follows that e ( Q my o t ) ≤ e ( Q P t ) p eriod by perio d. Summing ov er time yields weakly lo wer cum ulative emissions under the my opic p olicy . □ 17 P olicy significance. Theorem 3 and its corollaries deliv er a simple op erational rule for a utilit y op erating under profit-neutral regulation: build to the maximum fe asible level e ach p erio d . Pricing decisions need only ensure feasibility of this maximal build; no intertemporal smo othing or long- horizon forecasting is required. In practice, this shifts managerial fo cus from solving dynamic optimization problems to identifying and relaxing feasibility b ottlenecks, suc h as in terconnection limits, siting constrain ts, procurement pro cesses, and regulatory appro v als, that restrict ¯ q ( Q ). 5 Rev en ue Sharing under Separated Financial Constrain ts W e now consider a decision problem under an unbund le d utility structur e , also known as as Inde- p endent Power Pr o duc ers (IPPs) business mo del, in which renew able generation and utility system op eration are financially separated. In this setting, renewable generators op erate as indep enden t en tities, while the utility administers the VRP , sets the premium price, and inv ests in system-level in tegration and expansion. Unlike the vertically integrated b enc hmark, the utility no longer in- ternalizes generation costs on a single balance sheet; instead, financial feasibilit y m ust b e satisfied separately for the op erator and the generators. 5.1 Single-P erio d Optimization with Rev en ue Sharing T o capture this institutional separation, w e introduce an explicit reven ue-sharing decision v ari- able γ ∈ [0 , 1], which determines how total VRP rev enue is allo cated b et w een the tw o parties. Sp ecifically , a fraction γ of total program rev enue is transferred to renewable generators, while the remaining fraction 1 − γ is retained by the op erator. Importantly , γ is not a mark et outcome but a p olicy-c ontr ol le d p ar ameter , reflecting contract design or regulatory rules gov erning reven ue allo cation within the VRP . Recall the tw o cost aggregates C 1 ( Q, q ) := C S ( Q ) + k q , C 2 ( Q ) := C R ( Q ) − f ( Q ) π ( Q ) , where all primitives are summarized in T able 2. The single-p eriod optimization problem under rev enue sharing is: max p,q ,γ q (10a) s.t. D p e ( Q ) ≤ f ( Q ) , (10b) C 1 ( Q, q ) ≤ (1 − γ ) R ( p, Q ) , (10c) C 2 ( Q ) ≤ γ R ( p, Q ) , (10d) q ≥ 0 , p ≥ 0 , γ ∈ [0 , 1] . (10e) Constrain t (10b) enforces renewable deliv erability: renew able credits sold by the program must b e back ed b y deliv ered renewable electricit y in the same perio d. Constraint (10c) ensures that the op erator’s retained share of program reven ue co vers system costs and an y new inv estment undertak en in the p erio d. Constraint (10d) guarantees generator viability by requiring that the transferred program rev enue co ver the generator-side net cost C 2 ( Q ). Relativ e to the integrated benchmark, the key difference is the explicit separation of financial constrain ts through γ . This separation introduces additional flexibilit y in rev enue allo cation but do es not, as we sho w next, alter the optimal pricing signal or the long-run capacit y limit. Instead, γ go verns how program rev enue is distributed b et ween generator supp ort and system expansion, making it the primary policy lev er in un bundled utilit y environmen ts. 18 5.2 Optimal Rev en ue Sharing P olicy In tro ducing reven ue sharing changes the institutional structure of the problem, but it need not distort the underlying market-based pricing signal or the expansion outcome. In this subsection, w e c haracterize the op erator’s optimal rev en ue-sharing rule and sho w that, whenev er the reven ue- sharing choice is in terior, the unbundled problem collapses to the in tegrated b enchmark. Prop osition 3 (Optimal reven ue-sharing rule) . Fix a state Q and supp ose the optimal solution exhibits strictly p ositiv e expansion q ∗ ( Q ) > 0. Let p ∗ ( Q ) denote the optimal price in the integrated form ulation, and let R ∗ ( Q ) := R ( p ∗ ( Q ) , Q ) denote the corresp onding program reven ue. Then an optimal reven ue share is given b y γ ∗ ( Q ) = max 0 , C 2 ( Q ) R ∗ ( Q ) . (11) In particular, if C 2 ( Q ) ≤ 0 (generator surplus from the energy market), then γ ∗ ( Q ) = 0. If C 2 ( Q ) > 0 and γ ∗ ( Q ) ∈ (0 , 1), then the generator viabilit y constrain t binds at the optim um: C 2 ( Q ) = γ ∗ ( Q ) R ∗ ( Q ) . Sketch of pr o of. The result follows from the KKT conditions of (10). If C 2 ( Q ) ≤ 0, the generator viabilit y constraint is slack at γ = 0, so allo cating an y p ositiv e share to generators w eakly reduces the operator’s retained rev enue and cannot increase expansion, implying γ ∗ ( Q ) = 0. Otherwise, when C 2 ( Q ) > 0 and γ is interior, complemen tary slackness implies the generator viabilit y constraint binds, yielding γ = C 2 ( Q ) /R ( p, Q ). Ev aluating at the expansion-maximizing price p ∗ ( Q ) gives (11). □ The rule ab o ve identifies an expansion-maximizing rev en ue share for the single-perio d separated- accoun ts problem: conditional on feasibility , an y alternative γ cannot increase the attainable ex- pansion q . W e next show that, in the in terior regime γ ∗ ( Q ) ∈ (0 , 1), the tw o binding financial constrain ts aggregate to the integrated feasibility constraint, implying the same optimal pricing and expansion outcomes as in the integrated b enc hmark. Remark 2. The b oundary case γ ∗ ( Q ) = 1 is excluded by feasibilit y . Since the utilit y b ears strictly p ositiv e institutional cost in administering the VRP program, allo cating all reven ue to generators w ould lea ve zero retained reven ue for the op erator in (10c), making the op erator-side constrain t infeasible. Therefore, any feasible solution m ust satisfy γ ∗ ( Q ) < 1. Prop osition 4 (Equiv alence to the in tegrated benchmark under in terior rev enue sharing) . Fix Q and supp ose the optimal reven ue-sharing choice is in terior, i.e., γ ∗ ( Q ) ∈ (0 , 1). Then: 1. The optimal price and expansion under (10) coincide with the in tegrated benchmark solution, i.e., p RS ( Q ) = p ∗ ( Q ) and q RS ( Q ) = q ∗ ( Q ). 2. Consequen tly , all analytical results deriv ed under the integrated b enc hmark remain v alid, including the single-p eriod closed-form solution (Theorem 1), the long-run capacity limit c haracterization (Theorem 2), the multi-perio d formulation, and the global optimality of m yopic policies (Theorem 3), provided the in terior condition holds along the realized capacit y path. Sketch of pr o of. When γ ∗ ( Q ) ∈ (0 , 1) and q ∗ ( Q ) > 0, complementary slac kness implies that b oth separated financial constrain ts bind at the optim um: C 1 ( Q, q ) = (1 − γ ) R ( p, Q ) , C 2 ( Q ) = γ R ( p, Q ) . 19 Adding these equalities yields C 1 ( Q, q ) + C 2 ( Q ) = R ( p, Q ) , whic h is exactly the integrated financial feasibility constrain t. Since the renewable deliv erability constrain t is identical in b oth form ulations, the un bundled single-p erio d problem reduces to the in tegrated b enc hmark. Therefore, the same rev enue-maximizing pricing rule applies, and the im- plied expansion (giv en b y the binding in tegrated constraint) coincides as well. The multi-perio d and m yopic optimality results follo w b ecause the p er-p eriod feasible set and induced expansion mapping ¯ q ( Q ) are unc hanged whenev er the reduction holds. □ 5.3 Phase T ransition Dynamics W e now examine how the optimal rev enue-sharing rule translates into distinct operational regimes as renewable penetration increases. Because pricing is already determined by the in tegrated b enc h- mark, the only remaining p olicy lev er is the allo cation of total program reven ue b et ween generator supp ort and system expansion. Let R ∗ ( Q ) := R ( p ∗ ( Q ) , Q ) denote total program rev enue at the optimal price. Corollary 6 (Expansion under rev enue sharing) . Fix a s tate Q and supp ose the optimal price p ∗ ( Q ) is applied. If expansion is p ositiv e and b oth financial constraints bind, the op erator-funded expansion level is giv en b y q ( γ ; Q ) = (1 − γ ) R ∗ ( Q ) − C S ( Q ) k . (12) In particular, expansion is strictly decreasing in γ . Pr o of sketch. When expansion is p ositiv e, the op erator’s budget constrain t binds: C S ( Q ) + k q = (1 − γ ) R ∗ ( Q ) . Solving for q yields (12). Monotonicity in γ follo ws immediately . □ Corollary 6 formalizes a simple economic principle: program rev enues m ust first co ver an y re- new able reven ue shortfall; only the residual can finance new capacit y additions. Since the ob jective is to maximize q , the optimal rev en ue-sharing rule allo cates the minim um share required to ensure generator viability , directing all remaining rev enue tow ard expansion. Phase structure. As renewable capacit y increases, the binding patterns of the financial con- strain ts generate three qualitativ ely distinct regimes: • Phase 1: Sp on taneous expansion ( γ = 0 , q > 0 ). When renewable generators are viable from wholesale-mark et rev enue alone ( C 2 ( Q ) ≤ 0), no reven ue transfer is required. All program reven ue is retained by the op erator and directed to ward expansion. This phase t ypically o ccurs at low penetration lev els, when energy reven ue and emission differen tials remain high. • Phase 2: Rev enue-supported expansion ( γ > 0 , q > 0 ). As renew able penetration increases, declining wholesale prices and rising curtailmen t reduce generator net rev enue. A p ositiv e reven ue share b ecomes necessary to maintain viabilit y . Expansion con tinues, but a gro wing p ortion of program rev enue is absorbed b y op erating support rather than new builds. • Phase 3: Long-run equilibrium ( γ > 0 , q = 0 ). Ev entually , total program reven ue is just sufficient to cov er op erating costs. No residual remains to finance additional capacity , and expansion ceases. The system reac hes the long-run capacity limit characterized earlier. 20 These regimes arise endogenously from the interaction b etw een declining emission in tensity , c hanging wholesale-mark et reven ues, and the reven ue-neutral constraint. P olicy interpretation. The phase structure highlights an important timing implication for VRPs. In early stages, when γ = 0, the program generates its largest expansion effect because all program reven ue finances new capacity . As p enetration rises, increasing reven ue m ust b e di- v erted to sustain existing generation, reducing marginal expansion. This dynamic underscores the imp ortance of early program deplo ymen t: volun tary mec hanisms are most effectiv e when renew able p enetration remains low and emission differentiation is large. 6 Numerical Illustration 6.1 ISO-NE T est System The numerical illustration adopts the 8-bus ISO-NE (Indep enden t System Op erator–New Eng- land) test system, a standard configuration widely used in p ow er-system economics to b enc hmark dispatc h and mark et mechanisms. The system consists of eight no des, tw elve transmission lines, and seven ty-six thermal generators, with a total installed capacity of approximately 23 GW and an av erage system load of 13 GW. T ransmission congestion in the ISO-NE system is generally rare and limited, reflecting the region’s strong in terconnection and centralized co ordination under ISO-lev el managemen t. Because bulk transmission expansion is planned and op erated by the ISO rather than by lo cal utilities, our framework fo cuses on the lo cational marginal price of a single-bus r epr esentation from the 8-bus system to capture the economic b ehavior of an individual utilit y within its lo cal service territory . This abstraction isolates the retail-facing renewable program from in ter-zonal transmission dynamics while preserving realistic nodal prices and system conditions. Within this lo calized utilit y framework, renew able op erating costs C R ( Q ) are represented by the operation and main tenance (O&M) expenses of renew able generators. The unit in vestmen t cost of incremen tal renew able additions is captured by k t (or k in a stationary parameterization), while the op erator’s system-side cost C S ( Q ) primarily reflects exp enditures associated with battery energy storage deplo ymen t and op eration, whic h serv e as the main flexibility resources supp orting renew able in tegration and reliability . T o capture the increasing marginal difficulty of expansion, w e imp ose moderate conv exity on both C R ( Q ) and C S ( Q ), reflecting factors suc h as higher siting and interconnection costs for remote resources, the need for enhanced con trol infrastructure, and gro wing balancing costs as renew able and storage capacities expand. These assumptions ensure that the sim ulated cost structure realistically mirrors the economic challenges faced by utilities scaling renew ables under lo cal op erational constraints. The detailed parameterization and quan titative assumptions are presen ted in App endix B. W e no w quan tify the monotone reachabilit y condition in equation 7: S ( Q ) = Q + M e ϵ e ( Q ) − C ( Q ) λ . If S is differentiable, the monotone reac hability requiremen t S ′ ( Q ) ≥ 0 is equiv alen t to 1 + 1 λ M e ϵ e ′ ( Q ) − C ′ ( Q ) ≥ 0 , ∀ Q ∈ [ Q 0 , Q ∗ ) . (13) It shall b e ackno wledged that emission reduced with renew able capacit y e ′ ( Q ) < 0 and generally non-in vestmen t cost increases with renew able capacity C ′ ( Q ) > 0, so the monotone reac habilit y 21 condition is not holding automatically without quan tification chec k. In our ISO-NE sim ulation, w e use the parameterization M = 10, ϵ = 0 . 0045, and k = 1000. 2 W e also compute uniform upp er b ounds on the relev ant deriv atives ov er the simulated state range (e.g., max | e ′ ( Q ) | < 0 . 1 and max | C ′ ( Q ) | < 150). Under this calibration, the sufficien t condition for monotone reac hability is satisfied with slack: 1 + 1 λ M e ϵ e ′ ( Q ) − C ′ ( Q ) ≥ 1 + 1 k − M e ϵ max | e ′ ( Q ) | − max | C ′ ( Q ) | = 0 . 768 > 0 . Therefore, the monotone reac habilit y condition holds, implying that the m yopic p olicy is globally optimal for the ISO-NE calibration. Although m y opic optimalit y is not automatic, it is empirically plausible under realistic p o wer-system parameterizations. 6.2 Numerical Calibration and Result In terpretation W e calibrate VRP demand using an optimistic but empirically grounded assumption consistent with recen t pro jections for volun tary mark et growth. Assume approximately one-third of total utilit y demand—com bining corporate and residential customers—is expected to b e willing to pur- c hase renewable contracts b y 2030. Setting the price premium at around 20 $ /MWh (equiv alently , 2 ¢ /kWh) for this v olun tary segmen t closely aligns with observ ed surc harges in today’s VRP pro- grams across sev eral U.S. utilities. Based on this willingness-to-pa y benchmark, w e rev erse-engineer the price-sensitivity parameter to match the implied resp onsiv eness under our exponential sp ecifi- cation D p t e ( Q t ) = M exp − ϵ p t e ( Q t ) . F or the ISO-NE system, assuming a lo cal utilit y market size of 10 GW capacity out of a total regional generation capacit y of 23 GW, this calibration yields ϵ = 0 . 0045. The parameterization of ϵ and its impact on renewable con tract pricing—expressed b oth on a p er-capacit y (GW) and p er-energy ( $ /MWh) basis—are summarized in T able 3. As noted by O’Shaughnessy et al. [2021b], offtak ers ma y comp ensate renew able generators through a mix of v olumetric and capacit y-based rates, where the capacit y-based pricing pro vides a steadier and more predictable rev enue stream. This dual representation therefore captures the practical structure of renew able contracts, in which energy-based and capacit y-based premiums jointly determine the o verall financial incen tiv e for v oluntary participation. The resulting ϵ reflects a relatively price- toleran t v oluntary segmen t, consisten t with the increasing corp orate and communit y pro curemen t of renewable energy observ ed in recent y ears. T able 3: Price thresholds for VRP demand at differen t adoption lev els ( Q = 5 GW, ϵ = 0 . 0045, Wind capacity factor = 0 . 35). Demand Lev el Price p [M $ /GW] Equiv alen t Price [ $ /MWh] D = 0 . 33 M 69.37 22.63 D = 0 . 10 M 145.40 47.42 D = 0 . 05 M 247.03 80.57 Figure 1 summarizes the dynamic b ehavior of the VRP program. The cum ulative renew able capacit y Q t exhibits the characteristic S-shap ed tra jectory (Subfigures 1 and 5), consistent with 2 All monetary units are consisten t with the model form ulation; see Appendix B for full scaling and unit conv ersions. 22 Figure 1: Multi-p erio d sim ulation under baseline demand. The figure summarizes system ev olution across multiple decision p erio ds: (1) cum ulative renewable capacity Q t , (2) mo deled renew able (wind) generation p ercentage, (3) grid emissions intensit y e ( Q t ), (4) optimal renewable program price p ∗ t , (5) renew able capacit y expansion q ∗ t , and (6) rev en ue-sharing ratio γ ∗ t b et w een the program op erator and renewable generators. T ogether, these panels illustrate how VRP rev enues can sustain con tinued renewable deploymen t while ensuring financial feasibilit y and declining grid emissions intensit y . diffusion mo dels suc h as Bass [1969], where tec hnology adoption accelerates in the early stages and gradually levels off as the market matures. The incremen tal expansion q t first accelerates b ecause, at lo w renewable p enetration lev els, generators remain financially self-sufficien t from the wholesale energy market, allowing VRP rev enues to b e fully allo cated tow ard new capacity additions. In this early phase, the rate-limiting factor is the limited volume of renewable av ailable for sale rather than cost reco very , leading to a rapidly increasing expansion rate. As renew able penetration rises, 23 the grid emissions in tensity e ( Q t ) declines, reducing the incentiv e for v oluntary differen tiation. A t the same time, b oth the op erator’s system cost and renew able op erating costs increase, gradually slo wing expansion. Even tually , in vestmen t halts once reven ues can no longer cov er incremental costs, yielding the observed S-shap ed cumulativ e tra jectory . The grid emissions tra jectory (Subfigure 3) decreases monotonically but nonlinearly with Q t . When renewable capacity in teracts with the ISO-NE wholesale market, the fossil generation dis- placed by renew ables follows the merit order of marginal costs rather than emissions intensit y , pro ducing a nonlinear decline in emissions intensit y . As predicted by the theoretical stopping con- dition, the terminal emissions intensit y e ( Q ∗ ) remains strictly p ositiv e: once the grid approaches full decarb onization, the willingness to pa y for additional VRPs disapp ears, and further expansion ceases. Thus, while the programs deep en renew able penetration, they cannot independently ac hieve a fully net-zero grid. The renewable premium price p ∗ t (Subfigure 4) declines monotonically o ver time, consistent with the analytical result that the optimal price decreases as b oth willingness to pay and emissions differen tiation diminish. The rev enue-sharing parameter γ ∗ t (Subfigure 6) rev eals the transition b et w een sp ontaneous and policy-supp orted expansion phases. When Q t is small, γ ∗ t = 0, indicating that renew ables can reco ver all costs from the energy market (i.e., C 2 ( Q t ) ≤ 0). The p oin t at whic h γ ∗ t b ecomes p ositiv e marks the onset of the VRP’s activ e phase: b eyond this threshold, VRP rev enues are partially redirected to sustain generator viability and to finance the op erator’s system-lev el in v estments, particularly in battery energy storage. More specifically , low-carbon generation curren tly accoun ts for roughly 39% of ISO-NE’s total demand, broadly matc hing our baseline n umerical illustration of 5 GW of renewable capacity in a utilit y system with 10 GW p eak demand. This corresp onds to appro ximately p eriod 30 on the x-axis across all subfigures in Figure 1. At this point, our model suggests that the system is roughly fiv e y ears a w ay from the stage at whic h rev en ue sharing with renew able generators b ecomes necessary to sustain their financial balance, due to declining rev en ues from the energy market. Consistent with curren t conditions, the mo del therefore indicates that renewable generators may b egin to require supp ort from volun tary renew able pro curemen t programs around 2030. Quan titatively , the program extends renew able capacity from roughly 5.5 GW to 6.5 GW—a non trivial increase—but the additional 1 GW requires nearly the same duration (ab out 30 years) as the sp on taneous expansion from 0.5 GW to 5.5 GW. This finding underscores that while volun- tary mechanisms can meaningfully extend renew able capacit y , they do so at a substan tially slow er marginal rate compared with early-stage growth. 7 Discussion and Conclusions This pap er develops an institutionally grounded benchmark for v olun tary renew able program (VRP) design under utility-led implementation. The framew ork is delib erately general: it do es not dep end on a particular market design, o wnership structure, or numerical calibration, but instead isolates a small set of economically meaningful primitiv es—the emissions-differen tiation channel e ( Q ), the demand resp onse to the implied abatemen t price, the cost of renewable expansion, and the regulatory requirement of contemporaneous financial feasibility . These ingredients allow the mo del to apply broadly across utilit y-op erated v oluntary programs, including vertically in tegrated and unbundled settings coupled with indep enden t p o wer pro ducers, while preserving analytical tractabilit y . The first cen tral insigh t is that v oluntary renewable programs can meaningfully supp ort re- new able expansion, but their long-run effect is inheren tly limited. VRP demand creates v alue by 24 monetizing emissions differentiation, thereb y generating reven ue that can b e directed to new re- new able additions. Ho wev er, as renewable p enetration rises and grid emissions in tensity falls, the v alue of that differentiation declines endogenously . As a result, v oluntary program reven ue even- tually b ecomes just sufficien t to cov er ongoing system and participation requirements, leaving no residual for further expansion. In this sense, v olun tary programs can accelerate the transition, but they cannot by themselves complete it. F ull decarb onization requires complementary mandatory instrumen ts, such as compliance obligations, clean electricit y standards, or carbon pricing, that preserv e incen tiv es to abate ev en when av erage grid emissions are already low. The second insigh t is a separation result: conditional on the renewable-capacit y state Q , optimal pricing is pinned do wn by the rev enue problem alone, while expansion is determined b y the remain- ing feasibilit y margin after costs are co vered. Our results are not limited to the exponential demand sp ecification (Prop osition 1). The core single-p erio d analysis extends to a general rev enue function R ( p, Q ) under mild regularit y conditions, so the main conclusions contin ue to hold for alternative demand forms (e.g., logit or iso elastic) and for alternative monotone wa ys in whic h Q enters de- mand through emissions in tensity b ey ond the ratio p/e ( Q ). F or instance, demand may take the form D ( g ( p, e ( Q ))) for a monotone index g , or D ( p, e ( Q )) = ϕ ( e ( Q )) ¯ D ( p ). In all such cases, when- ev er the financial constrain t binds, the optimal pricing rule remains p ∗ ( Q ) ∈ arg max p ∈P ( Q ) R ( p, Q ); and an y do wnstream result that depends only on the reven ue en velope R ⋆ ( Q ) := max p ∈P ( Q ) R ( p, Q ) can be restated in terms of that en v elop e. This result has b oth analytical and empirical v alue. Ana- lytically , it clarifies wh y the pricing problem admits a clean c haracterization. Empirically , it implies that understanding VRP demand—its level, elasticit y , and heterogeneity—is first-order for ev alu- ating program p erformance, ev en before detailed engineering-cost calibration is introduced. The demand side determines the attainable reven ue fron tier, and thus the ro om a v ailable for renewable expansion. The third insigh t is dynamic. Under the monotone reachabilit y condition, a simple my opic p olicy that expands to the p er-perio d feasible limit is globally optimal. This gives the mo del a strong op erational in terpretation: when the condition holds, the utilit y need not solv e a complicated long- horizon planning problem or rely on highly uncertain forecasts of future technology costs, demand gro wth, or market conditions. Instead, it can follow a transparent perio d-by-perio d expansion rule and still attain the long-run optim um. This is esp ecially relev ant in real program environmen ts, where long-run pro jections are uncertain and p olicy credibilit y often depends on simple, auditable decision rules. The fourth insight concerns institutional design. In the un bundled setting, optimal rev en ue sharing is state-dependent. At low renewable penetration, when generators remain viable from wholesale-mark et reven ues, the op erator optimally retains the full program reven ue and directs it to ward additional expansion. As p enetration rises and generator-side viability b ecomes tigh ter, a gro wing share of VRP rev enue m ust b e allo cated to sustain participation, reducing the residual a v ailable for new capacity . This phase structure implies that v olun tary renew able programs are most p o w erful when launched early: the same demand base produces greater expansion when emissions differen tiation is high and fewer rev en ues must be diverted to w ard maintaining incum b en t viabilit y . Dela yed adoption, by con trast, shifts the role of the program from expansion finance tow ard partial supp ort of an already transformed system. Consisten t with our n umerical interpretation, the mo del suggests that for man y markets already approaching relatively high renewable p enetration, the rev enue-sharing phase ma y arriv e soon as renew able energy-market reven ues con tinue to shrink, and the framework therefore pro vides analytical supp ort for designing such rev enue-sharing p olicies. More broadly , the framew ork highlights a go vernance requirement for credible v oluntary pro- grams. Because the mo del is profit-neutral and feasibility-based, program effectiveness dep ends on rev enues b eing transparently allo cated tow ard the mo deled ob jectiv es rather than div erted else- 25 where. T ransparen t accoun ting, v erification of credit-back ed deliv ery , and credible commitmen t o ver reven ue use are therefore not secondary implemen tation details; they are cen tral to preserving demand and sustaining the pricing mechanism itself. A volun tary market can generate meaning- ful expansion only if participants b eliev e that the premium they pay is translated in to real and v erifiable system impact. T aken together, these results p osition the framework as a b enc hmark for analyzing utility- op erated VRP programs under realistic regulatory constraints. Its main con tribution is not to pro vide a fully exhaustive description of every institutional detail, but to identify the core eco- nomic logic linking emissions differentiation, volun tary demand, utilit y feasibility , and renew able expansion. That logic yields a clear policy conclusion: v oluntary renewable programs can im- pro ve price transparency , strengthen impact transparency , and accelerate renew able deplo yment, but their role is fundamen tally complemen tary rather than sufficien t. Their greatest v alue lies in pro viding an early , credible, and financially disciplined channel for renewable expansion within a broader decarb onization architecture that m ust ultimately include mandatory policy support. References Ankit Agarw al, Casey Canfield, and Mahelet G. Fikru. Role of greener default options on consumer preferences for renew able energy pro curemen t. R enewable Ener gy , 221:119802, F ebruary 2024. ISSN 09601481. doi: 10.1016/j.renene.2023.119802. URL https://linkinghub.elsevier.com/ retrieve/pii/S0960148123017172 . Mark A. Andor, Man uel F rondel, and Stephan Sommer. Equit y and the willingness to pa y for green electricit y in Germany. Natur e Ener gy , 3(10):876–881, September 2018. ISSN 2058-7546. doi: 10.1038/s41560- 018- 0233- x. URL https://www.nature.com/articles/s41560- 018- 0233- x . Austin Energy. Greenc hoice renewable energy program, 2026. URL https://austinenergy.com/ green- power/greenchoice . Accessed: 2026-03-16. Jesse D. Bac kstrom, Mic hael Gillen water, Matthew Brander, and Charlie Inman. Corp orate Po w er Purc hase Agreemen ts: A Policy P ersp ectiv e. SSRN Ele ctr onic Journal , 2024. ISSN 1556-5068. doi: 10.2139/ssrn.4708811. URL https://www.ssrn.com/abstract=4708811 . F rank M. Bass. A New Pro duct Growth for Model Consumer Durables. Management Scienc e , 15(5):215–227, Jan uary 1969. ISSN 0025-1909, 1526-5501. doi: 10.1287/mnsc.15.5.215. URL https://pubsonline.informs.org/doi/10.1287/mnsc.15.5.215 . Anders Bjørn, Shannon M. Lloyd, Matthew Brander, and H. Damon Matthews. Renew able energy certificates threaten the in tegrit y of corp orate science-based targets. Natur e Climate Change , 12 (6):539–546, June 2022. ISSN 1758-678X, 1758-6798. doi: 10.1038/s41558- 022- 01379- 5. URL https://www.nature.com/articles/s41558- 022- 01379- 5 . Sev erin Borenstein. The Priv ate and Public Economics of Renew able Electricity Generation. Jour- nal of Ec onomic Persp e ctives , 26(1):67–92, F ebruary 2012. ISSN 0895-3309. doi: 10.1257/jep. 26.1.67. URL https://pubs.aeaweb.org/doi/10.1257/jep.26.1.67 . Sev erin Borenstein. The economics of fixed cost recov ery b y utilities. The Ele ctricity Journal , 29(7):5–12, September 2016. ISSN 10406190. doi: 10.1016/j.tej.2016.07.013. URL https:// linkinghub.elsevier.com/retrieve/pii/S1040619016301130 . 26 T om Bro wn and Lina Reichen b erg. Decreasing market v alue of v ariable renewables is a result of p olicy , not v ariability . Ener gy Ec onomics , 77:795–802, 2019. doi: 10.1016/j.eneco.2018.11.008. Leila Dagher, Lori Bird, and Jenny Heeter. Residential green p o wer demand in the United States. R enewable Ener gy , 114:1062–1068, December 2017. ISSN 09601481. doi: 10.1016/j.renene.2017. 07.111. URL https://linkinghub.elsevier.com/retrieve/pii/S0960148117307395 . Choton K. Das, Octavian Bass, Ganesh Kothapalli, Thair S. Mahmoud, and Dary oush Habibi. Ov erview of energy storage systems in distribution net works: Placement, sizing, op eration, and p o wer qualit y . R enewable and Sustainable Ener gy R eviews , 91:1205–1230, August 2018. ISSN 13640321. doi: 10.1016/j.rser.2018.03.068. URL https://linkinghub.elsevier.com/ retrieve/pii/S1364032118301606 . P aul Denholm, Matthew O’Connell, Gregory Brinkman, and Jennie Jorgenson. Overgeneration from solar energy in california: A field guide to the duck c hart. T echnical Rep ort NREL/TP- 6A20-65023, National Renew able Energy Lab oratory , 2015a. P aul Denholm, Matthew O’Connell, Gregory Brinkman, and Jennie Jorgenson. Ov ergenera- tion from Solar Energy in California. A Field Guide to the Duck Chart. T echnical Rep ort NREL/TP–6A20-65023, 1226167, No vem b er 2015b. URL http://www.osti.gov/servlets/ purl/1226167/ . Dominion Energy . Green p o wer program (100% option), 2026a. URL https://www. dominionenergy.com/virginia/renewable- energy- programs/green- power . Accessed: 2026- 03-16. Dominion Energy . 100% renewable energy program (rider trg), 2026b. URL https://www.dominionenergy.com/virginia/renewable- energy- programs/ 100- percent- renewable- energy . Accessed: 2026-03-16. Florian Egli, Rui Zhang, Victor Hop o, T obias Schmidt, and Bjarne Steffen. The con tribution of corp orate initiativ es to global renewable electricity deplo yment. Natur e Communic ations , 14(1):4678, August 2023. ISSN 2041-1723. doi: 10.1038/s41467- 023- 40356- 0. URL https: //www.nature.com/articles/s41467- 023- 40356- 0 . Barbara C. F arhar. Willingness to Pa y for Electricit y from Renewable Resources: A Review of Utilit y Mark et Researc h, July 1999. URL https://docs.nrel.gov/docs/fy99osti/26148.pdf . F anny F rei, Allister Lo der, and Catharina R. Bening. Liquidity in green p o w er mark ets – An in ternational review. R enewable and Sustainable Ener gy R eviews , 93:674–690, October 2018. ISSN 13640321. doi: 10.1016/j.rser.2018.05.034. URL https://linkinghub.elsevier.com/ retrieve/pii/S1364032118303691 . Georgia Po w er. Simple solar program, 2026. URL https://www.georgiapower.com/residential/ solutions/solar/simple- solar.html . Accessed: 2026-03-16. Y ashar Ghiassi-F arrokhfal, W olfgang Ketter, and John Collins. Making green p o wer purchase agree- men ts more predictable and reliable for companies. De cision Supp ort Systems , 144:113514, Ma y 2021. ISSN 01679236. doi: 10.1016/j.dss.2021.113514. URL https://linkinghub.elsevier. com/retrieve/pii/S0167923621000245 . Lion Hirth. The mark et v alue of v ariable renew ables. Ener gy Ec onomics , 38:218–236, 2013a. doi: 10.1016/j.eneco.2013.02.004. 27 Lion Hirth. The market v alue of v ariable renew ables. Ener gy Ec onomics , 38:218–236, July 2013b. ISSN 01409883. doi: 10.1016/j.eneco.2013.02.004. URL https://linkinghub.elsevier.com/ retrieve/pii/S0140988313000285 . Daan Hulshof, Catrinus Jepma, and Machiel Mulder. Performance of markets for Europ ean renew able energy certificates. Ener gy Policy , 128:697–710, May 2019. ISSN 03014215. doi: 10.1016/j.enp ol.2019.01.051. URL https://linkinghub.elsevier.com/retrieve/pii/ S0301421519300709 . In ternational Renew able Energy Agency. Renew able p o w er generation costs in 2022, 2023. URL https://www.irena.org/publications/2023/Aug/ Renewable- power- generation- costs- in- 2022 . Jesse D. Jenkins and Ignacio J. P erez-Arriaga. Improv ed Regulatory Approac hes for the Rem unera- tion of Electricit y Distribution Utilities with High Penetrations of Distributed Energy Resources. The Ener gy Journal , 38(3):63–92, Ma y 2017. ISSN 0195-6574, 1944-9089. doi: 10.5547/01956574. 38.3.jjen. URL https://journals.sagepub.com/doi/10.5547/01956574.38.3.jjen . S.G. Jensen and K. Skytte. In teractions b et ween the p o w er and green certificate mark ets. Ener gy Policy , 30(5):425–435, April 2002. ISSN 03014215. doi: 10.1016/S0301- 4215(01)00111- 2. URL https://linkinghub.elsevier.com/retrieve/pii/S0301421501001112 . P aul L. Josko w. Incen tive Regulation and Its Application to Electricity Netw orks. R eview of Network Ec onomics , 7(4), January 2008. ISSN 1446-9022, 2194-5993. doi: 10.2202/1446- 9022. 1161. URL https://www.degruyter.com/document/doi/10.2202/1446- 9022.1161/html . P aul L Josko w. Challenges for wholesale electricit y markets with intermitten t renewable generation at scale: the US exp erience. Oxfor d R eview of Ec onomic Policy , 35(2):291–331, April 2019. ISSN 0266-903X, 1460-2121. doi: 10.1093/o xrep/grz001. URL https://academic.oup.com/oxrep/ article/35/2/291/5477314 . Nicolas Kreibic h and Luk as Hermwille. Caught in b et ween: credibility and feasibility of the v ol- un tary carbon mark et post-2020. Climate Policy , 21(7):939–957, August 2021. ISSN 1469-3062, 1752-7457. doi: 10.1080/14693062.2021.1948384. URL https://www.tandfonline.com/doi/ full/10.1080/14693062.2021.1948384 . Lev elT en Energy . Lev elten energy ppa price index rep ort, 2024. URL https://www. leveltenenergy.com/ppa- price- index . Accessed: 2026-03-16. Massac husetts Comm unity Electricit y Aggregation. Natic k communit y electricity program prices, 2024. URL https://www.masspowerchoice.com/natick/prices . Accessed: 2026-03-16. Ross T. Mewton and Oscar J. Cac ho. Green Po w er volun tary purchases: Price elasticity and p olicy analysis. Ener gy Policy , 39(1):377–385, January 2011. ISSN 03014215. doi: 10.1016/j.enp ol. 2010.10.013. URL https://linkinghub.elsevier.com/retrieve/pii/S0301421510007639 . P .E Morthorst. Th e developmen t of a green certificate mark et. Ener gy Policy , 28(15):1085– 1094, Decem b er 2000. ISSN 03014215. doi: 10.1016/S0301- 4215(00)00094- X. URL https: //linkinghub.elsevier.com/retrieve/pii/S030142150000094X . Eric O’Shaughnessy , Jenny Heeter, Julien Gattaciecca, Jenny Sauer, Kelly T rumbull, and Emily Chen. Emp ow ered comm unities: The rise of comm unity c hoice aggregation in the United States. 28 Ener gy Policy , 132:1110–1119, Septem b er 2019. ISSN 03014215. doi: 10.1016/j.enpol.2019.07. 001. URL https://linkinghub.elsevier.com/retrieve/pii/S0301421519304434 . Eric O’Shaughnessy , Jenny Heeter, Chandra Shah, and Sam Ko ebric h. Corp orate acceleration of the renew able energy transition and implications for electric grids. R enewable and Sustainable Ener gy R eviews , 146:111160, 2021a. doi: 10.1016/j.rser.2021.111160. Eric O’Shaughnessy , Jenny Heeter, Chandra Shah, and Sam Ko ebric h. Corp orate acceleration of the renew able energy transition and implications for electric grids. R enewable and Sustainable Ener gy R eviews , 146:111160, August 2021b. ISSN 13640321. doi: 10.1016/j.rser.2021.111160. URL https://linkinghub.elsevier.com/retrieve/pii/S1364032121004494 . Mic hael G. Pollitt. Lessons from the history of indep enden t system op erators in the energy sector. Ener gy Policy , 47:32–48, August 2012. ISSN 03014215. doi: 10.1016/j.enp ol.2012.04.007. URL https://linkinghub.elsevier.com/retrieve/pii/S0301421512002923 . P ortland General Electric. Green future choice renew able program, 2026. URL https:// portlandgeneral.com/energy- choices/renewable- power . Accessed: 2026-03-16. Ning Qi and Bolun Xu. Lo cational Energy Storage Bid Bounds for F acilitating So cial W el- fare Conv ergence. IEEE T r ansactions on Ener gy Markets, Policy and R e gulation , 3(4):486– 497, December 2025. ISSN 2771-9626. doi: 10.1109/TEMPR.2025.3579671. URL https: //ieeexplore.ieee.org/document/11034735/ . Matthew Ranson and Rob ert N. Sta vins. Link age of greenhouse gas emissions trading systems: learning from exp erience. Climate Policy , 16(3):284–300, April 2016. ISSN 1469-3062, 1752- 7457. doi: 10.1080/14693062.2014.997658. URL http://www.tandfonline.com/doi/full/10. 1080/14693062.2014.997658 . Katja R¨ op er, Niels Kunz, and Luk as Gast. Renewable h ydrogen in industrial production: A bibliometric analysis of current and future applications. International Journal of Hydr o gen En- er gy , 98:687–696, January 2025. ISSN 03603199. doi: 10.1016/j.ijh ydene.2024.12.034. URL https://linkinghub.elsevier.com/retrieve/pii/S0360319924052303 . Arvind V. Shriv ats, Dena Firoozi, and Sebastian Jaim ungal. A mean-field game approach to equilibrium pricing in solar renewable energy certificate mark ets. Mathematic al Financ e , 32 (3):779–824, July 2022. ISSN 0960-1627, 1467-9965. doi: 10.1111/mafi.12345. URL https: //onlinelibrary.wiley.com/doi/10.1111/mafi.12345 . Sw antje Sundt and Katrin Rehdanz. Consumer’s willingness to pa y for gree n electricity: A meta- analysis of the literature, 2014. URL https://hdl.handle.net/10419/98413 . Sey ed Danial Mohseni T aheri, Selv aprabu Nadara jah, and Alessio T rivella. Ph ysical vs Vir- tual corp orate p o w er purc hase agreemen ts: Meeting renewable targets amid demand and price uncertaint y . Eur op e an Journal of Op er ational R ese ar ch , 320(1):256–270, January 2025. ISSN 03772217. doi: 10.1016/j.ejor.2024.08.002. URL https://linkinghub.elsevier.com/ retrieve/pii/S0377221724006027 . Mak oto T anak a and Yihsu Chen. Market p ow er in renew able portfolio standards. Ener gy Ec o- nomics , 39:187–196, September 2013. ISSN 01409883. doi: 10.1016/j.eneco.2013.05.004. URL https://linkinghub.elsevier.com/retrieve/pii/S014098831300090X . 29 Alessio T rivella, Danial Mohseni-T aheri, and Selv aprabu Nadara jah. Meeting corp orate renew able p o w er targets. Management Scienc e , 69(1):491–512, 2023a. doi: 10.1287/mnsc.2022.4354. Alessio T rivella, Danial Mohseni-T aheri, and Selv aprabu Nadara jah. Meeting Corp orate Renew able P ow er T argets. Management Scienc e , 69(1):491–512, January 2023b. ISSN 0025-1909, 1526- 5501. doi: 10.1287/mnsc.2022.4354. URL https://pubsonline.informs.org/doi/10.1287/ mnsc.2022.4354 . Klas W etterb erg, Jane Ellis, and Lambert Schneider. The in terplay b et ween v oluntary and compliance carb on mark ets: Implications for en vironmental integrit y . OECD En- vironmen t W orking Papers 244, 2024. URL https://www.oecd.org/en/publications/ the- interplay- between- voluntary- and- compliance- carbon- markets_500198e1- en.html . Series: OECD Environmen t W orking Papers V olume: 244. Alexander Wimmers and Reinhard Madlener. The Europ ean Mark et for Guaran tees of Origin for Green Electricit y: A Scenario-Based Ev aluation of T rading under Uncertain ty. Ener gies , 17(1): 104, Decem b er 2023. ISSN 1996-1073. doi: 10.3390/en17010104. URL https://www.mdpi.com/ 1996- 1073/17/1/104 . Xcel Energy . Renew able*connect flex terms and conditions, 2026. URL https: //www.xcelenergy.com/staticfiles/xe- responsive/Environment/Renewable%20Energy/ 23- 08- 515_MN- RenewablesConnect- Flex- Res_TandC_P02.pdf . Accessed: 2026-03-16. 30 8 App endix A: Math Pro ofs 8.1 Theorem 1: Single-P erio d Optimal Pricing Pr o of. Fix a state Q and abbreviate e := e ( Q ) > 0, f := f ( Q ), and C := C ( Q ). Under exponential demand condition, D p e = M exp − ϵ p e , R ( p, Q ) = p D p e = pM exp − ϵ p e . Rewrite constraints in ≤ 0 form: h 1 ( p, q ) := D p e − f ≤ 0 , h 2 ( p, q ) := C + k q − R ( p, Q ) ≤ 0 , h 3 ( p, q ) := − q ≤ 0 , h 4 ( p, q ) := − p ≤ 0 . Let multipliers ( λ, µ, ν, η ) ≥ 0 corresp ond to ( h 1 , h 2 , h 3 , h 4 ) and define the Lagrangian L ( p, q ; λ, µ, ν, η ) = q − λh 1 ( p, q ) − µh 2 ( p, q ) − ν h 3 ( p, q ) − η h 4 ( p, q ) . The KKT conditions are: (i) Primal fe asibility: D p ∗ e ≤ f , C + k q ∗ ≤ R ( p ∗ , Q ) , q ∗ ≥ 0 , p ∗ ≥ 0 . (ii) Dual fe asibility: λ ∗ , µ ∗ , ν ∗ , η ∗ ≥ 0. (iii) Complementary slackness: λ ∗ D p ∗ e − f = 0 , µ ∗ ( C + kq ∗ − R ( p ∗ , Q )) = 0 , ν ∗ q ∗ = 0 , η ∗ p ∗ = 0 . (iv) Stationarity: using D ′ ( x ) = − ϵD ( x ) and R p ( p, Q ) = ∂ R ( p, Q ) ∂ p = D p e 1 − ϵ p e , w e ha v e ∂ L ∂ q = 1 − µk + ν = 0 , ∂ L ∂ p = λ ϵ e D p e + µ D p e 1 − ϵ p e + η = 0 . Assume q ∗ ( Q ) > 0. Then ν ∗ = 0 by complementary slac kness, hence stationarit y in q implies 1 − µ ∗ k = 0 ⇒ µ ∗ = 1 k > 0 . Moreo ver, if C + k q ∗ < R ( p ∗ , Q ) held strictly , one could increase q sligh tly without violating an y constrain t, con tradicting optimality of q ∗ . Hence the financial constraint alw ays binds at optimal solutions: C + kq ∗ = R ( p ∗ , Q ) . Since q ∗ > 0 requires R ( p ∗ , Q ) > C and R (0 , Q ) = 0, we must ha ve p ∗ > 0, so η ∗ = 0. Substituting µ ∗ = 1 /k and η ∗ = 0 into stationarity in p and dividing b y D ( p ∗ /e ) > 0 yields λ ∗ ϵ e + 1 k 1 − ϵ p ∗ e = 0 ⇒ p ∗ = e ϵ + k λ ∗ . 31 No w there are t wo cases. Case 1 (deliv erability slack). If D ( p ∗ /e ) < f , then complementary slac kness implies λ ∗ = 0, hence p ∗ = e ϵ . F easibility requires D (1 /ϵ ) = D (( e/ϵ ) /e ) ≤ f , which is exactly the first regime condition. Case 2 (deliv erabilit y binding). If D ( p ∗ /e ) = f , then solving M exp( − ϵp ∗ /e ) = f giv es p ∗ = e ϵ ln M f , whic h applies precisely when the unconstrained maximizer violates deliv erabilit y , i.e. D (1 /ϵ ) > f . It remains to v erify optimality and uniqueness. Under q ∗ > 0, maximizing q sub ject to C + k q ≤ R ( p, Q ) is equiv alent to maximizing R ( p, Q ) ov er feasible p (since q = ( R ( p, Q ) − C ) /k whenever R ( p, Q ) > C ). The reven ue deriv ativ e is R p ( p, Q ) = D p e 1 − ϵ p e , so the unique stationary point of R ( · , Q ) on (0 , ∞ ) is p u = e/ϵ , where R p ( p u , Q ) = 0. Moreov er, R pp ( p, Q ) = ∂ 2 R ( p, Q ) ∂ p 2 = − ϵ e D p e 2 − ϵ p e , so R is strictly increasing on (0 , e/ϵ ) and strictly decreasing on ( e/ϵ, ∞ ); hence p u is the unique global maximizer of R ( · , Q ) absen t the deliv erability constraint. If D (1 /ϵ ) ≤ f , then p u is feasible and therefore optimal. If D (1 /ϵ ) > f , feasibility requires D ( p/e ) ≤ f , which (since D is strictly decreasing in p ) is equiv alen t to p ≥ e ϵ ln( M /f ) > e ϵ ; on this feasible set R is strictly decreasing, so the unique maximizer is attained at the boundary p = e ϵ ln( M /f ). Therefore p ∗ ( Q ) is optimal and unique, and it is giv en by the theorem. 8.1.1 Proof of Prop osition 1 Pr o of of Pr op osition 1. Fix a state Q . Consider the single-p erio d problem (for this fixed Q ) in whic h ( p, q ) must satisfy p ∈ P ( Q ), q ≥ 0, and the integrated financial feasibilit y constrain t C ( Q ) + kq ≤ R ( p, Q ) , k > 0 , (14) and the ob jective is max q . Assume the optimal solution satisfies q ∗ ( Q ) > 0. Step 1: the reven ue maximization problem attains a maximizer. Let ˜ p ∈ P ( Q ) (nonempt y b y assumption) and define ˜ R := R ( ˜ p, Q ) ≥ 0. By (A2), there exists ¯ p > 0 suc h that for all p ≥ ¯ p , R ( p, Q ) ≤ ˜ R. (15) Define the truncated feasible set P ¯ p ( Q ) := P ( Q ) ∩ [0 , ¯ p ] . Because P ( Q ) is closed, P ¯ p ( Q ) is closed, and since [0 , ¯ p ] is com pact, P ¯ p ( Q ) is compact. By (A1), R ( · , Q ) is con tinuous on P ¯ p ( Q ), hence b y the W eierstrass extreme v alue theorem there exists p max ∈ P ¯ p ( Q ) such that R ( p max , Q ) = max p ∈P ¯ p ( Q ) R ( p, Q ) . 32 Moreo ver, (15) implies that for an y p ∈ P ( Q ) with p ≥ ¯ p , R ( p, Q ) ≤ ˜ R ≤ max p ∈P ¯ p ( Q ) R ( p, Q ) = R ( p max , Q ) , so p max is also a maximizer o v er the full set P ( Q ). Therefore, p max ∈ arg max p ∈P ( Q ) R ( p, Q ) , and the argmax set is nonempty . Step 2: in the expansion problem, any optimal price m ust maximize rev enue. Let ( p ∗ , q ∗ ) b e an optimal solution of the single-p eriod problem with q ∗ > 0. W e first sho w the financial constrain t (14) binds at ( p ∗ , q ∗ ). Supp ose instead it is slack: C ( Q ) + kq ∗ < R ( p ∗ , Q ) . Then there exists δ > 0 such that C ( Q ) + k ( q ∗ + δ ) ≤ R ( p ∗ , Q ), hence ( p ∗ , q ∗ + δ ) remains feasible (since p ∗ ∈ P ( Q ) and q ∗ + δ ≥ 0) and ac hieves a strictly larger ob jective v alue, contradicting optimalit y . Therefore, C ( Q ) + kq ∗ = R ( p ∗ , Q ) . (16) No w tak e any p ∈ P ( Q ). The maximum feasible expansion at price p is ˆ q ( p ) := max n q ≥ 0 : C ( Q ) + k q ≤ R ( p, Q ) o = max 0 , R ( p, Q ) − C ( Q ) k . Because q ∗ > 0, w e ha ve R ( p ∗ , Q ) > C ( Q ) by (16), and hence ˆ q ( p ∗ ) = ( R ( p ∗ , Q ) − C ( Q )) /k . On the region where R ( p, Q ) ≥ C ( Q ), the map p 7→ ˆ q ( p ) is an increasing affine transformation of p 7→ R ( p, Q ). Consequently , if there existed p ′ ∈ P ( Q ) suc h that R ( p ′ , Q ) > R ( p ∗ , Q ), then ˆ q ( p ′ ) > ˆ q ( p ∗ ) = q ∗ , implying the feasible pair ( p ′ , ˆ q ( p ′ )) ac hieves strictly larger ob jective v alue than ( p ∗ , q ∗ ), a con tradiction. Hence no feasible price can yield strictly higher reven ue than p ∗ , i.e. p ∗ ( Q ) ∈ arg max p ∈P ( Q ) R ( p, Q ) . This prov es the claim. 8.2 Theorem 2: Existence and uniqueness of the long-run capacity limit Pr o of. Recall that, under the in tegrated form ulation and given the optimal pricing rule from The- orem 1, the optimal single-perio d expansion satisfies q ∗ ( Q ) = R ( Q ) − C ( Q ) k , where R ( Q ) := R ( p ∗ ( Q ) , Q ) denotes the maximized p er-p eriod VREC reven ue at state Q . Hence q ∗ ( Q ) = 0 if and only if R ( Q ) = C ( Q ) . (17) By assumption, there exists Q † suc h that the renewable deliverabilit y constrain t is non-binding for all Q ≥ Q † . Therefore, for all Q ≥ Q † , the optimal price is giv en b y the unconstrained in terior solution from Theorem 1, p ∗ ( Q ) = e ( Q ) ϵ , 33 and thus demand is constan t at D p ∗ ( Q ) e ( Q ) = D 1 ϵ = M e − 1 . Consequen tly , for all Q ≥ Q † , R ( Q ) = p ∗ ( Q ) D p ∗ ( Q ) e ( Q ) = e ( Q ) ϵ · M e − 1 = M e ϵ e ( Q ) . (18) Define the function F ( Q ) := R ( Q ) − C ( Q ) , Q ≥ Q † . Under (18), for Q ≥ Q † w e can write F ( Q ) = M e ϵ e ( Q ) − C ( Q ) . (19) By the main tained regularit y of primitiv es (in particular, con tinuit y of e ( · ) and C ( · )), F is con tin- uous on [ Q † , ∞ ). Existence. The feasibility condition in the theorem is precisely C ( Q † ) ≤ M e ϵ e ( Q † ) , whic h is equiv alen t to F ( Q † ) ≥ 0. Moreov er, since C ( Q ) → + ∞ as Q → ∞ and R ( Q ) is finite for eac h finite Q (in particular, R ( Q ) = M eϵ e ( Q ) for Q ≥ Q † ), we hav e lim Q →∞ F ( Q ) = lim Q →∞ M e ϵ e ( Q ) − C ( Q ) = −∞ . Therefore there exists ¯ Q ≥ Q † suc h that F ( ¯ Q ) < 0. Since F is contin uous on [ Q † , ¯ Q ] and satisfies F ( Q † ) ≥ 0 and F ( ¯ Q ) < 0, the In termediate V alue Theorem implies the existence of some Q ∗ ∈ [ Q † , ¯ Q ] such that F ( Q ∗ ) = 0. By (17), this is equiv alent to q ∗ ( Q ∗ ) = 0. Uniqueness. F or all Q ≥ Q † , (19) holds. Since C ( Q ) is strictly increasing on [ Q † , ∞ ) and M eϵ e ( Q ) is fixed giv en e ( Q ), it follo ws that F ( Q ) is strictly decreasing on [ Q † , ∞ ) whenev er e ( Q ) is w eakly decreasing on this region (whic h is the natural case as renew able p enetration reduces grid-a verage emissions intensit y). In that case, F can cross zero at most once, so the solution Q ∗ is unique. Equiv alently , uniqueness can b e shown directly by con tradiction: supp ose there exist Q 1 , Q 2 ≥ Q † with Q 1 < Q 2 suc h that F ( Q 1 ) = F ( Q 2 ) = 0. Then M e ϵ e ( Q 1 ) − C ( Q 1 ) = M e ϵ e ( Q 2 ) − C ( Q 2 ) . Rearranging yields C ( Q 2 ) − C ( Q 1 ) = M e ϵ e ( Q 2 ) − e ( Q 1 ) . The left-hand side is strictly p ositive b ecause C ( · ) is strictly increasing, while the right-hand side is non-p ositiv e if e ( · ) is weakly decreasing, a contradiction as e ( · ) by definition is a decreasing function. Hence there can b e at most one Q ∗ ≥ Q † solving F ( Q ) = 0. Characterization. Finally , by (18) and (17), an y Q ∗ ≥ Q † suc h that q ∗ ( Q ∗ ) = 0 must satisfy C ( Q ∗ ) = R ( Q ∗ ) = M e ϵ e ( Q ∗ ) , whic h is exactly (6). Con versely , any Q ≥ Q † satisfying (6) yields F ( Q ) = 0 and therefore q ∗ ( Q ) = 0. This establishes existence, uniqueness, and the stated c haracterization. 34 8.3 Theorem 3: Optimal Myopic Policy Pr o of. Fix an y feasible p olicy P := { q P t , p P t } t ≥ 0 satisfying the No overbuild requirement 0 ≤ q P t ≤ Q ⋆ − Q P t for all t ≥ 0 , and let { Q P t } t ≥ 0 denote the induced state path under the transition Q P t +1 = Q P t + q P t . Define ¯ q ( Q ) and S ( Q ) = Q + ¯ q ( Q ) as in (7). By definition of ¯ q ( Q ) as the maximal fe asible one-step expansion at state Q , feasibilit y of P implies q P t ≤ ¯ q ( Q P t ) for all t ≥ 0 . (20) Indeed, for eac h t , ( p P t , q P t ) is a feasible pair at state Q P t , and ¯ q ( Q P t ) is the suprem um of feasible q at that state; hence (20) holds. No w define the m yopic p olicy by q my o t = min { ¯ q ( Q my o t ) , Q ⋆ − Q my o t } , Q my o t +1 = Q my o t + q my o t . Equiv alently , Q my o t +1 = min { Q my o t + ¯ q ( Q my o t ) , Q ⋆ } = min { S ( Q my o t ) , Q ⋆ } . (21) W e pro ve by induction that, for all t ≥ 0, Q my o t ≥ Q P t . (22) Base case ( t = 0 ). By assumption b oth tra jectories start from the same initial condition, hence Q my o 0 = Q P 0 = Q init , so (22) holds for t = 0. Inductiv e st ep. Fix an y t ≥ 0 and assume as induction h yp othesis that (22) holds at time t , i.e., Q my o t ≥ Q P t . W e sho w it holds at time t + 1. First, combining the transition equation with (20) yields Q P t +1 = Q P t + q P t ≤ Q P t + ¯ q ( Q P t ) = S ( Q P t ) . (23) Second, by (21), Q my o t +1 = min { S ( Q my o t ) , Q ⋆ } . (24) By the induction hypothesis Q my o t ≥ Q P t and the assumed Monotone r e achability (i.e. S is non- decreasing on [ Q init , Q ⋆ )), we hav e S ( Q my o t ) ≥ S ( Q P t ) . (25) Applying the (component wise) monotonicit y of the map x 7→ min { x, Q ⋆ } to (25) gives min { S ( Q my o t ) , Q ⋆ } ≥ min { S ( Q P t ) , Q ⋆ } . (26) 35 Com bining (24) with (26) yields Q my o t +1 ≥ min { S ( Q P t ) , Q ⋆ } . (27) Finally , from (23) and the same monotonicit y of x 7→ min { x, Q ⋆ } , we obtain min { S ( Q P t ) , Q ⋆ } ≥ min { Q P t +1 , Q ⋆ } . (28) Putting (27) and (28) together, Q my o t +1 ≥ min { Q P t +1 , Q ⋆ } . (29) A t this p oin t, w e in vok e No overbuild for p olicy P : since 0 ≤ q P t ≤ Q ⋆ − Q P t , Q P t +1 = Q P t + q P t ≤ Q P t + ( Q ⋆ − Q P t ) = Q ⋆ , hence min { Q P t +1 , Q ⋆ } = Q P t +1 . Substituting into (29) yields Q my o t +1 ≥ Q P t +1 , whic h is exactly (22) at time t + 1. This completes the induction. Therefore, (22) holds for all t ≥ 0. Global optimality . The p er-p eriod stage cost is − q t , so minimizing total discounted (or undis- coun ted) stage cost is equiv alen t to maximizing cumulativ e expansion P t q t un til the pro cess reac hes Q ⋆ . Since Q t +1 = Q t + q t , the dominance result (22) implies that the my opic p olicy reac hes any giv en intermediate capacity lev el w eakly earlier than any feasible p olicy and, in particular, reaches Q ⋆ in weakly fewer p erio ds whenever Q ⋆ is reachable. Hence the my opic p olicy yields w eakly larger cumulativ e expansion at ev ery finite horizon and therefore is globally optimal among feasible p olicies. 8.4 Prop ositions with Optimal Reven ue Sharing Pr o of of Pr op osition 3. Fix a state Q and abbreviate e := e ( Q ), f := f ( Q ), C 1 ( q ) := C 1 ( Q, q ) = C S ( Q ) + k q , C 2 := C 2 ( Q ), and R ( p ) := R ( p, Q ). Rewrite (10) in standard ≤ 0 form: h 1 ( p, q , γ ) := D p e − f ≤ 0 , h 2 ( p, q , γ ) := C 1 ( q ) − (1 − γ ) R ( p ) ≤ 0 , h 3 ( p, q , γ ) := C 2 − γ R ( p ) ≤ 0 , h 4 ( p, q , γ ) := − q ≤ 0 , h 5 ( p, q , γ ) := − p ≤ 0 , h 6 ( p, q , γ ) := − γ ≤ 0 , h 7 ( p, q , γ ) := γ − 1 ≤ 0 . Let multipliers ( λ, µ, θ , ν, η , α, β ) ≥ 0 correspond to ( h 1 , . . . , h 7 ), resp ectiv ely . The Lagrangian is L ( p, q , γ ) = q − λh 1 − µh 2 − θ h 3 − ν h 4 − η h 5 − αh 6 − β h 7 . Using D ′ ( x ) = − ϵD ( x ) and R p ( p ) = D ( p/e ) 1 − ϵp/e , stationarity gives: ∂ L ∂ q = 0 ⇐ ⇒ 1 − µk + ν = 0 , (30) ∂ L ∂ p = 0 ⇐ ⇒ λ ϵ e D p e + ( µ (1 − γ ) + θγ ) R p ( p ) + η = 0 , (31) ∂ L ∂ γ = 0 ⇐ ⇒ − µR ( p ) + θR ( p ) + α − β = 0 . (32) 36 Primal feasibility , dual feasibilit y , and complemen tary slac kness are: D ( p/e ) ≤ f , C 1 ( q ) ≤ (1 − γ ) R ( p ) , C 2 ≤ γ R ( p ) , q , p ≥ 0 , γ ∈ [0 , 1] , (33) λ, µ, θ , ν, η , α, β ≥ 0 , (34) λ ( D ( p/e ) − f ) = 0 , µ ( C 1 ( q ) − (1 − γ ) R ( p )) = 0 , θ ( C 2 − γ R ( p )) = 0 , (35) ν q = 0 , η p = 0 , αγ = 0 , β ( γ − 1) = 0 . (36) Assume the optimal solution exhibits strictly p ositiv e expansion q ∗ ( Q ) > 0. Then ν ∗ = 0 by (36), and (30) implies µ ∗ = 1 k > 0 . (37) Moreo ver, as in the in tegrated b enchmark, if C 1 ( q ∗ ) < (1 − γ ∗ ) R ( p ∗ ), then one can increase q sligh tly while keeping ( p ∗ , γ ∗ ) fixed and all constraints feasible, contradicting optimalit y . Hence the op erator accoun t constrain t binds: C 1 ( q ∗ ) = (1 − γ ∗ ) R ( p ∗ ) . (38) No w consider the c hoice of γ . Case 1: C 2 ≤ 0 . Then for an y ( p, q ) with R ( p ) ≥ 0 and an y γ ≥ 0, C 2 ≤ 0 ≤ γ R ( p ) , so the generator-viabilit y constraint h 3 ≤ 0 is slack at γ = 0. Th us θ ∗ = 0 b y complemen tary slac kness (35). Because q ∗ > 0 forces R ( p ∗ ) > 0 (otherwise (38) cannot hold with C 1 ( q ∗ ) > 0), the slac kness of h 3 at γ = 0 implies that setting γ = 0 is feasible for generators. W e now show γ ∗ = 0 is optimal. T ake any feasible solution with γ > 0 and the same ( p, q ). Decreasing γ w eakly increases (1 − γ ) R ( p ) and therefore relaxes (10c) while lea ving (10b) unc hanged; since C 2 ≤ 0, (10d) remains satisfied at γ = 0. Hence the feasible set in ( p, q ) w eakly expands as γ decreases, and the ob jectiv e max q cannot b e improv ed by c ho osing γ > 0. Therefore γ ∗ ( Q ) = 0, consisten t with (11). Case 2: C 2 > 0 and γ ∗ ( Q ) ∈ (0 , 1) . If γ ∗ ∈ (0 , 1), then the b ound constraints on γ are slac k, hence α ∗ = β ∗ = 0 by (36). Stationarity in γ , (32), giv es ( − µ ∗ + θ ∗ ) R ( p ∗ ) = 0 . Since q ∗ > 0 and (38) imply R ( p ∗ ) > 0, we conclude θ ∗ = µ ∗ = 1 k > 0 . (39) Because θ ∗ > 0, complementary slackness in (35) implies the generator-viabilit y constrain t binds: C 2 = γ ∗ R ( p ∗ ) . Equiv alently , γ ∗ = C 2 R ( p ∗ ) . Finally , ev aluating at the expansion-maximizing price in the integrated b enc hmark p ∗ ( Q ) and letting R ∗ ( Q ) := R ( p ∗ ( Q ) , Q ) yields γ ∗ ( Q ) = C 2 ( Q ) R ∗ ( Q ) . Com bining with the previous case C 2 ( Q ) ≤ 0 ⇒ γ ∗ ( Q ) = 0 prov es (11). 37 Pr o of of Pr op osition 4. Fix Q and supp ose the optimal rev enue-sharing c hoice is in terior, γ ∗ ( Q ) ∈ (0 , 1), and the optimal expansion is strictly positive, q ∗ ( Q ) > 0. Using the KKT system developed ab o v e, in teriorit y implies α ∗ = β ∗ = 0 (slack b ounds on γ ), and q ∗ > 0 implies ν ∗ = 0. Step 1: Both separated financial constrain ts bind. F rom q ∗ ( Q ) > 0, the same argumen t as in (38) yields that the op erator account constrain t binds: C 1 ( Q, q ∗ ) = (1 − γ ∗ ) R ( p ∗ , Q ) , and hence µ ∗ > 0. F rom the γ -stationarity (32) with α ∗ = β ∗ = 0 we obtain ( θ ∗ − µ ∗ ) R ( p ∗ , Q ) = 0. Because q ∗ > 0 implies R ( p ∗ , Q ) > 0, it follows that θ ∗ = µ ∗ > 0, so θ ∗ > 0. By complemen tary slac kness for h 3 in (35), θ ∗ > 0 implies the generator-viability constrain t binds: C 2 ( Q ) = γ ∗ R ( p ∗ , Q ) . Therefore, at an interior optim um, C 1 ( Q, q ∗ ) = (1 − γ ∗ ) R ( p ∗ , Q ) , C 2 ( Q ) = γ ∗ R ( p ∗ , Q ) . (40) Step 2: Aggregation yields the integrated financial constrain t. Adding the tw o equalities in (40) giv es C 1 ( Q, q ∗ ) + C 2 ( Q ) = R ( p ∗ , Q ) . Recalling C 1 ( Q, q ) = C S ( Q ) + k q and C 2 ( Q ) = C R ( Q ) − f ( Q ) π ( Q ), the left-hand side is exactly C S ( Q ) + C R ( Q ) − f ( Q ) π ( Q ) + k q ∗ = C ( Q ) + kq ∗ , so we obtain the in tegrated financial feasibility constrain t C ( Q ) + kq ∗ = R ( p ∗ , Q ) . (41) Step 3: The pricing problem reduces to the in tegrated b enc hmark. The deliverabilit y constrain t (10b) is identical to that in the integrated form ulation. Under q ∗ > 0, (41) implies that maximizing q is equiv alent to maximizing R ( p, Q ) ov er deliverable p , exactly as in the integrated b enc hmark. Hence the optimal price under rev enue sharing coincides with the in tegrated optimal price: p RS ( Q ) = p ∗ ( Q ) . Substituting p RS ( Q ) = p ∗ ( Q ) into (41) yields the same optimal expansion as in the integrated b enc hmark: q RS ( Q ) = R ( p RS ( Q ) , Q ) − C ( Q ) k = R ( p ∗ ( Q ) , Q ) − C ( Q ) k = q ∗ ( Q ) . Step 4: Multi-p eriod implications. Whenev er γ ∗ ( Q ) ∈ (0 , 1) holds along the realized capacit y path, the p er-p eriod feasible set in ( p, q ) under (10) coincides with that of the in tegrated b enc h- mark b ecause (41) is equiv alent to the single integrated financial constrain t and deliv erability is unc hanged. Therefore the induced one-step expansion map ¯ q ( Q ) and reachabilit y map S ( Q ) are iden tical under the tw o form ulations along that path. All m ulti-p eriod results that depend only on these p er-p eriod ob jects (including Theorems 1, 2, and 3) carry o ver. 38 9 App endix B: Sim ulation Setup 9.1 ISO-NE test system Our numerical study is conducted on a modified ISO New England (ISO-NE) test system. In gen- eral, ISO-NE is the regional transmission organization resp onsible for op erating the electric grid and wholesale electricity markets across the six New England states. It pro vides a useful benchmark for sim ulation because it represen ts a transmission-constrained, multi-zone p o wer system with ge- ographically differentiated generation, demand, and congestion patterns. In mark et-design studies, ISO-NE-st yle test systems are often used to capture the interaction betw een netw ork constraints, no dal or zonal prices, generator dispatc h, and the integration of renew able and storage resources. The sp ecific en vironment adopted here follows the mo dified 8-zone ISO-NE test system used in Qi and Xu [2025]. In that setup, the system con tains 8 no des, 12 transmission lines, and 76 thermal generators, with a total installed conv en tional capacity of 23.1 GW and an a v erage load of 13 GW. As emphasized b y Qi and Xu [2025], this is an agen t-based market simulation en vironment with m ultiple renew able and storage units, in tended as a transferable testb ed rather than a result that dep ends uniquely on ISO-NE. F rom a mo deling p ersp ectiv e, the net work is represented through a DC optimal p o w er flow and economic dispatch structure. The dispatc h includes system-wide pow er balance, transmission flo w limits, generator operating limits, reserv e requiremen ts, ramping constrain ts, and storage c harging/discharging and state-of-charge dynamics. In the notation of Qi and Xu [2025], the core system consists of sets of con ven tional generators, storages, time p eriods, no des, and lines, with no dal prices defined through the lo cational marginal price (LMP) expression induced b y the dual v ariables of the dispatch problem. 9.2 Baseline mark et-dispatc h framework The simulation en vironment follo ws the market-dispatc h framework dev elop ed for studying storage bidding and bid b ounds under uncertain t y . The framework contains three related dispatc h lay ers. First, it define an Oracle Economic Dispatch (OED) b enc hmark, whic h assumes p erfect foresight of demand and renew able profiles o ver a m ulti-p erio d horizon. This benchmark is not intended to be implemen table in practice; rather, it serv es as the ideal reference against which storage opp ortunit y costs and truthful bids are conceptually defined. Second, it in tro duce a Single-P erio d Economic Dispatc h (SED) formulation for real-time op er- ation. This is the op erational dispatch used when storage submits charge and dischar ge bids in eac h time step. In this setting, the previous-p erio d state of charge is treated as giv en, and the mar- k et clears storage and generator dispatc h sub ject to pow er balance, net work limits, and operating constrain ts. Third, to model uncertaint y explicitly , it dev elop a Chance-Constrained Economic Dispatch (CED). This reformulation incorp orates net-load uncertaint y through chance constrain ts, allo wing the system op erator to choose a confidence lev el and thereb y internalize both uncertaint y and risk preference in to the resulting storage bid b ounds. Their main theoretical result is that the storage opp ortunit y v alue deriv ed from the c hance- constrained formulation provides a probabilistic upp er b ound on truthful storage marginal costs. 9.3 Grid Prop erties and Simulation Settings Figure 2 presents four summary plots, summarizing the key empirical relationships in the ISO-NE sim ulation en vironmen t that inform the functional structure assumed in our mo del. 39 Figure 2: Grid-prop ert y visualization for the ISO-NE test system. Subfigure 1 sho ws the carb on in tensity of the grid when op erational prediction error and uncertain ty are incorp orated, while Sub- figure 2 shows the corresp onding relationship under p erfect prediction for comparison. Subfigure 3 rep orts effective renewable output as a function of installed wind capacity , accoun ting for cur- tailmen t, and exhibits the broadly concav e pattern assumed in the mo del. Subfigure 4 shows the wholesale market price received b y renewable generation (wind) as wind capacity increases. This relationship is monotonically decreasing but neither globally con vex nor concav e, highligh ting the nonlinear effects of uncertaint y and market-clearing dynamics in the p o wer system. 40 T able 4: Baseline parameters and cost-function sp ecification. P arameter Unit Remarks Q 0 = 0 . 5 GW Initial renewable capacity in the baseline n u- merical simulation; sample initial condition. F or reference, the current ISO-NE stage is ap- pro ximately 5 . 0 GW in the corresponding scaled in terpretation. M = 10 GW Mark et size, interpreted as the p eak demand of the mo deled utility . ϵ = 0 . 0045 N/A Demand sensitivit y parameter used in the vol- un tary procurement sp ecification. k = 1000 M $ /GW (or $ /kW) Renewable installation cost parameter. Since 1000 M $ /GW = 1000 $ /kW, the tw o units are equiv alent. wind cf = 0 . 35 N/A Wind capacity factor 35% used to conv ert in- stalled wind capacit y into effective energy pro- duction. α R = 0 . 015 × 1400 = 21 M $ /GW · yr Baseline ann ual O&M cost coe fficien t in the re- new able cost function c R ( Q ). 15% of previ- ous renewable capacity , whic h has $ 1400/kW, higher than future expansions. β R = 5 M $ /GW 2 · yr Con vexit y co efficien t in the renewable cost func- tion, capturing site-quality depletion as renew- able capacity expands. c R ( Q ) = α R Q + β R Q 2 M $ /yr Renew able op erating cost function. Includes ann ual op erating cost only , with increasing marginal cost as Q rises. α S = 0 . 08 × 120 = 9 . 6 M $ /GW · yr Effectiv e annualized system cost co efficient in c S ( Q ), motiv ated b y storage scaling one-to-one with wind capacit y and assuming an 8% ann ual pa yment on a battery cost of 120 M $ /GWh with 4-hour duration. β S = 1 M $ /GW 2 · yr Con vexit y co efficient in the system cost func- tion, representing gradually harder system in- tegration at higher renewable p enetration. c S ( Q ) = α S Q + β S Q 2 M $ /yr System cost function. Captures the effectiv e an- n ual cost of supp orting renewable in tegration, including storage-related system costs. 41
Original Paper
Loading high-quality paper...
Comments & Academic Discussion
Loading comments...
Leave a Comment