Measuring outage resilience in a distribution system with the number of outages in large events
We develop LENORI, a Large Event Number of Outages Resilience Index measuring distribution system resilience with the number of forced line outages observed in large extreme events. LENORI is calculated from standard utility outage data. The statisti…
Authors: Arslan Ahmad, Ian Dobson
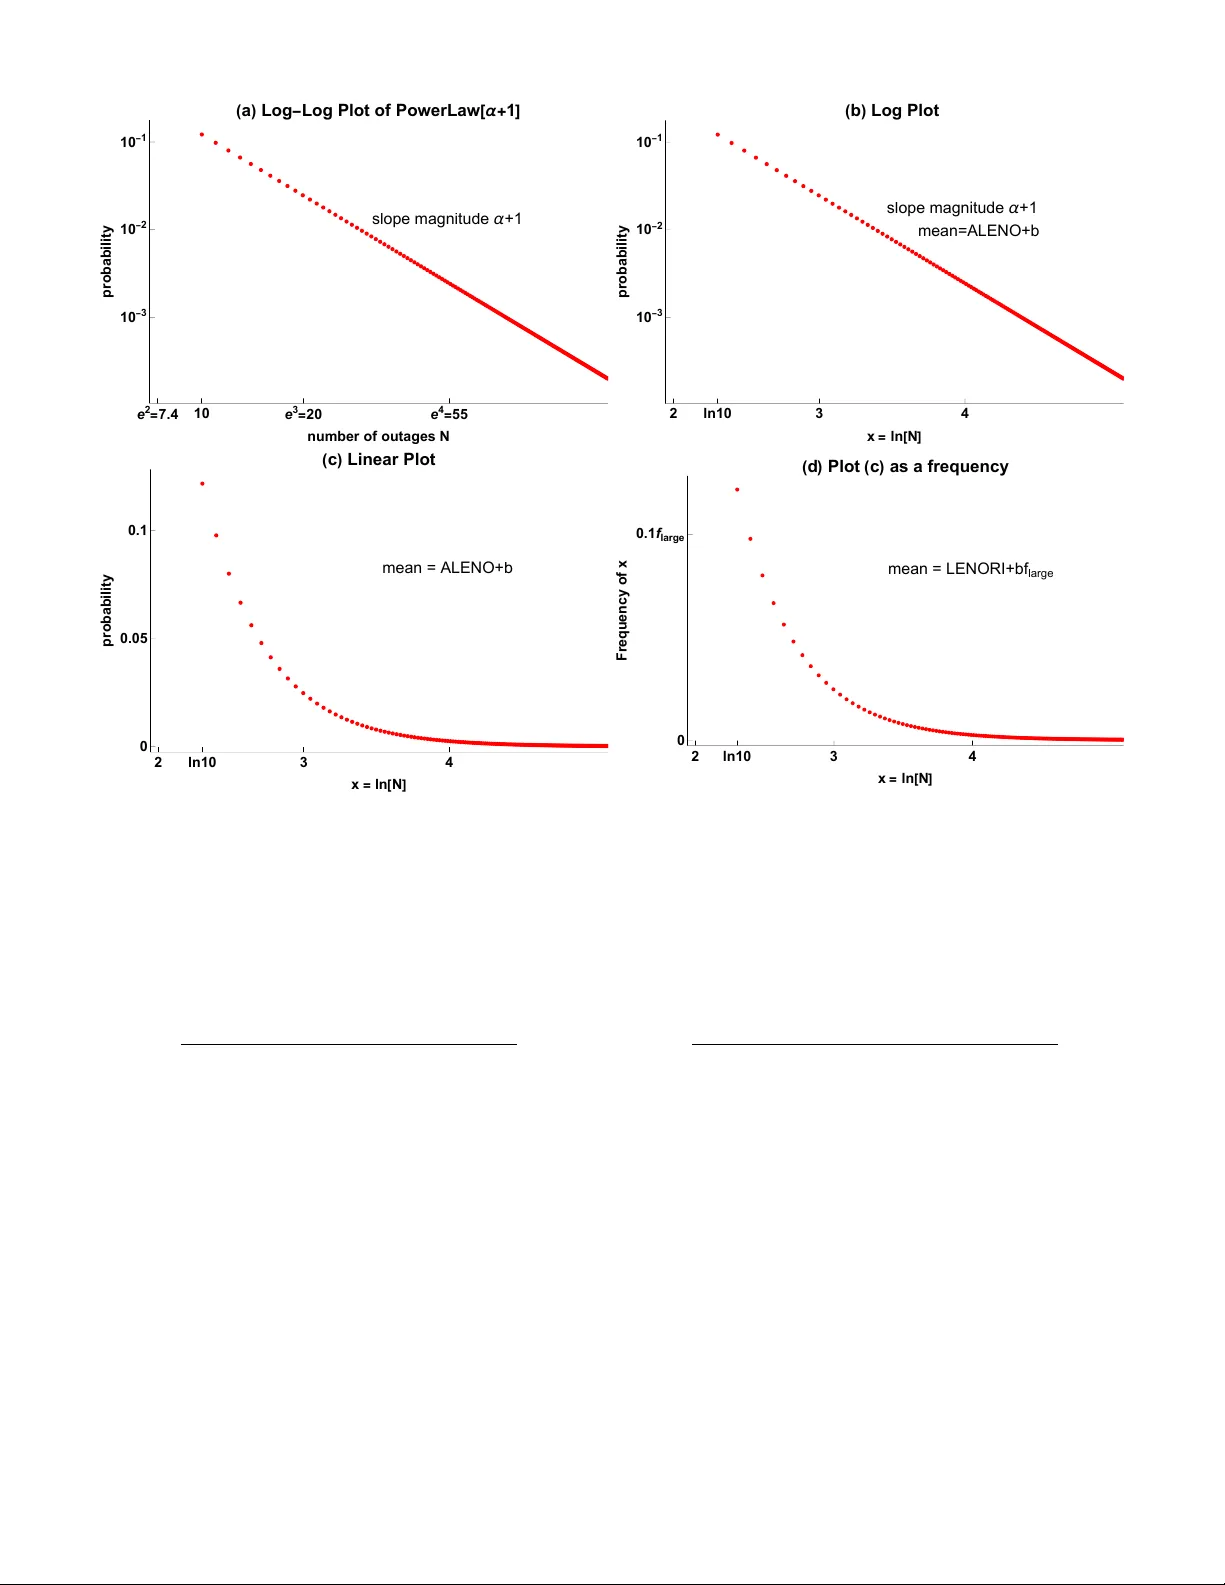
Author preprint March 2026 Measuring outage resilience in a distrib ution system with the number of outages in lar ge e v ents Arslan Ahmad Iow a State Univ ersity arslan@iastate.edu Ian Dobson Iow a State Univ ersity dobson@iastate.edu Abstract —W e develop LENORI, a Large Event Number of Outages Resilience Index measuring distribution system r e- silience with the number of for ced line outages observed in large extreme ev ents. LENORI is calculated from standard utility outage data. The statistical accuracy of LENORI is ensured by taking the logarithm of the outage data. A related A verage Large Event Number of Outages metric ALENO is also developed, and both metrics are applied to a distribution system to quantify the power grid strength relati ve to the extreme ev ents stressing the grid. The metrics can be used to track resilience and quantify the contributions of v arious types of hazards to the overall r esilience. Index T erms —Resilience metric, outages, blackouts, extr eme events, weather , distribution system reliability , pr obability , risk I . I N T R O D U C T I O N There are very many useful aspects of electric po wer system resilience, e.g. as described in [1], [2], [3], but here we are concerned with outage resilience, which considers the power system strength with respect to extreme e vents in terms of the total number of resulting forced outages. In particular, we show how to quantify the outage resilience with new metrics that can be practically computed from the outage data currently collected by distribution utilities. This is done with a novel L arge E vent N umber of O utages R esilience I ndex LENORI measuring the resilience of the power system infrastructure in terms of the number of forced line outages observed in large extreme events. Distinctiv e attributes of LENORI are: • LENORI mitigates the challenges of the rarity and v ari- ability of the number of outages in large resilience ev ents by using a logarithmic transformation. This ensures that LENORI can be practically calculated with reasonable statistical accuracy from a few years of data. • LENORI responds to both the frequency and magnitude of extreme events. • LENORI can be readily calculated from the standard utility outage data that is used to calculate SAIDI. W e also introduce a related metric which is the A verage L arge E vent N umber of O utages ALENO metric and show that LENORI is ALENO multiplied by the large event frequency . Support from USA NSF grants 2153163, 2429602, Argonne National Laboratory , and PSerc project S110 is gratefully acknowledged. I I . L I T E R A T U R E R E V I E W Quantitativ e resilience metrics often describe the dimensions, slopes, and areas of a performance curve, which tracks a resilience measure ov er time over the course of a resilience ev ent [3], [4], [5], [6], [7]. The metrics describe number of outages, number of customers disconnected, outage and restore rates, durations, nadirs, and the area under the resilience curve. This paper only addresses the total number of outages in an ev ent. In distribution systems, the approximate power law in the probability distribution of number of outages in large e vents was noted in [8]. Power laws in other quantities correlated with the number of outages have also been observed, such as customer minutes interrupted and customer costs [9], [10]. Indeed, this paper has a useful parallelism with [10] in that [10] presents quite similar metrics based on customer minutes interrupted rather than number of outages. In addition to describing a different facet of resilience, a salient difference with [10] is that the number of outages is a discrete quantity whereas customer minutes can be considered as continuous. In transmission systems, the 2018 preprint [11] discovered the power law in the distribution of the number of generations of outages, and proposed a System Event Propagation Index SEPSI to measure the absolute slope of the power law . Fiv e years of comprehensiv e North American transmission line outage data collected by NERC sho w a power law in the distribution of the number of outages [7]. There are v arious types and sev erity of infrastructure dam- age, many of which cause a line outage. The forced line outages in an extreme e vent can be regarded as an indicator summarizing the amount of damage rather than directly listing the indi vidual damaged components. Recording or estimating the various types of damage is of course valuable [2], but it does not track the damage in a single quantity that is easily computed and analyzed, whereas the number of line outages in an event can readily be extracted from routine utility records, and the subsequent calculation of metrics is straightforward. I I I . U T I L I T Y DAT A , O U TAG E S , A N D E V E N T S Standard outage data recorded by distribution utilities in- clude the start time and end time of each outage to the nearest minute and other information such as cause codes. The outage data is often collected by an outage management system. The outage data for this paper is a confidential dataset from a distribution utility in the Northeastern USA. W e extract from the outage data resilience ev ents in which outages bunch up and overlap in time according to the algo- rithm based on timing in [12]. The events range in size from single outages to large events with tens or hundreds of outages caused by extreme weather . The number of outages in the i th ev ent is denoted by N i . There are some choices about which outages to count. W e only consider the forced outages, and momentary outages are included. I V . D E FI N I N G L E N O R I A N D A L E N O This section introduces the L arge E vent N umber of O utages R esilience I ndex LENORI and its associated A verage L arge E vent N umber of O utages ALENO metric. T o define large e vents in terms of number of outages, we set a threshold of the minimum number of outages in a large ev ent as N L . That is, a lar ge ev ent has a number of outages N ≥ N L . The way that N L is chosen influences the interpretation and use of LENORI, and is discussed in section V -F. Suppose there are n large large ev ents over a period of n year years, with respective numbers of outages N 1 , N 2 , ..., N n large . Then we define LENORI as LENORI = 1 n year n large X i =1 ln N i N L − 0 . 5 (1) The normalization by n year in (1) makes LENORI an annual index to allow comparison between metrics calculated from outage data collected ov er different numbers of years. It is also useful to define the ALENO metric as ALENO = 1 n large n large X i =1 ln N i N L − 0 . 5 (2) The annual frequency of large ev ents is f large = n large n year (3) Then we can see from (1), (2), (3) that LENORI = f large ALENO (4) LENORI depends on both the frequency of large e vents and the size of large ev ents. In particular , LENORI is directly pro- portional to large ev ent frequency f large whereas ALENO only responds to the size of large e vents. Indeed, ALENO is pro- portional to the av erage order of magnitude of large event size. If the weather sev erity increases or the grid infrastructure weakens, the number of outages in indi vidual large events increase and ALENO and LENORI increase. That is, these metrics respond to changes in the infrastructure strength rela- tiv e to the weather severity . In particular, if large events hav e 10% more outages, then ALENO increases by ln 1 . 1 = 0 . 095 , and LENORI increases by f large (ln 1 . 1) . If ev ents just belo w the large e vent threshold N L also have 10% more outages, then the increase in LENORI can be larger than f large (ln 1 . 1) because events with number of outages between 0.9 N L and 1 5 10 50 100 500 1000 5 × 10 - 4 0.005 0.050 0.500 number of outages N probability Fig. 1. Log-log plot of probability mass function of number of outages. 10 50 100 500 1000 0.001 0.005 0.010 0.050 0.100 large event number of outages N probability Fig. 2. T ail of probability mass function of Fig. 1 (red dots) and its idealized power law (5) (light gray dots) with α estimated from the tail data. N L become large e vents. Similarly , if a resilience in vestment reduces the number of outages in large e vents by 10%, then ALENO changes by ln 0 . 9 = − 0 . 105 and LENORI changes by f large (ln 0 . 9) . V . L E N O R I A N D A L E N O I N M O R E D E P T H This section explains the basis for LENORI and ALENO in more depth by showing the heavy tails in the distribution of the number of outages, how ALENO characterizes the tail, and how logarithmic transformation mitigates the problem caused by the heavy tails of excessiv e variability in the metrics. A. Pr obability mass function of number of outages Fig. 1 shows the log-log plot of the probability mass func- tion of the number of outages in all ev ents for the distribution system. T o determine the resilience and the statistical behavior , we now focus on the large e vents in the tail of this distribution. B. Linear appr oximation to the power law tail This subsection relates ALENO to the slope of the tail of the probability mass function for the number of outages. Since we are interested in characterizing the tail of the probability mass function, we select only the tail ev ent data with N ≥ N L . The empirical distribution of N conditioned on N ≥ N L is plotted on a log-log scale in Fig. 2. The tail in Fig. 2 is approximately a straight line, and thus has approximate power -law beha vior . The exact idealized po wer la w beha vior is described by a discrete power la w distribution P with probability mass function f P ( n ) = 1 ζ ( α + 1 , N L ) n − ( α +1) , n = N L , N L + 1 , N L + 2 , ... (5) where ζ ( α + 1 , N L ) = ∞ X n = N L n − ( α +1) is the Hurwitz zeta function. The power law distribution (5) is sometimes referred to as a zeta or Zipf or discrete Pareto distribution. The slope magnitude of (5) on the log-log plot in Fig. 2 is α + 1 , as can be verified by taking the logarithm of (5). α is called the tail index 1 . Then, according to Clauset [13], the maximum likelihood estimate of the tail index α is well approximated by α = " 1 k k X i =1 ln N i N L − 0 . 5 # − 1 = 1 ALENO (6) for N L ≥ 6 . This important relation between ALENO and the tail index α shows how ALENO describes the tail of the probability mass function of direct interest to resilience risk. The tail index and ALENO capture the linear trend of the large e vent sizes, and this trend, if extrapolated, governs the blackouts that are larger than the largest blackout that has so far been observed. There is considerable inherent uncertainty in extrapolating beyond the largest observed blackout, but giv en the dominant risk of the largest possible blackouts, it does seem better to try to approximately account for this risk rather than ignoring it. Since ALENO is a factor of LENORI as shown in (4), LENORI also incorporates the linear trend of the large event sizes on the log-log plot. C. Log transformation converts heavy tail to light tail If we take logarithm of the idealized tail data and define X = ln P then X has the following probability mass function with parameter α + 1 : f X ( x ) = 1 ζ ( α + 1 , N L ) e − ( α +1) x , x = ln N L , ln( N L + 1) , ln( N L + 2) , ... (7) X can be regarded as a discrete form of the exponential distribution with support on the logarithms of integers ≥ N L . Since exponential distributions are light tailed, this shows that the logarithm of the heavy-tailed power law data with slope magnitude α + 1 has a light-tailed distribution with parameter α + 1 ; also see Fig. 3. 1 For a continuous distribution the tail index α is the absolute slope of the probability exceedance function (CCDF); for the discrete distribution (5), α is the asymptotic absolute slope of its probability exceedance function. The first two moments of X are E[ X k ] = E[(ln P ) k ] = 1 ζ ( α + 1 , N L ) ∞ X n = N L (ln n ) k n − ( α +1) , k = 1 , 2 (8) D. Requir ed number of larg e events and metric variability W e no w estimate the statistical variation of LENORI with its Relative Standard Error RSE LEN , which is the standard deviation of LENORI divided by the mean of LENORI. The statistical variation of LENORI arises from the variability in the number of large e vents and the v ariability in the magnitude of large ev ents. Let the number of lar ge events be the random variable N large . The statistical variation of N large is modeled as Poisson[ n large ] independent of the magnitude of large ev ents. It follows that E N large = V ar N large = n large . For the statistical v ariation in the magnitude of large events, we approximate the tail of the distrib ution with a straight line on the log-log plot so that it follows the Pareto distribution (5). Then LENORI and ALENO can be considered as random variables that combine independent and identically distributed samples X 1 , X 2 , ..., X N large from the log-transformed data (7). Let b = ln( N L − 0 . 5) and let L = n year LENORI = N large X i =1 ( X i − b ) (9) The W ald equation giv es E L = n large (E X − b ) and the Blackwell-Girshick equation giv es V ar L = E N large V ar( X − b ) + (E[ X − b ]) 2 V ar N large (10) = n large E[( X − b ) 2 ] (11) Then RSE LEN = RSE L = p E[( X − b ) 2 ] (E X − b ) √ n large (12) W e also hav e ALENO = 1 N large N large X i =1 ( X i − b ) (13) and RSE ALE = σ ( X ) (E X − b ) √ n large (14) The statistical variability of LENORI calculated from n year years of data is gov erned by the number n large of large ev ents in the n year years. According to (12), to ensure for LENORI a statistical accuracy RSE max LEN so that RSE LEN ≤ RSE max LEN , the minimum number of large events required is n min large = E[( X − b ) 2 ] (E X − b ) 2 (RSE max LEN ) 2 (15) Then the minimum number of years needed for n min large large ev ents is n min year = n min large f all large (16) where f all large is the annual frequency of large ev ents using all the observed years of data. In this paper , we adopt RSE max LEN ≈ 0 . 1 , implying that the standard de viation of an estimate of LENORI is no more than 10% of its mean value. Under reasonable normality assumptions, this indicates that ∼ 68% of the estimates of LENORI lie within 10% of the mean, and that ∼ 90% of the estimates of LENORI lie within 16% of the mean. The v alue of n min year implies that LENORI can be tracked with reasonable statistical accuracy over time with an n min year year sliding window . T able I shows that this is practical for our data with n min year ≈ 2 . E. V ariability of LENORI with no logarithm W e first to try to ev aluate RSE P . Using (5), the moments of P are E[ P k ] = 1 ζ ( α + 1 , N L ) ∞ X n = N L n k n − ( α +1) (17) For k = 1 , the mean E P is infinite for α ≤ 1 . The mean E P exists for α > 1 but is dif ficult to practically compute from limited data for 1 < α < 1 . 5 . Howe ver , for k = 2 and α ≤ 2 as in our data, (17) implies that the variance and standard deviation of P are infinite, and hence RSE P is infinite. Howe ver , this analysis using P is not realistic because (5) indicates that an unbounded number of outages N is possible, whereas in practice N is bounded by a maximum number of outages N max so that N ≤ N max . N max corresponds to a blackout of the entire system. For the distribution system under study , the maximum observed blackout has N maxobs = 1540 outages, and we roughly estimate the largest possible blackout as N max = 5000 . The power law distrib ution (5) conditioned on N ≤ N max is the bounded distrib ution P b with probability mass function f P b ( n ) = f P ( n ) /c , n = N L , N L + 1 , ..., N max , where the renormalization constant 2 c = 1 − ζ ( α + 1 , N max + 1) /ζ ( α + 1 , N L ) . The first two moments of P b for use in computing RSE P b = p E[ P b 2 ] − (E[ P b ]) 2 / E[ P b ] are E[ P b k ] = 1 c ζ ( α + 1 , N L ) N max X n = N L n k n − ( α +1) , k = 1 , 2 . (18) Now remove the logarithm from (1) to consider an index LENnolog = 1 n year n large X i =1 N i N L − 0 . 5 (19) Since RSE does not depend on scaling and using Appendix B of [10], RSE LENnolog = RSE N large X i =1 N i = p 1 + (RSE P b ) 2 √ n large (20) Let n minnolog large be the minimum number of large events needed for LEN nolog to have statistical accuracy RSE max LENnolog = 0 . 1 2 c = 0 . 9997 is close enough to one that it can be neglected. the same as LENORI. Then we can calculate n minnolog large = (1 + (RSE P b ) 2 ) / 0 . 01 . T able I shows n minnolog large and n min large . For the same statistical accuracy , LENnolog requires five times more large e vents than LENORI and more than 11 years to gather enough large ev ents. Thus LENnolog requires an excessiv ely large amount of data for tracking resilience with this utility data. F . Lar ge event thr eshold N L It is intended that the N L threshold for large ev ents is de- termined once and stays fixed thereafter to allow comparisons to be made with metrics using the same threshold. This paper chooses N L so that the linear approximation to the po wer law tail for the large event sizes in subsec- tion V -B is reasonable. This enables the useful interpretation of ALENO − 1 as estimating the tail index of the PMF of the number of outages. This interpretation is significant not only for describing the risk of the largest observed ev ents, but also, when this linear trend is extrapolated, gi ving the best available description (ev en if subject to many uncertainties) of the very substantial risk of blackouts that are larger than those already observed. There is a tradeoff in the choice in that smaller N L giv es more large ev ents and hence shorter observation times for the same statistical accuracy of the metrics, b ut larger N L prev ents the trend for the largest blackouts to potentially be corrupted by more medium size ev ents. The choice of this tradeoff is made here by engineering judgment, but Clauset’ s method [13] could be used to make a more objecti ve tradeof f for the purely statistical considerations. Another consideration to possibly be included is that N L could be chosen as a fixed percentage of a measure of distribution system size such as the number of lines in the system. This would allo w comparison of the metrics between systems of dif ferent sizes, or over time as a system expanded. V I . R E S U LT S T able I shows the utility data, the metrics ALENO and LENORI, and their statistical accuracies, calculated for all six years of data. T ABLE I U T IL I T Y DAT A A N D M E T RI C S α 1.3 ALENO 0.769 LENORI 71.5 RSE ALE 0.0421 RSE LEN 0.0597 RSE P b 3.15 n large 558 f large 93. n year 6 n min large 199. n min year 2.14 n minnolog large 1090. n minnolog year 11.7 N maxobs 1540 N max 5000 N L 10 e 2 = 7.4 10 e 3 = 20 e 4 = 55 10 - 3 10 - 2 10 - 1 number of outages N probability ( a ) Log - Log Plot of PowerLaw [ α + 1 ] slope magnitude α +1 2 ln10 3 4 10 - 3 10 - 2 10 - 1 x = ln [ N ] probability ( b ) Log Plot slope magnitude α +1 mean=ALENO+b 2 ln10 3 4 0 0.05 0.1 x = ln [ N ] probability ( c ) Linear Plot mean = ALENO+ b 2 ln10 3 4 0 0.1 f large x = ln [ N ] Frequency of x ( d ) Plot ( c ) as a frequency mean = LENORI+bf large Fig. 3. Plot (a) shows on a log-log plot the idealized Pareto probability mass function (5) of the event number of outages N for the large e vent tail N ≥ N L = 10 . The tail index α characterizes the tail since the slope magnitude of the tail is α + 1 . Plot (b) applies a logarithm to the same number of outages data as plot (a) by relabeling the horizontal axis. Since plot (b) is a probability mass function that is the same straight line of slope magnitude α + 1 but now on a log plot, the log-transformed data X = ln N is a light-tailed distribution similar to an exponential distribution with parameter α + 1 and mean ALENO + b , where b = ln( N L − 0 . 5) . Plot (c) is the same as plot (b) but now on a linear plot. Plot (d) is the same as plot (c) except that the vertical axis is rescaled to show frequency . The annual large ev ent frequency is f large . The mean of the frequency function is LENORI + bf large . T ABLE II D E CO M P O SI N G R E S IL I E NC E B Y S E AS O N all summer non-summer α 1.3 1.36 1.23 ALENO 0.769 0.737 0.816 LENORI 71.5 41.3 30.2 RSE ALE 0.0421 0.0542 0.0666 RSE LEN 0.0597 0.0769 0.0945 n large 558 336 222 n min large 199. 199. 198. f large 93. 56. 37. n year 6 6 6 The resilience due to different causes can be assessed by applying the metrics to subsets of the data. T able II shows how the distribution system resilience depends on whether the season is summer , where summer is defined to be the months of June, July , August, September . ALENO indicates that non- summer ev ents are a bit larger on average than summer e vents. But the large ev ents are more frequent in summer (see f large ), T ABLE III D E CO M P O SI N G R E S IL I E NC E B Y C AU SE all tree weather other α 1.3 1.03 0.503 2.51 ALENO 0.769 0.972 1.99 0.399 LENORI 71.5 45.3 9.61 16.5 RSE ALE 0.0421 0.0588 0.168 0.0628 RSE LEN 0.0597 0.0839 0.25 0.0892 n large 558 280 29 249 n min large 199. 197. 182. 198. f large 93. 46.7 4.83 41.5 n year 6 6 6 6 so that ov erall, LENORI indicates that summer months are less resilient than non-summer months. Since summer and non- summer account for all the large e vents, the summer and non- summer LENORI add to LENORI for all year . The distribution system outage cause codes can be grouped into cause codes related to trees, or weather , or other causes. Then the cause code for an event is the majority cause code. Of course trees are often in volved in bad weather , as, for example, when high winds detach parts of trees and they fly into lines, but we are interested to consider them separately to assess the importance of tree trimming for resilience. T able III sho ws how the distribution system resilience depends on tree, weather , or other cause codes. ALENO shows that the individual large ev ents caused by weather are significantly more sev ere than those caused by trees, but since f large shows that the tree large ev ents are ev en more frequent, the ov erall effect sho wn by LENORI is that tree large ev ents affect resilience more. Thus tree trimming that reduces large tree ev ent outages by 10% will be more ef fective in reducing the number of outages than hardening that reduces large weather e vent outages by 10%. There is some loss of statistical accuracy in the ALENO and LENORI metrics for the limited number 29 of weather events, but this would be much worse if the logarithmic transformation was not used. T able IV shows that tracking the yearly resilience of the distribution system over a window of 2 years is practical. In particular , the statistical accuracy of LENORI is maintained at RSE LEN ≈ 0 . 1 for biennial tracking. T ABLE IV B I EN N I A L T R AC K I NG O F R E SI L I E NC E W I T H L E NO R I A N D A L E NO 2012 2013 2014 2015 2013 2014 2015 2016 α 1.31 1.38 1.47 1.59 ALENO 0.766 0.726 0.682 0.629 LENORI 75.1 72.6 71.3 71.7 RSE ALE 0.071 0.0703 0.0688 0.0659 RSE LEN 0.101 0.0997 0.0976 0.0934 n large 196 200 209 228 V I I . D I S C U S S I O N O F H E A V Y T A I L S W e examine the probability distribution of the number of forced outages in large resilience ev ents in a distribution system. There is heavy-tailed power law behavior . W e propose LENORI and ALENO resilience metrics based on the number of outages in large events that describe the power grid strength relativ e to the weather sev erity and frequency . These metrics mitigate the problem of excessiv e statistical variability due to the heavy tails by taking the logarithm of the number of outages. ALENO also determines the slope magnitude tail index α that characterizes the large e vent trend. The heavy tail for the distribution of the number of outages is less heavy ( α = 1 . 3 ) than the tail for the distribution of customer minutes interrupted ( α = 0 . 83 ) reported in [10] for the same utility . The e xtent of high statistical v ariability of metrics calculated from the number of outages without a logarithm depends on the tail index α , so we consider whether the value of α = 1 . 3 in our data is typical. Initial calculations for four other USA distribution systems give α ranging from 1.0 to 1.6 with mean value 1.2, gi ving some indication that our data is typical and that the logarithm is needed to limit metric variability in other cases. Future work should confirm this by systematically testing the new metrics on a wide range of systems and optimizing the choice of the large event threshold N L . V I I I . C O N C L U S I O N The number of forced line outages in a power system resilience ev ent is a basic metric describing the event size that summarizes the infrastructure damage in the e vent. For resilience, we focus on the large events, and describe with metrics the tail of the probability mass function of the numbers of outages. Ho wever , for our distribution system data that has heavy tails, simply adding or av eraging the number of outages in large events to obtain a metric does not work well because too many large events need to be observed ov er many years to obtain reasonable statistical accuracy . This problem is mitigated by adding or averaging the logarithm of the number of outages in large ev ents to obtain the LENORI and ALENO metrics. The ALENO metric determines the tail index α , and the LENORI metric also accounts for the frequency of large ev ents. The LENORI and ALENO metrics have sufficiently low statistical variability that they can be used to track the power grid resilience ov er the years, and to be decomposed by season or cause to quantify the contributions of the various types of hazards to the overall resilience. This can be used to prioritize grid-hardening resilience in vestments for these types of hazards in terms of their resilience benefits. R E F E R E N C E S [1] A. Stanko vic et al., “Methods for analysis and quantification of power system resilience, ” IEEE T rans. P ower Systems , no. 5, pp. 4774–4787, 38 2023. [2] IEEE Distribution Resiliency W orking Group, “Guide for the definition of resiliency and measuring resiliency of the electrical distribution system, ” in approv al process, 2026. [3] M. Panteli et al., Fundamentals of P ower System Resilience: Disruptions by Natural Causes . John Wile y & Sons, 2026. [4] C. Nan and G. Sansavini, “A quantitative method for assessing resilience of interdependent infrastructures, ” Reliability Engi- neering & System Safety , vol. 157, pp. 35–53, 2017. [5] N. K. Carrington, I. Dobson, and Z. W ang, “Extracting re- silience metrics from distribution utility data using outage and restore process statistics, ” IEEE T rans. P ower Systems , vol. 36, no. 6, pp. 5814–5823, 2021. [6] IEEE T ask F orce on Research Metrics and Evaluation Meth- ods, “Power system resilience metrics, ” T echnical Report, in the approv al process, 2026. [7] S. Ekishe va, I. Dobson, R. Rieder, and J. Norris, “Assessing transmission resilience during extreme weather with outage and restore processes, ” in PMAPS , 2022. [8] A. Ahmad and I. Dobson, “T ow ards using utility data to quan- tify how in vestments would have increased the wind resilience of distribution systems, ” IEEE T rans. P ower Systems , vol. 39, no. 4, pp. 5956–5968, 2024. [9] A. Ahmad and I. Dobson, “Logarithmic resilience risk metrics that address the huge variations in blackout cost, ” IEEE T rans. P ower Systems , vol. 40, no. 6, pp. 5507–5510, 2025. [10] A. Ahmad and I. Dobson, “Quantifying resilience for distribu- tion system customers with SALEDI, ” arXiv pr eprint , 2026, arXiv:2602.07684 [eess.SY], https://arxiv .org/pdf/2602.07684. [11] I. Dobson, “Finding a Zipf distribution and cascading propa- gation metric in utility line outage data, ” arXiv preprint , 2018, https://arxiv .org/abs/1808.08434. [12] A. Ahmad and I. Dobson, “Extracting resilience events from utility outage data based on overlapping times and locations, ” arXiv pr eprint , 2025, arXi v:2511.12685 [eess.SY] https://arxiv .org/abs/2511.12685. [13] A. Clauset, C. R. Shalizi, and M. E. J. Newman, “Power -law distributions in empirical data, ” SIAM Review , vol. 51, no. 4, pp. 661–703, 2009.
Original Paper
Loading high-quality paper...
Comments & Academic Discussion
Loading comments...
Leave a Comment