Assessment of Latent Pedestrian--Vehicle Interaction Risk Profiles at Midblock Crossing in VR
Pedestrian safety at midblock crossings is a critical concern in mixed traffic environments where autonomous vehicles (AVs) and human-driven vehicles (HDVs) share the road. Pedestrians often infer intent from vehicle motion in AV encounters, making t…
Authors: Rulla Al-Haideri, Bilal Farooq, Elisabetta Cherchi
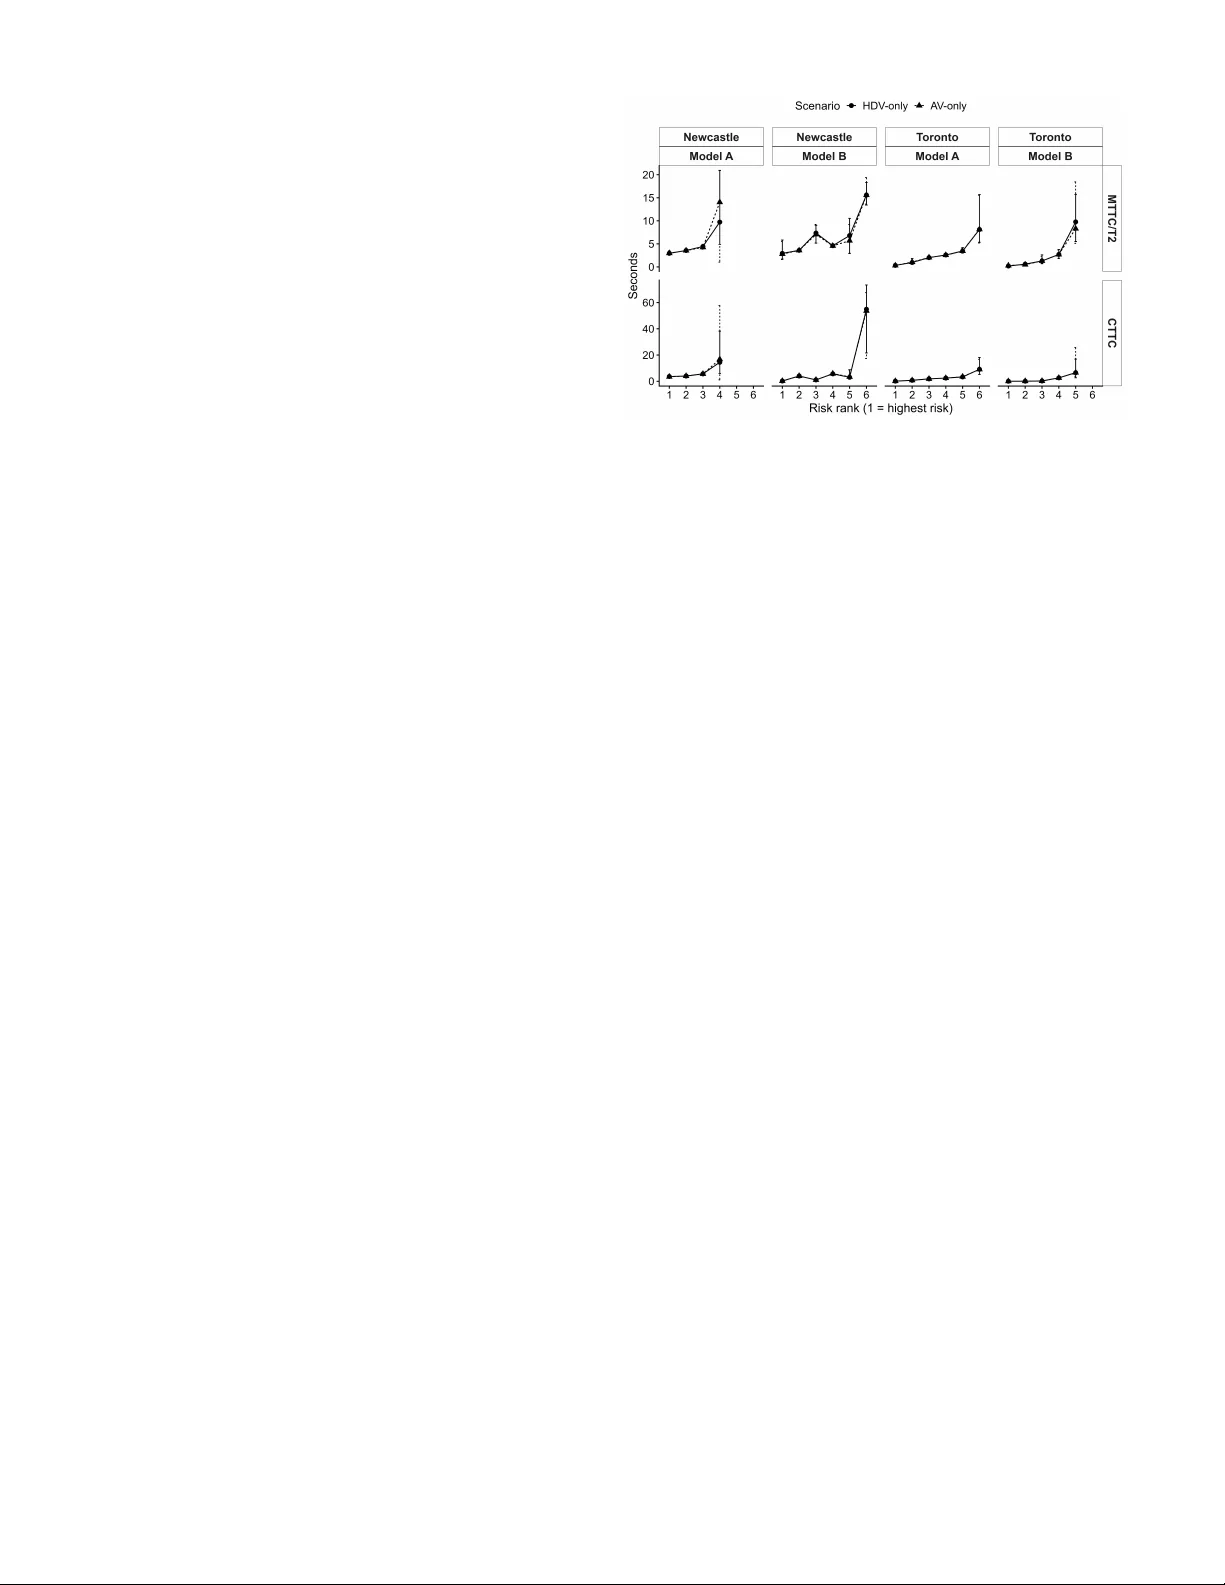
Assessment of Latent Pedestrian–V ehicle Interaction Risk Profiles at Midblock Crossing in VR IEEE Smart Mobility (SM), A pril 28–30, 2026, Dubai, United Arab Emirates Rulla Al-Haideri 1 , Bilal Farooq 1 , Elisabetta Cherchi 2 1 Laboratory of Innovations in T ransportation (LiT rans) , T or onto Metr opolitan University , Canada Email: rullaalhaideri@torontomu.ca bilal.farooq@torontomu.ca 2 New Y ork University Abu Dhabi , United Arab Emirates Email: elisabetta.cherchi@nyu.edu Abstract —Pedestrian safety at midblock crossings is a crit- ical concern in mixed traffic en vironments where autonomous vehicles (A Vs) and human-driven vehicles (HD Vs) share the road. Pedestrians often infer intent from vehicle motion in A V encounters, making them vulnerable to small shifts in conflict margins. This study in vestigates whether virtual reality (VR) crossing sessions separate into distinct interaction risk profiles and whether A V -only sessions shift pr ofile pr evalence compared to HD V -only sessions. Using large-scale immersive VR experiments from T or onto, Canada, and Newcastle, England, we compute sur- rogate safety measures (SSMs) and apply latent profile analysis (LP A) to identify distinct pedestrian crossing stances, ranging from risk-accepting to highly cautious. K ey findings show that Newcastle exhibits a higher prevalence of high-urgency risk profiles in A V -only sessions, indicating that A Vs contribute to higher -risk encounters. In contrast, T oronto shows no significant difference between A V -only and HDV -only sessions, suggesting that contextual factors influence the impact of A Vs on pedestrian safety . Index T erms —surrogate safety measures, latent profile analy- sis, virtual reality , autonomous vehicles, pedestrian crossings I . I N T RO D U C T I O N A traffic conflict is an observable interaction in which a collision would hav e happened if at least one road user had not taken an ev asi ve action ( e.g. , braking, swerving, stopping, or accelerating) [1]. These conflicts vary in se verity , depending on the time and space mar gins between road users. When these margins become small enough, crash av oidance may depend on rapid or substantial ev asive manoeuvres. In this case, the interaction becomes safety-critical and could escalate to a crash if avoidance is no longer possible. This sev erity is commonly operationalized using surrogate safety measures (SSMs). SSMs occur more frequently than crashes and preserve the kinematic structure of interactions. This makes them suitable for comparing safety-relev ant beha viour under different conditions. A ke y challenge in pedestrian– vehicle safety e valuation is heterogeneity . A small share of encounters can dominate the safety-relev ant tail. Therefore collapsing SSMs to a single mean or median can mask distinct risk re gimes including rare but consequential near misses. This research is conducted under the project “V irtual Reality to study the role sOcIal Conformity in the acceptance of Autonomous vehicles (V eR OnICA), ” funded by the Economic and Social Research Council (United Kingdom). This issue becomes more prominent in autonomous vehicles (A Vs) settings. In such encounters, pedestrians often cannot rely on driver e ye contact or informal gestures and must infer intent primarily from vehicle motion and any external human–machine interface (eHMI) cues. Immersiv e virtual reality (VR) proides a safe and a controlled way to study pedestrian–vehicle interactions while preserving naturalistic mov ement and decision-making which support SSM-based safety assessment. Prior w ork employed latent constructs and segmentation to capture heterogeneity in pedestrian beha viour and safety outcomes [2]. Recently , LP A has been used to strat- ify interaction se verity when multiple SSMs are considered jointly [3]. Howe ver , midblock pedestrian–vehicle interactions particularly in pedestrian–A V contexts are still ev aluated using single summary statistic. This aggre gation can mask whether A V -only versus human-driven vehicle (HDV)-only scenarios shift the distrib ution of interaction risk, especially in the upper tail where safety margins are smallest. This paper employs LP A as an exploratory segmentation method to summarize multi-indicator SSM heterogeneity to a small number of interpretable risk profiles. The use of LP A is justified using two points. First, LP A moves the ev aluation beyond single indicator averages by identifying distinct urgenc y regimes in the joint SSM space. Second, it enables direct comparisons of how often high urgency regimes occurred across vehicle types and locations. W e apply this approach to a large scale VR midblock crossing experiments conducted in T oronto, Canada and Newcastle, England. Our unit of analysis is the VR experiment session with unique variable values ( e.g. , low vehicle flow , sno wy weather, and a median in the middle), summarized using session level conflict indicators. F or details on experiments, sessions, and data collection campaign, we refer the reader to Nazemi et al. [4]. W e estimated LP A separately by location using two temporal indicator specifications: Model A used min(MTTC) and the corresponding CTTC at the same time step, while Model B used min(T 2 ) and the corresponding CTTC. W e then compared profile pre v alence between A V -only and HD V -only sessions within each location by focusing on the top highest risk end of the profile structure. The main objectiv e of this paper is to identify and compare latent interaction risk profiles in VR midblock pedestrian–vehicle encounters using SSMs, and to examine ho w profile prev alence and structure v ary by vehicle type and location. This paper addresses the follo wing research questions: 1) W ithin each location, what latent interaction risk profiles emerge when each VR session is represented by multiple temporal SSMs? 2) W ithin each location, does the proportion of sessions assigned to the highest risk profile differ between A V - only and HD V -only scenarios? 3) Across locations, are the latent profiles comparable in number and indicator patterns, and do A V -only versus HD V -only differences change when the indicator set is used? The remainder of the paper is organized as follows. Section II presents the methods, including the data analysis and mod- elling frame work. Section III reports the results and discussion. Section IV concludes and outlines future work. I I . M E T H O D S A. Data Analysis This study uses two VR datasets collected in T oronto (109 participants) and Ne wcastle (249 participants). Each dataset in- cludes time-stamped trajectories for pedestrians and simulated vehicle agents during a midblock crossing task on a two-lane road. Participants complete repeated sessions and each lasts for 60 s under systematically varied conditions. W ithin the two locations, each participant completed 12 to 24 sessions, with conditions varying by time of day , weather, vehicle type (A V versus HD V), presence of an eHMI for the A V , presence of a median, behaviour of a v atar pedestrians, and traffic flow . The scenario structure is comparable across locations to support within location modelling under consistent task demands. Raw trajectories are recorded at 0.1 s and are post-processed and smoothed to reduce measurement noise, and then resampled to 1 s to create a uniform time series. Three predictiv e temporal conflict indicators are calculated to quantify session- lev el interaction criticality under both collision course and non-collision course encounters. These include the modified time-to-collision (MTTC), time-to-arriv al ( T 2 ), and closing time-to-collision (CTTC). For LP A, each 60 s session is represented by its most critical time step. This is defined as the minimum of a primary temporal indicator and the corresponding CTTC at that same time step. T wo indicator sets are analyzed within each location. Model A uses min(MTTC) with CTTC ev aluated at the time of min(MTTC) . Model B uses min(T 2 ) with CTTC ev aluated at the time of min(T 2 ) . MTTC is the time for two road users to collide under constant acceleration extrapolation, e v aluated only when the pair is on a collision course [5]. In this paper , road users are represented as rectangles and collision times are computed using the corner– side procedure of Laureshyn et al. [6]. T 2 is the predicted arriv al time of the later road user to the avoided conflict point [6]. CTTC is the instantaneous closing time implied by the current separation distance divided by the line-of-sight closing speed (relativ e velocity projected onto the line of sight) under constant-velocity extrapolation [7]. The estimation samples used in this study represent subsets of the full recorded datasets. Sessions are included in the LP A estimation sample only when both indicators required by the selected model are defined (finite after pre-processing). Prior to LP A, session lev el conflict indicators are log transformed to reduce right skew and then standardized using z-scores computed within each location and indicator model as follows: z = log( x ) − µ loc,model σ loc,model , (1) where µ loc,model and σ loc,model are the mean and standard deviation of log ( x ) computed from the sessions included in that model. The unit of analysis in this paper is a session, defined as a 60 s pedestrian crossing trial. It is summarized by session le vel minima of temporal surrogate indicators. B. Modelling F rame work The VR procedure and control variables are coded consis- tently across T oronto and Newcastle. Howe v er , we estimate LP A separately by location because pooling requires assuming that the indicator distrib utions defining each profile are the same across sites. T esting and imposing cross site measure- ment in v ariance within profiles (and estimating a pooled multi- group LP A) is beyond the scope of this paper and is left for fu- ture work. In each location, models with K = 1 , 2 , . . . , K max are e v aluated, and solutions are discarded if any profile con- tained fewer than 5% of sessions. Classification quality is assessed using posterior membership probabilities. The distri- bution of maximum posterior probabilities is summarized, and av erage posterior probabilities of assignment of around 0.70 or higher are treated as indicati ve of acceptable classification [8]. Among candidate solutions, the smallest number of profiles K that still pro vides an adequate fit is selected. First, the model with the lowest BIC is identified. The smallest K whose BIC is within 10 points of that best (lo west) BIC is then selected. The K is increased only if moving from K − 1 to K improv es BIC by at least 2 points. Otherwise the more parsimonious K − 1 solution is kept. After selecting K , profile pre v alence is reported separately for A V -only and HDV -only sessions for each location. Profiles are ranked only for consistent labelling (rank 1 as highest risk). These ranks are not used in model estimation or model selection. T o rank profiles, a composite sev erity score is defined for each session as: r i = − X j ∈J z ij , (2) where J is the set of standardized indicators used in the selected model. For each session, the LP A model returns posterior membership probabilities for all K profiles. Each session is assigned to the profile with the largest posterior probability . Using these assignments, profile prev alence is computed separately for A V -only and HDV -only sessions per location. F or each session i in a gi ven location and indicator model, the 2D feature v ector is defined as: x i = z loc,model (log t i ) z loc,model (log c i ) ∈ R 2 , where t i is the session lev el conflict indicator ( t i = min(MTTC) for Model A or t i = min(T 2 ) for Model B), and c i is the corresponding CTTC value ev aluated at the time step where t i occurred. The z loc,model ( · ) denotes z-score standardization computed within each location and indicator model using the sessions included in that model. LP A repre- sents the distribution of the session lev el indicator vector x i as a mixture of K latent profiles. Each session i belongs to an unobserved profile Z i ∈ { 1 , . . . , K } with mixing proportions π k = Pr( Z i = k ) , where P K k =1 π k = 1 . The mixture density is expressed by: f ( x i ) = K X k =1 π k ϕ ( x i | µ k , Σ k ) , (3) where ϕ ( · | µ k , Σ k ) is the bi variate normal density for profile k with mean µ k and covariance Σ k . Model parameters { π k , µ k , Σ k } K k =1 are estimated by maximum likelihood using an expectation–maximization algorithm. For each session, posterior membership probabilities are obtained by: γ ik = Pr( Z i = k | x i ) = π k ϕ ( x i | µ k , Σ k ) P K h =1 π h ϕ ( x i | µ h , Σ h ) , (4) and the session was assigned to the profile with the largest γ ik . All models are estimated in R using tidyLPA [9]. I I I . R E S U L T S A N D D I S C U S S I O N T able I summarizes the selected number of profiles, esti- mation sample sizes, and classification diagnostics for each model. The selected solutions ranged from K = 4 (Newcastle Model A) to K = 6 (Newcastle Model B and T oronto Model A). The entropy summarizes how clearly sessions are assigned to a single latent profile, and values closer to 1 indicate clearer separation. The mean maximum posterior probability is the av erage across sessions of the lar gest profile membership probability , where values closer to 1 imply higher assignment certainty . As can be seen from the table, classifi- cation separation is strong for Newcastle Model A (entropy = 0 . 9551 ), Newcastle Model B (entropy = 0 . 9465 ), and T oronto Model A (entropy = 0 . 9539 ), with mean maximum posterior probabilities abov e 0.96. T oronto Model B shows weaker separation (entropy = 0 . 8641 ; mean maximum pos- terior probability = 0 . 9128 ). This suggests that the T 2 -based indicator space in T oronto captures either a more continuous spectrum of risk or higher within-profile v ariability . As a re- sult, profiles overlap more, and session-to-profile assignments are less stable. A. A V -only versus HD V -only differ ences in high criticality pr ofile pr evalence T able II presents contrasts in profile prev alence between A V -only and HDV -only sessions for (i) the highest interaction risk profile and (ii) the combined set of the top two highest interaction risk profiles. These contrasts focus on the upper tail of interaction risk, where smaller temporal margins are most safety-relev ant. As a general observation, T able I indicates strong profile separation in Newcastle and in T oronto under Model A. In contrast, T oronto under Model B sho ws weak er separation, with lower entropy and a lower mean maximum posterior probability , consistent with greater overlap in the T 2 - based indicator space. In Newcastle, A V -only sessions exhibit a higher pre v alence of the combined top two highest risk profiles under both indicator models. Under Model A, the top two pre v alence is higher in A V -only sessions ( ∆ p = 0 . 1313 , 95% CI [0 . 0245 , 0 . 2332] ). Whereas the contrast for the single highest risk profile is not distinguishable ( ∆ p = − 0 . 0395 , 95% CI [ − 0 . 1239 , 0 . 0411] ). Under Model B, A V -only sessions show higher prev alence for both the highest risk profile ( ∆ p = 0 . 0809 , 95% CI [0 . 0182 , 0 . 1412] ) and the combined top two profiles ( ∆ p = 0 . 1456 , 95% CI [0 . 0788 , 0 . 2100] ). These findings suggest that A V -only conditions are associated with a larger share of sessions in high risk interaction regimes in Newcastle, implying smaller temporal safety margins for a non-trivial subset of encounters. This result aligns with previous research. Chen et al. [10] found that pedestrians tend to accept larger gaps when interacting with A Vs, potentially leading to more risky encounters if pedestrians misjudge the safety of the interaction. On the other hand, V elasco et al. [11] demonstrated that A Vs sometimes induce more cautious beha viour in pedestrians, but this effect is context dependent. In some cases, pedestrians accepted smaller gaps when interacting with HD Vs, highlighting that pedestrians’ decision making in crossing situations v aries depending on the vehicle type and the surrounding context. Our results indicate that, in Newcastle, A Vs are perceiv ed as riskier in terms of interaction criticality . This suggests that pedestrians may misinterpret A V intent or feel more uncertainty during A V encounters compared to HD Vs. In T oronto, A V -only versus HD V -only contrasts are small and not distinguishable for both indicator models. For Model A, ∆ p = 0 . 0038 for the T op-1 risk profile (95% CI [ − 0 . 0611 , 0 . 0685] ) and ∆ p = 0 . 0246 for the top tw o profiles (95% CI [ − 0 . 0472 , 0 . 0960] ). For Model B, ∆ p = 0 . 0193 for the highest risk profile (95% CI [ − 0 . 0233 , 0 . 0618] ) and ∆ p = 0 . 0131 for the top two profiles (95% CI [ − 0 . 0638 , 0 . 0899] ). W ithin the estimation samples used for each model, T oronto exhibits broadly similar prev alence of high-risk profiles across A V -only and HD V - only scenarios. Ho wev er , non-distinguishable contrasts do not imply equiv alence. They indicate that the a v ailable data do not rule out small differences in either direction. Differences between Model A and Model B are consistent with their indicator definitions. Model A relies on MTTC, which is defined only for collision-course ev ents under the assumed motion model and therefore emphasizes imminent collision configurations. Model B relies on T 2 and CTTC, which remain informativ e in near-miss encounters because they characterize arriv al timing and closing urgency ev en when a collision is not predicted. This distinction is consistent with the stronger A V - only v ersus HD V -only dif ferences in Newcastle under Model B and the weaker separation observed for T oronto Model B in T able I. T ABLE I L P A M OD E L FI T S U MM A RY B Y L O CAT IO N . Location Model K N A V N HDV BIC Entropy Min. class prop. Mean max post. NC A 4 445 242 616.84 0.9551 0.1645 0.9830 NC B 6 1141 569 6024.75 0.9465 0.0696 0.9655 TO A 6 607 584 2403.77 0.9539 0.0705 0.9677 TO B 5 445 458 3717.29 0.8641 0.0554 0.9128 Notes: TO: T oronto, NC: Newcastle. K is selected number of latent profiles. N A V and N HDV are numbers of sessions used for estimation in A V -only and HD V -only . T ABLE II K E Y C ON T R AS T S I N I N TE R AC T I ON R I SK P RO FI L E P R EV A L EN C E B E TW E E N A V - ON LY A ND H DV- O N LY S C E NA R I OS B Y L O C A TI O N . Location Model Contrast k A V N A V p A V k HDV N HDV p HDV ∆ p 95% CI NC A T op-1 risk profile 67 445 0.1506 46 242 0.1901 -0.0395 [ − 0 . 1239 , 0.0411] ∗ NC A T op-2 risk profiles (rank 1–2) 200 445 0.4494 77 242 0.3182 0.1313 [0.0245, 0.2332] NC B T op-1 risk profile 357 1141 0.3129 132 569 0.2320 0.0809 [0.0182, 0.1412] NC B T op-2 risk profiles (rank 1–2) 489 1141 0.4286 161 569 0.2830 0.1456 [0.0788, 0.2100] TO A T op-1 risk profile 126 607 0.2076 119 584 0.2038 0.0038 [ − 0 . 0611 , 0.0685] ∗ TO A T op-2 risk profiles (rank 1–2) 175 607 0.2883 154 584 0.2637 0.0246 [ − 0 . 0472 , 0.0960] ∗ TO B T op-1 risk profile 29 445 0.0652 21 458 0.0459 0.0193 [ − 0 . 0233 , 0.0618] ∗ TO B T op-2 risk profiles (rank 1–2) 103 445 0.2315 100 458 0.2183 0.0131 [ − 0 . 0638 , 0.0899] ∗ Notes: k A V and k HDV are numbers of sessions assigned to contrasted profile set (top-1 or top-2) in A V -only and HD V -only; N A V and N HDV are total numbers of sessions scenarios. p A V = k A V / N A V and p HDV = k HDV / N HDV . ∆ p = p A V − p HDV is reported with Newcombe–W ilson 95% CIs. ∗ CI includes 0 (contrast is not distinguishable at the 95% lev el). B. Risk pr ofile pre valence and indicator structure Figure 1 reports the prev alence of the highest risk end of the latent profile structure by scenario type (A V -only versus HD V -only). Prev alence is reported for the single highest risk profile (T op-1) and for the combined set of the two highest risk profiles (T op-2), with W ilson 95% CIs. In Newcastle, A V -only sessions exhibit a higher prev alence of high-risk interactions under Model B. Both the T op-1 and T op-2 sets are more pre v alent in A V -only sessions than in HD V -only sessions. This implies a shift toward smaller temporal safety margins when encounters inv olv e A Vs only . In Model A, the contrast is lower and is more e vident when the two highest risk profiles are considered jointly . This pattern is consistent with stronger separation when near-miss informativ e timing cues ( T 2 with CTTC) define the latent space. In T oronto, prev alence estimates for A V -only and HD V -only sessions are similar for both indicator models. CIs overlap for both T op-1 and T op-2 sets. This confirms that the data do not support distinguishable differences in the pre v alence of high-risk interactions by ve- hicle type within this location. The prev alence results suggest that A V -only versus HD V -only shifts in interaction risk are location dependent and are more detectable under indicator definitions that retain near-miss timing structure rather than emphasizing collision-course imminence alone. Figure 2 sum- marizes indicator le vels within each risk rank and provides an internal consistency check for the latent ordering. Lower rank numbers (rank 1) correspond to smaller MTTC/ T 2 values and smaller CTTC values, implying shorter time margins and greater closing urgency . The monotonic ordering of indicator values across risk ranks provides a construct validity check for the composite se verity ranking. This indicates that the Fig. 1. Prev alence of the highest risk end of the latent profile structure by scenario type. profiles are aligned with the surrogate indicators used to define them rather than reflecting arbitrary label permutations. In Newcastle, separation between adjacent risk ranks is visually clearer , particularly for Model B. This aligns with the strong classification diagnostics discussed earlier . In T oronto under Model B, indicator ranges ov erlap more across ranks, espe- cially in the mid-risk range. This overlap is consistent with the lower entropy observed for this specification and suggests that the T 2 -based indicator space captures a more continuous spectrum of urgency in this context. T o aid interpretation, we next describe what these ranks could represent as hypothesized pedestrian crossing stances expressed within a session. C. Interpretation of risk ranks and hypothesized pedestrian cr ossing stances Risk ranks represent clusters of instances during a session in temporal margin and closing urgenc y space. Each session is represented by the indicator v alues at its most critical time instance, defined by the minimum MTTC (Model A) or minimum T 2 (Model B) and the corresponding CTTC at the same time step. W e hypothesize that these ranks correspond to pedestrian crossing stances expressed within a session, ranging from risk-accepting (small temporal margins and high closing urgenc y) to highly cautious (large mar gins and weak closing). The plotted values summarize session minima. Lower ranks (rank 1) indicate sessions whose most critical moment has smaller temporal mar gins and higher closing ur gency . Higher ranks indicate sessions whose minimum indicator values re- main comparatively large. a) Newcastle, Model A (MTTC and CTTC; K = 4 ): In Newcastle Model A, ranks 1–3 are close in indicator magnitude. Rank 4 is distinct with much larger MTTC and CTTC. Rank 1 ( risk taker / urg ent crosser ) shows MTTC and CTTC values around 3 s. This is consistent with when the pedestrian accepts a tight timing situation or commits late which require rapid resolution under urgent closing. Rank 2 ( assertive but contr olled ) sho ws a slightly higher MTTC with a similar CTTC. This is consistent with a modestly larger collision course time margin while closing urgenc y remains comparable. Rank 3 ( typical / moderately cautious ) shows moderately higher MTTC and marginally higher CTTC. This is consistent with pedestrians where the minimum occurs with somewhat larger buf fers and more recoverable interaction conditions. Rank 4 ( cautious / risk averse ) shows a sharp increase in MTTC and CTTC. This indicates sessions whose minimum collision course moment remains well-buf fered. In this lowest risk re gime, MTTC and CTTC are slightly higher in A V -only than in HD V -only sessions. This is consistent with larger temporal buf fers (or weaker closing) when sessions fall into this configuration. b) Newcastle, Model B ( T 2 and CTTC; K = 6 ): Newcastle Model B shows greater variability between ranks because T 2 remains defined in near miss encounters. This richer definition separates regimes where av oided conflict timing is tight from regimes where instantaneous closing urgenc y is high which allows these dimensions to decouple. Rank 1 ( risk taker / high ur gency ) shows T 2 values around 2 s with CTTC near 1 s. This is consistent with sessions where av oided conflict timing becomes tight under very urgent closing. Rank 2 ( assertive but anticipatory ) has a slightly higher T 2 and distinctly higher CTTC than rank 1. This is consistent with tight timing b ut moderated closing urgenc y . F or example, when the pedestrian commits under small margins but interaction dynamics already soften through speed adapta- tion or larger separation at the minimum- T 2 moment. Rank 3 ( opportunistic / confident ) exhibits a much larger T 2 while CTTC returns closer to rank 1. This is consistent with sessions where the pedestrian experiences urgent closing in distance (small CTTC) b ut arri val timing at the conflict point remains well separated (large T 2 ). This could occur due to interaction geometry or because one road user passes the conflict point substantially earlier than the other . Rank 4 ( ne gotiator ) sho ws lower T 2 than rank 3 with slightly higher CTTC. This is in Fig. 2. Indicator levels by risk rank sho wing medians with 10th–90th percentile ranges. line with sessions where timing becomes tighter but closing urgenc y is partially moderated through interaction adjustment. Rank 5 ( A V -trusting or A V -sensitive ) sho ws scenario dependent separation. In the HD V -only sessions it e xhibits larger T 2 than A V -only sessions, while CTTC remains similar (around 2 s). This implies that in these sessions the pedestrians operate with smaller avoided conflict timing margins in A V -only encounters at comparable closing ur gency . This is consistent with either greater willingness to accept tighter timing against A Vs or different A V approach and yielding dynamics that compress timing without increasing immediate closing urgency . Rank 6 ( very cautious / highly conservative ) is distinct with v ery large T 2 (around 15 s) and very lar ge CTTC (around 60 s). This is consistent with sessions where e ven the minimum remains highly buf fered, reflecting v ery conservati ve waiting for large gaps or low exposure to close vehicle approaches. c) T or onto, Model A (MTTC and CTTC; K = 6 ): In T oronto Model A, MTTC increases steadily from ranks 1 through 5. CTTC values are comparati vely similar and increase only marginally . This indicates that ranks primarily separate sessions by how small the collision course time margin becomes at the most critical moment. Rank 1 ( risk taker / ur gent cr osser ) reflects the smallest MTTC and low CTTC. This is in line with tight collision course timing under urgent closing. Ranks 2–3 ( assertive to typical ) reflect progressi vely larger MTTC with similar closing ur gency . This is consistent with more recoverable but still interaction relev ant sessions. Ranks 4–5 ( cautious ) reflect larger MTTC and slightly higher CTTC. This reflects sessions where the minimum occurs with more buf fered timing. Rank 6 ( very cautious / risk averse ) is distinct with lar ger MTTC (around 10 s) and higher CTTC (around the mid-teens). This indicates sessions whose minimum collision course moment remains well buf fered. d) T or onto, Model B ( T 2 and CTTC; K = 5 ): T oronto Model B shows a similar trend toward lar ger temporal buf fers with greater overlap among mid ranks. This is consistent with weaker profile separation in this indicator space. Rank 1 ( risk taker / high urgency ) represents the smallest T 2 and lowest CTTC v alues. Ranks 2–3 ( assertive to typical ) exhibit relativ ely close T 2 and CTTC le vels. This implies incremental differences in near-miss urgenc y rather than sharply separated stance categories. Rank 4 ( cautious ) e xhibits larger T 2 and CTTC, consistent with more buf fered conflict timing and weaker closing urgency . Rank 5 ( very cautious / risk averse ) is distinct with much larger T 2 and higher CTTC. This is consis- tent with sessions where minimum timing and closing urgency remain comparativ ely lar ge. From a safety perspectiv e, these hypothesized stances matter because they summarize how often a deployment context produces sessions whose most critical moment occurs under tight temporal margins and urgent closing. Small shifts in average indicator values can be misleading when risk is dri ven by the upper tail. In contrast, profile pre valence directly quantifies whether a larger share of encounters falls into regimes consistent with risk accepting or highly buffered behaviour . This makes the results actionable for ev aluation and design. If A V -only scenarios increase the prev alence of high urgenc y ranks in a giv en location, the concern is not a uniform safety degradation, but a heavier tail of time-critical encounters that can dominate safety-relev ant outcomes. Con versely , higher pre valence of highly cautious ranks indicates more buffered interaction opportunities and lower exposure to near-miss urgency . Therefore, interpreting ranks as interaction stances pro vides a policy relev ant lens for comparing A V and HDV interactions beyond single summary statistics and supports targeted follow up analyses that links high urgenc y ranks to specific scenario features ( e.g. , traf fic flow , eHMI, and yielding behaviour). I V . C O N C L U S I O N S This paper applies LP A to SSMs to identify and compare la- tent pedestrian–vehicle interaction risk profiles across vehicle types and locations. This profile based approach ensures that rare but consequential, time critical sessions are not masked by aggregate summaries which preserves heterogeneity in interaction criticality . It also provides valuable insights for ev aluating A V safety by identifying how A Vs may affect pedestrian behaviour . Using immersive VR data from T oronto and Newcastle, each 60 s session is represented by its most critical time instance, defined by the session minimum of MTTC (Model A) or T 2 (Model B), paired with the corre- sponding CTTC at the same time step. Ke y results indicate that the Newcastle data shows clearer separation between latent risk profiles. In T oronto Model B, the separation is less clear likely due to the indicator structure. Additionally , in Newcastle, A V -only sessions led to more high risk interactions compared to HD V -only sessions. This suggests that A Vs introduce higher levels of risk in some contexts. In contrast, T oronto did not sho w this trend, indicating that location and context play a significant role in the impact of A Vs on pedestrian risk. The resulting profiles form an ordered risk rank that spans from high urgency (small temporal margins and urgent closing) to highly buf fered encounters. These ranks likely reflect distinct pedestrian crossing stances, ranging from risk accepting to highly cautious. W e can better interpret how interaction criticality varies across contexts through analyzing these profiles. Substantiv ely , Newcastle shows a clear shift tow ard higher urgenc y profiles in A V -only sessions. In the T 2 -based model, this shift remains informative for near- miss encounters. For T oronto, there was no distinguishable differences between A V -only and HD V -only sessions. This is likely due to weaker separation in the T 2 -based model, which captures a more continuous urgency spectrum. These findings suggest that A V -related effects are context-specific, and that conclusions depend heavily on ho w interaction criticality is defined. Future work should e xplicitly model the influence of control variables embedded in the VR experimental design. These include traffic flo w , weather , time of day , pedestrian density , social conformity , median presence, eHMI a v ailability , and A V yielding behaviour . Including these factors into a joint modelling framew ork will allow assessment of how specific design and operational features shift sessions between latent risk profiles, rather than only comparing aggregate prev alence by vehicle type. Extending the framew ork to hybrid models that link latent profile membership to behavioural and contextual covariates would further support hypothesis driv en ev aluation of A V design choices and enable more direct translation of profile based findings into safety guidance for A V deployment. R E F E R E N C E S [1] A. Laureshyn and A. V ´ arhelyi, The Swedish Tr affic Conflict T echnique: Observer’ s Manual , Lund, Sweden, 2018. [2] A. Hosseini Shoabjareh, A. R. Mamdoohi, and T . Nordfjærn, “ Analysis of pedestrians’ behaviour: A segmentation approach based on latent variables, ” Accident Analysis & Pre vention , vol. 157, p. 106160, 2021. [3] A. Maji and I. Ghosh, “ A copula-based multi v ariate extreme value frame- work for roundabout safety e v aluation under mixed traf fic, ” Accident Analysis & Pr evention , vol. 221, p. 108219, 2025. [4] M. Nazemi, B. Rababah, D. Ramos, T . Zhao, and B. Farooq, “Decoding pedestrian stress on urban streets using electrodermal activity monitoring in virtual immersive reality , ” T r ansportation Resear ch P art C: Emer ging T echnologies , vol. 171, p. 104952, 2025. [5] K. Ozbay , H. Y ang, B. Bartin, and S. Mudigonda, “Deri vation and validation of new simulation-based surrogate safety measure, ” T rans- portation Research Recor d: Journal of the T ransportation Resear ch Boar d , no. 2083, pp. 105–113, 2008. [6] A. Laureshyn, ˚ A. Svensson, and C. Hyd ´ en, “Evaluation of traffic safety , based on micro-le vel behavioural data: Theoretical frame work and first implementation, ” Accident Analysis & Pre vention , v ol. 42, no. 6, pp. 1637–1646, 2010. [7] R. Al-Haideri, K. Ismail, and A. W eiss, “Beyond traditional models: a discrete choice approach to vehicle interaction modelling at round- abouts, ” T ransportmetrica A: T ransport Science , pp. 1–45, 2025. [8] D. S. Nagin and C. L. Odgers, “Group-based trajectory modeling in clinical research, ” Annual Re view of Clinical Psychology , v ol. 6, pp. 109–138, 2010. [9] C. J. van Lissa, J. M. Rosenberg, P . N. Beymer , D. J. Anderson, and J. A. Schmidt, “tidylpa: An R package to easily carry out latent profile analysis (lpa) using open-source or commercial softw are, ” J ournal of Open Source Softwar e , vol. 3, no. 30, p. 978, 2018. [10] W . Chen, Y . Zhang, W . Xu, Z. Y ang, and X. Zhang, “Comparison of pedestrians’ gap acceptance behavior to wards automated and human- driv en vehicles, ” in International Conference on Human-Computer In- teraction . Springer International Publishing, 2020, pp. 132–144. [11] J. P . N. V elasco, T . Dufresne, I. V innitskaya, J. Cho, J. T . Murphey , B. Farooq, and R. Al-Haideri, “Will pedestrians cross the road before an automated vehicle? the ef fect of drivers’ attentiveness and presence on pedestrians’ road crossing behavior , ” T ransportation Researc h Inter- disciplinary P erspectives , v ol. 12, p. 100466, 2021.
Original Paper
Loading high-quality paper...
Comments & Academic Discussion
Loading comments...
Leave a Comment