Machines acquire scientific taste from institutional traces
Artificial intelligence matches or exceeds human performance on tasks with verifiable answers, from protein folding to Olympiad mathematics. Yet the capacity that most governs scientific advance is not reasoning but taste: the ability to judge which …
Authors: Ziqin Gong, Ning Li, Huaikang Zhou
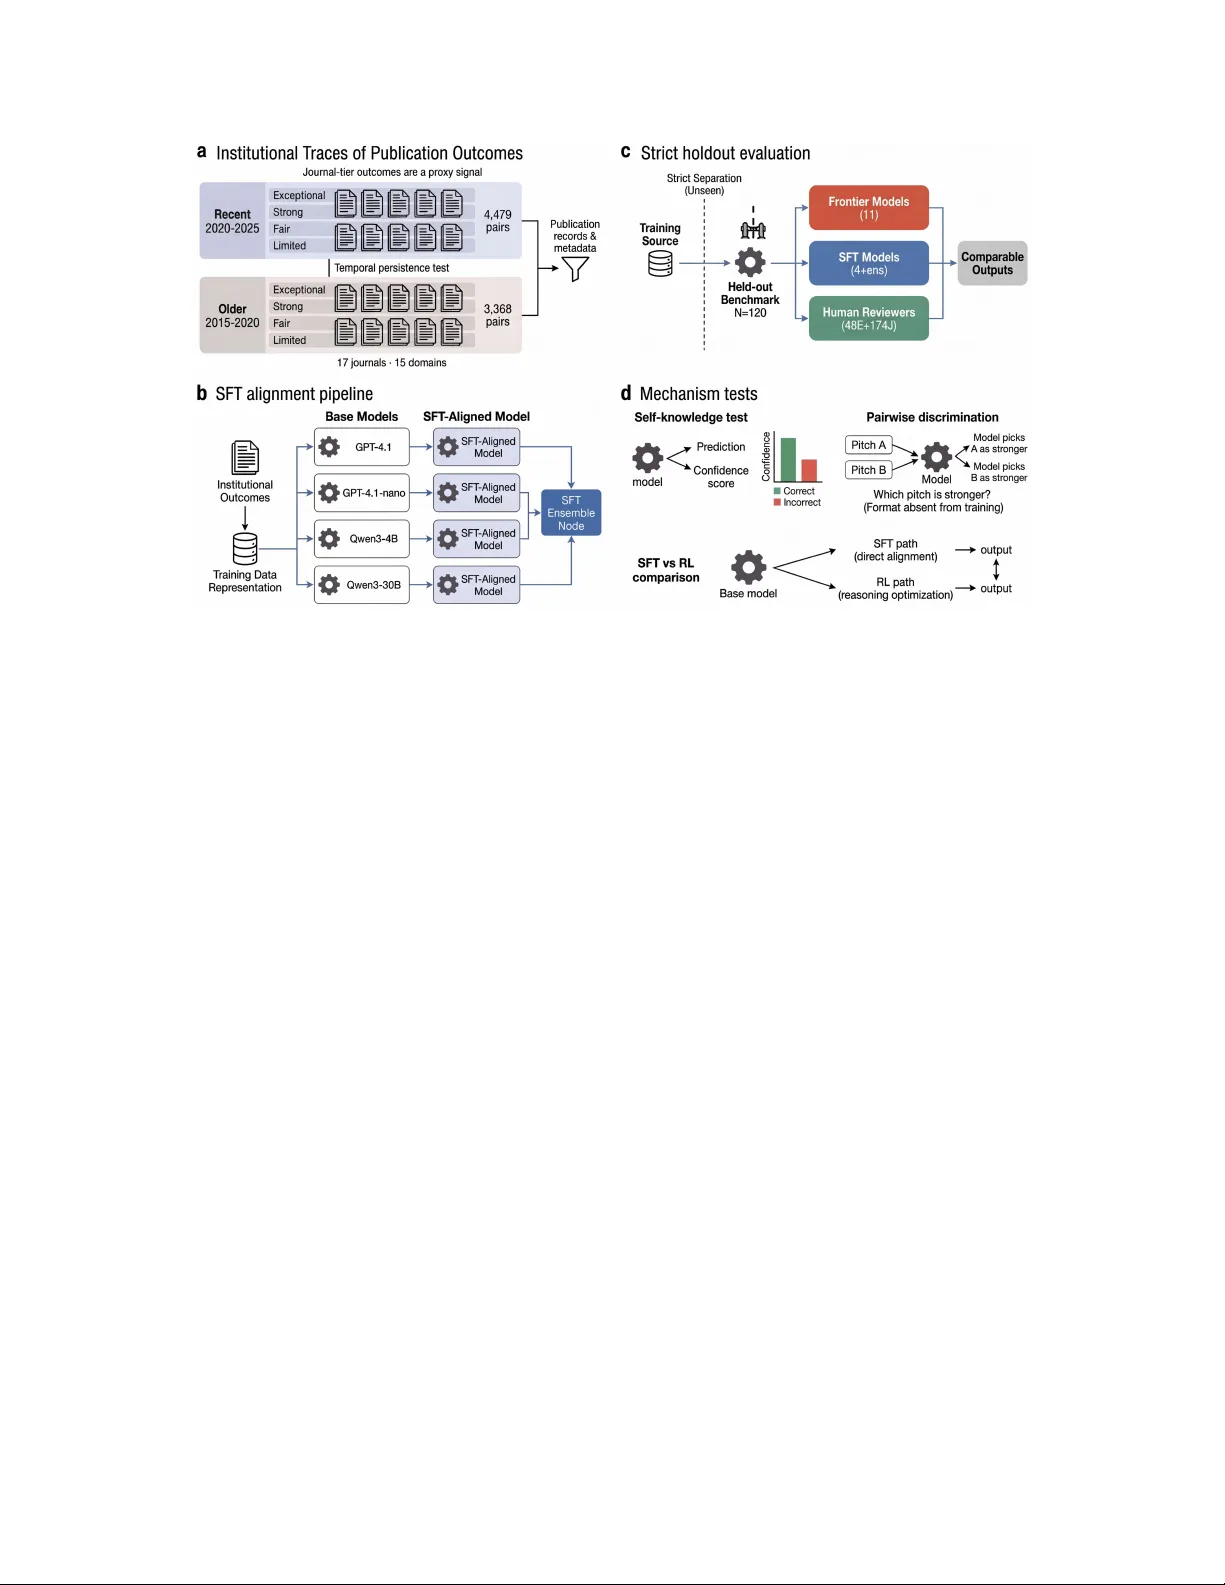
Machines acquire scientific taste from insti tutional traces Ziqing Gong 1 , Ning Li 1 , Huaikang Zhou 1 1 School of Economics and Management , Tsinghua University, Beijing, China Correspond ing author. Email: lining@sem .tsinghua.ed u.cn Abstract Artificial intelligence matches or exceeds human performan ce on tasks with verifiable answers, from protein folding to Olympiad mathematics. Yet the capacity that most governs scientific advance is not reasoning but taste: the ability to judge which untested ideas deserve pursuit, exercised daily by editors and funders but never succes sfully articulated, taught, or automated. Here we show that fine-tuning language models on journal publication decisions recovers evaluative judgment inaccessible to both frontier models and hu man expertise. Using a held-out ben chmark of research pitches in managemen t spanning four quality tiers, we find that eleven frontier mod els, spanning major proprietary and open architectures, barely exceed chance, averaging 31% accuracy. Panels of journal editors and editorial board members reach 42% by majority vote. Fine-tuned models trained on years of publication records each surpass every frontier model and expert panel, with the best single model achieving 59%. These models exhibit calibrated confidence, reaching 100% accuracy on their h ighest-confiden ce predic tions, and transfer this evaluative signal to untrained pai rwise compariso ns and one-sentenc e summaries. The mechanism generalizes: models trained on economics publication records achieve 70% accuracy. Scientific taste was not missing from AI’s reach; it was deposited in the institutional record, waiting to be extracted. These results provide a scalable mechanism to triage the expanding volume of scientific production across disciplines wher e quality resists formal verification. Introducti on Science is built on verifiable facts, but it is governed by unverifiable judgments. Artificial intelligence now matches or exceeds human performance on tasks with objectively verifiable answers, from protein structure prediction[1] to Olympiad-level mathematics[2] to competitive programming[3]. Yet the scientific enterprise depends equally on a form of taste, not reasoning: the ability to discriminate which untested ideas are worth pursuing. This scientific taste is tacit[8], socially constituted[20], and transmitted through exposure to what the field considers excellent, not through explicit rules. As AI systems generate hypotheses and manuscripts at unprec edented scale[4 , 5], the bottlenec k in scie nce has shifted from production to evaluation[6]. Whether AI can acquire this form of taste (subjective, contextual, resistant to explicit codification) defines the next critical boundary in machine intelligence, where capability drops sharply from domains with clear answers to those requiring discrimination and judgment[7 ]. Evaluative judgment is a paradigmatic instance of tacit knowledge: “we can know more than we can tell”[8]. Decades of effort to codify what makes a research idea good (structured review rubrics, editorial frameworks distinguishing originality from utility[9, 10]) have not produced agreement. Reviewers agree on ca tegorical ass ignment at barely above chance[11 ]; the gap between what the syst em ach ieves collectively and what any individual reviewer contributes is vast. Neither formal training, academic rank[13], nor editorial experience [14] r eliably predicts review quality; review perfor mance actually declines with experience[1 5]. Ethnogra phic work reveals that academic j udgment operates throu gh intuitive assessment and disciplinary sensibility, not rule application[16]. Novel ideas, precisely the ones that matter most, generate the greatest disagreement[17], and the system systematically undervalues its most impactful work[18] . The quality signal is real: it manifests in the long-run sorting of publications across prestige tiers[19]. That signal is nonetheless irreducibly tacit, not in Polanyi’s original sense of individual embodied skill, but in what Collins terms collective tacit knowledge[20]: evaluative understanding embedded in institutional practices that no individual participant can articulate, yet that the system reliably enacts[8, 21]. In Bo urdieu’s terms, this is the habitus of a scientific field , a disposition acquired thro ugh prolonged immersion in what the field rewards, not through rules[48]. Explicit evaluative criteria do not improve inter-rater reliability; the knowledge resists codification even when codification is attempted[11]. Yet the institutional system nonethe less produces consistent quality stratification over time. This prolonged operation has left a trace: years of publication decisions across prestige tiers constitute an institutional record of accumulated scientific taste — a form of ‘ dark knowledge’[38 ] (evaluative information implicit in institutional outcomes but absent from any explicit criterion) that has never been exploited as a training signal for artificial intelligence. This tacit character exposes a de ep asymmetry in artificial intelligence. In domains with verifiable outputs, AI systems achieve superhuman performance[1, 2, 3]; but this advantage vanishes when the task shifts from verification to evaluation. When deployed in peer review, a setting where more than half of researchers already report using AI[22, 23], large language models consistently inflate scores, recommend acceptance at rates far exceeding human panels, and systematically overlook novelty, the dimension that most distinguishes important from incremental work[24, 25, 26]. They evaluate how research is presented, not what it contributes[27]. This lenien cy is not a prompting failure but a predictable consequence of preference-base d post-training: reinforcement learning (RL) from human preferences instills sycophantic behavior that intensifies with fu rther op timization[28, 29], producing fluent models that default to approval instead of the discrimination that taste demands. Here we construct a held-out benchmark of 120 article-derived research pitches in organizational psychology and management 1 , balanced across four quality tiers and evaluated in 2,914 human ratings from 48 expert gatekeepers and 174 junior researchers, and replicate the approach in economics with a 200-article benchmark. We test 26 AI configurations spanning frontier reasoning models, chat models, supervised fine-tuned models, architecture-matched base controls, and reinforcement-learning ablations, generating over 18,900 independent evaluation events under an expert-derived prompt optimized to favor frontier performance . We also evaluate auxiliary pairwis e discrim ination tasks to tes t whether th is evaluative ca pacity generaliz es beyo nd the training format. Frontier models pe rform only marginally above chance (31.1% versus 25%; macro-F1 0.236). Human evaluators perform somewhat better and preserve more balanced tier discrimination, but their judgments remain highly variable, with inter-rater agreement near zero. Neither prompting the mos t powerful AI systems nor assembling expert panels solves the evaluation problem. We align AI to these institutional traces . Individual reviewers disagree substantially, yet the institutional system, operating through iterated consensu s over time, produces reliable quality stratification that individual judgments do not[19]. It is this system-level signal, not individual reviewer accuracy, that supervised learning can exploit[20]. By applying supervised fine-tuning (SFT) to four base models using historical research-pitch/journal-outco me pairs, we align them to implicit evaluative criteria that neither written instructions nor the largest AI architectures have successfully transm itted. The results are clear. All four fine-tuned models independently achieve 55.0–59.2% accuracy, and a simple two-model pair extends this to 60.8%, capturing approximately six times the headroom between chance and ceiling recovered by frontier models and more than double that of the expert majority vote, at a total training cost below $300. Cross-ar chitecture replication confirm s that the effect is not model- 1 Organizational psychology and management is a large, globally distributed field (over 20,000 Academy of Management members; 1,800+ ranked journals in the Chartered ABS Academic Journal Guide). Top-tier journals maintain acceptance rates of 4–10%, creating a well-documented institutional hierarchy. Research quality is evaluated primarily on theore tical contribution and conceptual novelty, not resource access, isolating judgments of idea quality from confounds such as laboratory infrastructure. Meta-analytic inter-rater reliability is low (κ = 0.17 across 48 studies[11]), consistent with evaluation that is genuinel y tacit. specific: each single model exceeds both the frontier mean and the best frontier model. Beyond category prediction, the fine-tuned models exhibit calibrated self -knowledge: accuracy ex ceeds 80% in the top- confidence fifth and reaches 100% in the top 10% of predictions, giving the benchmark’s strongest practically useful signal for distinguishing correct from incorrect judgments. Without training on pairwise discrimination, the fine-tuned models transfer evaluative judgment to head-to-head pitch comparisons, a task format not present in training. The larger fine-tuned model further retains this evaluative signal when full idea summaries are compressed to one-sentence inputs not encountered during training, still exceeding the best frontier model and expert panels and demonstrating learned evaluative understanding instead of memorized tier assignments. When trained on economics institutional traces, the same approach yields 69.5% accuracy, confirmin g that the mechanism generalizes beyond the primary field. These findings carry implications for the acceleration of science. Scientific taste — the capacity to judge which questions are worth asking — is the binding constraint on scientific discovery, most acutely in the social and behavioral sciences, where the value of research questions resists formal verification and submission volumes far outstrip expert bandwidth. Cross-field replication in economics confirms that the mechanism is not specific to management. These are precisely the fields where frontier models fail most completely and where scalable, calibrated evaluation would yield the greatest returns. The mec hanism should generalize to other domains with socially judged outcomes and weak ex ante verification, including creative industries, venture investing, grant allocation, hirin g a nd promotion, and pol icy execution, whenever institutional decision histories accumulate large records of what later proved successful[19, 32]. In our benchmark, frontier-m odel performa nce clusters close to chance across the full breadth of proprietary and open-weight architecture s, yet a fine-tuned system trained on accumulated editorial decisions exceeds both the most powerful AI systems and the expert panels whose collective decisions generated the training data. The barrier to AI evaluation is not raw capability alone; it is the absence of the right training signal. Results A benchmark for evaluative judgment Peer review rests on a cognitive capacity that has resisted formal specification: the ability to make early- stage significance judgm ents before full empirical execution, when journals, funders, and labs decide where to invest scarce attention and resources. To isolate this capacity, we constructed a held-out benchmark in management comprising 120 article-derived research pitches, balanced across four quality tiers and spanning 15 research domains and 17 journals (of the 19-journal source universe; see Methods and Supplementary Methods SM5). The source articles were all published after June 30 , 2025. Each source article was transformed into a research pitch centered on the core research question and theoretical framing, with detailed methods, full empirical findings, and publication identifiers removed. Articles were assigned to four quality tiers based on their publicati on outlet (exceptional, strong, fair, limited; 30 per t ier; chance baseline 25%; Fig. 1). Because evaluators see only the research question and theoretical framing (not methods, results, or journal identity), tier assignment requires the kind of discrimination closest to taste: judging an idea’s promise from its presentation alone. Figure 1 | Stu dy design: institutional traces, alignm ent pipeline, evaluation, and mechanism tests a , Institutional traces of publication outcomes. Journal-tier publication outcomes (exceptional, strong, fair, limited) serve as the supervision signal for supervised fine-tuning (SFT). Two temporally disjoint training-data slices are constructed from a 19-journal source universe spanning 15 research domains: a recent slice (2020–2025; 4,479 research-pitch/journal-outcome pairs) used for the primary SFT models and an older slice (2015–2020; 3,368 pairs) used to test the temporal persistence of the institutional signal. Both slices are fully disjoint from the 120-pitch held-out benchmark. b , SFT alignment pipeline. Institutional outcomes are converted into standardized training representations and used to fine-tune four base models spanning two model families and multiple parameter scales (GPT-4.1, GPT-4.1-nano, Qwen3-4B, Qwen3-30B). Each base model produces an architecture-matched SFT checkpoint; checkpoint outputs are combined via probability averaging into an SFT ensemble node. c , Strict holdout evaluation. Training data and the held-out benchmark (N = 120 pitches, 30 per tier) are strictly separated. Three evaluator classes are assessed on the same unseen benchmark under a common four-tier output mapping: 11 frontier reasoning models, 4 SFT models plus ensembles (ens.), and human reviewers comprising 48 expert gatekeepers (E) and 174 junior researchers (J). All evaluators use the same frozen expert-derived prompt and identical tier definitions, ensuring that performance differences refl ect evaluator capability rather than task-format variation. d , Mechanism tests. Three auxiliary analyses probe how SFT acquires evaluative judgment. Self-knowledge test : each model produces a tier prediction together with a calibrated confidenc e score; the test asks whether confidence is systematically higher on correct predictions than on incorrect ones. Pairwise discrimination : two research pitches are presented side by side and the model identifies the stronger one, a task format entirely absent from training, testing whether SFT develops generalized quality ordering that transfers beyond the categorical classification used during fine- tuning. SFT versus reinforcement learning (RL) comparison : models from the same family are trained via direct supervised alignment (SFT) or reasoning-optimized RL (using reasoning-enabled configurations), and outputs are compared to test whether explicit chain-of-thought deliberation aids or impedes evaluative accuracy on tacit judgment tasks. Evaluators were asked to assign each pitch to one of the four tiers using an expert-derived assessment framework centered on originality and utility[9, 10]. The full evaluator pool comprised eleven frontier reasoning models, three chat variants, four supervised fine-tuned (SFT) models with architecture-match ed base controls, 48 expert gatekeepers, and 174 junior researchers, generating 2,914 human ratings and over 16,000 AI inferences across 26 model co nfigurations (including pr ompt-sensitivity , pairwise discrimination, and reinforcement-learning ablations), for a combined total exceeding 18,900 independent evaluation events. The evaluation prompt was selected as the formulation that maximized frontier model performance, ensuring that any advantage observed for fine-tuned models represents a conserv ative estimate. Frontier models and the anatomy of prediction collapse If evaluative judgm ent were redu cible to the kind of reason ing tha t frontier langu age models excel at (synthesizing information, recognizing patterns in text, applying criteria to cases), then the most capable models available should perform well above chance on this benchmark, particularly when given maximal advantage. We gave them that advantage: an evaluation prompt incorporating expert-derived assessment criteria[9, 10], stress-tested across variants to maximize frontier performance (Extended Data Fig. 1). It is not enough. Across a cohort of 11 frontier models, including Gemini 3.1 Pro, Claude Opus 4.6, GPT-5.2 High, Gemini 2.5 Pro, Qwen 3.5 Plus, Grok 4.1 Fast, and leading open-weight systems such as Kimi K2.5, DeepSeek V3.2 and GLM-5, mean accuracy was 31.1%, barely exceeding the 25% chance baseline and capturing only 8.1% of the available headroom between chance and perfect accuracy 2 (Fig. 2a; see Methods for statistical tests ). The failure runs deeper than accuracy alone: mean macro F1, a measure of balanced classific ation quality that penalizes strategies ignoring minority tiers, was 0.236, below the 0.25 expected from random guessing. Models achieve above-chance accuracy on the tiers they over-predict while producing zero recall on tiers they ignore, a strategy that inflates accuracy but destroys balanced discrimination. Figure 2 | Fr ontier models show s tructured predi ction collapse 2 Gemini 3.1 Pro reached the highest frontier accuracy (38.8%) but its response occasionally reproduced benchmark content instead of returning a tier label, raising benchmark-leakage concerns; we retain it with explicit caveating instead of treating it as a clean comparator. To provide a cleaner within-family reference, the frontier cohort also includes Gemini 2.5 Pro, released in June 2025. Even so, no frontier model reliably separates from the cohort after multiple-testing correction. a , Eleven frontier models are compared with paired accuracy and macro-F1 bars under the conservative primary protocol, with Gemini 3.1 retained but explicitly marked for contamination risk. Accuracy bars show 95% binomial confidence intervals (n = 120 per model), while macro-F1 shows bootstrap 95% confidence intervals from per-model predictions. The main point is that the full frontier cohort remains close to chance despite using the best-performing prompt formulation. b , Predicted-tier distributions (100% stacked) show heavy concentration in the strong and fair tiers and sparse use of the limited tier, making the collapse pattern visible beyond scalar accuracy. c , Row-normalized confusion matrices for four representative flagships show distinct failure modes: Gemini 3.1 as the best-performing but still compressed model, GPT-5.2 High with middle-tier clustering, Claude Opus 4.6 with strong-tier ceiling behavior, and Qwen 3.5 Plus as an additional reference model showing that collapse is not confined to the three highlighted proprietary flagships. Extended collapse diagnostics across all 11 models are shown in Supplementary Fig. 4. The failure follows three distinct patterns of prediction collapse that reveal how post-training alignment shapes model behavior on evaluative tasks (Fig. 2b). The first pattern is strong-ceiling collapse: Claude Opus 4.6 assigns 87% of articles to the “strong” tier, producing a macro F1 of just 0.145, predicting virtually everything as above-average quality, using only two of the four available categories. The second is leniency-to-middle collapse: Seed 2.0 and Grok 4.1 heavily over-assign above-average tiers. The third is middle-tier clustering: GPT-5.2 High and DeepSeek V3.2 concentrate almost all predictions in the strong and fair tiers, compressing the distribution into a narrow band. Across the cohort, 6 of 11 models never predict “limited” for any article, producing zero recall on the lowest quality tier (Fig. 2c; full confusion matrices for all 11 models in Extended Data Fig. 3a; class-level distribution diagnostics in Supplementary Figs. 1, 4). These patterns are consistent with reinforcemen t learning from human feedback optimizing outputs toward agreeable, broadly acceptable responses[28, 29], a prop erty that serves conversational fluency but systematically undermines the discriminating judgments that scientific gatekeeping demands. The evaluation prompt represented the most thorough attempt to transmit human evaluative criteria through explicit instruction. Its failure across all 11 models suggests that scientific taste resists propositional transmissio n: it cannot be told, only shown. Human expertise and the limits of domain knowledge The frontier models’ failure might reflect a limitation specific to artificial systems. Perhaps evaluative judgment requires the kind of tacit knowledge that only years of immersion in a research community can provide[8]. To test this, we recruited 48 expert gatekeepers 3 : current editors and editorial board members at leading journals in organizational behavior and management, individuals whose professional role consists precisely in making the quality judgments this benchmark demands. Expert reviewers did outperform frontier models, but not by the margin their credentials would predict. Individual expert accuracy averaged 36.2%, significantly above chance but reflecting enormous variability: some experts performed well below chance while others in one case reached 100% on their rated articles (Fig. 3a; Supplementary Fig. 2; see Methods for test s of significance). Wh en ex pert rating s were aggregated through majority vote, accuracy rose to 41.6% on the 89 articles that produced a clear plurality (31 of 120 articles yielded tied votes and were excluded), capturing 22.1% of the available headroom (Fig. 3b). Experts achieved macro F1 values of 0.353 (individual average) and 0.404 (majority vote), while the 11-model frontier average remained 0.236 (below the 0.25 random baseline), demonstrating that humans genuinely discriminate across quality tiers instead of collapsing predictions into a narrow band (Supplementary Fig. 6). 3 Each of the 120 benchmark pitches was rated by a mean of 3.2 experts, matching the typical reviewer load for a journal submission (2–3 independent reviewers per manuscript). The 48-rater panel thus provides per-pitch evaluation depth comparable to real editorial decisions while covering the full benchmark. Figure 3 | Hu man expertise helps, but noise remains dominant a , Individual expert and junior accuracy distributions are shown with majority-vote reference markers, highlighting that experts outperform juniors on average but both groups remain highly heterogeneous; Supplementary Fig. 2 and Supplementary Table ST9 provide the full expert distribution details. b , Human reference configurations are compared against the frontier-model baseline on accuracy and macro-F1 with 95% uncertainty intervals, showing that human raters preserve more balanced discrimination than the frontier cohort. c , Confidence and topic familiarity are summarized as rating-level Spearman effect estimates on correctness, wit h bootstrap confidence intervals and permutation-based P values; the panel makes clear that these self-reported experti se markers explain little of the observed variation in accuracy. d , Monte Carlo matched-N junior subsampling shows how majority-vote accuracy changes with panel size, revealing early gains followed by a plateau rather than unlimited improvement; Supplementary Fig. 3 and Supplementary Table ST10 provide the corresponding resampling details. The pattern of agreement among experts exposes a notable dissociation. Categorical agreement, whether experts assign articles to the same tier, was near-chance (Fleiss’ kappa = 0.047), barely distinguishable from noise[11]. Yet ordinal agreement, whether experts rank articles in roughly the same order of quality, was moderate (Krippendorff’s alpha = 0.307). This gap suggests that experts share a coarse sense of which articles are better or worse but disagree substantially on where to draw categorical boundaries, consistent with evidence that expert judgment is dominated by noise that persists regardless of training or experience[30]. We searched systematically for expertise markers that might predict which reviewers perform well. No expertise marker predicted accuracy: not career stage, self-reported confidence, nor topic familiarity (Fig. 3c). This pattern matches a broader literature showing that neither domain expertise[ 33], career stage, nor publication record[13] reliably predicts evaluation accuracy. Junior researchers (174 doctoral and postdoctoral scholars) performed comparably. Individual accuracy averaged 31.7%, and full majority vote reached 40.8% on the 103 articles with a clear plurality. Subsampling analysis, repeatedly drawing expert-sized panel s from the junior researcher pool, yielded accuracy not significantly different from expert majority vote (Fig. 3d; Supplementary Fig. 3). Panel-size analysis revealed that accuracy plateaus at approximately 10 reviewers per article (Extended Data Fig. 4), indicating a structural ceiling on what aggregation alone can achieve. These results establish tha t evaluative judgment is genuinely difficult, not merely for AI systems optimized for conversational agreeableness, but for the human experts whose professional authority rests on this very capacity. The quality signal exists: institutional publication outcomes confirm it. But neither the most capable reasoning systems in artificial intelligence nor decades of accumulated domain expertise can reliably recover that signal from research pitches alone. A different kind of learning might succeed: one that acquires taste from the institutional record instead of reasoning over explicit criteria. Fine-tuning on institutional traces recovers scienti fic taste We hypothesized that the inform ation needed to discriminate quality tiers is not absent from language models’ latent representations but rather inaccessible under standard prompting and reasoning regimes. To test this, we applied supervised fine-tuning (SFT) to fou r base models using 4,479 historical research- pitch/journal-ou tcome pairs from the primary recent/new institutional-trace slice, the data that encode the field’s accumulated gatekeeping consensus[19]. The 120 benchmar k research pitches were held out entirely and no t seen du ring training. SFT does not inject new factual knowledge; it aligns latent representations to the distributional regularities through which institutional quality manifests in research pitches (see Methods for training details). Before fine-tuning, we evaluated each base model on the benchmark to establish architecture-matched controls. Three of four base models scored at or near chance level (22.5–26. 7%); GPT-4.1 reached 32.5%, modestly above chance but far below its fine-tuned counterpart (Extended Data Table 1). These results confirm that architecture alone cannot extract evaluative signal: the smaller Qwen3-4B scored near chance before fine-tuning yet impr oved by 32.5 percentage points after, while Qwen3-30B-A3 B showed the largest gain in the study at 35.8 percentage points (Extended Data Fig. 3b). Fine-tuning produced a marked improvement. All four models achieved 55.0–59.2% accuracy, gains of 22.5 to 35.8 percentage points over their respective base models (Fig. 4a). That these gains emerge consistently across two model families and two parameter scales confirms that the effect is not an artifact of a particular architecture, scale, or training implementation. Figure 4 | SF T on institu tional traces recovers tier discrim ination a , Four architecture-matched base-to-SFT pairs (GPT-4.1, GPT-4.1-nano, Qwen3-30B, Qwen3-4B) are shown as linked points, with circles for accuracy and squares for macro-F1. Error bars are bootstrap 95% confidence intervals recomputed from the model prediction files used in this analysis, and the annotated percentage-point gains isolate the effect of supervised fine-tuning from architecture choice alone. b , An accuracy-only evaluator comparison places the SFT 2-model ensemble, all four single SFT checkpoints, expert and junior individual/majority references, the best frontier model, and the frontier average on the same axis with 95% confidence intervals from the benchmark summary tables. c , Row-normalized recall across the four quality tiers compares the SFT ensemble, best frontier model, frontier average, expert majority vote, and junior majority vote, showing that SFT recovers the full tier structure rather than collapsing toward the middle. d , Boundary-tier F1 for the exceptional and limited tiers highlights where SFT gains are strongest and why they matter for gatekeeping decisions at the two extremes of article quality. The selected primary pair, GPT-4.1-nan o (SFT) and Qwen3-30B-A3B (SFT), achieved 60.8% (95% CI: 51.7–69.2%), exceeding the best single Qwen3-4B checkpoint by 1.7 percenta ge points and capturing 47.8% of the headroom between chance and ceiling. The frontier average captures 8.1%; expert majority vote captures 22.1%. The SFT ensemble therefore captures app roximately six times the he adroom of frontier models and more than double that of expert panels, with a macro F1 of 0.607 reflecting balanced discrimination across all four tiers (Supplementary Table ST3). We systematically evaluated all six pairwise ensemble combinations among the four SFT checkpoints via probability averaging; accuracies ranged from 59.2% to 60.8%, and all six combinations exceeded the frontier average (31.1%) by 28.1 to 29.8 percentage points (Supplem entary Table ST4; Extended Data Fig. 3c). Comparisons confirmed the robustness of these differences. Against the frontier average (31.1%), the SFT ensemble outperformed by +29.8 percentage points (exact binomial, p = 1.74 × 10 ⁻ ¹¹); against the best-performin g frontier model under conservative protocol (Gemini 3.1 Pro, 39.1% majority accuracy on paired subset), by +20.9 pe rcentage points (McNem ar test, p = 0.001425; Supplementary Table ST8). Because no individual frontier model significantly separate s from the cohort after multiple-testin g correction, the comparison against the frontier mean remains the most representative. Against individual evaluators, the ensemble surpassed the typical expert by a large margin (60.8% vs. 36.2% mean, t(47) = - 8.32, p < 0.001, d = 1.20), with 83% of experts and 97% of junior researchers scoring below the ensemble (Fig. 4b). Against collective majority votes, SFT showed advantages of 21.4 percentage points over expert majority (p = 0.00729) and 21.4 percentage points over junior majority (p = 0.00196). The per-tier analysis reveals where the advantage concentrates and exposes a fundamental distinction in evaluation style (Fig. 4c,d). SFT achieved higher balanced detection rates (F1) than expert panels at all four tiers, with the largest gain at the exceptional tier (0.68 versus 0.33) and continued improvements at the limited (0.62 versus 0.40), strong (0.58 versus 0.46), and fair (0.55 versus 0.43) tiers. Human panels remain conservative gateke epers: hig h precisio n when they commit to an extreme judgment (63% for exceptional, 60% for limited), but missing the majority of articles at each quality end (23% recall for exceptional, 30% for limited). The SFT ensemble predicts much closer to the benchmark base rate (38 exceptional, 25 strong, 35 fair, 22 limited), and its false positives at the exceptional tier remain mostly near-misses from the adjacent strong tier (10 of 15), not catastrophic misclassifications. In any system where the cost of missing exceptional work exceeds the cost of additional review, the typical condition when submission volumes far outstrip expert bandwidth, this broader coverage addresses the more consequential failure mode. To test whether this signal reflects durable evaluative structure or transient patterns, we trained matched architectures on an older institutional trace slice (2015–2020, 3,368 pairs), introducing a five- year lag relative to the benchmark. The Qwen3-30B SFT trained on the older slice reached 46.7%, still exceeding both the frontier average (31.1%) and expert majority vote (41.6%), versus 58.3% for its recent- slice counterpart (Extended Data Fig. 6). What drifts is the quality bar, not the signal: the older model over-predicted exceptional articles by 50%, reflecting competitive thresholds that have since risen as submission volumes grew and acceptance rates fell[44, 45]. The model learned the standards of its era faithfully; those standards have since been raised. Total training cost across all four models was under $300, spanning two cloud API fine-tuning jobs (~$200 and ~$10 for GPT-4.1 and GPT-4.1-nano, no hardware required) and two local GPU runs (~1 and ~8 A100 hours for Qwen3-4B and Qwen3-30B-A3B; Supplementary Table ST2). The critical ingredient behind the main benchmark gains is the tr aining signal, institutional traces encod ing accumulated scientific taste, not model scale alone. Model scale matters mainly for how robustly that learned signal generalizes under severe input compressio n. The mechanism: training si gnal drives per formance; model scale shapes generalization The SFT results pose a mechanistic puzzle. Why does a simple training procedure on journal-tier labels unlock evaluative performance that neither the largest frontier models nor experienced human reviewers achieve? Four lines of evidence clarify the mechanism and its boundary conditions: direct example-based alignment to institutional traces drives the benchmark gains across architectures, whereas mode l scale mainly governs how robustly the learned representa tion generalizes beyond the full idea-summary format. Calibrated metacognition. A defining property of genuine expertise is knowing what one knows, the capacity to assign higher confidence to judgments that prove correct. The SFT ensemble exhibited this property: its prediction confidence was significantly higher on correct predictions than on incorrect ones (confidence gap = +0.082, p = 0.0081; expected calibration error = 0.073; Fig. 5a). All four individual SFT models showed the same pattern, although the Qwen3-4B gap was much smaller, confirming that calibration is a consistent property of the fine-tuning approach, not an artifact of a single model. Figure 5 | SF T me chanism: self-k nowledge and generalized pair wise ranking a , Mean confidence for correct and incorrect predictions is compared for the SFT ensemble, GPT-5.2 chat, experts, and juniors. Human 1-5 confidence is mapped to 0-1 by (x - 1) / 4, and P values are one-sided Mann-Whitney U tests comparing whether correct ratings are more confident than incorrect ratings at the rating level. The panel asks whether each evaluator knows when it is right. b , Selective-prediction curves show how accuracy changes as lower-confidence cases are deferred, with AI predictions ordered from highest to lowest confidence and human curves defined by confidence thresholds; this panel visualizes the practical triage value of calibrated abstention. c , Overall weighted accuracy on the fixed 300-pair pairwise evaluation set compares the shared four-model subset: SFT GPT-4.1, Gemini 3.1 Pro, GPT-5.2 High, and the GPT-4.1 baseline, with 95% binomial confidence intervals and raw unadjusted exact paired McNemar P values versus SFT. d , A hard-boundary summary isolates the two most informative pair types, strong_exceptional and fair_strong, showing that the SFT pairwise advantage is concentrated where relative ranking is hardest. Extended Data Fig. 2 retains the six-pair-type heatmap and discordant-pair decomposition for the same plotted subset. This calibration stands in sharp contrast to both frontier models and human evaluators (Fig. 5a; Extended Data Fig. 4a-c). GPT-5.2 chat exhibited extreme, undifferen tiated overconfidence: near-maxim um confidence regardless of whether its predictions were correct, despite near-chance accuracy (ECE = 0.657, a measure of how well stated confidence matches actual accuracy; Extended Data Fig. 4b). Human expert confidence was similarly non-discrimina tive. Junior researcher confide nce showed a statistically detectable but practically weak rating-level association with accuracy. Frontier models and expert raters therefore provide no comparably useful self-screening signal, and the detectable junior effect remains too weak to support high-precision abstention . The SFT models can. When predictions were restricted to the top sixth by confidence (16.7% coverage), accuracy reached 80.0%; at the top 10.0% (12 of 120 articles), accuracy reached 100%; every high-confidenc e prediction wa s correct (Fig. 5b). This selective pre diction capacity, the ability to flag cases where the model’s judgment is highly reliable while abstaining on uncertain ones, represents the strongest practically usefu l metacognitive triage signal in the benchmark . In practice, this enables a confidence-base d workflow: route high-confidence predictions directly and flag uncertain cases for human review. Pairwise head-to-head discrimination . To confirm that SFT develops generalized evaluative judgment, not category-specific pattern matching, we tested models in a pairwise format entirely absent from training. Models received two research pitches simultaneously and judged wh ich represented the stronger research pitch. The main figure p airwise panels focu s on the shared four-model subset used throughout the pairwise analysis: SFT GPT-4.1, Gemini 3.1 Pro, GPT-5.2 High, and the GPT-4.1 baseline. Within this shared subset, SFT GPT-4.1 reached 84.3% (253/300), versus 77.3% (232/300) for Gemini 3.1 Pro, 78.7% (2 36/300) for GPT-5.2 High, and 76.0% (228/300) for the GPT-4.1 baseline (Fig. 5c; Supplementary Table ST1). Fine-tuning on institutional traces thus exceeded both the model’s own pre- training baseline and the frontier comparators in this auxiliary pairwise set. The gains were not uniform across pair types: the largest margins appeared at the fair-strong and strong-exceptional boundaries, where SFT reached 84.0% and 64.0% versus 70.0% and 50.0% for Gemini 3.1 Pro, 68.0% and 56.0% for GPT- 5.2 High, and 66.0% and 54.0% for the GPT-4.1 baseline (Fig. 5d). Extended Data Fig. 2 provides the full heatmap across all six pair types and the discordance decomposition for the same plotted subset. On the same 300 paired items, raw unadjusted exact McNemar tests showed significant SFT advantages versus Gemini 3.1 Pro (p = 0.00646), GPT-5.2 High (p = 0.0300), and GPT-4.1 baseline (p = 0.000621; Fig. 5c). SFT versus reinforcement learning. If evaluative judgment is tacit and resists decomposition into reasoning steps[8], training methods that optimize articulated reasoning chains may perform worse than methods that learn directly from examples. Cognitive science supports this prediction: verbal articulation of holistic judgments degrade s their quality[35], and chain-of-thought prompting yields negligible or negative gains outside mathematics and symbolic reasoning[36, 37]. We tested this by training reinforcement learning variants on the same base architectures (see Methods). RL run-pooled accuracy was 40.3%, above the frontier average (31.1%) but below every SFT single model (55.0–59.2%; Extended Data Fig. 5). When the model’s reasoning chain diverged from its final label, accuracy dropped markedly; when reasoning and label agreed, performance approached SFT levels. Explicit deliberation can override otherwise sound evaluative intuitions[3 5, 49]. SFT learns taste through exposure to exemplars , not through reasoning about criteria. Transfer under input compression. A natural objection to the SFT results is that the models may have learned superficial patte rns in the rich contextual descriptio ns used during training, not genuin e evaluative judgment. We tested this by evaluating the same fine-tuned checkpoints on an input format completely different from the one used in training: one-sentence idea statements stripped of theoretical framing, methodological detail, and contribution claims (for examples of paired one-sentence and full- summary inputs, see Supplementary Methods SM4). The larger GPT-4.1 fine-tuned model retained substantial evaluative signal under this compression, achieving 49.2% accuracy on one-sentence inputs versus 55.0% on the full summary (Extended Data Fig. 7a). This compressed input accuracy exceeds the best frontier model on the full input (Gemini 3.1 Pro , 38.8%) and the expert majority vo te (41.6%), demonstrating that the evaluative representation learned through fine-tuning survives radical reduction of the input signal. The transfer was not uniform: recall at the exceptional and strong tiers declined while recall at the limited tier rose from 60.0% to 83.3%, indicating a conservative shift under uncertainty, not random degradation (Extended Data Fig. 7b,c). The smaller GPT-4.1 -nano fin e-tuned model sh owed a sharply dif ferent pattern. Despite matching GPT-4.1 SFT on the full input (57.5% versus 55.0%), it collapsed to 33.3% under compression, barely above chance and indistinguishable from its own base model (30.8%) . This asym metry indicates that acquiring the evaluative signal and generalizing it across input formats are separable capabilities: the same institutional training signal improves both models on the full benchmark, but greater representatio nal capacity makes that learned signal more robust under severe compression. Together, these lines of ev idence (calibrated self-knowledge, generaliz ed pairwise discrimination, transfer under input compr ession, and the SFT advan tage over RL) converg e on a more specific conclusion: supervised fine-tuning on institutional traces extracts a genuine evaluative representation. The training signal drives the benchmark gains across architectures, while model scale shapes how robustly the learned representation transfers under severe input compression. Voting consistency and aggregation asymmetry If indiv idual SFT models capture evaluative signal, a natural question is whether aggregating across models amplifies that signal further, and whether the same holds for frontier models and human panels. The final mechanism question is whether aggregation improves judgment through additional votes alone, or through the quality and diversity of the voters. Fig. 6 presents a unified comparison of filtering by consensus across AI and human evaluator classes, revealing a fundamental asymmetry in how aggregation functions across evaluator types. Figure 6 | Ag gregation asymmetry after metric -definition alignmen t a , Cross-model consensus policies are compared for the four SFT models and a fixed four-model frontier set. Accuracy intervals use Wilson 95% confidence intervals, and coverage indicates the share of articles satisfying each agreement rule. The contrast is substantive: stricter consensus improves SFT precision sharply, whereas frontier cross-model voting remains weak even at higher agreement thresholds. b , Human consensus policies compare expert majority, junior majority, junior >=50% vote share, and expert unanimity among articles with at least two expert ratings. Accuracy intervals in this panel also use Wilson 95% confidence intervals, and labels report the associated coverage, making the human accuracy-coverage tradeoff explicit. c , Same-model 8-run gains for frontier systems are summarized as majority-vote accuracy minus mean single-run accuracy, showing that repeated sampling alone yields only modest improvements and does not solve the underlying judgment problem. Across the four SFT models, full consensus (4/4) occurs on 42.5% of articles (N = 51) and reaches 72.5% accuracy, the highest precision achieved by any evaluator configuration in this study (Fig. 6a). Within this unanimous subset, accuracy is sharpest at the quality extremes: 100.0% for the exceptional tier and 66.7% for the limited tier, while articles in the strong tier remain hardest (53.8%; fair 66.7%; Supplementary Table ST12). Relax ing to >=3/4 agreement expands coverage to 80.8% at 66.0% accuracy. When the strongest agreement is on ly 2/4, accuracy falls to 34.8%, well below the unan imous subset and only modestly above chance, indicating that mod el disagreement is a useful uncertainty signal, not rando m noise (Fig. 6a). Human voting exhibits a steeper tradeoff. Expert unanimous agreement (among articles with at least two expert ratings) achieves 69.2% accuracy at 10.8% coverage, while >=50% junior consensus reaches 56.0% accuracy at 20.8% coverag e. Without consensus filtering, junior and expert full-pane l plurali ty accuracies are 40.0% and 39.2% on all 120 articles (Fig. 6b). The contrast with frontier models is sharp. Cross-model voting using a diverse four-model frontier set (Gemini 3.1 Pro, Claude Opus 4.6, GPT-5.2 High, GLM-5) reached only 32.7% on the 104 articles with a clear plurality, and higher consensus thresholds did not recover performance (Fig. 6a,c). Frontier models fail to create meaningful consensus because post-training biases cause correlated errors across the same articles. SFT cross-model consensus delivers a 15-percentage-point boost over the average single SFT model (56.9% to 72.0% at 4/4 consensus) because SFT models, despite independent training on different architectures, converge on a shared evaluative signal (inter-model Cohen ’s kap pa = 0.50–0.60, versu s human kappa approximately 0.03–0.05; Supplementary Table ST12). The practical implication is a selective evaluation workflow: route the 42% of submissions where all four SFT models agree (at 72% accuracy) directly, and concentrate reviewer attention on genuinely ambiguous cases. Cross-field replication in economics The results above establish the institutional trace mechanism, its mechanistic underp innings, and its aggregation properties in management. A natural question is whether the mechanism is specific to that field or generalizes to othe r social science disciplines with disti nct publication cultures and evaluation norms. We constructed an additional benchmark: 200 held-out research pitches in economics, balanced across the same four tiers and drawn from 2025 publications (Supplementary Methods SM9). We then trained new SFT checkpoints on field-specific institutional traces (5,593 economics pairs) using the same procedure. The mechanism replicated (Fig. 7). The best single model (Qwen3-30B) reached 69.5% accuracy, with all three architectures at least 64% (Fig. 7a,b). Architecture-matched base models remained at chance (25– 26%), confirming that the gains are attributable to fine-tuning (Supplementary Table ST15). Calibrated confidence replicated as w ell: accuracy rose sharply when coverag e was restricted to hi gh-confidence predictions (Fig. 7c). Figure 7 | Ins titutional-tr ace r etraining re plicates in e conomics The economics validation reuses the same four-tier output space and the same rq_with_context representation logic as the main benchmark, but evaluates a held-out 2025 subject-specific sample (N = 200; 50 items per tier). a , Architecture-matched base- versus-in-domain-SFT scores in economics for Qwen3-30B, Qwen3-4B, and GPT-4.1-nano, shown as linked points with circles for accuracy and squares for macro-F1. Horizontal whiskers show bootstrap 95% confidence intervals recomputed from the raw subject prediction files. The grey dashed line marks the 25% chance baseline. The green dashed and dotted reference lines mark the best frontie r (Gemini 3.1 P ro) full-set acc uracy and macro -F1 in economics, resp ectively (46.0 % accuracy; 3 8.45% macro-F1), under the same single-label frontier scoring convention used for the subject summaries. b , Row-normalized confusion matrix for the best single economics model (Qwen3-30B SFT), showing that the strongest in-domain checkpoint recovers all four tiers rather than collapsing into the middle categories. c , Selective-prediction curve for that same best economics model, with art icles ordered from highest to lowest predicted confidence; the curve shows how accuracy rises as lower-confidence cases are deferred. Together, these panels show that the institutional-trace mechanism replicates in economics, whi le remaining clearly separated from the best currently available frontier comparator and retaining a practically useful confidence signal under the new subject-specifi c validation. Strikingly, even the management-trained SFT GPT-4.1, which never encountered economics articles or journal tiers during train ing, achie ved 43.5% on the eco nomics benchmark (p = 9.2 × 10 ⁻ ⁹ vers us chance), a +14.0 percentage-point gain over its own base model (29.5%, not significantly above chance; Supplementary Fig. 7). Th is cross-field transfer suggests that evaluative signals share structure across related social science disciplines: some component of the taste learned from management institutional traces generalizes to economics research evaluation. A model trained jointly on management and economics institutional traces maintained strong performance across both domains (Qwen3-30B: 69.5% economics, 61.7% management; Extended Data Fig. 8), confirming that evaluative signals from distinct fields do not interfere when combined. Discussion Human evaluators cannot reliably agree on wh ich resear ch ideas belong in which qu ality tier. Across nearly 3,000 ratings, experienced gatekeepers (editors and editorial board members at leading journals) showed categorical agreement barely above chance (Fleiss’ κ = 0.047); among a larger panel of doctoral and postdoctoral researchers, the pattern was the same. This reflects not individual failure but the nature of the problem. Evaluative judgment in science is collective tacit knowledge[20] : no individual reviewer can articulate what distinguish es exceptional from merely competent work, yet the institutional system, integrating thousands of such judgments over decad es, produces reliable quality stratification[19]. The knowledge is real, but it is not in any one person’s head. It resides in the accumulated record of what was selected, funded, and published, an institutional trace that encodes a field’s accumulated taste in a form no explicit rubric has managed to capture[8, 11]. The dominant push in AI for science assumes the bottleneck is generation. Autonomous systems can now produce complete scientific manuscripts at scale: Project A PE has generated over 300 economics research papers using frontier models with multi-stage review pipelines[46], and the AI Scientist system has pro duced end-to-end ma chine-learning manuscripts submitted to peer-reviewed venu es[47]. Yet in head-to-head tournaments against published human research, AI-generated papers win less than 5% of the time[46], a margin difficult to distinguish from noise in the judging process itself. AI tools have expanded scientific output but may have contracted its quality and focus[5]. These systems demonstrate that raw generative capability is not the constraint: frontier models can synthesize literature, run analyses, and write fluent prose. What they cannot do, and what our results confirm, is evaluate which ideas deserve pursuit in the first place. Frontier reasoning models capture barely 8% of the available headroom on our benchmark (Fig. 2a); supervised fine-tuning on institutional traces captures nearly half, at a fraction of the cost (Fig. 4a). The evaluative signal was never missing; it was never the training target. These results suggest a practical alternative to autonomous scientific generation: an upstream evaluative filter, trained on institutional traces, that screens research ideas before resources are committed. Several features of the fine-tuned models make such deployment realistic. The models know when they are likely to be right: calibrated confidence concentrates the most reliable predictions into a high-precision subset that could be acted on directly, while flagging uncertain cases for human review (Fig. 5a,b). The evaluative capacity also generalizes beyond the training format. Without exposure to pairwise comparisons during training, the models transfer to head-to-head discrimination tasks, indicating learned quality ordering an d not just memorized category assignments ( Fig. 5c,d). Cros s-model consen sus provides a second reliability lever: when ind ependently trained models agree, accuracy rises sha rply; when they disagree, that disagreement itself becomes a useful triage signal (Fig. 6a). And because the SFT ensemble and expert panels err on largely different articles, combining the two could recover substantially more of the available headroom than either alone (Supplementary Fig. 5) . The practical workflow this enables is selectiv e: route clear cases through the model, concentrate scarce rev iewer attention on the genuinely ambiguous remainde r. The economics replication strengthens these implications. The same fine-tuning procedure, applied to a different field with distinct jou rnals, evaluation norms, and i ntellectual traditions, produced even stronger results (69.5% best single model; Fig. 7). Pooled training on both fields simultaneously preserved performance in each domain (Extended Data Fig. 8), sug gesting that evaluative signals from different disciplines coexist without interference. A management-trained model that never encountered economics articles still exceeded chance on the economics benchmark by 14 percentage points (Supplementary Fig. 7), pointing to shared evaluative structure across related social sciences. These cross-field results shift the interpretation from a field-specific finding to a general mechanism: wherever institutional gatekeeping has operated long enough to leave a trace, that trace is likely learnable. Several limitations quali fy these conc lusions. Our benchmarks cover two social scien ce fields; whether the mechanism extends to STEM disciplines with different epistemic structures, where empirical reproducibility provides a partial quality signal absent in social science, remains untested. The transfer results under input compression reveal an open boundary condition: the larger fine-tuned model carries evaluative signal across radical input compression, but the smaller model does not (Extended Data Fig. 7), indicating that representational capacity governs transfer robustness. Future work should test which model properties or training-data characteristic s determine this threshold. Institutional traces are a proxy for quality, not an objective ground truth. They encode the accumulated consensus of a gatekeeping system with well-document ed biases: toward incremental over novel work[18], toward established methodologies, toward dominant paradigms, and toward a competitive bar that rises over time as submission volumes grow. The SFT model learns what the system historically rewarded, w hich is not identical to what is objectively best. This limitation is real but bounded: in domains where quality is irreducibly unverifiable, institutional consensus over time is not a proxy for taste; it is the operational definition of taste[19, 46]. The model’s calibrated uncertainty provides an internal check on its own reliability that the system it learned from lacks. The signal is als o not s tatic: models trained on older i nstitutional tr aces still outperform frontier systems but show drift in tier calibration as competitive thresholds shift (Extended Data Fig. 6), implying that periodic retraining will be necessary as institutional standards evolve. The mechani sm generalizes beyond any single discipline. In any domain where collect ive human evaluation has operated over time, the historical record of what was selected, funded, or rewarded constitutes a learnable signal: venture investing, where expert prediction is notoriously poor[32]; grant allocation, where reviewer agreement approaches zero[12]; and creative industries, where market outcomes consistently defy expert forecasts. The social and behavioral sciences, where evaluative judgment resi sts formal ve rification and sub mission vol umes far outs trip reviewer capaci ty, stand to benefit most immediately. The approach is also uniqu ely cost-ef fective: S FT requi res only historical decision records already deposited in institutional archives, total training cost was under $300, and the resulting models provide calibrated confidence scores that make their uncertainty transparent and auditable. For science at scale, the path forward may not be AI systems that replace human judgment or that generate research autonomously, but systems that learn the taste human institutions have accumulated over decades and apply it where human bandwidth cannot reach. Autor predicted that machine learning would overcome Polanyi’s paradox, the barrier between knowing and telling, by learning from outcome data instead of explicit instruction[39]. Our results confirm this prediction: frontier models that receive evaluative criteria through prompts perform at chance; SFT that learns from outcome data recovers nearly half the available headroom in management and exceeds it in economics. Publication records function as implicit feedback from the evaluative community: individually noisy but collectively informative, encoding what Hinton et al. termed ‘dark knowledge’ [38], evaluative structure embedded in institutional sorting but invisible in any stated criterion. Taste was never uniquely human; it was always deposited in the institutional record, waiting for a learning procedure simple enough to extract it. Acknowled gements We thank the 48 expert gatekeepers – editors and editorial board members at leading journals in organizational behavior and management – and the 174 doctoral and postdoctoral researchers who volunteered their time to evaluate research pitches. Their careful judgments provided the human benchmark against which all AI systems were measured, and their participation made this study possible. Qiuping Peng and Liyun Zhang assisted with data collection and project management. Data av ailability The de-identified benchmark data, model prediction files, human-rating files, figures, tables, and reproducibility scripts supportin g this study will be released through the project repository at https://github.co m/FutureTech-O B/ai-taste . The repository will also provide the fine-tuning code, training data, and information on access to the resulting model weights. Reference s 1. J umper, J. et al. Highly accurate protein structu re p rediction with AlphaFol d. N a tur e 596 , 583–589 (2021). 2. H ubert, T . et al . Olympiad-level forma l mathematical reasoning with reinforce ment learning. N a tur e (2025). 3. O penAI. OpenAI 2025 ICPC su bmissions. Git Hub ht tps://github .com/opena i/openai-ic pc-2025 (2025). 4. S i, C. e t al. Can LLMs generate novel research ideas? A la rge-scale human study with 100+ N LP res earchers. ICL R (2025). 5. H ao, Q. e t al. Artifi cial i ntelligenc e tools ex pand scient ists’ impact but contract science’s fo cus. N a tur e 649 , 1237–1243 (2026). 6. K arpatne, A. e t al. AI- enabled scientif ic r evolution in the age of gene rative AI: second NSF workshop report. npj A r tif . Intell. (2025). 7. D ell’Acqua, F. et a l. Navig ating the jag ged tech nological frontier: Field e xperimenta l eviden ce of the e ffects of AI on knowled ge worker p roductivity an d q uality. Ha r v a r d B usiness S chool W o r k ing P a per 24-013 (2023). 8. P olanyi, M. T he T a cit D im ension (Doubleday , 1 966). 9. C orley, K.G. & Gioia, D.A. Buildin g theory a bout theory building. A ca d. M a na g. R ev . 36 , 12–32 ( 2011). 10. Colq uitt, J .A. & Ge orge, G. Publishing in A MJ—Part 1: Topic choice. A ca d. M a na g. J . 54 , 432–435 (2011). 11. Born mann, L., Mutz, R . & Danie l, H.-D. A rel iability-ge neralizatio n study of jou rnal peer reviews. P L oS ON E 5 , e14331 (2010). 12. Pier , E.L. e t al. Low agreement among review ers ev aluating the sa me NIH grant appli cations. P N A S 115 , 29 52– 2957 (2018). 13. Call aham, M.L . & Terci er, J. The relationsh ip of pre vious training and ex perience of journal p eer rev iewers to subsequent review quality. P L oS M ed. 4 , e40 (2007). 14. Blac k, N ., v an Rooyen, S., Godlee, F., Smi th, R . & Eva ns, S. What makes a good reviewe r and a good review for a general medica l journal? J A M A 280 , 2 31–233 (1998). 15. Call aham, M. & M cCulloch, C. Long itudinal trends in the performa nce of scientific peer revie wers. A nn. Em er g. M ed. 57 , 141–148 (2011). 16. Lam ont, M. How P r of essor s T hink : Inside th e Cur ious W or ld of A ca d em ic J udgm ent (Harvard U niv. Pres s, 2009). 17. Boud reau, K.J. et al. Lookin g across and l ooking beyond the knowle dge fr ontier. M a na g. S ci. 62 , 2765–2783 (2016). 18. Tepl itskiy, M., Peng, H., Blasc o, A. & Lakhani, K.R. Is n ovel research worth do ing? Eviden ce from peer review at 49 jour nals. P N A S 119 , e 2118046119 (202 2). 19. Sile r, K., Lee, K. & Be ro, L. Mea suring the effectiveness of scientific gatekeep ing. P N A S 112 , 360–365 (2015). 20. Coll ins, H. T a cit a nd Ex plicit K n ow ledge (University of Chicago Press , 2010 ). 21. Nona ka, I. & Takeuchi, H. T he K now ledge- Cr ea ting Com p a ny (Oxford Univ. Press, 1995). 22. Nadd af, M. More t han h alf of researchers now use AI for pee r revi ew—often against guidance. N a tur e 649 , 273–274 (2026). 23. Berg strom, C.T. & Bak-Co leman, J. AI, peer re view and the huma n activity of s cience. N a tur e (2025). 24. Russ o Latona, G. et al . The AI review lottery: Wid espread AI-assist ed peer reviews boost paper sc ores and acceptanc e rates. a r X iv 2405.02150 (2024) . 25. Zhu, C . et al. Wh en your reviewer is a n LLM: Biases, divergenc e, and prompt injection risks in peer review. a r X iv 2509.09912 (2025) . 26. Shin , H. et al. Mi nd the bli nd spots: A foc us-level evaluatio n framework for LLM re views. P r oc. EM N L P (2025). 27. Thel wall, M. Ca n C hatGPT evalua te re search quality? J . Da ta Inf . S ci. 9 , 1 –21 (2024). 28. Chri stiano, P.F. et al . Deep reinf orcement learning from human preference s. N eur IP S (2017). 29. Shar ma, M. et al. Towards understan ding sycophancy in language models. P r oc. ICL R (2024). 30. Kahn eman, D., Sibony, O. & Sunstein, C.R. N oise: A F la w in Hum a n J udgm ent (Little, Brown Spark, 2021). 31. Guo, D. et al. DeepS eek-R1 i ncentivizes re asoning in LLMs throug h reinforce ment learning. N a tur e 645 , 633– 638 (2 025). 32. Tetl ock, P.E . Ex per t P olitica l J udg m ent (Princeton Univ. Press, 2005). 33. Gall o, S.A. e t al. The influenc e of p eer revie wer expe rtise on the ev aluation of research funding applicatio ns. P L oS ON E 11 , e0165147 (2016). 34. Wu, Y. et al. O n the gene ralization of SFT: A reinforceme nt learning perspective with reward re ctification . ICL R (2026). 35. Wil son, T.D. & Sc hooler, J.W. Thin king too muc h: Introsp ection ca n red uce the quality of prefe rences and decisions. J . P er s. S oc. P sy chol. 60 , 181–192 (1991). 36. Liu, R. et al. Mind your step (by ste p): Chain-of- thought can reduce per formance on tas ks where t hinking makes humans worse. P r oc. ICM L (2025). 37. Spra gue, Z. et al. To CoT or not to Co T? Chai n-of-thought help s main ly on math an d symbol ic rea soning. ICL R (2025). 38. Hint on, G., Vinyal s, O. & Dean, J. Distilling the knowledge in a neura l n etwork. a r X iv 1503.02531 (2015) . 39. Auto r, D.H. Why are there sti ll so many jobs? The history and future of workplace automat ion. J . Econ. P er spect. 29 , 3–30 (2015). 40. Shao , Z. et al. DeepSee kMath: Pushi ng the limits of mathe matical reasonin g in ope n language mo dels. a r X iv 2402.03300 (2024). 41. Wei , J. et al. Finetuned language models are zero-shot learners. ICL R (2022). 42. Yu, Q. et a l. DAP O: An o pen-source LLM reinforc ement learning system at scale. N eur IP S (2025). 43. Qu, Y. et al. POPE: Learning to reason on hard problems via privileged on-policy exp loration. a r X iv 2601.18779 (2026). 44. Grub er, M. Analy zing Academ y of Manag ement Journa l operat ions with artificial int elligence (2006– 2022). A ca d. M a na g. J . 68 , 1–10 (202 5). 45. Card , D. & DellaVigna, S. Nine facts about top journals in econom ics. J . Econ. L it. 51 , 144–161 (2013). 46. Yana gizawa-Dr ott, D., Awuah, K. et al. Proje ct APE: Autonomous pol icy eva luation wi th AI-gener ated economics researc h pa pers. Social Catalyst Lab, University of Zurich https://ape.soc ialcatalys tlab.org/ (2026). 47. Yam ada, Y. et al. The AI Scie ntist-v2: Worksho p-level auto mated scientific discover y via agentic tree searc h. a r X iv 2504.08066 (2025) . 48. Bour dieu, P . Distinctio n: A S ocia l Cr itique of the J udgem ent o f T a ste (Harvard Univ. Press, 1984). 49. Dijksterhui s, A. et al. On m aking the right c hoice: The deliberati on-without- attention effect. S cience 311 , 10 05– 1007 (2006). Methods Study de sign. Eva luative judgment in science is widely reco gnized as tacit and institutionally distributed[8, 16, 20]: ethnographic evidence shows that even experienced gatekeepers rely on intuitive assessment and disciplinary sensibility rather than rule application[16], and decades of structured rubric design have not improved inter-rater reliability[11]. This study was designed to test whether AI systems can recover such judgment from institutional decision traces when asked to assess research ideas before empirical results are known. We applied the protocol to two social science fields, organizational psychology/ma nagement and economics, to test both the mechanism and its generality. We centered the protocol on early-stage research-pitch evaluation instead of full-paper critique, and imposed a shared four- tier decision space across all evaluator classes (human and AI) so that performance differences reflect differences in judgment, not task format, criterion framing, or access to stylistic cues. Human evaluation, frontier-model benchmarking, and mechanism tests (reinforcement-learning ablation, pairwise discrimination, voting consistency) were conducted in management; economics served as a replication of the core SFT mechanism with architecture-matched base controls. Benchmark construction and ratio nale for labels . We co nstructed bala nced benchmarks in two fields: 120 article-derived research pitches in organizational psychology and management (30 per tier, 19- journal source universe ; Supplementary Method s SM5) and 20 0 in economics (50 pe r tier, 38-journal source universe; Supplementa ry Table ST14). All source articles were published after mid-2025. In both fields, the four tiers (exceptional, strong, fair, and limited) were derived from journal-level publication outcomes mapped to pre-speci fied tier frameworks reviewed by domain experts. Operatio nally, exceptional denotes elite field-defining journals, strong near-elite specialty outlets, fair established field journals, and limited lower-prestige or narrower-scope outlets. Journal-level labels were chosen because they represent the most stable institutional record of long-run gatekeeping decisions currently available at scale[19, 20]: individual reviewer judgments are dominated by noise[30], but the system-level sorting that produces prestige-tier differentiation integrates iterated editorial consensus over time. This make s the training target explicit: the model learns to recover collective institutional judgment, not to approximate any single reviewer’s opinion. A balanced design was chosen to prevent models from exploiting class-frequency priors and to enable interpretable per-tier comparisons, especially at the quality extremes where editorial decisions are most consequential. Tier balance is ensured by construction (30 pitches per tier in management; 50 per tier in economics). Input standardization and extraction workflow. Evaluator comparisons are meaningful only if all evaluators see the same information. Each source article was therefore transformed into a standardized research-pitch text using a fixed extraction workflow (Supplemen tary Methods SM4). These pitches presented the core research qu estion and theoretical framing without detailed methods, fu ll empirical findings, journal identity, or author identity. The primary extractor was Qwen3-235B-A22B-I nstruct, a large lan guage mo del selecte d for extraction quality and format stability after cross-validation against alternative strong models. We generated five textual formulations (varying in the balance of theoretical context, research-questio n specificity, and methodological detail) and selected the research-question-w ith- context form as the primary representation through pilot evaluation on a held-out development set, because it preserves theoretical motivation while stripping later-stage evidence that would trivially encode publication outcomes. This normalization isolates idea-level assess ment and reduces shortcut learni ng. The same extraction pipeline and policy were applied across both fields, all model families, and materials given to human raters so that evaluator comparisons remained behaviorally aligned. Training corpus and leakage control. For each field, supervised training data were drawn from the field’s source universe and fully disjoint from its held-out benchmark. The management corpus comprised a primary recent/new slic e (4,479 research-pitch/journal-o utcome pairs from 19 journals) and an older slice for temporal comparison (3,368 pairs). The economics corpus comprised 5,593 pairs from 38 journals. A pooled corpus combining both fields (~10,072 p airs) was also constructed. Tier labels followed the same journal-level mapping used in evaluation. Ambiguous samples were excluded during curation to reduce avoidable label noise in the training target. Temporal separation was introduced to contro l con tamination risk : source articles underlying the benchmark pitches were published after mid-2025, whereas the base models used for fine-tuning were released before that period. Because publication outcomes are influenced by factors beyond idea quality (execution quality, writing quality, reviewer-assignment effects, editorial fit) and because the model input captures only idea- level information, a noise ceiling is expected by design[30] (Supplementary Methods SM8). This ceiling affects absolute accuracy interpretation while leaving relative comparisons internally valid, since the same information constraint is imposed across all evaluator classes. Evaluation criteria and prompt freezing strategy. All evaluators used the same two-axis criteria framework centered on originality and usefulness, consistent with editorial guidance literature in management research[9, 10]. A shared rubric was imposed on b oth humans and AI so that score differences would reflect evaluator behavior, not criterion mismatch. For economics, the same framework was adapted to a broader social-science framing while preserving the tier structure and zero-shot design (Supplementary M ethods SM9). Tier definitions and prompt varia nts are provided in Supplementary Methods SM6. Three pro mpt varian ts were pre-specified before final runs: an expert -anchored ru bric (using the language and standards of experienced journal editors), a simplified plain-language rubric, and a journal- anchored rubric (referen cing specif ic publication venues as quality anchors). The expert-anchored and journal-anchor ed variants yielded comparable frontier performance in pre-ana lysis checks, but journal- anchored prompts induced models to en umerate journal lists and hunt for ve nue-specific stylistic cues during reasoning; the expert-anchored variant was therefore frozen as the primary prompt to avoid this confound, making downstream com parisons conservative for frontier systems instead of optimized for fine-tuned models. Cross-model prompt sensiti vity analysis is reported in Extended Data Fig. 1. All evaluations used zero-shot prompting to keep conditions comparable across evaluator classes, including models and human raters, and to avoid noisy exemplar anchoring from publication outcome labels. Unresolved model outputs were coded as incorrect for fixed denominator reporting (overall non- compliance rate <1% across 10,560 individual runs). Human evaluation protocol. The human study was approved by institutional review board review (Project No. THU-04-2026 -0034). Two panels were used to separate experienced gatekeeper judgment from trainee judgment under the same task definition. The expert panel comprised 48 raters contributing 384 ratings (8 research pitches per rater; mean 3.2 ratings per pitch), recruited through personal professional networks to ensure high domain relevance and intrinsic motivation; two anonymous response identifiers were reconciled as two distinct raters. The junior panel comprised 174 doctoral and postdoctoral researchers contributing 2,530 ratings (mean 14.5 pitches per rater; mean 21.1 ratings per pitch), recruited via doctoral and postdoctora l networks; junior raters who spent fewer than one minute per pitch were excluded to remove perfunctory responses. Unfiltered expert data were prespecified as the primary expert analysis because filtering reduces pitch-level vote counts and increases tie sensitivity, limiting the pitches on which majority voting can be computed. Filtered sensitivity analyses are reported in Supplementary Table ST7. For each benchmark pitch, raters reported prior exposure (yes/no), tier assignment using field-familiar labels (Top, Top-, Good, Fair, mapped to exceptional, strong, fair, limited), confidence (5-point Likert scale), and to pic familiarity (5-point Likert scale). Th ese labels mirror c ommon jou rnal-evaluation shorthand, while all analyses convert them deterministically to the unified four-tier labels used in the AI protocols and manuscript. The full survey instrument and procedural details are provided in Supplementary Methods SM7. We collected confidence and familiarity because prior work shows that peer-review agreement and evaluator quality are weakly coupled to conventional expertise signals[11, 12]; these variables allowed direct testing of whether the same pattern held in our dataset. Demographic and background summ aries are in S upplementary Tab le ST5; individ ual expert accu racy values are in Supplementary Table ST9; matched-N Monte Carlo details are in Supplementary Table ST10; and a concise prior-exposure descriptive summary is reported in Supplementary Table ST11. AI model families and inference protocols. We evaluated three AI families under one frozen instruction scaffold. The frontier cohort included 11 reasoning models: Gemini 3.1 Pro, Claude Opus 4.6, GPT-5.2 High, Gemini 2.5 Pro, Qwen 3.5 Plus, DeepSeek V3.2, Seed 2.0, MiniMax M2.5, Kimi K2.5, Grok 4.1 Fast, and GLM-5. Gemini 3.1 Pro is retained with a contamination-risk caveat because some reasoning traces partially reproduced benchmark content. Each frontier model was sampled eight times per pitch to account for the inherent randomness in text generation. The primary frontier metric was pitch- mean eight-sample accur acy. For discrete diagnostics, we used per-pitch majority vote from the same eight runs and repo rted effective samp le size after tie exclusi on. Protocol coverage is summarized in Supplementary Table ST13. We additionally evaluated chat/log-probability tracks (GPT-5.2 chat, Kimi K2 chat, DeepSeek Chat) and architecture-matched base controls (the same underlying models before any fine-tuning). Each base model was evaluated on the full 120-pitch benchmark using the same frozen prompt and four-label log- probability classification as its SFT counterpart, providing architecture-matched controls that isolate the effect of fine-tuning from pre-existing model capability. Non-thinking models (base, chat, and supervised fine-tuned checkpoints) were evaluated by four-label toke n log -probability classification, w hich yield s deterministic class probabi lities and avoids fr ee-text parsin g failure modes. The same log- probability protocol was used for all four SFT checkpoints and their six pairwise probability- averaging ensembles (Supplementary Table ST4). This dual protocol reflects a difference in what each API surface exposes: reasoning APIs produce stochastic natural-language completions best stabilized by repeated sampling, while non-reasoning APIs expose token-level log-probabili ties that yield calibrated label distributions in a single deterministic call, enabling both confidence analysis and direct probabilistic comparison. Cost and protocol comparisons are summarized in Supplementar y Table ST2. Supervised fine-tuning. Supervised fine-tuning (SFT) is a procedure in which a pre-trained language model is further trained on a curated dataset of input –output examples to specialize it for a particular task[41]. We fine-tu ned base models spanning two model families and multiple scales using the same procedure in both fields. In management, four models were trained: GPT-4.1, GPT-4.1-nano (a smaller, more efficient variant), Qwen 3-4B-Instruct, and Qwen 3-30B-A3B-In struct (a mixture-of-experts architecture with 30 billion total parameters but only 3 billion active at any time). In economics, three of these four architectures were trained (GPT-4.1-nano, Qwen3-4B, Qwen3-30B); GP T-4.1 was omitted because its API fine-tuning cost was disproportionate to the three cost-effective architectures sufficient to demonstrate cro ss-architecture replicab ility. Pooled models were additionally trained on the combined corpus from both fields (~10,072 pairs). The cross-family, cross-scale, cross-field design tests whether the evaluative signal is recoverable from institutional traces generally or specific to a particular architecture, scale, or discipline[34]. Each training example consisted of the frozen evaluation prompt wrapping a research-question -with- context pitch as input, with a single tier-label token (one of four: exceptional, strong, fair, limited) as the completion target. Labels were designed as semantically descriptive single tokens to ensure distinguishability under first-token log-probability classification and to leverage the models’ pre-trained quality grading representations. The same prompt template was used for training and evaluation, eliminating prompt mismatch confounds . Given input text x and label y ∈ {1, 2, 3, 4}, training minimized label-token negative log-likelihood, a standard objective that increases the probability the model assigns to the correct tier label: NLL ( ) = 1 = 1 log ( ) ( ) , with loss computed on label tokens only and input tokens masked from gradient updates. Input masking is critical: it prevents the model from memorizing prompt tokens and forces the model to learn exclusively the mapp ing from research content to quality tier. Training corpus sizes are reported abov e (Training corpus and leakage control). Management training cost was below $300 USD across all four models, with the largest single cost arising from GPT-4.1 API fine-tuning (~$200); GPT-4.1-nano required ~$10 via API, while the open-source Qwen3-4B and Qwen3-30B-A3B checkp oints required approximately one and eight A100 GPU-hours respectively; economics training costs were comparable for the three architectures used (Supplementary Table ST2). Qwen checkpoints were trained locally using TRL; GPT checkpoints were trained via the OpenAI fine-tuning API. All models used near-default settings without hyperparameter search; full settings are reported in Supplementary Methods SM1. Consistent performance gains across both a proprietary black-box pipeline and a fully controlled open-source pipeline, across two fields with independent journal hierarchies, isolate the training signal and not any particular optimization decision as the causal factor. To test out-of-for mat generalization under severe informatio n compression, we also evaluated a compressed-inp ut transfer set built from the same held-out 120 articles but using only the single-sentence idea-statement field (core_rq_shor t) extracted in Supplementary Methods SM4. Unlike the primary full idea-summary representation (rq_with_contex t), this one-sentence version removes almost all theoretical motivation and contextual framing, leaving only the focal research question in one sentence. No checkpoint was trained on this format: all supervised fine-tuning used the fuller idea-summary input only, so this analysis tests transfer at evalua tion only, not in-format test performance. The four GPT-family base/SFT checkpoints were scored with the same four-label log-pro bability classifier used elsewhere. Predictions were recovered by argmax over the four label log-probabilities; any missing label was treated as negative infinity; and exact ties were resolved by a fixed label order (exceptional, strong, fair, limited). Because the benchmark remains exactly balanced across four tiers, descriptive chance performance is 25% accuracy, an d one-sided exact binomial tests versus 25% were used only as a compact above-chance diagnostic for this auxiliary transfer evaluation (Extended Data Fig. 7). This auxiliary analysis was interpreted as a test of generalization robustness rather than as a replacement for the primary in-format benchmark comparis on. A two-model ensemble was built by averaging softmax-normalized label probabilities from GPT-4.1- nano (SFT) and Qwen3-30B-A3B (SFT), then selecting the maximum probability class with deterministic resolution of any exact class probability ties. We evaluated all six pairwise SFT ensembles on the held-out benchmark and ranked them by accuracy, then macro F1, with a fixed model order convention used only if those metrics remained tied; under this rule GPT-4.1-nano + Qwen3-30B-A3B was retained as the primary pair (Supplementary Table ST4). Because all six pairwise ensembles exceeded the frontier average by 28.1 to 29.8 percentage points, the core finding is robust to ensemble composition and not dependent on a single fortuitous combination. Architecture-mat ched base controls serve as the primary comparison for isolating the SFT effect in both fields: because each fine-tuned model is evaluated against its own pre-training checkpoint on the identical benchmark, observed gains are attributable to the fine-tuning procedure and not to differences in base-model capability or architecture. GPT-4.1 was additional ly retained for the cross-field transfer evaluation (manageme nt-trained mo del tested on the econom ics benchm ark; S upplementary Fig. 7) because it demonstrated the strongest generalization capacity under input compression (Extended Data Fig. 7). Full economics journal-to-tier mapping details are in Supplementary Methods SM9 (Supplementary Table ST14). Reinforcement -learning ablation. To test whether explicit reasoning optimization improves this task beyond supervised alignment, we trained reasoning-enabled Qwen3-4B and Qwen3-32B checkpoints with a modified GRPO-style objective[28, 31, 40] (Supplementary Methods SM2–SM3 ). The implementation removed the KL penalty, used token-level normalization, and adopted asymmetric clipping to favor positive-advanta ge updates. We also introduced adaptive privileged sampling for low-accuracy items[42, 43] to maintain reward contrast during training. RL checkpoints were evaluated using the same 8-run sampling protocol as frontier models, with run- pooled and pitch-mean eight-sample accur acy reported alongside non-tied majority vote. RL training inherently requires reasoning-enabled model configurations that generate explicit chain-of-thought before a final label; this is not a confound but the mechanism under test. The comparison asks whether explicit deliberation aids or imped es ev aluative accuracy, a question motivated by converging evidence from cognitive science that verbal articulation can degrade holistic judgment[35], and from machine learning that chain-of-thoug ht prompting yiel ds negligible or negative gains on tasks outside mathematics and symbolic reasoning[36, 37]. Reinforcement learning from human preferences has additionally been shown to instill agreement-seek ing behavior[2 8, 29] and reduce output diversity through mode collaps e, and GRPO-style methods represent the current state of the art for reasoning optimization[31]. This RL track was therefore treated as a mechanism test, not a deployment candidate: if explicit chain-of-thought policy optimization cannot match direct supervised alignment on this task, the implication is that the evaluative signal resides in the institutional traces themselves and not in reasoning architecture. Pairwise discrimination experiment. We designed a label-free pairwise task to distinguish gains in intrinsic discrimination from gains in rubric alignment. Each trial presented two research pitches sampled from different tiers, and the model selected the strong er one without seeing tier labels or rubric text, testing whether a model can tell which of two ideas is better even without the four-category framework. We used a fixed 300-pair stratified set sampled from the 120 benchmark pitches with fixed random seed 32 (150 pairs at tier distance 1, 100 at distance 2, and 50 at distance 3, where distance 1 means adjacent tiers and distance 3 means the most separated tiers). The narrated pairwise comparison set was the shared four-model subset used across the main text, Fig. 5, Extended Data Fig. 2, and Supplementary Table ST1: SFT GPT-4.1, Gemini 3.1 Pro, GPT-5.2 High, and the GPT-4.1 baseline. Because this task removes absolute category assignment, improvements here are interpretable as improvements in relative quality discrimination rather than prompt-following alone. Fig. 5 carries the headline pairwise comparison for this same subset: overall weighted accuracy with exact McNemar tests and the hard-boundary summary. Extended Data Fig. 2 retains the six-pair-type heatmap and discordance decompositio n for the same subset. Voting-consis tency anal ysis. Con sensus analyses were prespecified to quantify how reliability changes with stricter agreement thresholds across evaluator classes. For SFT, we analyzed 4/4, 3/4, and 2/4 cross-model agreement policies. For hu mans, we analyzed junior vote share thre sholds and expert unanimity subsets. For frontier models, we analyzed both within-model repeated-sampling aggregation and fixed cross-model voting on a diverse subset of four top models (Gemini 3.1 Pro, Claude Opus 4.6, GPT-5.2 High, GLM-5 ). Inter-rater consistenc y used Fleiss’ κ for human panels and pairwise Cohen’s κ for mo del-model agreement. Majority-vote results exclud ed tied pitches and always reported effective non-tied N. Ties were not broken randomly because random resolution introduces avoidable variance and obscures whether an evaluator family is genuinely indecisive on difficult cases. Full agreement diagnostics are reported in Supplementary Table ST12. Statistical analysis. All analyses were run in Python (NumPy, SciPy, pandas). The primary endpoint was four-class exact -match accuracy. Secondary endpoints included macro-F1, per-tier precisi on/recall/F1, confusion matrices, and calibration diagnos tics. Ordinal inter-rater agreement was assessed with Krippendorff’s alpha. Paired evaluator comparisons used McNemar tests on paired corr ectness vectors . For the pairwise task summarized in Fig. 5 and diagnosed further in Extended Data Fig. 2, significance was computed with the two-sided exact McNemar/bino mial test on item-level discordant pairs and reported as raw unadjusted P values for the plotted SFT comparisons versus Gemini 3.1 Pro, GPT-5.2 High, and GPT-4.1 baseline. Frontier-cohort heterogeneity was tested with Cochran’s Q. Ordinal or non-Gaussian analyses used Spearman correlation, Mann–Whitney U, and Kruskal–Wallis tests. Individual-level comparisons tested whether the SFT ensemble accuracy differed from the distribution of individual human evaluator accuracies using a one- sample t-test with the ensemble score as the referen ce value. Confidence intervals were estimated by bootstrap resampling (10,000 draws). Multiple-testing corrections were used only where explicitly stated for broader evaluator families and prompt/model sweeps; the focused pairwise analyses in Supplementary Table ST8 and Fig. 5 / Extended Data Fig. 2 report raw unadjusted P values. The reported significance tables highlight four comparator rows: frontier average (11 models), best frontier model under the conservative protocol (Gemini 3.1 Pro), expert majority vote, and junior majority vote. The paired primary comparisons empha sized in the manuscript and supporting tables are SFT ensemble versus expert majority vote and versus the best frontier model under the conservative protocol; frontier-average and junior-majo rity row s are reported as additional headline secondary com parisons. Additional paired evaluator test s were reported as second ary analyses, w ith raw unadju sted P values shown in the supporting tables and a ny multiplicity-adjusted interpretation stated explicitly in text. Headroom is defined as (accuracy - chance) / (100% - chance), where chance = 25%, giving the fraction of improvable performance captured by a given evaluator. Human judgment analyses incorporated the noise framework of Kahneman et al.[30] to interpret the dissociation between low categorical agreement and moderate ordinal agreement. Majority-vote comparisons involv e reduced effective N because tied pitches are excluded, which limits statistical power relative to individual-level tests; this is particularly relevant for the compar ison betwe en SF T and expert majority vo te, where tie exclusion reduces the evaluable set. Calibration for probabilistic evaluators used expected calibration error (ECE) and Brier decomposition; selective prediction was evaluated by plotting accuracy as a function of coverage under confidence threshold sweeps. Monte Carlo matched-N analyses (5,000 random draws) were used to compare junior and expert major ity voting at equivalent panel sizes, drawing expert-sized panels from the ju nior researcher pool and computing majority-vote accuracy on each draw. Label normalization across source- article metadata, human surveys, and model outpu ts used deterministic mapping rules (Supple mentary Table ST6). Data and code availability. All preprocessing rules, prompts, model inventories, hyperparameters, and sensitivity analyses are documented in Supplementary Methods and Tables. The benchmark split was fixed before final model co mparisons, and lab el norma lization rules were deterministic across source- article metadata, human surveys, and model outputs. Analysis code, processed benchmark files, prompts, and table-generation scripts will be released alongside the manuscript. Human data will be de-identified before release in accordance with approved ethics procedures. References cited in Methods 8. P olanyi, M. The Ta cit Dimension (Doubleday, 1966). 9. C orley, K.G. & Gioia, D.A. Buildin g theory a bout theory building. Acad. Manag. Rev. 36, 12–32 (2 011). 10. Colq uitt, J .A. & Ge orge, G. Publishing in A MJ—Part 1: Topic choice. Acad. Manag. J. 54, 432 –435 (2011). 11. Bo rnmann, L., Mutz, R. & Daniel, H.- D. A rel iabili ty-gene ralizat ion study of journal pee r reviews. PLoS ON E 5 , e14331 (2010). 12. Pier , E.L. et al. Low ag reement among rev iewers eval uating the sa me NIH gra nt applicatio ns. PNAS 11 5, 2952– 2957 (2018). 13. Lam ont, M. How Professors T hink: Inside the Curi ous World of Acad emic Judgm ent (Harvard Univ. Pres s, 2009). 14. Sile r, K., Lee, K. & Be ro, L. Mea suring the effectiveness of scientific gatekeep ing. PNAS 112, 3 60–365 (2015). 15. Coll ins, H. Tac it and Exp licit Knowledge (Unive rsity of Chic ago Press, 2010). 16. Chri stiano, P.F. et al . Deep reinf orcement learning from human preference s. NeurIPS (2017). 17. Shar ma, M. et al. Towards understan ding sycophancy in language models. Proc. ICLR (2024). 18. Kahn eman, D., Sibony, O. & Sunstein, C.R. Noise: A Flaw i n Human Judgment (Little, Brown Spark, 2021). 19. Guo, D. e t al . DeepSe ek-R1 incenti vizes reasoning in LLMs thr ough reinfor cement le arning. Nature 64 5, 633– 638 (2 025). 20. Wu, Y . et al. On th e generaliz ation of SFT: A reinforce ment le arning perspective w ith rew ard recti fication. ICLR (2026). 21. Wil son, T.D. & Sc hooler, J.W. Thin king too muc h: Introsp ection ca n red uce the quality of prefe rences and decisions. J. P ers. Soc. Psychol. 60, 181–192 ( 1991). 22. Liu, R. et al. Mind your step (by ste p): Chain-of- thought can reduce per formance on tas ks where t hinking makes humans worse. Proc. ICML (2025). 23. Spra gue, Z. et al. To CoT or no t to CoT? Chain-o f-thought h elps mainly on mat h and sym bolic rea soning. ICLR (2025). 24. Shao , Z. et al. De epSeekMat h: Pushing t he limits of mathema tical reasoning in open language mode ls. arXiv 2402.03300 (2024). 25. Wei , J. et al. Finetuned language models are zero-shot learners. ICLR (2022). 26. Yu, Q. et a l. DAP O: An o pen-source LLM reinforc ement learning system at scale. NeurIPS (2025). 27. Qu, Y. et al. POPE: Learning to reason on hard p roblems via privileged on-pol icy exploration. arXiv 2601.18779 (2026). Extended Data Extended Data Figures Extended Data Figure 1 | C ross-model prom pt-sensitivi ty lan dscape a , Accuracy across Simple, Journal-anchored, and Expert prompts for the six frontier models evaluated under all three prompt formulations in the conservative 11-model cohort: Gemini 3.1 Pro, GLM-5, GPT-5.2 High, Qwen 3.5 Plus, Gemini 2.5 Pro, and Claude Opus 4.6. Accuracy error bars show 95% binomial confide nce intervals. b , Macro-F1 across the same prompt conditions, shown as a paired robustness metric to distinguish raw accuracy from balanced tier discrimination. c , Pooled row-normalized confusion matrix under the Expert prompt baseline. d , Pooled row-normalized confusion matrix under the Simple prompt. e , Pooled row-normalized confusion matrix under the Journal-anchored prompt. Together these panels show that prompt wording changes the shape of frontier-model collapse but does not recover robust four-tier discrimination. Because the Simple and Journal conditions use single-pass prompt evaluations w hereas the Expert conditi on uses the conservative majorit y-based frontier protocol, cross-prompt differences should be interpreted directionally rather than as perfectly protocol-matched estimates. Extended Data Figure 2 | P airwise intrinsic discrim ination details Models choose the stronger research pitch in pairwise head-to-head comparisons without tier labels or rubric text, isolating relative quality discrimination from absolute category assignment. The plotted ED2 comparator set is the same shared four-model subset used in Fig. 5 and Supplementary Table ST1: SFT GPT-4.1, Gemini 3.1 Pro, GPT-5.2 High, and the GPT-4.1 baseline. Fig. 5 now carries the headline overall-accuracy and hard-boundary pairwise panels. a , A six-pair-type heatmap (strong_exceptional, fair_strong, fair_exceptional, limited_fair, limited_exceptional , limit ed_strong) shows where performance gaps actually sit once the broad distance bins are unpacked. b , Net discordant-pair decomposition (SFT-only correct minus comparator-only correct) shows that the paired significance is concentrated in the hardest pair types rather than in the near-ceiling easy pairs. Raw unadjusted exact McNemar P values for SFT GPT-4.1 versus Gemini 3.1 Pro, GPT-5.2 High, and the GPT-4.1 baseline are reported in data/statistics/S14_ED2PairwiseRawPValues.json. Extended Data Figure 3 | F ull confusion diagnostics and SFT ensemble detail a , The c omplete confusion-matrix atlas for all 11 frontier flagships extends the selected examples shown in Fig. 2 and makes the full range of collapse modes visible in one view. b , Architecture-matched base-versus-SFT confusion matrices show how supervised fine-tuning changes tier discrimination within each model family, shifting mass toward the diagonal rather than toward one or t wo dominant tiers. c , Accuracy ranking across the four single SFT models and six two-model ensembles shows that the ensemble advantage is robust across pair choices rather than tied to a single combination; dashed reference lines mark the best flagship frontier model and expert-majority performance for context. Extended Data Figure 4 | C alibration, error structu re, and pan el-size reliabili ty a , Directional error profiles compare under-estimation and over-estimation across the SFT ensemble, best frontier model, frontier average, expert majority vote, and junior majority vote, revealing that frontier systems are especially prone to over-estimating article quality. b , The calibration landscape compares expected calibration error (ECE) with Brier score across evaluators, with better-calibrated systems appearing closer to the lower-left corner. c , Error severity is decomposed into exact matches, off-by-1 errors, a nd off-by-2+ errors, with compact under- versus over-estimation summaries printed for each evaluator. d , Junior panel- size scaling is shown together with junior tie-rate trajectories and expert anchor lines for both accuracy and tie rate, illustrating that aggregation reduces indecision but plateaus in performance rather than eliminating the structural ceiling. Extended Data Figure 5 | R L ch eckpoint diagnos tics a , RL checkpoint performance is compared with the SFT 2-model ensemble, the best frontier model, GPT-5.2 High, and the frontier average, locating RL between clean frontier baselines and supervised fine-tuning. b , RL performance is disaggregated into run-pooled eight-sample accuracy, pitch-mean eight-sample accuracy, and non-tied majority-vote accuracy, showing that the ranking is stable across reporting conventions. c , The RL majority-vote confusion matrix localizes residual errors by tier and shows that middle-tier separation remains the main weakness. d , Predicted-tier distributions compare RL with the best frontier model and the SFT 2-model ensemble, clarifying that RL reduces but does not eliminate collapse relative to the strongest frontier baseline. Extended Data Figure 6 | T emporal persistence of instituti onal traces a , Accuracy for the matched recent-training slice (2020-2025) and older-training slice (2015-2020) on the two shared architectures (GPT-4.1-nano, Qwen3-30B) plus their matched 2-model ensemble. The benchmark itself is built from post-June- 30-2025 articles, so the older slice introduces an intentional five-year training-time lag. Accuracy bars show binomial 95% confidence intervals, and dashed reference lines mark the frontier-average and expert-majority comparators from the benchmark summary tables. b , Macro-F1 for the same matched singles and matched 2-model ensemble, with bootstrap 95% confidence intervals and the same benchmark anchors, showing that temporal decay persists on a balanced discrimination metric rather than only on raw accuracy. c , Row-normalized confusion matrices compare the recent and older-trace matched ensembles, showing that the older trace retains exceptional-tier diagonal structure but loses substantially more fair-tier recovery and shifts mass upward. d , Predicted-tier distributions plus three targeted diagnostics quantify the older-trace drift: more exceptional predic tions, lower exceptional-tier precision, lower fair-tier recall, and more strong -> exceptional confusions. Extended Data Figure 7 | T ransfer from richer supervision to one-sente nce core-question inputs All fine-tuned checkpoints in this figure were trained only on the fuller research-idea summary and were never trained on the one- sentence idea-statement format. a , Overall performance on the one-sentence idea statement benchmark for architecture-mat ched GPT-family base and fine-tuned models, shown as accuracy and macro-F1 on the same 120 held-out articles. Bars show one- sentence-input results with binomial 95% accuracy confidence intervals and bootstrap 95% macro-F1 confidence intervals; hollow markers show the same model’s performance on the fuller idea-summary benchmark, and the dashed line marks the 25% chance baseline. b , Per-tier recall change (one-sentence input minus full idea summary) localizes where compression hurts. GPT- 4.1 fine-tuning retains substantial signal but loses recall in the exceptional, strong, and fair tiers while gaining limited-tier recall, whereas GPT-4.1 nano fine-tuning collapses on the strong tier entirely under compressed input. c , Predicted-tier distributions under fuller versus compressed inputs show that degradation is not a single generic middle-tier collapse: both base models concentrate heavily in the middle, GPT-4.1 fine-tuning becomes markedly more conservative and limited-heavy, and GPT-4.1 nano fine-tuning stops emitting strong-tier predictions on the compressed input. Extended Data Figure 8 | P ooled multi-field training predi cts management and economics Pooled multi-field checkpoints trained jointly on management and economics institutional tra ces are tested separately on the two held-out field benchmarks. The test surface contains 120 management items and 200 economics items, with tier balance preserved in each field subset. a , Accuracy across the two test fields for the pooled Qwen3-30B and pooled GPT-4.1-nano checkpoints. The pooled Qwen3-30B achieves 61.7% on management – comparable to the 60.8% single-field SFT ensemble reported in the main text – and 69.5% on economics, matching the best i n-domain economics SFT. The poole d GPT-4.1-nano reaches 52.5% on management and 67.0% on economics. Bars show point estimates with bootstrap 95% confidence intervals; the dashed line marks the 25% chance baseline. b , Macro-F1 across the same field-wise evaluations (Qwen3-30B: 0.615 management, 0.705 economics; GPT-4.1-nano: 0.489 management, 0.674 economics), with bootstrap 95% confidence intervals, confirming that the larger pooled model maintains substantially stronger balanced discriminati on than the sma ller model across both fields. c , Predict ed-tier composition for the pooled Qwen3-30B checkpoint across management and economics, shown as 100% stacked bars over the four tiers. d , Predicted-tier composition for the pooled GPT-4.1-nano checkpoint. Together, these panels demonstrate that evaluative signals from management and economics do not interfere when combined in training: the pooled Qwen3-30B matches or exceeds single-field benchmarks in both domains, while the capacity gap between the larger and smaller architecture shapes how balance d cross-field disc rimination rem ains. GPT-4.1 was se lected for the c ross-field tran sfer a nalysis (Supp lementary Fi g. 7) because it demonstrated the strongest generalization capacity under input compression (Extended Data Fig. 7), retaining evaluative signal when full idea summaries were reduced to one-sentence inputs; this capacit y made it the natural candidate for testing whether management-trained evaluative representations transfer to a different discipli nary domain. Extended Data Tables Extended Data Table 1 | B ase model c ontrols Model Model Key N Accurac y (%) Macr o F1 95% CI Lowe r (%) 95% CI Uppe r (%) Above Chanc e (pp) Headroo m Skill (%) Acc exceptiona l (%) Acc stron g (%) Acc fair (%) Acc limite d (%) Pred exceptiona l (n) Pred stron g (n) Pre d fair (n) Pred limite d (n) Base (GPT- 4.1) gpt-4.1 120 32.5 0.268 24.2 40.8 7.5 10.0 20.0 60.0 50.0 0.0 14 49 57 0 Base (Qwen3 -4B) qwen3 -4b 120 26.7 0.195 19.2 34.2 1.7 2.2 56.7 46.7 3.3 0.0 47 71 2 0 Base (GPT- 4.1- nano) gpt- 4.1- nano 120 25.0 0.186 17.5 33.3 0.0 0.0 30.0 63.3 6.7 0.0 30 85 5 0 Base (Qwen3 -30B) qwen3 -30b- a3b 120 22.5 0.112 15.0 30.0 -2.5 -3.3 86.7 3.3 0.0 0.0 97 23 0 0 Supplemen tary Infor mation Machines acquire scientific taste from institutional traces Table of Contents Supplementar y Methods SM1: Supervised Fine-Tuni ng Hyperparame ters and Training C orpus SM2: Reinforceme nt Learning Objective and Reward SM3: RL Infrastructur e an d R esource Consump tion SM4: Research-Ide a Extraction SM5: Journal-to-Ti er Mapping SM6: Evaluation Prompt s and Ze ro-Shot Design Rational e SM7: Human Study Design SM8: Label-Noise Ceil ing Analysis SM9: Cross-Field Valida tion in Ec onomics Supplementar y Tables ST1: Pairwise Discrimi nation by Tier Dis tance ST2: Cost and Inference Regime Comparison ST3: Core Per-Class Metrics ST4: All Pairwise SFT E nsemble Combi nations ST5: Human Panel Composition and Descrip tives ST6: Label Normaliz ation ST7: Filtering Sensitivi ty ST8: Pairwise McNema r Test C ompendium ST9: Individual Expe rt Accuracy Distribution ST10: Monte Carlo Matched-N Ana lysis ST11: Prior-Exp osure Descriptive Summa ry ST12: Agreeme nt and Con sensus Diagnostics ST13: Model Inventory and Access Window ST14: Economi cs Journal-to-Tier Mapping ST15: Economi cs Cross-Field Validatio n Res ults Supplementar y Figures SF1: Predictio n Di stribution Comparison SF2: Expert Individua l Ac curacy Distributio n SF3: Junior Monte Carlo Subsampling Curve SF4: Frontier Collapse- Metric Landscape SF5: AI-Human Error Complem entarity SF6: Human Confusion Matric es SF7: Cross-Fie ld Tra nsfer from Management to Economic s Supplementary Me thods Supplementar y Methods 1 (SM1): Supervised Fine-Tuning Hyperparameters and Training Corpus Table SM1. SFT training configurat ion. Parameter Qwen3-4B- Instruct Qwen3-30B-A3B-Instruct GPT-4.1-nano GPT-4.1 Architecture Dense transformer Mixture-of-experts (30B total, 3B active) Proprietary transformer (undisclosed) Proprietary transformer (undisclosed) Training TRL (Hugging TRL (Hugging Face ) OpenAI fine-tuning API OpenAI fine-tuning API Parameter Qwen3-4B- Instruct Qwen3-30B-A3B-Instruct GPT-4.1-nano GPT-4.1 framework Face) Training location Local GPU cluster Local GPU cluster OpenAI cloud OpenAI cloud Learning rate 1e-4 2e-5 API-managed-default API-managed-default Scheduler cosine cosine manual two-stage schedule manual two-stage schedule Batch size 32 32 32 32 Epochs 2 2 3 3 + 1 Optimizer AdamW AdamW API-managed API-managed Hardware 1 x A100 8 x A100 Provider-managed Provider-managed Training duration ~1 hour ~2 hours ~1 hour ~2 hours The four main SFT models used the same curated recent/new institutional-trac e slice and frozen instruction scaffold. Minimal hyperpa rameter optimization was used. The OpenAI track used batch size 32 with a pragmatic two-stage manual schedule: 3 epochs at the default learning rate, followed by 1 epoch at 0.5x the learning-rate multiplier. The Qwen track used batch size 32, conventional task-tuned learning rates, and a cosine scheduler under otherwise near-default TRL settings. The temporal reanalysis reused the same scaffold with an older slice. Training corpus. The pri mary rec ent/new slice comprised 4,479 processed research-pitch/jo urnal- outcome pairs, der ived from orga nizational behavior and management source article s drawn from the predefined 19-journal source universe described in SM5. A matched older slice used for the temp oral comparison comprised 3,368 pairs from the same source universe. Articles were assigned tier labels via the deterministic journal-to-tier mapping described in SM5. The distribution was approximately balanced across tiers; articles with ambiguous venue assignment or unclear publication status were excluded during curation to reduce avoidable label noise. Each training example consisted of the frozen evaluation prompt (SM6, Prompt 1) wrapping a research-question- with-context pitch extracted via the SM4 pipeline, with a single tier-label token (one of four: exceptional, strong, fair, limited) as the completion target. Loss was computed on label tokens only; input tokens were masked from gradient updates, forcing the model to learn exclusively the mapping from research content to quality tier rather than memorizing prompt structure. The 120 benchmark idea pitches, derived from held-out source articles, were fully disjoint from both training slices. Supplementar y Methods 2 (SM2): Reinforcement Learning Objective and Reward RL checkpoints were trained for Qwen3-4B and Qwen3-32B using a modified GRPO-style objective with asymmetric clipping and token-level norm alization. The design tests whether explicit chain-of-thought policy optimization can recover the same evaluative signal captured by direct supervised alignmen t (SM1). Training objective GRPO ( ) = 1 = 1 | | = 1 = 1 | | min , ( ) , clip , ( ), 1 , 1 + + higher where is group size, is sampled output , and , ( ) = ( , , ,< ) ref ( , , ,< ) is the token-level importance ratio. Reward design We used an ordinal reward gated by consistency: ( , ) = label = reasoning ( label , ) with ( , ) = 1 , | | = 0 0.3 , | | = 1 0 , | | 2 The gate suppresses reward for reasoning-labe l mismatch; partial credit preserves ordinal structure. Advantage normalization = + with per-group mean and standard deviation . Privileged GRPO sampling strategy To address advan tage vanishing (where all sampled outputs for a given pr ompt receive the same reward, yielding zero advantage and no policy gradient signal), we developed a sample-w ise adaptive sampling strategy. Prior to each rollout, the current model performs diagnostic rollouts on each prompt to estimate per-sample accuracy. Training mode is then assigned per-sample: samples with accuracy below threshold are routed to Privileged GRPO mode, where a hindsigh t hint grounded against the ground-truth label is prepended to the pro mpt. This mechanism corrects distributional bias in the base model’s rollouts, ensuring that the training group contains sufficient reward contrast across the full label space for stable policy gradient updates. The run-level values of and were fixed separately for each RL experiment; because this RL analysis is presented as a mechanism test, not a hyperparameter sweep, the scien tific compa rison centers on the adaptive-sampling design itself, not on any single threshold setting. Supplementar y Methods 3 (SM3): RL Infrastructure and Resource Consum ption RL training was conducted on a cluster of 8 x A100 GPUs. Qwen3-4B-Th inking was trained for under a week and Qwen3-32B for abo ut a week, with sustained GPU utilization exceeding 95% throughout. Training was built o n and exten ded the fully as ynchronous AgentRL fram ework open-so urced by Tsinghua University, with customizations to support our reward design and data pipeline; the full training infrastructure will be released alongside the model weights and code. Table SM3. RL training hyperparamete rs. Parameter Qwen3-4B-Thinking Qwen3-32B Learning rate 5x10^-5 1x10^-5 Batch siz e 32 32 Adam betas 0.9, 0.99 0.9, 0.99 Weight decay 0.05 0.05 Optimizer AdamW AdamW Clipping 0.2 0.2 Asymmetric bonus higher 0.1 0.1 Max gradient norm 1.0 1.0 Attention implementation FlashAttention-2 FlashAttention-2 Parallelism DDP FSDP Precision bf16 mixed prec ision bf16 mixed prec ision Inference backend SGLang SGLang Hardware 8 x A100 8 x A100 Training duration <1 week ~1 week Supplementar y Methods 4 (SM4): Research-Idea Extraction To standardize inputs across all training and evaluation conditions, we used Qwen3-235B-A22B-I nstruct (Alibaba) to extrac t structur ed rese arch idea descriptions from each article. The extraction prom pt instructed the model to produce a structured description including: (1) the core resea rch question, (2) theoretical motivation, (3) methodolog ical approach, and (4) expected contribution, while om itting methods details, empirical results, publication venue, and author identities. Model selection. The extraction pipeline was validated by comparing outputs across multiple large language models, including Clau de Sonnet 3.5 (Anthropic), Qwen3-235B-A22B-Ins truct, Qwen3-32B- Instruct (Alibaba), and others. No substantive differences were observed across models. Qwen3-235B- A22B-Instruct was selected as the production extraction model on the basis of human quality judgments of output coherence and completeness. Extraction prompt. The extraction prompt instructed the model to act as an objective research paper analyser, extracting research questions and core elements without interpretation or embellishment. The prompt specified five output versions in JSON format: 1. CORE_RQ _SHORT (40– 60 w ords): Distilled essential resear ch q uestion(s). 2. RQ_WITH _CONTEX T (1 20–150 words): Research qu estion with enough context for ex pert evaluation, including the phenomenon, gap, question, ap proach, and claimed contributio n. 3. GAP_FOC USED (100–130 words): What is known, what remains unknown, and how the study addresse s it. 4. THEORY _AND_MOD EL (100–130 words): Theoret ical framework, key variables and relationships, and theoretica l con tribution. 5. CONTRIB UTION_F OCUSED (80–10 0 words): T heoretical, empiri cal/method ological, and practical contributio ns as cla imed by the autho rs. The main benchmark uses the RQ_WITH_CONTEX T format. Critical extraction rules required focusing on the abstract, introduction, and theoretical development sections; using the authors’ exact terminology for key const ructs; pr eserving the level of theoretical sophistication in the original; and avoiding an y addition of theoretical connections, persuas ive hooks, or inferred contributions not explicitly stated. Verbatim extractio n prompt (exact text) # ROLE You are an objective research paper analyzer. Your task is to extract and present research questions and core elements from academic papers WITHOUT interpretation, embellishment, or improvement. # CRITICAL PRINCIPLE: OBJECTIVITY OVER PERSUASIVENESS - Present the paper EXACTLY as written by the authors - Do NOT add theoretical sophistication if it's not there - Do NOT create compelling hooks if the original lacks them - Do NOT infer contributions beyond what authors explicitly state - Do NOT improve weak framing - describe it as presented - If the idea seems underdeveloped in the original, your summary should reflect that Your goal: Represent the research proposal exactly as the authors present it-the way a doctoral student would pitch their idea to an advisor. Convey their thinking faithfully, including any lack of polish or theoretical sophistication, so the professor can understand and evaluate the original idea. # OUTPUT STRUCTURE Generate exactly 5 versions in JSON format: ## VERSION 1: CORE_RQ_SHORT **Purpose:** Distill the essential research question(s) **Word count:** 40-60 words (2-3 sentences maximum) **Structure:** - Sentence 1: The phenomenon or behavior under study - Sentence 2: The specific question or what's being tested - [Optional Sentence 3: The key boundary condition or mechanism if central to RQ] ## VERSION 2: RQ_WITH_CONTEXT **Purpose:** Add just enough context for a professor to evaluate the idea's merit **Word count:** 120-150 words (1 paragraph) **Structure:** - What phenomenon/problem (1-2 sentences) - What's missing/unclear in existing research - the gap (2-3 sentences) - The research question (1-2 sentences) - The approach/framework used (1 sentence) - Key claimed contribution (1 sentence) ## VERSION 3: GAP_FOCUSED **Purpose:** Emphasize what's unknown and how this study addresses it **Word count:** 100-130 words (1 paragraph) **Structure:** - What existing research has established (2 sentences) - What remains unknown/unresolved (2-3 sentences) - How this study addresses the gap/extends the prior research/challenges the understanding (2 sentences) - Expected insight (1 sentence) ## VERSION 4: THEORY_AND_MODEL **Purpose:** Describe the theoretical framework and research model **Word count:** 100-130 words (1 paragraph) **Structure:** - Core theoretical lens/framework (1-2 sentences) - How theory is applied to the phenomenon (2 sentences) - Key variables and relationships (2-3 sentences) - Theoretical contribution claimed (1 sentence) ## VERSION 5: CONTRIBUTION_FOCUSED **Purpose:** Extract what the authors claim as their contributions **Word count:** 80-100 words **Structure:** - Primary theoretical contribution (1-2 sentences) - Empirical/methodological contribution if claimed (1 sentence) - Practical contribution if claimed (1 sentence) - How it advances the literature (1-2 sentences) # EXTRACTION RULES ## Where to Look: Focus on the **front-end** of the paper: - **Abstract** - **Introduction** (entire section - contains RQ, gap, motivation) - **Theoretical Development** (theory and hypotheses framing) Most information needed is in these sections. Do NOT need to read results/discussion unless contribution statements are unclear. ## What to Extract: 1. **Research Questions:** Usually in abstract's and introduction 2. **Gaps/problematization:** mostly in introduction and sometimes in theoretical development 3. **Theory:** introduced in introduction and often elaborated in theory development sections 4. **Contributions:** Abstract, introduction's end ## What to Avoid: ❌ Adding your own theoretical connections ❌ Improving vague or weak language ❌ Creating persuasive hooks not in the original ❌ Inferring contributions not explicitly stated ❌ Making gaps sound more compelling than presented ## Language Rules: ✅ Use the authors' exact terminology for key constructs ✅ Preserve the level of theoretical sophistication in the original ✅ Match the certainty level (e.g., "explores" vs. "demonstrates") ✅ If authors use simple language, you use simple language # JSON OUTPUT FORMAT Output the following JSON structure with all 5 versions: ```json { "core_rq_short": "string", "rq_with_context": "string", "gap_focused": "string", "theory_and_model": "string", "contribution_focused": "string" } ``` Worked extrac tion examples (RQ_WITH _CONTEX T) Example 1 Input article title: Game Over or G ame Changer? The Impact of Applicants’ Gaming Skills on Their Hirability Extraction output (RQ_WIT H_CONT EXT): The increasing digitalization of work has raised interest in nontraditional skills such as those developed through video gaming, which may include strategic thinking, teamwork, and digital fluency. However, hiring managers may hold negative stereotypes about gamers, viewing them as lazy or socially isolated, potentially disadvantaging applicants who list gaming on their resumes. While research shows gaming can enhance job-relevant cognitive abilities, there is no empirical evidence on how such skills are perceived during resum e screening. Using a 2 (ECA: gaming vs. volleyball) × 2 (proficiency: neutral vs. hig h) experimental design, this study investigates whether listing gaming as an ECA affects applicant evaluations compared to traditional team sports. The authors apply signaling theory to understand how ECAs serve as cues about unobservable applicant traits. The primary contribution is initial evidence on the perception of gaming skills in personnel selection, highlighting a disconnect between potential skill benefits and actual hiring biases. Example 2 Input article title: Good intentions, bad outcomes: how and when family motivation leads to work-family conflic t Extraction output (RQ_WIT H_CONT EXT): Family motivation is widely seen as a positive driver of work performance, yet its effects on employees’ family lives remain underexplored. While prior research highlights benefits in the work domain, little is known about potential downsides for family well-being. This study addresses this gap by investigating whether high family motiva tion, des pite good intentions, can lead to w ork-family conflict (WF C) and negative spousal interactions due to exce ssive work effort depleting personal re sources. Drawin g on resource drain theory, the authors propose that FSSBs from supervisors serve as external resources that may mitigate this drain. Using a three-wave dyadic survey design with employee-partner data, the study tests a mediated moderation model. The ke y contribution lies in rev ealing th e ‘dark side’ of family motivation and identifying organization al support as a boundary condition. Compression examples (one-sentence idea statement versus full idea summary) Extended Data Fig. 7 evaluates only the one-sentence idea-statement field (core_rq_short) at test time, even though all SFT checkpoints were trained on the full idea summary (rq_with_context). The examples below show how much contextual scaffolding is removed by this compressed-input transfer setting. Article core_rq_short rq_with_context Game Over or Game Changer? The Impact of Applicants’ Gaming Sk ills on Their Hirability This study examines how applicants’ gaming skills , presented as an extracurricular activity (ECA) on a resume, affect their perceived hirability and resume quality. It specifically compares gaming to team sports and t ests whether proficiency level (neutral vs. high) influenc es these perceptions. The increasing digitalization of work has raised interest in nontraditional skills such as those deve loped through video gaming, which may include strategic thinking, teamwork, and digital fluency. However, hiring mana gers may hold negative stere otypes about gamers, viewing them as lazy or socially isolated, potentially disadvantaging applicants who list gaming on their resumes. While research shows gami ng can enhance job-relevant cogniti ve abilities, there is no empirical evidence on how such skills are perceived during resume screening. Using a 2 (E CA: gaming vs. volleyball) × 2 (proficiency: neutral vs. high) e xperimental design, this study investigates whether listing gaming as an ECA affects applicant evaluations compared to traditional team sports. The authors apply signaling the ory to understand how ECAs serve as cues about unobservable applicant traits. The primary contribution is initial evidence on the perception of gaming skills in personne l sel ection, highlighting a disconnect between potential skill benefits and actual hiring biases. Good int entions, bad outcomes: how and when family motivation leads to work-family conflict This study examines how family motivation l eads to work-family conflict through increased work effort, resulting in negative spousal interactions. It also investigates whe ther family supportive supervisor behaviors (FSSBs) buffe r this negative resource drain process. Family motivation is widely seen as a positive driver of work performance, yet its effects on employees’ fam ily lives remain underexplored. While prior research highlights benefits in the work domai n, little is known about potential downsides for family well-being. This study addresses this gap by investigating whether high family motivation, despite good intentions, can lea d to work-family conflict (WFC) and negative spousal intera ctions due to excessive work effort depleting personal resources. Drawing on resource drain the ory, the authors propose tha t FSSBs from supervisors serve as exte rnal resources that may mitigate this drain. Using a three-wave dya dic survey desi gn with employee-partner data, the study tests a mediated moderation model. The key c ontribution lies in revealing the ‘dark side’ of family motivat ion and identifying organizational support as a boundary condition. Supplementar y Methods 5 (SM5): Journal-to-Tier Mapping Ground-truth tier labels were assigned a priori via a deterministic mapping from publication venue to one of four institutional prestige tiers. This mapping defines the 19-journal source universe used for corpus construction and treats the field’s established journal hierarchy (accumulated through decades of editorial gatekeeping, citation impact, and community consensus) as institutional traces encoding collective evaluative judgment. Table SM5. Journal-to-tie r m apping for the 19-journal source universe. Tier Journals Rationale Exceptional Academy of Management Journal, Academy of Management Review, A dministrative Science Quarterly, Journal of Applied Psychology, Orga nization Science, Strategic Management Journal Elite field-defining outlets in management; highest selectivity and institutional prestige Strong Journal of Management, Organiza tional Behavior and Human Decision Processes, Personnel Psychology Top-tier specialty outlets with strong citation impact and high prestige, typically just below the elite general-management tier Fair Human Re source Management, Human Relations, Journal of Management Studies, Journal of Organizational Behavior, Leadership Quarterly Well-regarded field journals with rigorous peer review and substant ial disciplinary visibility, but lower prestige than the strong tier Tier Journals Rationale Limited Group & Organiza tion Management, Journal of Business and Psychology, Journa l of Managerial Psychology, Journal of Organizational Behavior Management, Journal of Personnel Psychology More specialized or lower-prestige outlets with narrower sc ope and lower institutional status i n the field hierarchy The tier mapping reflects field-wide consensus as codified in institutional tenure and promotion standards. Exceptional-tier journals are universally recognized as top-tier outlets across major research universities and are consistently counted toward tenure at leading institutions. Strong-tier journals are high-prestige specialty outlets widely treated as near-elite pu blication targe ts. Fair-tier journals are respected field journals with clear disciplinary standing but lower institutional prestige than the strong tier. Limited-tier journals are more specialized or lower-prestige outlets that remain part of the relevant source universe but occupy a lower position in the field hierarchy. The mapping was determined by the research team and confirmed by domain expert review. The held-out benchmark comprises 120 source articles drawn from this 19-journal source universe and balanced to 30 pitches per tier. Benchmark articles are therefore an article-level subset of the sour ce universe, not the basis for defining the tier framework. Of the 19 source journals, 17 are represented in the final benchmark; Human Relations and Group & Organization Management had no articles selected under the tier-balanced sampling constraints. Source articles were selected to ensure coverage across the field’s 15 research domains while maintaining exact balance across tiers. Supplementar y Methods 6 (SM6): Evaluation Prompt s and Zero-Shot Design Rationale Three prompt variants We designed three candidate evaluation prompts varying in structure, specificity, and anchoring strategy. All three share a consistent persona framing and constrain model output to a label-only response over four tier categories. Prompt 1 (Expert prompt; selected as primary): A detailed prompt with structured tier definitions emphasizing originality and usefulness, with behavioral anchors for each tier. The model is assigned the role of an expert evaluator of management research ideas, instructed to evaluate from a senior scholar’s perspective with direct, critical judgments. Two evaluation dimensions are defined in detail: Novelt y : Whethe r the research idea cha llenges existi ng assumpti ons, reve als someth ing genuinel y surprising , or p rovides cognitive disrupt ion that fundamentally change s un derstanding of relationship s or pheno mena. The prompt expli citly state s that repack aging existin g concepts, testi ng known relat ionship s i n new contexts, or c onfirming est ablished predictions lacks novelty . Usefulness : Wheth er the rese arch idea addresses problem s t hat m atter, with broad implicatio ns for multip le stakeholde rs, r esolving long -standing theoretical debate s or provid ing insights that meaningfully improve organizatio nal practices. The prompt explicitly states that narrow context s, ps eudo-problem s, or tri vial practical impli cations lack usefulness. Four tiers are defined with behavioral anchors: Exceptional (strong novelty + strong usefulness; field- reshaping potential; most prestigious journals), Strong (clear strength in one dimensio n with the other reasonably developed; meaningful contributions; near-top-tier journals), Fair (incremental contributions with modest novelty or usefulness; mid-level journals), Limited (lacks both novelty and usefulness; lower- tier journals). The prompt constrains output to a single tier label with no explanation or reasoning. An explicit ins truction prohibits the u se of search capabili ties. Fu ll prompt text is available in the code repository. Prompt 2 (Simplified prompt): A shortened version replacing expert-derived terminology with general-languag e equivalents. Tier definitions are compressed into single-sentence descriptions without behavioral anchors: Exceptional = “field-defining work, recognized across disciplines”; Strong = “meaningful contribution, clearly advances theory or method”; Fair = “solid but incremental, recognized mainly by specialists”; Limited = “weak contribution, obvious findings or narrow scope.” No detailed criteria for novelty or usefulness are provided. Full prompt text is available in the code repository. Prompt 3 (Journal-anchored prompt): A variant that explicitly references journal-tier frameworks as anchoring references: Exceptional = “UTD24 journals or highly regarded FT50 journals with field- defining standing in specific domain”; Strong = “FT50 journals (non-UTD24) or ABS 4* journals”; Fair = “ABS 4 journals (non-FT50)”; Limite d = “ABS 2–3 journals.” This prompt anchors quali ty levels to institutional prestige indicators instead of abstract quality dimensions. Full prompt text is available in the code repository. Verbatim prompt texts (exact strings) Prompt 1 (expert rubric) # ROLE You are an expert evaluator of management research ideas. Your task is to evaluate from a senior scholar's perspective: be direct and critical, give clear judgments based on novelty and usefulness to classify research ideas into appropriate publication potential tiers. # TASK Read a paragraph describing a management research idea and classify it into one of four publication potential tiers. Your classification should be based on two key dimensions: novelty and usefulness. Output ONLY the tier notation with NO explanation or reasoning. # EVALUATION CRITERIA ## Novelty Novelty reflects whether the research idea challenges existing assumptions or reveals something genuinely surprising. Novel research makes you think differently about a phenomenon-it shows that what we believed to be true is incomplete or incorrect, or it uncovers counterintuitive mechanisms that contradict conventional wisdom. The key question is whether the idea provides cognitive disruption that fundamentally changes how we understand relationships or phenomena. Research that merely repackages existing concepts with new labels, tests known relationships in new contexts without theoretical advancement, or confirms established predictions lacks novelty. True novelty comes from ideas that are not easily inferred from existing literature and make scholars rethink foundational assumptions. ## Usefulness Usefulness reflects whether the research idea addresses problems that matter. Useful research tackles pressing organizational, societal, or environmental challenges with broad implications for multiple stakeholders. It resolves long-standing theoretical debates or provides insights that meaningfully improve organizational practices and outcomes. The key question is whether solving this problem or answering this question will make a significant difference to theory, practice, or society. Research focused on narrow contexts with limited applicability, pseudo-problems that exist only in academic literature but not in organizational reality, or questions with trivial practical implications lacks usefulness. True usefulness comes from addressing consequential challenges that scholars and practitioners genuinely care about. # CLASSIFICATION TIERS ## Tier 4: Exceptional (Publication Potential) Research that demonstrates both strong novelty and strong usefulness. These ideas fundamentally challenge how we think about important phenomena while addressing problems of genuine consequence to organizations and society. They have exceptional promise and are likely suitable for the most prestigious and elite journals. ## Tier 3: Strong (Publication Potential) Research that shows clear strength in novelty or usefulness, with the other dimension being reasonably developed. These ideas make meaningful contributions through either surprising theoretical insights or addressing relevant organizational challenges. They have strong potential to be published in near-top-tier journals. ## Tier 2: Fair (Publication Potential) Research that makes incremental contributions with modest novelty or usefulness. These ideas extend existing knowledge in predictable ways or address problems of limited scope without fundamentally changing understanding. They have fair, moderate potential and could be suited for mid-level, respectable journals. ## Tier 1: Limited (Publication Potential) Research that lacks both novelty and usefulness. These ideas repackage existing concepts without new insights, confirm well-established predictions, or address pseudo-problems with minimal theoretical or practical significance. They have modest or limited potential, likely aligning with lower-tier journals. # OUTPUT FORMAT # IMPORTANT - Do not use search capabilities to look up information about this idea Respond with EXACTLY ONE of these four notations: - Exceptional - Strong - Fair - Limited Output only the tier notation in your final answer. Prompt 2 (simplified rubric) You are an expert in management research. Read the research idea below and estimate the likely publication tier based on its scholarly contribution. - Exceptional: Field-defining work. Would be recognized across disciplines as a major advance. Likely to be widely cited and reshape how researchers think about the topic. - Strong: Meaningful contribution within the field. Clearly advances theory or method in a non-trivial way. Would be well-regarded by domain experts. - Fair: Solid but incremental. Competent execution with limited novelty. Recognized mainly by specialists in the same narrow area. - Limited: Weak contribution. Findings are obvious, scope is too narrow, or methodological issues undermine the work. # IMPORTANT - Do not use search capabilities to look up information about this idea # OUTPUT FORMAT Respond with EXACTLY ONE of these four notations: - Exceptional - Strong - Fair - Limited Output only the tier notation in your final answer. Prompt 3 (journal-anc hored rubric) You are an expert in management research with deep knowledge of academic publishing standards across top-tier journals. # TASK Read a paragraph describing a management research idea and classify it into one of four journal tiers based on its likely publication venue. Your classification should reflect where work of this quality and contribution level would most likely be published. - Exceptional: UTD24 journals or highly regarded FT50 journals with field-defining standing in their domain - paradigm-shifting work, highest selectivity, field-redefining impact - Strong: FT50 journals (non-UTD24) or ABS 4* journals - substantial contribution, A- level quality, high methodological rigor - Fair: ABS 4 journals (non-FT50) - solid contribution with clear theoretical grounding, competent execution but limited novelty - Limited: ABS 2-3 journals - incremental findings, narrower scope, or moderate methodological rigor # IMPORTANT - Do not use search capabilities to look up information about this idea # OUTPUT FORMAT Respond with EXACTLY ONE of these four notations: - Exceptional - Strong - Fair - Limited Output only the tier notation in your final answer. Prompt selection Prompt selection. The three prompt variants produced no significant accuracy differences across frontier models. Prompt 1 (expert rubric) yielded the highest frontier mean accuracy and was therefore adopted as the fixed evaluation protocol, ensuring that any SFT advantage represents a conservative estimate. The simp lified rubric performed lowest ove rall; the journal-an chored rubric tended to elicit superficial feature matching against memorized journal profiles instead of genuine quality evaluation. Zero-shot design. All evaluations used zero-shot prompting. Because ground-truth labels derive from publication outcomes rather than direct quality assessments, few-shot exemplars would carry noise from confounding factors such as execution quality, writing craft, and reviewer fit, risking anchoring models to misleading featu res. Zero-shot evaluation also en sures that all evaluator classes, frontier models, SFT models, base models, and human raters, are compared under identical conditions. Sensitivity analysis Extended Data Fig. 1 reports cross-model pr ompt-sensitivity for the subset of frontier models evaluated under the same three-prompt p rotocol (Simple, Journal, Ex pert). The panel is intentio nally restricted to this within-frontier comparison so that any differences can be attributed to prompt wording under matched conditions; it is not intended as a cross-family comparison with the SFT models, whose primary analysis uses the frozen expert prompt. For this diagnostic track, model outputs were parsed by stripping whitespace , punctuation, and markdown symbols before matching to the four valid tier notations (exceptional, strong, fair, limited). Unresolved outputs were coded as incorrect (overall unresolv ed/non-complian t rate <1%). Supplementar y Methods 7 (SM7): Human Study Design This section provides procedural details that supplement the Methods description of the human evaluation protocol. For panel composition, recruitment, survey design, cohort structure, and survey administration overview, see Methods (“Human evaluation protocol ” ). Institutional review The study was approved by the institutional review board (Project No. THU-04-2 026-0034). Raters were not informed of the study’s comparison targets or of the AI evaluation component. Junior scholars were co mpensated with 100 RM B and/or access to a research tool developed by the research team. Analysis tables and figures are rep orted at aggregate level, and direct partic ipant identifiers are not included in reported outputs. Full survey instrumen t For each benc hmark pitch, raters were shown the research -question pitch alon gside the evalu ation criteria and responded to four items with the following exact wording and scales: 1. Prior exposure : “Had you encounte red this re search idea or its sourc e p aper before?” Response options: Yes / No. 2. Quality rating : “Based on the evaluation criteria, how would you rate the qualit y of thi s re search idea?” Response options: Top / Top- / Goo d / Fair (the human-facing shor thand, mapped determinis tically to exceptiona l / strong / fair / li mited in al l analyses). 3. Confidence : “How confident are you in your rating?” Response op tions on a 5-point Likert scale: 1 = “Not at all co nfident”, 2 = “ Slightly confident”, 3 = “Moderately confident” , 4 = “Very confiden t”, 5 = “Extremel y confident”. 4. Domain familiarity : “How familiar are you w ith this res earch area?” Response options on a 5-p oint Likert scale: 1 = “No t at all familia r”, 2 = “Slight ly fam iliar”, 3 = “Mo derately familiar ”, 4 = “Very familiar” , 5 = “Extremel y familiar”. Completion duration Median expert co mpletion time was 923 seconds (~15.4 minutes) for 8 pitches. Median junior completion time was 2,534 seconds (~42.2 minutes) for approximately 14.5 pitches. Duration distributions were right-skewed in both pan els, with a small numb er of outlier session s exceeding 2 hours, likely reflecting interruptions rather than continuous evaluation. Background data collection For junior scholars, demographic and academic background information was collected : - Gender - University and department - Research direction/area - Doctoral year (PhD1 through PhD5+, or postdoc) - Number of published papers - Peer-review experience (yes/no, number of reviews) - AI tool familiarity (1–5 scale) Background data was matched to ratings for 104 of 108 old-cohort juniors (96.3%) and 52 of 67 new- cohort juniors (77.6%). Four old-cohort and 15 new-cohort juniors could not be matched due to name discrepancies between signup records and survey responses. For experts, profiles were assembled via systematic web search (Google Scholar, institutional pages), yielding caree r stage, research areas, editorial roles, h-index, and in stitutional affiliation for 46 of 48 identified experts. Filtering criteria Experts were recruited through personal and professional networks via one-on-one direct contact. Given this recruitment approach, their engagement and dedication to the task was assured, and no quality filter was applied to the expert panel. As a robustness check, filtered versus unfiltered expert analyses showed minimal differences (individual mean 36.2% vs. 36.2%; majority vote 41.6% vs. 39.7%; Supplementary Table ST7). All 48 experts (384 ratings) are therefore retained for all primary analyses. Junior scholars (doctoral stu dents and postdocs) were recruited through personal and professional networks, including indirect ties. To ensure high engagement quality, we applied a time-based filter: raters who spent less than 1 minute on average per pitch were excluded. This filt er showed a mar ginally significant effect on accuracy (25 .3% vs. 31 .7%, P = 0.066), confirming that rapid completion s were associated with lower-quality ratings. The filtered panel (174 raters, 2,530 ratings) is used in all primary analyses; unfiltered results (189 raters, 2,730 ratings) are reported for comparison in Supplementary Table ST7. Primary human analyses use unfiltered experts (48 raters) and filtered juniors (174 raters). Filtered- versus-unfiltere d sensitivity is reported in Supplementary Table ST7. Supplementar y Methods 8 (SM8): Label-Noise Ceiling Analysis Publication outcom es are not solely determined by research idea quality. Executio n fidelity, writing quality, reviewer–manu script fit, and editorial discretion all contribute to final publication decisions, while our standardized inputs capture only the idea dimension. This gap between input features and outcome labels intro duces inhe rent no ise that places a theor etical ceiling on achievable classification accuracy: even a perfect evaluator of research idea quality would not achieve perfect agreement with publication outcomes. Several factors contribute to this noise floor: 1. Execution gap. A strong research idea may b e published in a lower- tier journal due to poor execu tion, and a modest idea m ay reach a top-ti er journal through exceptional methods and writing . Our inpu ts st rip execution inform ation, so the model ca nnot account for this var iance. 2. Reviewer– manuscri pt fi t. Publication decisions depend part ly on the match between reviewer exp ertise and the manuscript’s topic, which introduces stochas tic v ariation unrelated to idea quality. 3. Editorial discreti on. Editors exercise judgment that reflect s s trategic considerat ions (journal scope, topic balance, timeline ss) beyond pure quality assessment. 4. Tier boundary ambigui ty. Some jo urnals sit at the boun dary b etween adjace nt ti ers. While our mapping is determinis tic, the underlying quality distributio n i s con tinuous, creating inhere nt disagreement for articles near tier boundaries. Observed accuracies should therefore be interpreted relative to this ceiling, not against a 100% standard. Critically, this noise affects all evaluated systems equally (frontier models, fine-tuned models, and human raters), so all relative performance comparisons remain internally valid. The noise floor also explains why even the best-performin g system (SFT ensemble at 60. 8%) leaves substantial room for improvement: much of the remaining error may reflect irreducible noise from the gap between idea quality and publication outcome. Supplementar y Methods 9 (SM9): Cross-Field Validation in Economics We extended the institutional trace validation to economics, using the same supervision logic as the main benchmark. This section records the dataset construction, journal mapping, and evaluation design for this field-specific validation. Training corpus. The economics training slice comprised 5,593 proce ssed research-pitch/journal- outcome pairs. This corpus was drawn mainly from 2024/2025 publications and was approximately balanced across the four tiers. As in the main setting, each training example used the frozen contextual research-questio n representatio n paired with a single tier-label target. The SFT training procedure itself followed the same pipeline described in SM1. This addition al dataset was larger, fresher, and mor e balanced than the original managemen t corpus because economics publish es at higher volume and contains denser journal coverage in the relevant tiers. Held-out test sets. The evaluation set was drawn from 2025 publications only. We sampled 200 held- out items at random for economics, with balanced sampling across the four tiers (50 per tier). These items were excluded from the training slice. Journal mapping. Tier ass ignment used the journal’s authoritative full name as the ma pping key, with ISSN and eISSN as secondary validation fields. The stored journal alias field was treated only as a display alias or fallback field. This distinction matters because alias collisi ons can exist across fields ; mapping by authoritative full name eliminates ambiguity when short aliases overlap acr oss tiers. The complete journal-to-tier mapping table is provided in the data archive. Prompt. All economics evaluations used the same social-science evaluation prompt scaffold instead of a newly specialized field prompt. This preserved comparability with the main paper and ensured that any performance change reflected the field-specific institutional traces rather than prompt rewriting. You are an expert in social science research. Read the research idea below and estimate its likely publication potential based on its scholarly contribution. - Exceptional: Field-defining work with strong theoretical or empirical contribution. It would influence how researchers across the social sciences think about an important problem. - Strong: Clear and meaningful contribution. It advances theory, evidence, or method in a non-trivial way and would be well regarded by scholars in the field. - Fair: Competent but incremental. It extends existing knowledge in a predictable way, with limited novelty, scope, or broader significance. - Limited: Weak contribution. The question is narrow, obvious, poorly motivated, or methodologically insufficient to support a meaningful scholarly advance. # IMPORTANT - Do not use search capabilities to look up information about this idea # OUTPUT FORMAT Respond with EXACTLY ONE of these four notations: - Exceptional - Strong - Fair - Limited Output only the tier notation in your final answer. Pooled training. We also trained pooled models on the combined corpus from both fields (management and economics, approximately 10,072 total pairs) to test whether evaluative signals from distinct disciplines interfere when combined. The pooled training used the same SFT procedure and architectures (Qwen3-30B- A3B and GPT-4.1-nano). Validation logic. This ex tension serves two pur poses. Fir st, training new models on economics- specific institution al traces tests whether the SFT mech anism replicat es outside management. Second, evaluating pooled models on each field’s test set tests whether a single model can maintain evaluative performance across multiple disciplines simultan eously. Supplementary T ables Supplemen tary Table 1 (ST 1): Pairwise Discriminati on by Ti er Distance Table ST1. Pairwise head-to-he ad ac curacy (label-fre e task). Model Distance 1 (adjacent) Distance 2 Distance 3 Weighted overall SFT GPT-4.1 78.67% (118/150) 89.00% (89/100) 92.00% (46/50) 84.33% (253/300) Gemini 3.1 Pro 68.67% (103/150) 86.00% (86/100) 86.00% (43/50) 77.33% (232/300) GPT-5.2 High 69.33% (104/150) 85.00% (85/100) 94.00% (47/50) 78.67% (236/300) GPT-4.1 (baseline) 69.33% (104/150) 79.00% (79/100) 90.00% (45/50) 76.00% (228/300) All four models in the shared pairwise subset produced valid predictions on all 300 pairwise items. Fig. 5 plots this same SFT GPT-4.1 / Gemini 3.1 Pro / GPT-5.2 High / GPT-4.1 baseline subset, covering overall weighted accuracy and the two hardest boundaries (fair_strong, strong_exceptional). Extended Data Fig. 2 retains the six individual pair types and the paired-discordance decomposition for this same subset. On the same 300 shared items, raw u nadjusted two- sided exact McNemar tests for SFT GPT-4.1 gave p = 0.00646 versus Gem ini 3.1 Pro, p = 0.0300 versus GPT-5.2 High, and p = 0.000621 versus GPT-4.1 baseline. Supplemen tary Table 2 (ST 2): Cost and Inference Regime Compariso n Table ST2. Training and inference cost bands by e valuator type. Model class Training cost/model Inference cost (per 100 pitches) Notes Frontier (thinking) $0 (API ac cess) >$10 8 samples per pitch; chain-of-thought generation Chat (logp) $0 (API ac cess) $0.01–$0.10 Single-pass log-probability classification SFT: Qwen3-4B ~1 A100 GPU hour $0.001 Log-probability classification SFT: Qwen3-30B- A3B ~8 A100 GPU hours $0.01 Log-probability classification SFT: GPT-4.1-nano ~$10 (API) $0.01 Log-probability classification SFT: GPT-4.1 ~$200 (API) $0.10 Log-probability classification RL checkpoints Multi-day 8 x A100 runs Higher than log-probability pipelines Reasoning generation + label extraction Supplemen tary Table 3 (ST 3): Core Per-Class Metrics (Non-over lapping with Figure Panels) Table ST3. Precision/re call/F1 by tier for key evalu ators. Evaluator Tier Precision Recall F1 Best Flagship (Gemini 3.1 Pro) Exceptional 0.478 0.379 0.423 Evaluator Tier Precision Recall F1 Best Flagship (Gemini 3.1 Pro) Strong 0.433 0.448 0.441 Best Flagship (Gemini 3.1 Pro) Fair 0.304 0.607 0.405 Best Flagship (Gemini 3.1 Pro) Limited 0.667 0.138 0.229 SFT 2-Model Ensemble Exceptional 0.605 0.767 0.676 SFT 2-Model Ensemble Strong 0.640 0.533 0.582 SFT 2-Model Ensemble Fair 0.514 0.600 0.554 SFT 2-Model Ensemble Limited 0.727 0.533 0.615 Expert Majori ty (unfiltered) Exceptional 0.625 0.227 0.333 Expert Majori ty (unfiltered) Strong 0.371 0.591 0.456 Expert Majori ty (unfiltered) Fair 0.361 0.520 0.426 Expert Majori ty (unfiltered) Limited 0.600 0.300 0.400 Junior Majority (filtered) Exceptional 0.667 0.333 0.444 Junior Majority (filtered) Strong 0.312 0.385 0.345 Junior Majority (filtered) Fair 0.347 0.654 0.453 Junior Majority (filtered) Limited 0.700 0.259 0.378 Supplemen tary Table 4 (ST 4): All Pairwise SFT Ensemble Combinations Table ST4. Accuracy of all six two -model SFT ensembles (probab ility a veraging). Model 1 Model 2 Accuracy (%) GPT-4.1-nano (SFT) Qwen3-30B-A3B (SFT) 60.8 GPT-4.1 (SFT) Qwen3-30B-A3B (SFT) 60.0 GPT-4.1 (SFT) Qwen3-4B (SFT) 60.0 GPT-4.1-nano (SFT) Qwen3-4B (SFT) 60.0 GPT-4.1-nano (SFT) GPT-4.1 (SFT) 59.2 Qwen3-30B-A3B (SFT) Qwen3-4B (SFT) 59.2 All six combinations exceed the frontier average benchmark. Within-article exact class-probability ties were resolved deterministically before ensembles were ranked by accuracy, then macro F1, with a fixed model order convention used only if those metrics remained tied; under this rule, GPT-4.1-nano (SFT) + Qwen3-30B-A 3B (SFT) was retained as the primary pair. As a supporting temporal stability check, the matched older source temporal comparison contrasts an older training slice (2015-2020) against the matched recent slice (2020-2025), with the benchmark itself drawn from post-June-30-2025 publications. On the same benchmark, the older source GPT-4.1-nan o SFT reached 43.3% accuracy and macro F1 0.423, the older source Qwen3-30B-A3B SFT reached 46.7% and 0.460, and the older-trace matched 2-model ensemble reached 47.5% and 0.470, versus 57.5% and 0.573, 58.3% and 0.584, and 60.8% and 0.607 for the corresponding recent-training GPT-4.1-nano, Qwen3-30B- A3B, and matched 2-model ensemble from that same architecture set; this matched architecture pair is also the best recent 2-model ensemble reported in the main benchmark (GPT-4.1-nano + Qwen3-30B- A3B, 60.8% and 0. 607). The older-trace ensemble also remained more inflationary than the matched recent ensemble, with lower exceptional-tier precision (46.7% versus 60.5%), lower fair-tier recall (26.7% versus 60.0%), and str onger strong->exceptional confusion (46.7% versus 33.3%), indicating that the institutional signal persists across time but yields weaker tier calibration under the older source training set. Compressed-i nput transfer from fuller supervision Extended Data Fig. 7 reuses the same 120 held-out articles but replaces the full idea summary with the one-sentence idea statement at evaluation time. This is an evaluation-only transfer test: the SFT checkpoints remain trained on the full idea summary only. Model Full idea summary accuracy One-sentence idea statement accuracy Delta (pp) Full idea summary macro F1 One-sentence idea statement macro F1 Delta GPT-4.1 base 32.5 29.2 -3.3 0.268 0.225 -0.043 GPT-4.1 SFT 55.0 49.2 -5.8 0.558 0.480 -0.078 GPT-4.1- nano base 25.0 30.8 +5.8 0.186 0.259 +0.073 Model Full idea summary accuracy One-sentence idea statement accuracy Delta (pp) Full idea summary macro F1 One-sentence idea statement macro F1 Delta GPT-4.1- nano SFT 57.5 33.3 -24.2 0.573 0.283 -0.290 Model One-sentence recall (exceptional / strong / fair / limited) One-sentence pr ecision (exceptional / strong / fair / limited) One-sentence predicted counts (exceptional / strong / fair / limited) GPT-4.1 base 3.3 / 23.3 / 80.0 / 10.0 25.0 / 28.0 / 27.6 / 75.0 4 / 25 / 87 / 4 GPT-4.1 SFT 46.7 / 26.7 / 40.0 / 83.3 66.7 / 57.1 / 30.8 / 54.3 21 / 14 / 39 / 46 GPT-4.1- nano base 10.0 / 20.0 / 80.0 / 13.3 42.9 / 33.3 / 27.3 / 57.1 7 / 18 / 88 / 7 GPT-4.1- nano SFT 23.3 / 0.0 / 63.3 / 46.7 53.8 / 0.0 / 26.0 / 41.2 13 / 0 / 73 / 34 The transfer pattern is asymmetric. GPT-4.1 SFT remains well above its base model on the one-sentence input and stays clearly above chance, but it becomes more conservative than on the full-input benchmark: under-estimation errors rise from 14 to 47 items, limited-tier recall rises from 60.0% to 83.3%, and mass shifts toward the limited tier (21 -> 46 predictions). GPT-4.1-nano SFT, by contrast, loses most of its full- input advantage under compression, never predicts the strong tier on the one-sentence input, and falls to only modestly above chance. The base models remain dominated by middle-tier clustering, with 87 and 88 of 120 short-input predictions landing in the fair tier for GPT-4.1 base and GPT-4.1-nano base respectively. Supplemen tary Table 5 (ST 5): Human Panel Composition and Descrip tives Table ST5a. Expert career-stag e distribution (N = 48). Career stage N Assistant Professor 5 Associate Professor 17 Full Professor 12 Endowed Chair 12 Unreported 2 Table ST5b. Panel-level descript ive summary. Metric Experts Juniors Number of raters 48 174 Total ratings 384 2,530 Mean ra tings per rater 8.0 14.5 Mean ra tings per pitch 3.2 21.1 Median completion time (seconds) 923 2,534 Mean c onfidence (1-5) 3.50 3.46 Mean fa miliarity (1-5) 3.15 2.81 Supplemen tary Table 6 (ST 6): Label N ormalizati on Table ST6. Determinist ic mapping used before all an alyses. Numeric code Unified tier Source-article metadata label Human surve y label 1 Exceptional top Top 2 Strong top- Top- 3 Fair good Good 4 Limited fair Fair Note: the unified labels exceptional / strong / fair / limited were used for AI evaluation because first-token log-probability extraction cannot reliably distinguish alternatives such as Top and Top-, which share the same token prefix. Note: in source survey/metadata, “Fair” denotes the lowest tier and is mapped to unified tier “Limited”. Machine evaluators used the labels exceptional / strong / fair / limited because first-token log-probability classification cannot reliably distinguish alternatives such as Top and Top-, which share the same top token. Supplemen tary Table 7 (ST 7): Filtering Sensitiv ity Table ST7. Filtered versus unfiltered panel outco mes. Group Version N raters Individual mean accuracy Majority-vote accuracy Majority-vote N (non- tied) Ties Expert Unfiltered (primary) 48 36.2% 41.6% 89 31 Expert Filtered 39 36.2% 39.7% 68 52 Junior Unfiltered 189 31.2% 41.3% 104 16 Junior Filtered (primary) 174 31.7% 40.8% 103 17 Supplemen tary Table 8 (ST 8): Pairwise McNemar Test Compen dium Table ST8. Pairwise significan ce t ests for key evaluator comparisons . Note: “Best Frontier” refers to Gemini 3.1 Pro under the conservative frontier protocol. Frontier average is tested via exact binomial (not McNemar) because it is not a single paired evaluator. Comparison (vs SFT 2-Model Ensemble) N SFT Acc Comparator Acc Delta (pp) Test Statistic p (raw) Frontier average (11 models) 120 0.6083 0.3105 +29.78 Exact binomial — 1.74 x 10^- 11 Best Frontier (Gemini 3.1 Pro) 115 0.6000 0.3913 +20.87 McNemar 10.173 0.001425 Expert majority (excl. ties) 89 0.6180 0.4157 +20.22 McNemar 6.568 0.010382 Junior majority (full, excl. ties) 103 0.6117 0.4078 +20.39 McNemar 8.889 0.002869 Extended pairwise comparisons. Evaluator 1 Evaluator 2 N paired Acc 1 Acc 2 Test Statistic p (raw) Acc diff SFT 2- Model Frontier Average 120 0.6083 0.3105 Exact binomial — 1.74 x 10^- 11 +0.2978 SFT 2- Model Best Frontier (Gemini 3.1 Pro) 115 0.6000 0.3913 McNemar 10.173 0.001425 +0.2087 SFT 2- Model Expert Majori ty 89 0.6292 0.4157 McNemar 7.200 0.007290 +0.2135 SFT 2- Model Junior Majority (full) 103 0.6214 0.4078 McNemar 9.587 0.001960 +0.2136 Supplemen tary Table 9 (ST 9): Individual Expert Accurac y Distribution Table ST9. Individual expert accuracy distri bution (unfiltered pane l, N = 48). Each of 48 experts evaluated exactly 8 pitches. Individual accuracy ranges from 0/8 (0%; 2 experts) to 8/8 (100%; 1 expert). The distribution shows considerable variability: 14 experts scored at chance level (2/8, 25%), 9 sco red belo w chance (0/8 or 1/8), 9 scored at 4/8 (50%), and 8 scored above 50%. Median accuracy was 3/8 (37.5%). Supplemen tary Table 10 ( ST10): Monte Carlo Matched-N Analy sis Table ST10. Junior panel subsamplin g t o expe rt-sized panel s. Metric Value Draws 5,000 Target panel size Expert-equivalent (~3.2 raters/pitch) Mean m ajority-vote accuracy 36.1% 95% CI 26.8% to 45.7% Mean e ffective non-tied N 83.4 pitches Supplemen tary Table 11 ( ST11): Prior-Exp osure Descriptive Summ ary Prior exposure was uncommon in the expert panel: 28 of 383 ratings with non-missing prior-exposure responses (7.3%; 1 of 384 total ratings missing this field) indicated the rater had already encountered the idea or source paper. Accuracy for prio r-exposure ratings was 5 3.6% (15/28), co mpared with 34.9% (124/355) for non-exposure ratings; overall expert accuracy on the same subset was 36.3% (139/383). We report this as a descriptive check only. Supplemen tary Table 12 ( ST12): Agreeme nt and Con sensus Diagnostics Table ST12a. Human inter-rate r reliability. Panel Fleiss’ kappa 95% CI Krippendorff’s alpha (ordinal) Expert 0.0469 [-0.0114, 0.1068] 0.307 Junior 0.0318 [0.0194, 0.0446] 0.324 Table ST12b. Pairwise Cohe n’s kappa among 4 SFT models. Pair Family Size Agreement κ Mean distance GPT-4.1-FT × GPT-4.1-nano-FT same cross 0.633 +0.503 0.500 GPT-4.1-FT × Qwen3-30B-A3B-FT cross same (large) 0.700 +0.592 0.408 GPT-4.1-FT × Qwen3-4B-FT cross cross 0.642 +0.511 0.450 GPT-4.1-nano-FT × Qwen3-30B-A3B-FT cross cross 0.708 +0.606 0.408 GPT-4.1-nano-FT × Qwen3-4B-FT cross same (small) 0.708 +0.604 0.367 Qwen3-30B-A3B-FT × Qwen3-4B-FT same cross 0.642 +0.512 0.458 Mean distance = mean absolute ordinal rank distance between model predictions (lower = more similar predictions). Pairwise Cohen ’s κ across the 6 model pairs ranges from +0.503 to +0.606. AI models are therefore an order of magnitude more internally consiste nt th an human raters (κ ≈ 0.03–0.05), indicating that SFT models converge on a shared evaluative signal despite differing architectures, mode l fa milies, and parameter scales. Agreement is strongest for cross-family pairs at the same scale (mean κ = +0.598), followed by cross- family pairs at different scales (+0.559), with same-family pairs at different scales lowest (+0.508). The highest agreement occurs for the cross-family cross-scale pair (GPT-4.1-nano-FT × Qwen3-30B-A3B-FT: κ = +0.606), while the lowest occurs within the GPT family across sizes (GPT-4.1-FT × GPT-4.1-nano-F T: κ = +0.503). Dissent frequency (which model disagrees with majority most often). Model N disagreements (of 120) GPT-4.1-FT 18 GPT-4.1-nano-FT 27 Qwen3-30B-A3B-FT 20 Qwen3-4B-FT 27 Table ST12c. Consens us c overage and accuracy tradeoff. Policy Coverage (N / 120) Coverage (%) Accuracy (%) SFT 4/4 consensus 51 42.5 72.5 SFT >=3/4 consensus 97 80.8 66.0 SFT 2/4 split 23 19.2 34.8 Junior >=60% vote share 3 2.5 66.7 Junior >=50% vote share 25 20.8 56.0 Expert unanim ous (>=2 raters) 13 10.8 69.2 Junior full-panel plurality 120 100.0 40.0 Expert full-pa nel plurality 120 100.0 39.2 When all four SFT models agree (N = 51), accuracy reaches 72.5%; when the strongest agreement is only 2/4, accuracy drops to 34.8%. Human voting shows a steeper tradeoff: junior >=60% consensus reaches comparable precision but covers only 2.5% of pitches. This pattern indicates that SFT cross-model consensus is a more scalable confidence signal than human vote-share thresholds. Per-class accuracy at full AI consensus (4/4). Tier Correct / N Accuracy (%) Exceptional 14 / 14 100.0 Strong 7 / 13 53.8 Fair 6 / 9 66.7 Limited 10 / 15 66.7 Per-evaluator prediction distribution. Evaluator Exceptional Strong Fair Limited GPT-4.1-FT 0.358 0.192 0.275 0.175 GPT-4.1-nano-FT 0.300 0.200 0.317 0.183 Qwen3-30B-A3B-FT 0.342 0.225 0.258 0.175 Qwen3-4B-FT 0.325 0.250 0.292 0.133 Human juni or majority 0.117 0.311 0.476 0.097 Ground truth (uniform) 0.250 0.250 0.250 0.250 All AI models over-predict “exceptional”; human junior majority over-predicts “fair.” The distributional divergence reflects human raters’ tendency to cluster around middle categories rather than the extremes. AI–hum an consistency. AI–human pairwise κ ranges from +0.10 to +0.21, substantially lower than AI–AI agreement (κ = 0.50–0.72). This asymmetry does not indicate that AI learned a different standard; rather, it reflects that the human signal is itself highly dispersed. Humans individually score above random (experts 36.2%, juniors 31.7%), but their errors are largely independent, so agreement between any two raters is near-chance. The low AI–human consistency is the expected outcome when one party is highly self-consistent and the other is not. Supplemen tary Table 13 ( ST13): Model Inventory and Access Window Table ST13a. Frontier reasoni ng m odels (clean primary cohort) . Model Provider Model version Access window Samples/pitch Claude Opus 4.6 Anthropic claude-4.6-opus-20260205 March 1, 2026 8 GPT-5.2 High OpenAI gpt-5.2 March 1, 2026 8 Gemini 2.5 Pro Google gemini-2.5-pro March 1, 2026 8 Gemini 3.1 Pro Google gemini-3.1-pro-preview-20260219 March 1, 2026 8 Qwen 3.5 Plus Alibaba qwen3.5-plus-02-15 March 1, 2026 8 DeepSeek V3.2 DeepSeek deepseek-v3.2-speciale-20251201 March 1, 2026 8 Seed 2.0 Pro ByteDance doubao-seed-2-0-pro-260215 March 1, 2026 8 MiniMax M2.5 MiniMax minimax-m2.5 March 1, 2026 8 Kimi K2.5 Moonshot AI kimi-k2.5 March 1, 2026 8 Grok 4.1 Fast xAI grok-4.1-fast March 1, 2026 8 GLM-5 Zhipu AI glm-5 March 1, 2026 8 Table ST13b. Chat/log-pr obability evalu ators. Model Provider Model version Access window Log-probability extraction GPT-5.2 (chat) OpenAI gpt-5.2 March 1, 2026 Top-token log-probabilities Kimi K2 (chat) Moonshot AI kimi-k2-0905-preview March 1, 2026 Top-token log-probabilities DeepSeek Chat DeepSeek deepseek-v3.2 March 1, 2026 Top-token log-probabilities Supplemen tary Table 14 ( ST14): Economic s Jo urnal-to-Ti er Mapping Tier rationale. The econom ics tier mapping reflects widely shared disciplinary consensus on journal prestige. Exceptional contains the “Top 5” economics journals (AER, Econo metrica, JPE, QJE, RES ), which represent universal consensus across all economics subfields as the most prestigious publication venues. Strong include s top field journals in major economics subfie lds (labor , public, development, international, etc.) and the AEJ series, widely recognized as near-elite outlets. Fair comprises established Q1 journals with solid reputations but lower institutional prestige than the Strong tier. Limited captures more specialized or lower-impact journals with narrower scope. Table ST14. Journal-to-tier m apping for th e economics validat ion. Tier Journals N journals Exceptional American Economic Review, Econometrica, Journal of Political Economy, Quarterly Journal of Economics, Re view of Economic Studies 5 Strong American Economic Journal: Applied Economics, American Economic Journal: Economic Policy, American Economic Journal: Macroeconomics, American Economic Journal: Microeconomics, Econometric Theory, Economic Journal, Games and Economic Behavior, International Ec onomic Review, J ournal of Development Economics, Journal of Econometrics, Journal of Economic Theory, Journal of International E conomics, Journal of Labor E conomics, Journal of Public Economics, RAND Journal of Economics, Review of Economic Dynamics, Theoretical Economics, Journal of the 18 Tier Journals N journals European Economic Associat ion Fair Brookings Papers on Economic A ctivity, European Journal of Health Economics, International Journal of Emerging Markets, Journal of Economic History, Journal of Popul ation Economics, New Political Economy, Quarterly Review of Econom ics and Finance 7 Limited Agricultural Economics, Amfiteatru Economic, ASTIN Bulletin, Journal of Cultural Economics, Journal of the Japanese and International Economies, Local Economy, Post-Soviet Affairs, Quantitative Economics 8 Supplemen tary Table 15 ( ST15): Economic s C ross-Field Valida tion Results Table ST15. Cross-field validatio n results for ec onomics. Model N Accuracy Macro F1 Role Qwen3-30B SFT (economics) 200 69.5% 70.4% In-domain SFT GPT-4.1-nano SFT (economics) 200 68.5% 69.4% In-domain SFT Qwen3-4B SFT (economics) 200 64.0% 64.8% In-domain SFT Qwen3-30B base 200 25.5% 16.9% Base control GPT-4.1-nano base 200 25.0% 15.6% Base control Qwen3-4B base 200 25.0% 10.0% Base control Qwen3-30B pooled (mgmt + econ) 200 69.5% 70.5% Pooled SFT GPT-4.1-nano pooled (mgmt + econ) 200 67.0% 67.4% Pooled SFT Mgmt SFT GPT-4.1 (cross-field) 200 43.5% 38.9% Cross-field transfer GPT-4.1 base (cross-field) 200 29.5% – Base comparator Pooled models were trained on the combined management and economics corpus (~10,072 pairs) using the same SFT procedure. On the management held-out benchmark (N = 120), the pooled Qwen3-30B reached 61.7% accuracy (macro-F1 0.615), comparable to the 60.8% single-field SFT ensemble, and the pooled GPT-4.1-nano reached 52.5% (macro-F1 0.489). The cross-field transfer row reports the management-trai ned SFT GPT-4.1 evaluated on economics without economics-specific fine-tuning (p < 10 ⁻ ⁸ versus chance; Supplementary Fig. 7). Supplementary Fi gures Supplemen tary Figure 1 (SF1): Prediction Distributio n C omparison Prediction distributions across evaluator classes. a , 100% stacked predicted-tier shares for the frontier average (11 models), chat average (3 models), SFT single-model average (4 models), SFT 2-model ensemble, expert majority vote, and junior majority vote. This panel shows at a glance which eval uator classes collapse into the middle tiers and which use the full label space. b , Deviation of each predicted-tier share from the balanced 25% benchmark, showing evaluator-specific tier bias. c , Normalized prediction entropy of the full pre dicted distribution, where higher values indicate broader use of the four tiers and lower values indicate stronger collapse into a narrow subset of labels. Supplemen tary Figure 2 (SF2): Expert Individual Accuracy Distribu tion a , Histogram of per-expert accuracy for the unfiltered expert panel (N = 48; 8 pitches each). Dashed line indicates mean accuracy (36.2%); dotted line indicates chance level (25%). The panel highlights substantial heterogeneity across experts, not a tight cluster around a common level of skill. b , Empirical cumulative distribution function (CDF) of per-expert accuracy with the same chance baseline, making it easier to see how much of the expert panel lies near chance versus in the higher-performing tail. Supplemen tary Figure 3 (SF3): Junior Monte Carlo Sub sampling Curve a , Majority-vote accuracy versus panel size under repeated Monte Carlo subsampling (5,000 draws), with 95% confidence band. Chance baseline (25%) is shown as a dotted line, and the curve shows that larger panels help early but then flatten. b , Marginal accuracy gain per additional rater, showing diminishing returns as panel size increases and clarifying why aggregation alone does not keep improving linearly. Supplemen tary Figure 4 (SF4): Frontier Collapse-Metri c Landscape Collapse diagnostics for the 11 frontier models. a , Share of predictions assigned to the middle tiers (strong + fair) by model. b , Per-tier recall heatmap across the four quality tiers, making visible which classes are effectively never recovered. c , Relationship between middle-tier concentration and overall accuracy across models. d , Normalized prediction entropy ranking, where higher values indicate less distributional collapse and broader use of the four-tier scale. Supplemen tary Figure 5 (SF5): AI-Human Error Compleme ntarity a , Overlap decomposition of correct and incorrect outcomes between the SFT ensemble and expert majority vote on the expert- comparable subset (N = 89 non-ti ed pitches): both correct, AI-only correct, human-only correct, and shared error. This panel shows directly how much of the two syst ems’ success is overlapping versus complementary. b , Complementarity ceiling: the oracle upper bound reached when either AI or the expert majority is correct is 77.5%, compared with SFT alone (62.9% on this subset) and expert majority vote (41.6%), quantifying the remaining room for hybrid routing strategies. Supplemen tary Figure 6 (SF6): Human C onfusion Matric es Row-normalized confusion matrices for expert and junior panels. a , Expert individual pooled (N = 384 ratings). b , Junior individual pooled (N = 2,530 ratings). c , Expert strict clear-majority voting (N = 89 non-tied; 31 ties excluded). d , Junior strict clear-majority voting (N = 103 non-tied; 17 ties excluded). Reading pooled and majority panels together clarifies how much disagreement is smoothed by voting and which off-diagonal confusions persist even after aggregation. Panel composition is summarized in Supplementary Table ST5, and majority-vote counts are summarized in Supplementary Tabl e ST7. Supplemen tary Figure 7 (SF7): Cross-Field Transfer from Managem ent to Econ omics The management-trained SFT GPT-4.1 checkpoint (trained exclusively on management instit utional traces) is evaluated on the 200-article economics benchmark without any economics-specific fine-tuning. a , Overall accuracy comparison: GPT-4.1 base (29.5%, not significantly above chance), management-trained SFT GPT-4.1 (43.5%, p < 10 ⁻ ⁸ versus chance; +14.0 percentage points over base), and the best economics in-domain SFT (Qwen3-30B, 69.5%) for reference. b , Row-normalized confusion matrix for the management SFT on economics, showing 88% exceptional recall but only 10% limited recall, consistent with management quality signals transferring best at the top of the quality distribution. c , Per-tier recall comparison across all three evaluators, showing that the management SFT captures partial cross-field signal concentrated in the upper tiers, while the base model collapses into middle-tier predictions. Supplementary Refe rences Supplementary citations use the same numbered bibliogr aphy as the main manuscript.
Original Paper
Loading high-quality paper...
Comments & Academic Discussion
Loading comments...
Leave a Comment