An approximate graph elicits detonation lattice
This study presents a novel algorithm based on graph theory for the precise segmentation and measurement of detonation cells from 3D pressure traces, termed detonation lattices, addressing the limitations of manual and primitive 2D edge detection met…
Authors: Vansh Sharma, Venkat Raman
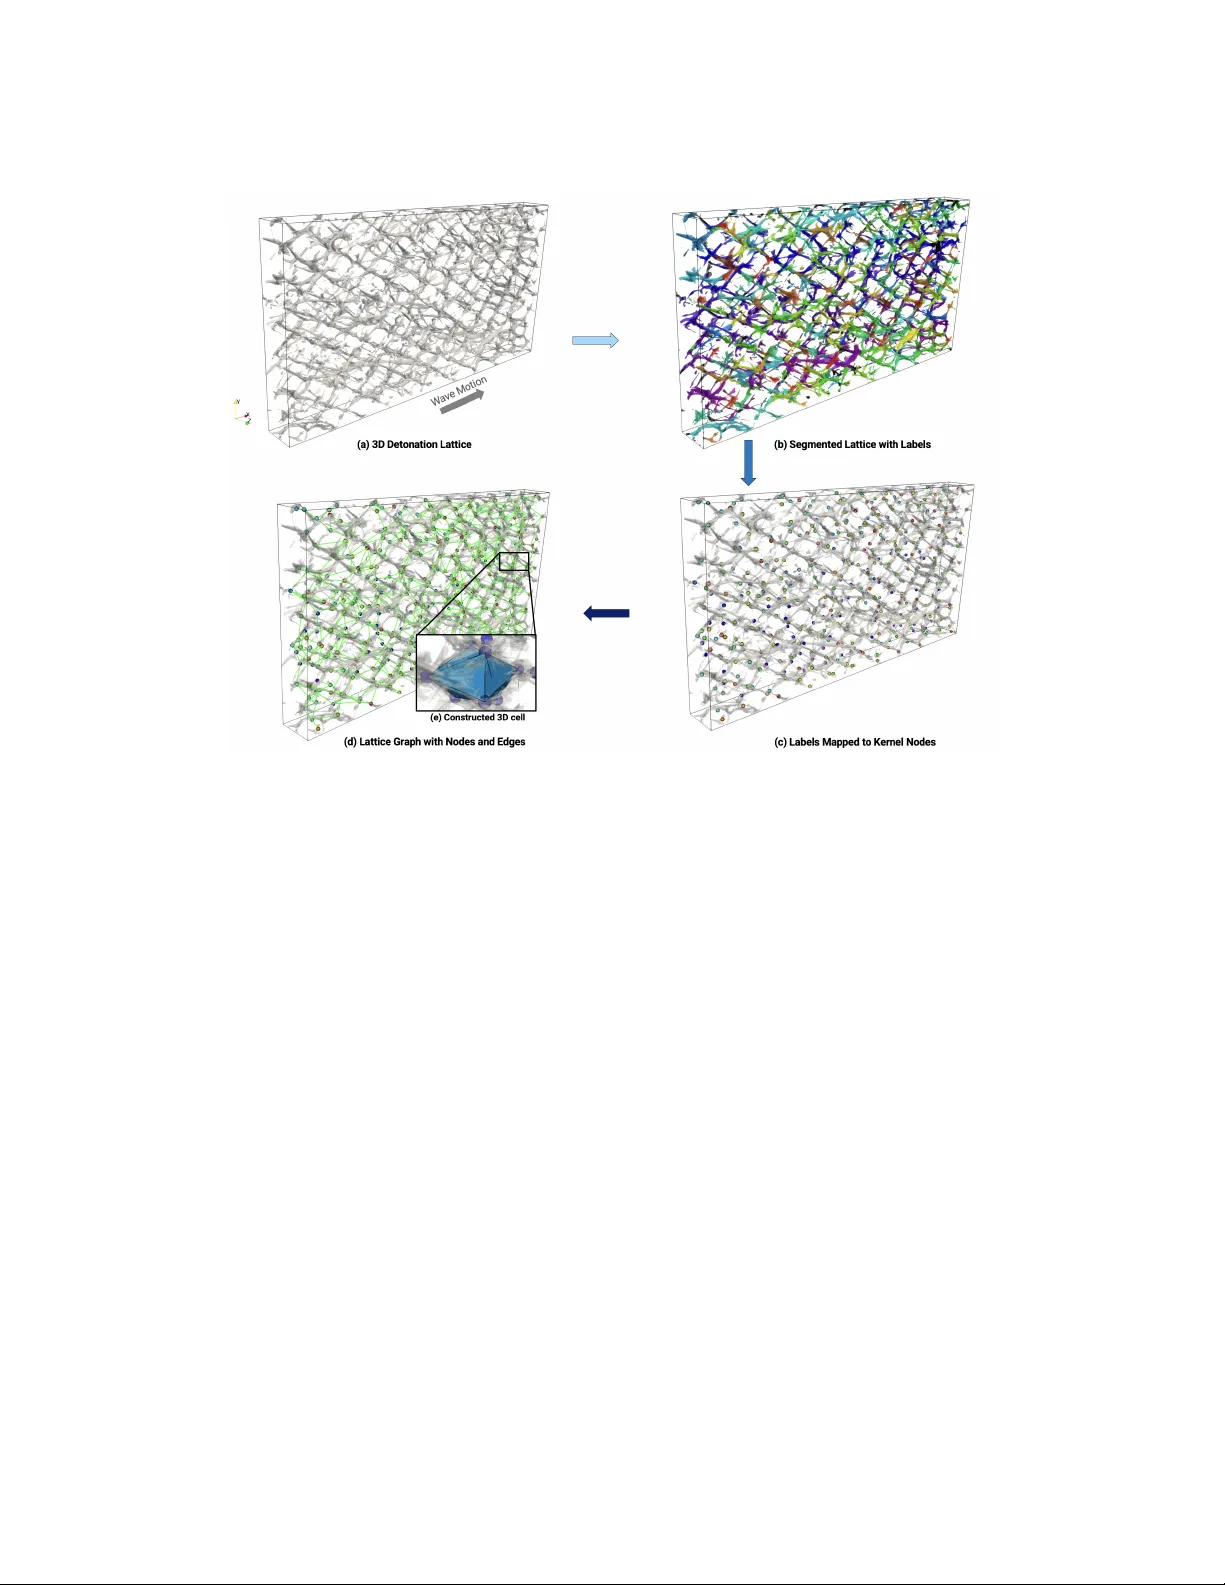
Pr eprint submitted for r evie w An appr oximate graph elicits detonation lattice V ansh Sharma a, ∗ and V enkat Raman a a Department of Aer ospace Engineering, University of Mic higan, Ann Arbor , MI 48109-2102, USA Abstract This study presents a nov el algorithm based on graph theory for the precise se gmentation and measurement of det- onation cells from 3D pressure traces, termed detonatin lattices, addressing the limitations of manual and primitive 2D edge detection methods prev alent in the field. Using a segmentation model, the proposed training-free algo- rithm is designed to accurately extract cellular patterns, a longstanding challenge in detonations research. First, the ef ficacy of segmentation on generated data is shown with a prediction error 2%. Next, 3D simulation data is used to establish performance of the graph-based workflow . The results of statistics and joint probability densities show oblong cells aligned with the wav e propagation axis with 17% deviation, whereas larger dispersion in vol- ume reflects cubic amplification of linear variability . Although the framework is robust, it remains challenging to reliably segment and quantify highly complex cellular patterns. Ho wev er , the graph-based formulation generalizes across di verse cellular geometries, positioning it as a practical tool for detonation analysis and a strong foundation for future extensions in triple-point collision studies. K eywor ds: 3D Detonation; Soot Foil; Graph; Cell Classification; Cellular Detonation; Detonation Lattice; SAM Model Novelty and significance statement Detonation cells are key features of canonical propagating wav es, and are useful for understanding cellular in- stabilities. Currently , there is very limited work on methods for estimating cell sizes, with manual counting in two-dimensions being the common approach. Existing numerical approaches typically work with 2D data, re- quire e xtensiv e manual interv ention, or rely on 2D edge heuristics that lack robustness and applicability across 3D volumetric data. This work, to the best of the authors’ knowledge, is the first to present a generalized algorithm that automatically detects, segments, and quantitati vely measures three-dimensional detonation cells using graph theory . The proposed method provides geometric structure of three-dimensional cells, vastly improving the ability to understand detonation structures. These findings will ultimately help improve practical detonation applications (rotating, pulse, oblique and standing detonation wa ve engines). *Corresponding author . 1 1. Introduction As detonation-based de vices [1] were pioneered in the early 1950s, soot foils emerged as a diagnostic tool to visualize detonation front structures, such as wa ve collision points, to study intrinsic high-speed combustion and shock phenomena. These soot-coated substrates are placed along gaseous detonation chan- nels that record triple-point tracks as the wav e prop- agates, producing a “cellular lattice” imprint of the detonation front. Despite widespread use, these tech- niques are inherently tw o-dimensional, sampling only wall-adjacent dynamics and missing the full 3D front morphology . This motivates techniques to map the soot-foil lattice patterns to a 3D volumetric represen- tation with minimal human effort. Sev eral techniques have been dev eloped to quan- tify the cellular pattern on 2D soot foils [2–6]. Shep- herd et al. [7] proposed a PSD-based cell-size estima- tor coupled with edge detection, linking pattern peri- odicity to dominant spatial frequencies via 2D Fourier analysis. Subsequent workflows and software pack- ages popularized this route but retained substantial manual tuning. Carter et al. [3] extracted directional gradients with manual input to ov erlay binary cell maps while Ng et al. [5] performed CH*-based e x- traction of soot-foil-like patterns and then measured λ (characteristic cell width) with tools derived from Shepherd et al. [8]. Siatko wski et al. [9] showed CAD-assisted line plotting on foils and later trained model on curated databases to predict λ . Neural net- work approaches hav e since expanded, using larger datasets to predict λ from image features, though seg- mentation of irregular lattices remains challenging. Although recent approaches in computer vision [6] lev erage contour-based segmentation, these methods are brittle in the presence of practical irregularities and topological defects. In contrast, our previous study [10] established a generalizable machine learn- ing (ML) framew ork based on cellular biology mod- els and validated its efficacy with rigorous bench- marks that exceed baseline techniques [6, 8]. Across these methods, the lattice pattern is treated as a 2D tessellation without any depth, while true 3D morphology is closer to practical systems. Mon- nier et al. [11] used soot-plate experiments with front- view and longitudinal recordings, showing longitu- dinal traces alone can misrepresent the full front; they proposed tessellation/V oronoi-based measures for an average cell width but note irreducible count- ing uncertainty and the reduction of 3D structure to 2D imprints. Later , Monnier et al. [12] used a graph-theoretic framework that infers a pseudo-3D cell width from 2D front-view detonation patterns, linking polygonal lattices to a volumetric scale with- out directly measuring the lattice itself. Borisov & Kudrya vtsev [13] characterized 3D detonation cells using high-fidelity numerical simulations guided by linear instability theory: predicted transverse wa ve- lengths were compared with simulation fields, cell ev olution was quantified via Fourier analysis of trans- verse v elocity , and triple-point paths were visualized using maximum-pressure isosurfaces (“spatial smoke foils”). Their main limitations were ackno wledged resolution constraints for early/small cells and sim- plified chemistry . Although high-fidelity simulations can generate 3D volumetric cellular fields [14–18], to our knowledge, there is no direct procedure that re- constructs or measures a 3D structure directly from detonation lattice data. The focus of this work is to bridge this gap by dev eloping an algorithm that (i) robustly segments 3D lattice patterns, (ii) quan- tify anisotropy/regularity beyond λ , and (iii) is consis- tent with physics-based constraints. The algorithm is a generalizable, minimally supervised approach that captures 3D lattices from volumetric data. The fol- lowing sections detail the algorithm for graph con- struction ( § 2.2) followed by results of the lattice case ( § 3.1) and a 3D numerical detonation lattice ( § 3.2). 2. Methodology Graph representations provide mathematically rig- orous encoding of interaction topology in natural sys- tems, enabling statistically robust inference and anal- ysis [19]. A graph provides a physically meaning- ful surrogate for the underlying 3D detonation lat- tice: nodes correspond to triple point collision ker- nels, while edges represent the intervening segments (Mach stems and incident shocks) oriented along wa ve motion (see Fig. 1). This abstraction preserves the essential topology—adjacency , branching, and cy- cles—that gov erns cell formation, irrespectiv e of ge- ometric distortions in any particular vie w . A graph built from these elements concisely should encode the 3D organization of the front: local motifs (Y - junctions, loops) assemble into a global lattice whose statistics (degree, c ycle length, path structure) map to cell size, anisotropy , and interaction frequency . 2.1. V olumetric data se gmentation Building on our prior work [10], we implement a slice-wise volumetric segmentation workflo w: the 3D field is decomposed into an ordered stack of 2D slices, each under goes tar geted preprocessing (de- noising, contrast normalization, structure-enhancing filters) to suppress noise and amplify interfaces, and the preprocessed sequence, preserving slice order , is passed to a Segment-anything–style (SAM) model for inference [20, 21]. SAM-based foundation mod- els provide strong, reusable visual representations for segmentation across diverse image distributions [20, 22]. Cellpose-SAM repurposes the pretrained SAM image encoder b ut replaces sequential mask de- coding with Cellpose’ s dense flow-field formulation, enabling efficient instance se gmentation and straight- forward extension to 3D by av eraging predictions across XY/ZY/YZ slices before performing 3D mask dynamics [21]. While this architecture is attractive for automated cell-pattern extraction, at the same time, for strictly 2D detonation-cell post-processing 2 Fig. 1: Relating graph message passing to cellular detonation structure: (a) Directed message-passing graph: node features h i exchange edge ( e ij ) messages m ij , (b) Cellular detonation interpreted as a graph: triple points and collision kernels serve as nodes connected along Mach stems and incident shocks; wav e motion induces directional interactions and (c) 2D detonation lattice as a graph, with collisions points as nodes and wave path as edges, illustrating how collisions localize within the netw ork. (e.g., soot-plate or planar visualizations), deploying a large foundation model can be unnecessary ov er- head; models such as “cyto3” pipelines [10] may be sufficient when the goal is a single cell-size met- ric rather than general-purpose segmentation. Also noted in [21], direct comparison between Cellpose3 (cyto3) and CellSAM on datasets both were trained on, “cyto3 performs better on every dataset” . Thus, careful consideration is required before deploying such models: for 2D soot-foil analysis, lighter non- SAM pipelines are often suf ficient and preferable due to their smaller memory footprint. In contrast, for v ol- umetric segmentation tasks, SAM-based approaches can offer improved robustness and accuracy relativ e to the CNN-based models [10, 21]. Follo wing initial analysis, SAM-based design en- ables flexible, multi-resolution operation across vol- umes of varying size and voxel aspect ratio while preserving fidelity to the underlying 3D morphology . The model returns a set of masks that uniquely la- bel each cell, assigning a distinct integer ID to ev- ery voxel within each node (and across nodes when aggregated). The uniquely marked cluster is approx- imated by its centroid, i.e., the coordinate-wise av- erage of the distance-transform–weighted center and the largest-inscribed-sphere (LIS) center [23]. This choice is critical because it mitigates bias from thin protrusions and irregular boundaries while preserving the true interior of the cell cluster . 2.2. Graph construction From § 2.1, giv en labeled 3D centroids C ∈ R N × 3 with integer instance labels L (using SAM model and LIS centers), a sparse undirected graph is con- structed by proposing edges only forwar d along a user-chosen axial direction D ∈ {± X , ± Y , ± Z } (typically aligned with the wa ve propagation), fol- lowed by local pruning and degree capping. The de- tailed pseudo-code is presented in Algorithm 1. Each centroid is discretized into rectilinear bin coordi- nates ( I , J, K ) using user -defined grids ( u x , u y , u z ) , and the direction D induces an axial index A ∈ { I , J, K } , lateral indices ( U, V ) , and a sign sgn ∈ { +1 , − 1 } . Nodes are processed in lexicographic order consis- tent with sgn ; an optional reverse pass is included to reduce ordering bias. For a root node i , a candidate node j is considered only if it satisfies: (i) strict ax- ial advance sgn ( A j − A i ) > 0 ; (ii) bounded axial span | A j − A i | ≤ A max ; and (iii) bounded lateral offset | U j − U i | + | V j − V i | ≤ R side . Remaining candidates are ranked by increasing axial separation and then lateral distance (with axial separation taken as either | A j − A i | in bin units or ( C j − C i ) · ˆ d in continuous units, depending on implementation), and the top K candidates are retained. Edges are greedily accepted from the ranked short- list subject to a per-node de gree cap deg max and du- plicate suppression (undirected edges are stored as (min( i, j ) , max( i, j )) ). T wo optional geometric tests further filter edges: (a) a pr oximity test ( C L U S T E R ) that requires each endpoint centroid to lie within a threshold τ of voxels belonging to the other end- point’ s label, implemented with per-label KD-trees; and (b) an occupancy test ( B E T W E E N ) that samples points along the se gment ( C i , C j ) at a step size pro- portional to the minimum grid spacing and requires a minimum hit fraction ϕ min of sampled locations to fall within a voxel radius r vox of any labeled vox el. In terms of physics, these constraints ensure that a wave must have trav ersed along/in the vicinity of the con- necting path between nodes, ensuring that the edge is part of the original detonation lattice structure and suppress spurious long-range connections. Figure 2 illustrates the occupancy test: from a giv en root cen- troid, a Euclidean neighborhood search identifies the top beam-search candidates ( C 1 to C 4 ) in the forward direction. Proposed edges are then screened with an occupancy (between-voxels) constraint that checks whether the segment lies within labeled structure along its path. Candidates that satisfy this physical- consistency test are retained (green), while spuri- ous connections lacking supporting occupancy are re- jected (red). With the top- K shortlist and the degree 3 cap, the resulting graph has O ( N ) edges, while KD- tree queries keep the optional test costs sublinear in the number of labeled vox els. Fig. 2: Search in Euclidean space: a root node proposes its top four beam-search candidates; after applying occupancy constraints, only the green-marked (physically consistent) candidates are accepted, while the red-marked is rejected. 3. Results and Discussion The first-subsection discusses results for a manu- factured problem and the latter subsection measures and approximates a 3D detonation lattice using the said graph algorithm. 3.1. Generated lattice T o assess volumetric se gmentation and detection efficac y , a synthetic 3D dataset with a fix ed geometric arrangement of tightly packed, ellipsoid-like volumes was constructed (Fig. 3). The objects are arranged on a regular lattice with minimal inter-object spacing to induce frequent contacts and occlusions, thereby increasing segmentation difficulty . Experiments vary only the input sampling to the model, the “cell count” per axis of the volumetric grid ( n x ), while keeping the underlying geometry unchanged (base geometry defined at n x =240). Input resolutions range from 60 to 480 vox els per axis (Fig. 3), providing a controlled progression from coarse to refined sampling to quan- tify how much structure is recoverable as discretiza- tion improv es. T able 1: Effect of cell count ( n x ) on prediction error (%) (top row), the size of the lattice file (middle row) and number of masks generated by the model (bottom row). 060 120 240 480 14.23 ± 2.37 14.62 ± 1.31 02.38 ± 0.19 00.73 ± 0.49 0.66 MB 5.20 MB 41.50 MB 331.90 MB 60 60 60 1101 From T able 1, prediction error remains high at coarse samplings (14.23% at 60; 14.62% at 120, see Algorithm 1 Lattice Graph Construction Require: C ∈ R N × 3 , L ; grids u x , u y , u z ; axis, A max , R side , K , deg max ; optional gates: C L U S T E R ( τ ) , B E T W E E N ( s vox , r vox , ϕ min ) 1: Map axis → ( ax , sgn , u, v ) ; bin: I = bin ( C x , u x ) , J = bin ( C y , u y ) , K = bin ( C z , u z ) ; A = [ I , J, K ] ax , U = [ I , J, K ] u , V = [ I , J, K ] v 2: O fwd ← lexicographic order for sgn ; O ← [ O fwd ] (optionally add re verse); init deg = 0 , E = ∅ , S = ∅ ; prebuild KD-trees if gates enabled; set s, r from s vox , r vox 3: for O ∈ O do 4: for i ∈ O do 5: if deg[ i ] = deg max then continue 6: end if 7: C ← ∅ ; 8: for j = 1 ..N , j = i do 9: dA = A [ j ] − A [ i ] ; 10: if sgn dA ≤ 0 or | dA | > A max or | U [ j ] − U [ i ] | + | V [ j ] − V [ i ] | > R side then continue 11: end if 12: Push ( j, ∆ ax ( i, j ) , lat ( i, j )) to C 13: end for 14: Sort C by (∆ ax ↑ , lat ↑ ) ; keep first K 15: for ( j, · , · ) ∈ C do 16: if deg[ i ] = de g max or deg[ j ] = deg max then continue 17: end if 18: e = (min( i, j ) , max( i, j )) ; 19: if e ∈ S then continue 20: end if 21: if C L U S T E R on then reject if min { d (KD L [ j ] , C [ i ]) , d (KD L [ i ] , C [ j ]) } > τ 22: end if 23: if B E T W E E N on then let ϕ = H I T F R AC ( C [ i ] , C [ j ]; KD ∪ , s, r ) ; 24: if ϕ < ϕ min then continue 25: end if 26: end if 27: Append ( i, j, ∥ C [ j ] − C [ i ] ∥ 2 ) to E ; insert e into S ; deg [ i ] + = 1 ; deg[ j ] + = 1 28: end for 29: end for 30: end for 31: retur n E , deg Fig. 3(a)), then drops sharply near the nati ve geomet- 4 Fig. 3: Plot for 3-D generated lattice segmented by the model: (a) n x =60 and (b) n x =480. Red box shows mask fragmentation due to over -segmentation in n x =480 case. ric scale (2.38% at 240) and reaches its lowest value at 480 (0.73%). File size grows approximately cubically with resolution—0.66 MB to 331.90 MB—reflecting the volumetric scaling law . Notably , mask prolifera- tion is negligible until 480 cells per axis (60 masks at 60 to 240 versus 1101 at 480), indicating over - segmentation emer ges only at the finest input sam- pling. Overall, sampling near the base geometry ( n x =240) captures structure accurately with modest storage, while 480 offers marginal error gains at sub- stantially higher storage and a risk of excessi ve mask fragmentation (see Fig. 3(b)). 3.2. 3D Detonation simulation based reconstruction The algorithm is ev aluated on 3D lattice fields gen- erated from a gaseous detonation simulation of a sto- ichiometric ethylene–air mixture at a pre-detonation temperature of 500 K and pressure of 1 atm. The one- dimensional induction length for this mixture is l ind = 516 µ m. The finest grid spacing is 9.766 µ m, which yields about 52 cells per induction length. This reso- lution is sufficient to resolve the cellular detonation structure, including triple points, Mach stems, and collision zones, ensuring a suf ficiently reliable rep- resentation of the underlying physics. Additional de- tails are discussed in [24]. Follo wing the workflow in Fig. 6, the detonation lattice is first extracted by tracking the maximum pressure observed by each cell in the numerical do- main (plot (a)). This data is stored as a point-based structured grid which is then sliced along the trans- verse direction for the se gmentation model to process. The output of the SAM model assigns a unique ID to a cluster of cells as discussed in § 3.1 (plot (b)). T o construct the graph, each cell cluster is mapped to a unique point that is both interior and boundary- aware (plot (c)). This step is essential as it determines the collision sites in the lattice that define the shape’ s boundary points. The edges are subsequently con- structed between these nodes (plot (d)) using the al- gorithm in § 2.2 to obtain the 3D cell (plot(e)). All physical quantities are reported in the mesh’ s nativ e coordinate units; no unit con version was applied. The measurements are computed directly from the geome- try of the closed surface (v ertex positions and triangu- lated faces), not from a voxel/grid discretization, i.e., no vox els are used. Fig. 4 shows the one-dimensional distrib utions (from 25 samples) of the lengths of the major and minor axes (mesh units) in plots (a), (b) and (b): the teal curve is a k ernel density estimate (KDE) (normal- ized with peak v alue); all features appear unimodal. The cell geometry is systematically elongated in the X-axis with moderate variability in length scales but substantial variability in v olume. The distribution of the major axis (L x ) centers near 0.00839 (median), with a slightly larger mean (0.00851) and a fairly nar- row spread in the middle. The negati ve skew is evi- dent with a longer left tail: few smaller samples de- viate trend to the low-end. Howe ver , most samples lie in a narro w band around 0.008–0.009. In con- trast, minor axis (L y ) distribution is more concen- trated around its center (median = 0.00403) and only slightly right-ske wed: the mean (0.00403) essentially matches the median, with a few modestly larger v al- ues. A similar trend follo ws for L z distributions with a median around 0.005 slightly larger than the mean ≃ 0.0048. T able 2 reports dif ferent statical measures (from Fig. 4) for cell lengths ( L ) along each axis and the geometric v olume of the 3D cell. The coef ficients of v ariation ( σ / µ ) are modest for lengths, approx. 15- 17% across the three L s. In contrast, volume is highly dispersed, indicating a typical pattern when small dif- ferences in linear size propagate cubically into v ol- ume. F or all three lengths, M > µ , suggesting a slight right-skew (few lar ger values). V olume shows the opposite trend, indicating a left-skewed distribu- tion, consistent with multiplicativ e variation in size. T able 2: Summary statistics: the mean ( µ ), standard devia- tion ( σ ), and median ( M ) of the extents L x , L y , L z and V (volume) for 25 samples in nati ve units of the mesh. Measure L x L y L z V µ 8.36e-3 5.30e-3 4.82e-3 2.11e-7 σ 12.82e-4 7.88e-4 8.09e-4 2.36e-7 M 8.55e-3 5.33e-3 5.01e-3 1.33e-7 Figure 5 shows the joint distribution of volume 5 Fig. 4: Plot of geometric features from 25 samples: (a) major-axis length, (b) minor-axis length, each shown as a KDE (normalized) with stick marks indicating individual samples (blue) and an inline boxplot (median = red line, mean = green dashed line, whiskers 5 th –95 th percentiles); (c) joint density of volume and aspect ratio (major/minor axis) with overlaid points (normalized density color scale). (log-scale) with dif ferent aspect ratios (AR), where contours represent normalized density and orange dots are the samples. Plots (a) and (b) show that most shapes cluster at intermediate volumes with moderate aspect ratios (1.6 to 2.2), with lighter contours (and scattered points) extending tow ard larger volumes and higher aspect ratios. This observ ation is consistent with the elongation of X-axis over Y and Z. The plot (c) for AR 3 is clustered close to 1.0–1.2, implying Y and Z extents are comparatively similar , as observed by Oladipo et al. [24]. Across all three, the contours are broadly ellipsoidal with only a slight tilt, suggest- ing at most a weak dependence of aspect ratio on vol- ume: larger volumes do not strongly skew the AR, though the highest densities sit at intermediate v ol- umes and moderate anisotropy . 4. Conclusion Fig. 5: Plot of joint density of volume and aspect ratio (AR) from 25 samples with overlaid points (normalized den- sity color scale): (a) AR 1 = L x / L y , (b) AR 2 = L x / L z and (c) AR 3 = L y / L z . A graph-based framew ork using SAM-model was developed to analyze and quantify the three- dimensional morphology of detonation cells. Ev al- uated with controlled lattice test cases that mimic detonation-cell volumes, the model predicts cell v ol- ume within 2% error , supporting the reliability of the end-to-end pipeline. The frame work w as then applied to 3D numerical data to e xtract statistical measures for axial length scales ( L x , L y , L z ) , cell volume V , and their joint distributions. The resulting length dis- tributions are unimodal and indicate systematically elongated cells along the x -direction, with modest variability in the linear extents (coef ficients of varia- tion ≈ 15 – 17% ). In contrast, V exhibits substantially larger dispersion, consistent with cubic amplification of small variations in length. Joint PDFs of V and aspect ratios show clustering at intermediate volumes with moderate anisotrop y ( AR ≈ 1 . 6 – 2 . 2 ) and weak coupling between aspect ratio and volume, while the 6 Fig. 6: Overall workflow of the se gmentation and graph construction procedures on a 3D numerical detonation lattice. extents of y – z remain comparatively similar . Overall, the method provides robust, physically interpretable 3D cell statistics suitable for subsequent studies of confined triple-point interactions and the gro wth of cellular instabilities. CRediT authorship contribution statement VS : designed research, developed software, per- formed research, analyzed data, wrote—original draft, revie w and editing. VR : designed research, de- veloped software, analyzed data, wrote—revie w and editing, project administration, funding acquisition. Declaration of competing interest The authors declare that they hav e no known com- peting financial interests or personal relationships that could ha ve appeared to influence the work reported in this paper . Acknowledgments The authors acknowledge support from Air Force Office of Scientific Research (AFOSR) under Grant No. F A9550-24-1-0017, with Dr . Chiping Li as Pro- gram Officer . The authors thank Abiola Oladipo for providing 3D detonation data. 7 References [1] J. A. Nicholls, H. W ilkinson, R. B. Morrison, Inter- mittent detonation as a thrust-producing mechanism, Journal of jet propulsion 27 (5) (1957) 534–541. [2] A. P . Nair , A. R. Keller , N. Q. Minesi, D. I. Pineda, R. M. Spearrin, Detonation cell size of liquid hyper- golic propellants: Estimation from a non-premixed combustor , Proceedings of the Combustion Institute 39 (3) (2023) 2757–2765. [3] M. Carter , D. L. Blunck, Direct comparison of schlieren and soot foil measurements of detonation cell sizes, Frontiers in Aerospace Engineering 1 (2022) 892330. [4] J. Shepherd, I. Moen, S. Murray , P . Thibault, Analyses of the cellular structure of detonations, in: Symposium (International) on Combustion, V ol. 21, Else vier, 1988, pp. 1649–1658. [5] B. M. Ng, E. N. Hoffman, D. I. Pineda, C. S. Combs, Detonation cell size estimation via chemiluminescence imaging in an optically accessible linear detonation tube, Experiments in Fluids 65 (7) (2024) 108. [6] D. Jalontzki, A. Zussman, S. Pendurkar, G. Sharon, Y . Kozak, A computer vision approach for analysis of detonation cellular structures, Applications in Energy and Combustion Science (2025) 100340. [7] J. E. Shepherd, Detonation in gases, Proceedings of the Combustion Institute 32 (1) (2009) 83–98. [8] J. Lee, D. Garinis, D. Frost, J. Lee, R. Knystautas, T wo-dimensional autocorrelation function analysis of smoked foil patterns, Shock W aves 5 (1995) 169–174. [9] S. Siatko wski, K. W acko, J. Kindracki, Predicting det- onation cell size of biogas–oxygen mixtures using ma- chine learning models, Shock W aves (2024) 1–9. [10] V . Sharma, M. Ullman, V . Raman, A machine learn- ing based approach for statistical analysis of detona- tion cells from soot foils, Combustion and Flame 274 (2025) 114026. [11] V . Monnier, V . Rodriguez, P . V idal, R. Zitoun, An analysis of three-dimensional patterns of e xperimental detonation cells, Combustion and Flame 245 (2022) 112310. [12] V . Monnier , P . Vidal, V . Rodriguez, R. Zitoun, From graph theory and geometric probabilities to a repre- sentativ e width for three-dimensional detonation cells, Combustion and Flame 256 (2023) 112996. [13] S. Borisov , A. Kudryavtse v , In vestigation of cellular detonation structure formation via linear stability the- ory and 2d and 3d numerical simulations, in: AIP Con- ference Proceedings, V ol. 1893, AIP Publishing LLC, 2017, p. 030042. [14] D. N. W illiams, L. Bauwens, E. S. Oran, Detailed structure and propagation of three-dimensional deto- nations, in: Symposium (International) on Combus- tion, V ol. 26, Else vier, 1996, pp. 2991–2998. [15] J. Crane, J. T . Lipkowicz, X. Shi, I. Wlokas, A. M. Kempf, H. W ang, Three-dimensional detonation struc- ture and its response to confinement, Proceedings of the combustion institute 39 (3) (2023) 2915–2923. [16] K. Iwata, S. Suzuki, R. Kai, R. K urose, Direct nu- merical simulation of detonation–turbulence interac- tion in hydrogen/oxygen/argon mixtures with a de- tailed chemistry , Physics of Fluids 35 (4) (2023). [17] N. Tsuboi, S. Katoh, A. K. Hayashi, Three- dimensional numerical simulation for hydrogen/air detonation: Rectangular and diagonal structures, Pro- ceedings of the Combustion Institute 29 (2) (2002) 2783–2788. [18] S. Abisleiman, V . Sharma, R. Bielawski, V . Raman, Structure of three-dimensional conical oblique det- onation wa ves, Combustion and Flame 274 (2025) 113971. [19] A. Sanchez-Gonzalez, J. Godwin, T . Pfaf f, R. Y ing, J. Leskov ec, P . Battaglia, Learning to simulate com- plex physics with graph networks, in: International conference on machine learning, PMLR, 2020, pp. 8459–8468. [20] A. Kirillo v , E. Mintun, N. Ravi, H. Mao, C. Rolland, L. Gustafson, T . Xiao, S. Whitehead, A. C. Berg, W .- Y . Lo, et al., Segment an ything, in: Proceedings of the IEEE/CVF international conference on computer vi- sion, 2023, pp. 4015–4026. [21] M. Pachitariu, M. Rariden, C. Stringer, Cellpose-sam: superhuman generalization for cellular segmentation, bioRxiv (2025) 2025–04. [22] N. Ravi, V . Gabeur, Y .-T . Hu, R. Hu, C. Ryali, T . Ma, H. Khedr , R. R ¨ adle, C. Rolland, L. Gustafson, et al., Sam 2: Segment anything in images and videos, arXiv preprint arXiv:2408.00714 (2024). [23] H. S. M. Coxeter , Regular polytopes, Courier Corpo- ration, 1973. [24] A. Oladipo, S. S. Abisleiman, V . Sharma, J. Singh, V . Raman, S. Dwivedi, T . Hedman, Three observ ations on cell formation in confined detonations, Manuscript under revie w (2025).
Original Paper
Loading high-quality paper...
Comments & Academic Discussion
Loading comments...
Leave a Comment