Mapping Austria's Natural Gas and Hydrogen Infrastructure Plans
This paper presents a comprehensive, spatially disaggregated dataset of Austria's natural gas and hydrogen infrastructure towards 2040. The dataset covers the complete gas transmission and distribution networks down to the medium-pressure level and i…
Authors: Marco Quantschnig, Yannick Werner, Thomas Klatzer
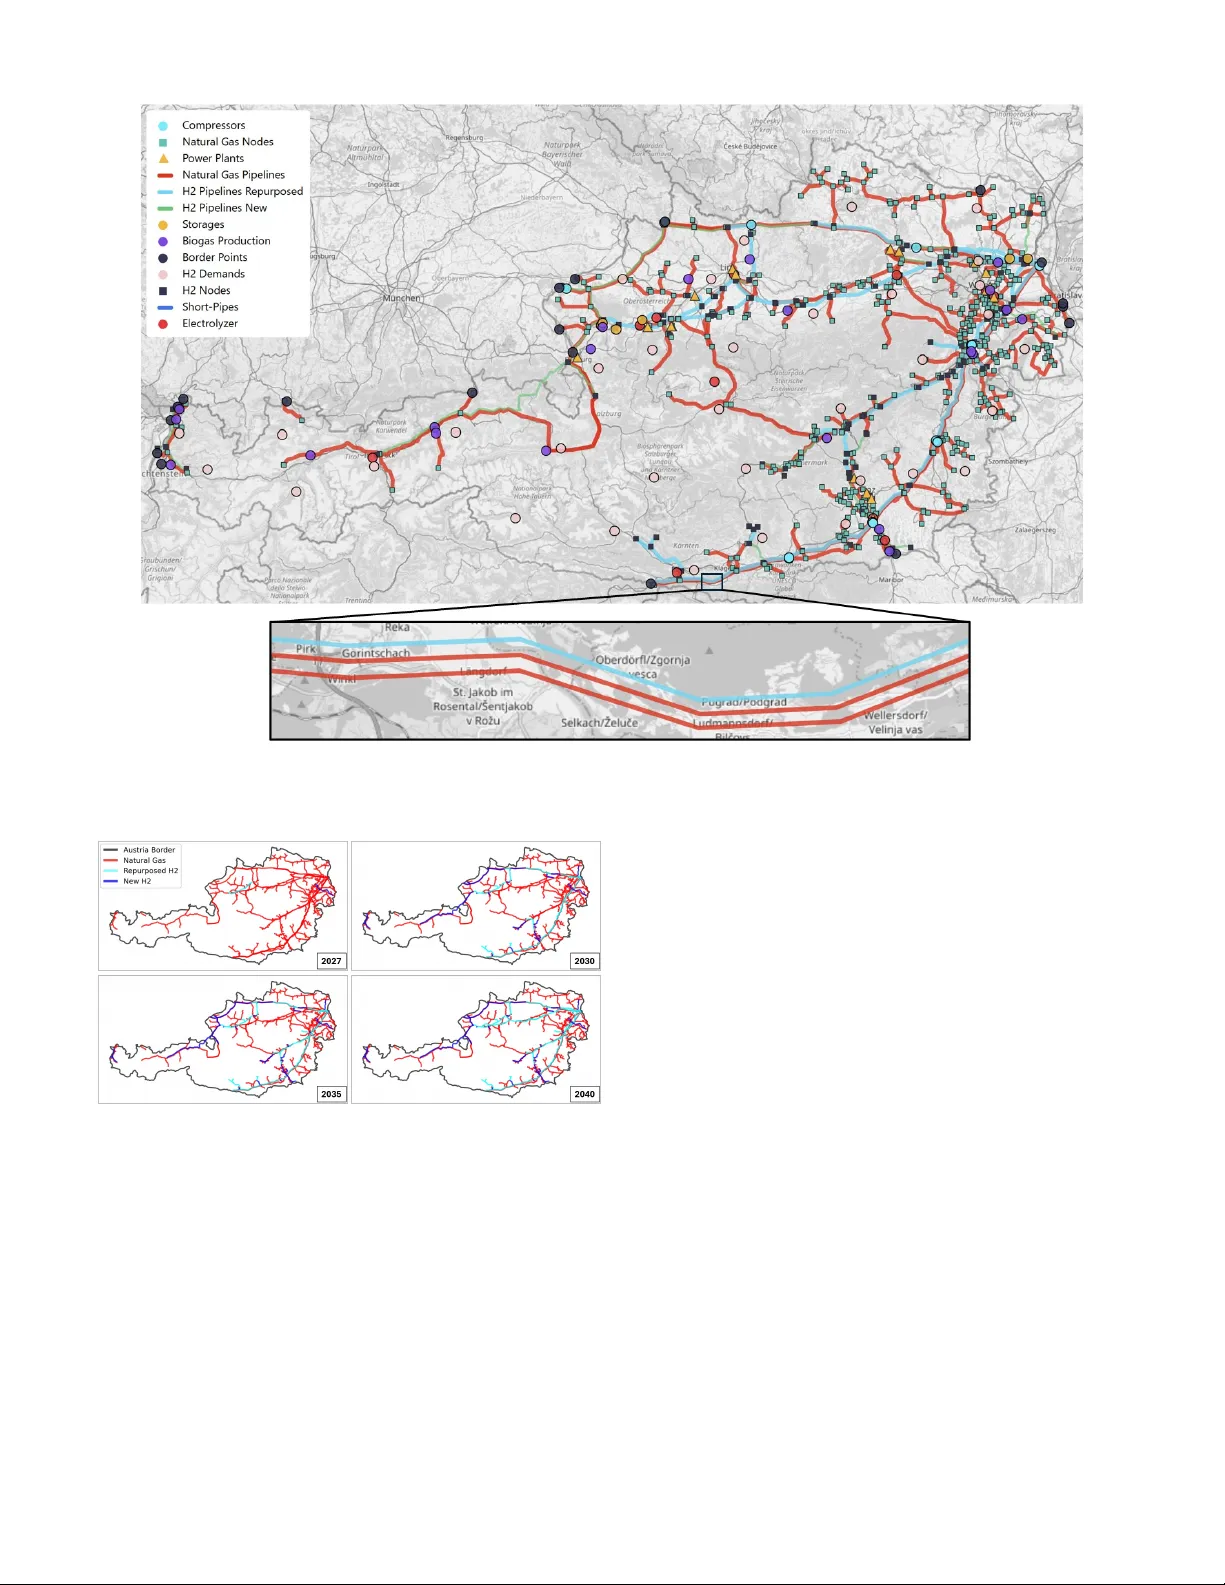
Mapping Austria’ s Natural Gas and Hydrogen Infrastructure Plans Marco Quantschnig, Y annick W erner , Thomas Klatzer and Sonja W ogrin Institute of Electricity Economics and Energy Inno vation Research Center for Energy Economics and Ener gy Analytics Graz Univ ersity of T echnology Graz, Austria { marco.quantschnig, yannick.werner , thomas.klatzer , wogrin } @tugraz.at Abstract —This paper pr esents a comprehensi ve, spatially dis- aggregated dataset of A ustria’s natural gas and hydrogen in- frastructure towards 2040. The dataset covers the complete gas transmission and distribution networks down to the medium- pressur e level and integrates hydrogen expansion plans from the A ustrian Gas Grid Management. T ransmission infrastruc- ture is reconstructed from ENTSOG maps, con verted into a topologically consistent graph repr esentation, and enriched with technical attributes through automated spatial matching with open-source datasets such as OpenStreetMap and Global Energy Monitor . Distribution networks and infrastructure modifications are implemented using QGas, a newly de veloped GIS-based tool for graph-based infrastructure manipulation. T o enable forward-looking energy system analyses, the dataset explicitly repr esents the stage-wise transition from natural gas to hydro- gen infrastructure within one single dataset. Repurposed and newly constructed hydrogen pipelines are integrated within a unified netw ork topology using node-splitting and time-dependent connector elements, enabling consistent modeling of parallel natural gas and hydrogen operation ov er time. The resulting dataset provides a detailed repr esentation of A ustria’s gas and hydr ogen infrastructure, including 586 natural gas pipeline segments (5,000 km), 113 repurposed segments (1,250 km), and 39 newly constructed hydrogen segments (820 km), connecting 720 nodes. Moreover , it includes a comprehensive set of gas demands, biogas production facilities, storage units, electrolyzers, and compr essor elements, making it dir ectly applicable f or energy system optimization models. Index T erms —hydrogen infrastructure transition, gas network topology , open infrastructure dataset, energy system optimization I . I N T RO D U C T I O N Achieving climate neutrality requires a fundamental trans- formation of energy systems, in which large-scale electrifica- tion will be complemented by renewable gases to decarbonize hard-to-abate processes and provide long-duration energy stor- age [1]. Energy system optimization models (ESOMs) are widely used tools to support the planning and decision-making processes associated with this transformation. T o this end, ESOMs require spatially resolved representations of energy infrastructures, and in particular network topologies, as this is decisi ve for the v alidity of model results at national and regional scales [2], [3]. This is highlighted in recent integrated power and hydrogen system optimization studies [4], [5], which sho w that model outcomes and in vestment decisions, e.g., regarding the repurposing of natural gas pipelines for hydrogen transmission and the expansion of new hydrogen pipelines, are highly sensitive to the spatial detail of gas network representations. While publicly accessible information on gas network in- frastructure exists, it is typically not provided in a form suitable for direct use in ESOMs. Data is often av ailable in het- erogeneous formats and at v arying lev els of detail, which limits their applicability . For example, ENTSOG publishes PDF- based infrastructure maps [6] that illustrate pipeline routes and major facilities but are not directly usable for quantitative analyses. T o address these limitations, open datasets such as SciGRID gas [7] con vert these maps into topologically consistent representations of the European gas infrastructure. Howe ver , this dataset is primarily designed for case studies at the European scale and therefore lacks the spatial resolu- tion and adaptability needed for detailed national or regional analyses. For Austrian case studies, these limitations are particularly consequential. The Austrian gas network features a dense distribution system and multiple parallel pipeline loops [8], [9], which are critical for sequential repurposing strategies to maintain natural gas supply during the transition. National expansion plans published by the Austrian Gas Grid Man- agement (AGGM) reflect this approach [10], [11]. Existing Austrian datasets, such as Zwickl-Bernhard et al. [2], [12], do not represent parallel pipelines as separate loops (e.g., the Trans Austria Gasleitung), which limits their applicability for hydrogen system optimization studies. T o the best of our knowledge, no open-source dataset currently exists that provides the gas infrastructure representation to integrate and analyze Austria’ s hydrogen expansion plans in a highly spa- tially resolved and temporally consistent graph format suitable for ESOMs. T o address this gap, this paper presents an open-source dataset of Austria’ s natural gas and hydrogen infrastructure intended to support quantitativ e energy system analyses. The dataset provides a consistent representation of gas infrastruc- ture and its potential e volution over time, enabling long-term and long-horizon case studies of energy system transformation. Specifically , the dataset presented in this paper makes three key contributions: 1) It provides an open-source and highly detailed representa- tion of Austria’ s natural gas and hydrogen infrastructure, ready to be used in ESOMs. The dataset features a fully resolved network topology that explicitly represents indi- vidual pipeline strands and distribution networks do wn to the medium-pressure lev el. 2) It provides a geo-referenced representation based on stan- dardized geodata elements (GeoJSON), enabling straight- forward modification, extension, and adaptation of the dataset for the analysis of alternativ e expansion plans and div erse case studies. This flexibility is further enhanced by the forthcoming open-source release of the QGas tool [13], which allows users to ef ficiently manipulate and extend the network topology within a GIS-based environment. 3) It provides a time-dependent network representation that enables a staged transition from natural gas to hydrogen infrastructure within a single unified dataset, allowing con- sistent long-term energy system analyses without relying on separate snapshot representations. The remainder of this paper is structured as follo ws. Sec- tion II introduces the general methodology and workflo w for constructing and modifying the gas infrastructure dataset. Section III then describes the construction of the status- quo natural gas network topology and the assignment of technical parameters. Building on this topology , Section IV details the integration of Austria’ s hydrogen expansion plans, including a time-dependent repurposing and network transition mechanism, resulting in a coherent, integrated natural gas and hydrogen infrastructure dataset. Finally , Section V validates the dataset and concludes the paper . I I . M E T H O D O L O G Y A N D W O R K FL O W The process for creating the integrated natural gas and hy- drogen infrastructure dataset follows the structured workflo w illustrated in Fig. 1. First, Austria’ s natural gas transmission network was re- constructed from publicly av ailable infrastructure information. The av ailable data were processed and harmonized to obtain a consistent representation of the transmission network suitable for quantitativ e energy system analyses. This step establishes the structural basis for subsequent attribute assignment, net- work extension, and integration of additional infrastructure layers. Second, the transmission network was enriched with tech- nical attributes by spatially matching it with open-source datasets. This step enables a reproducible assignment of pipeline characteristics (e.g., name, diameter , pressure) and supports future dataset updates as underlying data sources ev olve. The detailed attribute matching procedure is described in Section III. Third, distribution-le vel infrastructure was added to increase spatial resolution. High- and medium-pressure distrib ution pipelines were integrated based on publicly av ailable Austrian infrastructure information using a GIS-based workflow . Due to limited public data availability at the distribution lev el, consistent approximations were applied. Section III details the integration and parameterization of distribution networks. Finally , Austria’ s hydrogen infrastructure expansion plans outlined in the Hydrogen Roadmap [10] were incorporated in the network topology while explicitly accounting for the time- dependent network ev olution and separation of emerging hy- drogen and natural gas systems. The detailed implementation of hydrogen infrastructure, including the temporal transition mechanism, is described in Section IV. GIS-based infrastructure integration and data modifications were carried out using the nov el QGas tool [13], which is employed for the visualizations in the following sections. I I I . G E N E R A T I O N O F T H E S T A T U S - Q U O G A S I N F R A S T RU C T U R E D A TA S E T The status-quo gas infrastructure dataset was created through a multi-step process relying exclusiv ely on publicly av ailable data sources. Austria’ s natural gas transmission network was derived from the ENTSOG Transparenc y Plat- form [6], which provides infrastructure information in the form of static PDF maps illustrating pipeline routes, border points, and major facilities. These maps were first georeferenced to establish spatial consistency . Pipeline routes were subsequently manually digitized and con verted into a graph-based network topology consisting of nodes and edges. This procedure ensured topological consis- tency and provided a basis for subsequent network extensions and modifications. The resulting transmission network topol- ogy was then enriched with technical attributes. Pipeline diameters, operating pressure ranges, and addi- tional technical parameters were assigned by geographically matching the topology with open-source datasets from Open- StreetMap [14] and the Global Energy Monitor [15]. The auto- mated matching procedure uses buf fer -based spatial proximity by identifying corresponding infrastructure elements based on the maximum ov erlap length between the pipeline geometry and candidate pipelines within predefined buffer zones [13]. T o verify the accuracy of the automated matching, the as- signed attributes were manually re viewed and validated using additional publicly available sources where necessary [8], [9]. Importantly , the matching workflow enables automated re- assignment of attributes using updated versions of the under- lying open-source datasets, facilitating regular dataset updates and supporting future extensions to larger geographic scopes. T o further increase spatial resolution, distrib ution networks were added. Distrib ution Lev el 1 (high-pressure) and Level 2 (medium-pressure) pipelines were integrated based on the Austrian Infrastructure Plan published by AGGM [16] by digitizing pipeline elements. A dedicated workflo w was used to support network modification and extension. This work- flow was implemented in the QGas tool [13], which enables the tracing and digitization of pipeline routes directly from projected infrastructure plans within the en vironment of the tool. Due to the limited av ailability of public technical data for distribution-le vel infrastructure, the following conservati ve and technically feasible approximations were applied. Fig. 1. Schematic workflo w including data sources (blue), processing steps (green), and datasets (orange). Fig. 2. Status-quo natural gas infrastructure dataset for Austria. Distribution Level 1 pipelines directly connected to the transmission network were represented using typical diameter ranges between 500 and 600 mm. Level 1 pipelines located further do wnstream, connected only to other Le vel 1 or Le vel 2 pipelines, were modeled using a representativ e diameter of 300 to 400 mm. Operating pressures for Level 1 pipelines were assumed to lie within a range of 20 bar to 70 bar, reflecting commonly reported high-pressure distribution conditions [17], [18]. Distribution Lev el 2 pipelines were represented using a diameter of 100 to 200 mm and operating pressures between 6 bar and 16 bar , corresponding to typical medium-pressure distribution networks. These values are based on commonly reported ranges for high- and medium-pressure gas infras- tructure [18], [19] and were applied in a transparent and consistent manner across the dataset. All assumed parameters can be modified on an element-wise basis as more detailed information becomes av ailable. Fig. 2 illustrates the resulting status-quo gas infrastructure dataset, including transmission and distribution pipelines, net- work nodes, and other gas infrastructure. Fig. 3. Projection of the Hydrogen Roadmap [10] in QGas. I V . I M P L E M E N TA T I O N O F H Y D RO G E N E X PA N S IO N P L A N S Austria’ s hydrogen infrastructure expansion plans are out- lined in the A GGM Hydrogen Roadmap [10], which describes a staged transition of the existing natural gas infrastructure to- wards hydrogen. The roadmap distinguishes four dev elopment stages ranging from 2027 to 2040 and dif ferentiates between repurposed natural gas pipelines and ne wly constructed hydro- gen pipelines. The roadmap is published as a set of graphical infrastructure maps. These maps were integrated into the QGas tool by loading them as semi-transparent background layers. The tool provides an image georeferencing functionality that allows the alignment of graphical plans with the underlying spatial reference by selecting clearly identifiable reference points in both the image and the background map. After georeferencing, the roadmap image is displayed as a separate layer, enabling the digitization of new infrastructure elements by tracing the georeferenced pipeline routes. Fig. 3 shows the projection of the georeferenced Hydrogen Roadmap stage 2040 imported into the QGas tool. Follo wing the georeferencing step, two dedicated pipeline sub-layers were created: one for repurposed pipelines and one for newly constructed hydrogen pipelines. Pipeline elements Fig. 4. Splitting of existing nodes into hydrogen- and natural-gas-specific nodes. from the natural gas network that are designated for hydrogen con version were transferred from the main natural gas pipeline layer into the repurposed hydrogen sub-layer . This resulted in a separate hydrogen pipeline layer with an independent and fully customizable attribute set tailored to hydrogen-specific modeling requirements. Newly planned hydrogen pipelines were digitized directly within the second sub-layer . In this stepwise manner , both repurposing plans and new infrastruc- ture expansion plans were systematically integrated into the dataset. Applying the methodology described above resulted in nodes at which both natural gas and hydrogen pipelines were connected. T o ensure a physically consistent network representation and to pre vent any artificial coupling between the two systems, these nodes were explicitly decoupled by splitting them into two sub-nodes: one assigned exclusi vely to the natural gas network and one to the hydrogen network. This node-splitting procedure enforces a strict separation of the two infrastructures, eliminates unintended cross-network flo ws in subsequent modeling applications, and yields two physically independent yet topologically consistent networks. The node- splitting process is illustrated in Fig. 4. Each hydrogen pipeline was assigned either a repurposing year or a commissioning year , indicating the point in time at which the respectiv e pipeline becomes operational for hydro- gen. Howe ver , adjacent pipeline segments may be repurposed or commissioned at different points in time according to the Hydrogen Roadmap. In this paper we tackle this by implementing one single time-dependent network topology to av oid separate datasets which only represent a snapshot for each timestep. This was achiev ed by combining explicit repurposing and commissioning years with the introduction of short-pipe el- ements. These short-pipe elements represent non-limiting, lossless connectors between natural gas and hydrogen nodes and are activ ated or deacti vated at predefined timesteps. This mechanism enables individual pipeline segments to transition from the natural gas network to the hydrogen network within a single dataset, resulting in a time-dependent change of the underlying network topology while maintaining a technically consistent and fully decoupled representation at each timestep. Fig. 5. V isualization of the network transition. The underlying principle of this time-dependent transition is shown in a concrete example in Fig. 5. Here, short-pipe S1 is activ ated in 2040, while S2 and S3 are deactiv ated in 2027 and 2040, respectively , demonstrating how substantial topological changes emerge over time while maintaining a consistent modeling framew ork. Finally , the Hydrogen Roadmap also provides information on expected regional hydrogen demands through color-coded background shading of administrativ e districts. Based on this information, expected hydrogen demands were deriv ed for each NUTS-3 region and assigned to demand points. These demand points contain the aggregated regional demands and were spatially positioned at the centroids of the respectiv e NUTS-3 regions. V . V A L I DAT I O N A N D C O N C L U S I O N S The dataset was carefully validated at each timestep to en- sure technical consistenc y: no unintended connections between hydrogen and natural gas networks exist, and the formation of isolated subnetworks is pre vented, except for the import- fed T yrol and V orarlberg region. According to the AGGM Hydrogen Roadmap, approximately 1,420 km of pipelines are planned for repurposing and 940 km of new hydrogen pipelines are planned. In comparison, the presented dataset contains 1,253 km of repurposed pipelines and 814 km of newly constructed hydrogen pipelines. Minor deviations are due to straight-line approximations of otherwise meandering pipeline routes. In addition, the dataset includes extensi ve data on biogas plants, existing electrolyzers in Austria, gas storage facilities, gas-fired power plants, and compressor stations, enabling an integrated analysis of the hydrogen and natural gas infrastructure. The final integrated dataset is visualized in Fig. 6, high- lighting the importance of a dedicated representation of looped pipelines for a staged transition from natural gas to hydrogen. Fig. 6. Integrated dataset of Austria’ s natural gas and hydrogen infrastructure. Fig. 7. Austria’ s transition to an integrated hydrogen and natural gas infrastructure. T o illustrate the temporal development, Fig. 7 sho ws a collage of the pipeline netw ork e volution for 2027, 2030, 2035, and 2040. This visualization highlights the gradual expansion of hydrogen infrastructure and the repurposing of existing natural gas pipelines, pro viding an intuiti ve overvie w of the spatial and temporal dynamics of the resulting dataset. This paper presents a methodology for dev eloping a com- prehensiv e, spatially explicit, and modeling-ready dataset of Austria’ s natural gas and hydrogen infrastructure. By inte- grating transmission and distribution networks with hydrogen expansion plans, the dataset enables consistent national and regional energy system analyses under network constraints. By relying exclusi vely on publicly available data sources and reproducible processing steps, the dataset provides a transparent and updateable foundation for future infrastructure assessments. Due to limited public availability of detailed technical information, parts of the infrastructure, particularly at the distribution level, are represented using carefully approx- imated parameters. These approximations mainly af fect local flow constraints and attribute resolution rather than the overall network topology . The dataset is therefore intended as a robust and flexible baseline representation rather than a finalized or static infrastructure model. Its modular , topology-consistent structure supports scenario-specific modifications, alternative hydrogen expansion and repurposing strategies, and future extensions to larger geographic scopes, including European- scale applications. Overall, the dataset offers a high-resolution, reproducible foundation for transparent modeling of Austria’ s natural gas and hydrogen networks, supporting analyses of resilient, climate-neutral energy systems. The forthcoming release of the open-source QGas tool will enable further manipulation, extension, and integration of additional infrastructure compo- nents, making the dataset usable for a wide range of case studies such as strategic electrolyzer placement or analyses on new hydrogen corridors. T o ensure transparency and repro- ducibility , the dataset presented in this paper is made publicly av ailable on Zenodo [20]. A C K N O W L E D G M E N T This work is part of the project iKlimEt (FO999910627), which has recei ved funding in the framework of “En- ergieforschung”, a research and technology program of the Klima- und Energiefonds. R E F E R E N C E S [1] S. Kharel and B. Shabani, “Hydrogen as a long-term large-scale energy storage solution to support renew ables, ” Energies , vol. 11, no. 10, p. 2825, 2018. [2] S. Zwickl-Bernhard et al. , “Modeling insights from the Austrian national gas grid under declining natural gas demand and increasing domestic renew able gas generation by 2040, ” Energy Reports , vol. 11, pp. 1302– 1317, 2024. [3] V . Aryanpur, B. O’Gallach ´ oir , H. Dai, W . Chen, and J. Glynn, “ A revie w of spatial resolution and regionalisation in national-scale ener gy systems optimisation models, ” Ener gy Strate gy Reviews , vol. 37, 2021. [4] F . Neumann, E. Zeyen, M. Victoria, and T . Brown, “The potential role of a hydrogen network in Europe, ” Joule , vol. 7, no. 8, pp. 1793–1817, 2023. [5] M. Reuß et al. , “Modeling hydrogen networks for future energy systems: A comparison of linear and nonlinear approaches, ” International Journal of Hydr ogen Ener gy , vol. 44, no. 57, pp. 32136–32150, 2019. [6] ENTSOG, “Transparency Platform. ” [Online]. A vailable: https:// transparency .entsog.eu. [7] A. Pluta et al. , “SciGRID gas - data model of the European g as transport network, ” in 2022 Open Source Modelling and Simulation of Ener gy Systems (OSMSES) , 2022, pp. 1–7. [8] T A G GmbH, “T echnische Daten des T A G-Pipelinesystems, ” 2025. [On- line]. A vailable: https://www .taggmbh.at/en/transmission- system/. [9] Gas Connect Austria, “W est-Austria Pipeline (W AG) – technical and net- work information, ” 2025. [Online]. A vailable: https://www .gasconnect. at/en/network- information/our- netw ork- in- detail/west- austria- pipeline. [10] AGGM Austrian Gas Grid Management A G, “H2-Roadmap, ” 2024. [On- line]. A vailable: https://www .aggm.at/en/energy- transition/h2- roadmap/. [11] AGGM Austrian Gas Grid Management AG, “Koordinierter Netzen- twicklungsplan 2024 f ¨ ur die Gas-Fernleitungsinfrastruktur in ¨ Osterreich f ¨ ur den Zeitraum 2025–2034, ” 2024. [12] S. Zwickl-Bernhard et al. , “Replication package for the paper ‘Mod- eling insights from the Austrian national gas grid under declining natural gas demand and increasing domestic renewable gas generation by 2040’, ” Zenodo, 2023. [Online]. A vailable: https://doi.org/10.5281/ zenodo.10454605. [13] M. Quantschnig, “Open-source gas infrastructure data for integrated energy system optimization models, ” Master’ s Thesis, Graz University of T echnology , 2025. [14] OpenStreetMap Foundation, “OpenStreetMap, ” 2025. [Online]. A vail- able: https://www .openstreetmap.org. [15] Global Energy Monitor , “Global Gas Infrastructure Tracker , ” 2024. [Online]. A vailable: https://globalener gymonitor .org/projects/ global- gas- infrastructure- tracker/. [16] AGGM Austrian Gas Grid Management A G, “Gas Infrastructure in Austria, ” 2025. [Online]. A vailable: https://www .aggm.at/en/gasgrid/ infrastructure/. [17] E-Control, “Das ¨ osterreichische Gasnetz, ” 2025. [Online]. A v ailable: https://www .e- control.at/konsumenten/das- gasnetz. [18] DV GW – Deutscher V erein des Gas- und W asserfaches e.V ., “Bestands- und Ereignisdatenerfassung Gas – Ergebnisse aus den Jahren 2011 bis 2020, ” 2021. [19] Republik ¨ Osterreich, “Gaswirtschaftsgesetz 2011 (GWG 2011), BGBl. I Nr . 107/2011 idF BGBl. II Nr . 474/2012, ” 2012. [20] M. Quantschnig, Y . W erner , T . Klatzer, and S. W ogrin, “Inte grated natural gas and hydrogen dataset for energy system optimization models - Austria (2025 - 2040) (v1.0), ” Zenodo, EnInnov 2026, Graz, doi: 10.5281/zenodo.18411615.
Original Paper
Loading high-quality paper...
Comments & Academic Discussion
Loading comments...
Leave a Comment