LUMINA: A Multi-Vendor Mammography Benchmark with Energy Harmonization Protocol
Publicly available full-field digital mammography (FFDM) datasets remain limited in size, clinical annotations, and vendor diversity, hindering the development of robust models. We introduce LUMINA, a curated, multi-vendor FFDM dataset that explicitl…
Authors: Hongyi Pan, Gorkem Durak, Halil Ertugrul Aktas
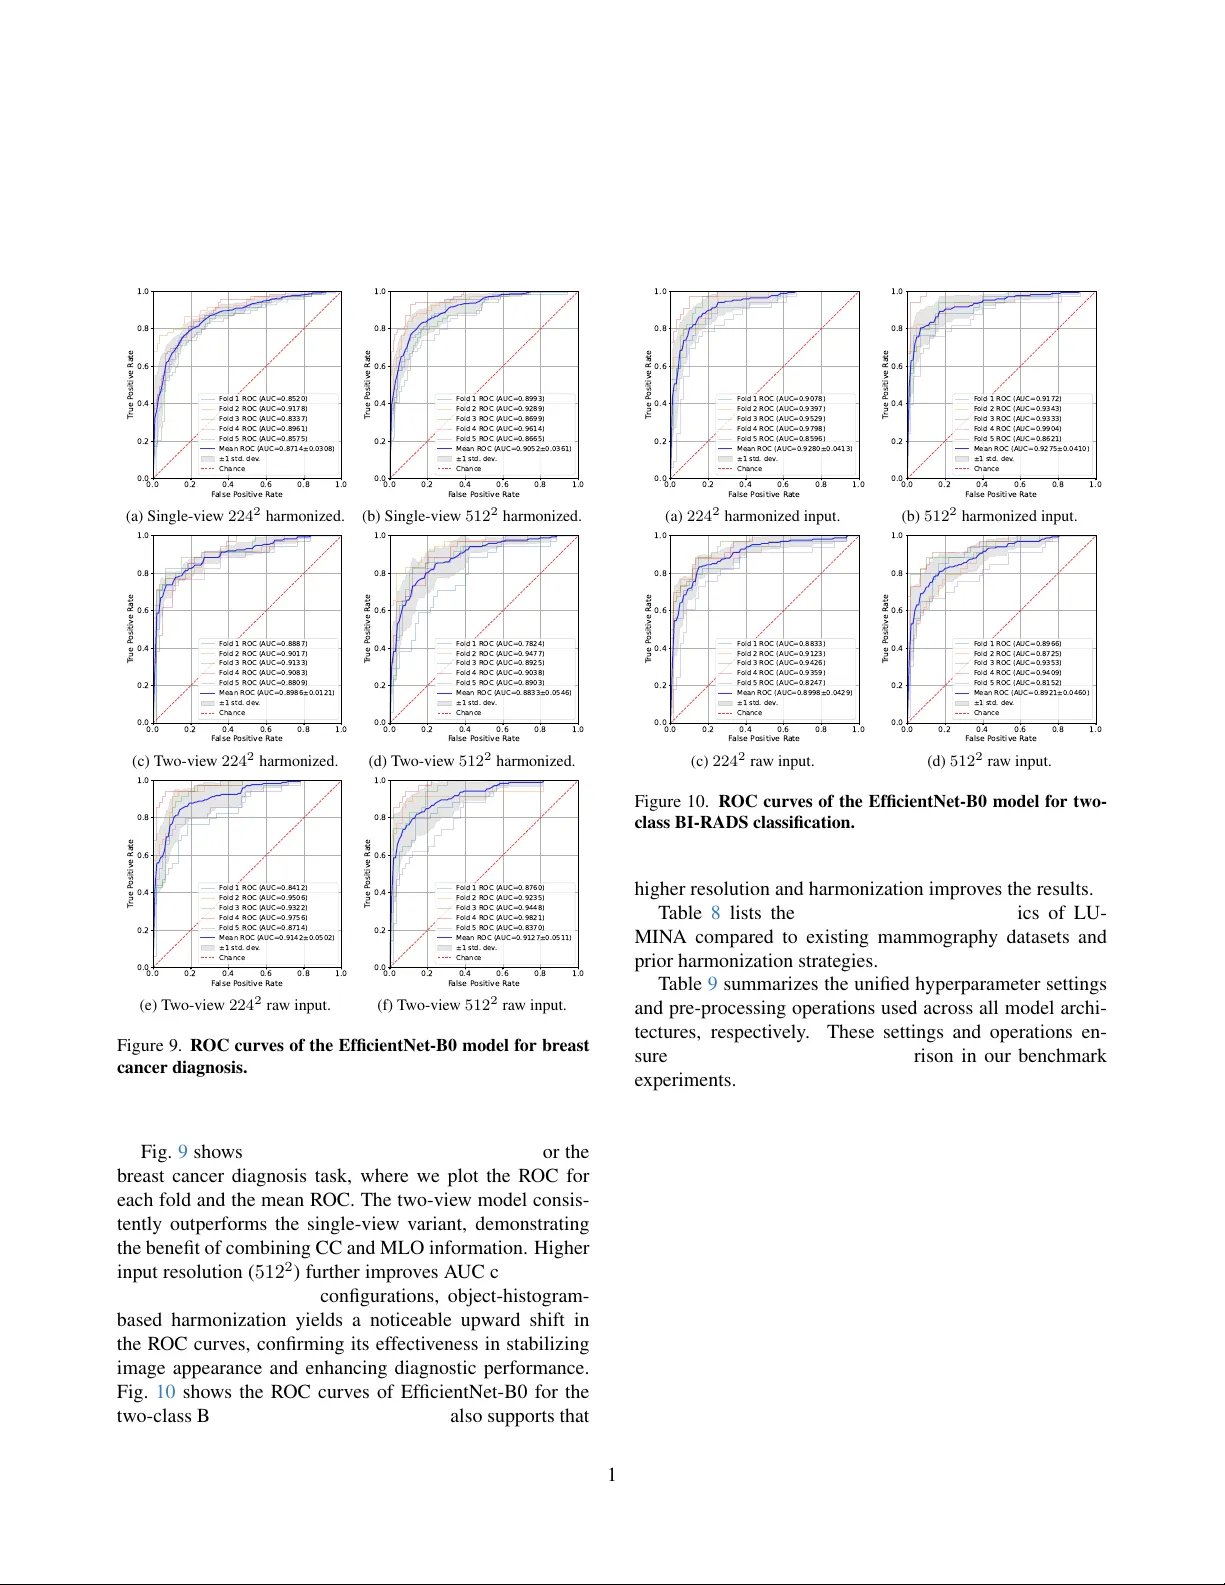
LUMIN A: A Multi-V endor Mammography Benchmark with Ener gy Harmonization Pr otocol Hongyi Pan 1 † , Gorkem Durak 1 , Halil Ertugrul Aktas 1 , Andrea M. Bejar 1 , Bav er T utun 2 , Emre Uysal 2 , Ezgi Bulbul 2 , Mehmet Fatih Dogan 2 , Berrin Erok 2 , Berna Akkus Y ildirim 2 , Sukru Mehmet Erturk 3 , Ulas Bagci 1 † 1 Department of Radiology , Northwestern Uni v ersity , Chicago, IL, USA 2 Department of Radiation Oncology , Uni v ersity of Health Sciences Prof. Dr . Cemil T ascioglu City Hospital, Istanbul, T urkey 3 Department of Radiology , Istanbul Uni v ersity , Istanbul, T urkey † { hongyi.pan, ulas.bagci } @northwestern.edu Abstract Publicly available full-field digital mammogr aphy (FFDM) datasets r emain limited in size, clinical annotations, and vendor diversity , hindering the development of r obust mod- els. W e intr oduce LUMINA , a curated, multi-vendor FFDM dataset that explicitly encodes acquisition ener gy and vendor metadata to capture clinically r elevant appear - ance variations often overlooked in existing benchmarks. This dataset contains 1824 images from 468 patients (960 benign, 864 malignant), with pathology-confirmed labels, BI-RADS assessments, and br east-density annotations. LU- MIN A spans six acquisition systems and includes both high- and low-energy imaging styles, enabling systematic analy- sis of vendor - and ener gy-induced domain shifts. T o address these variations, we pr opose a fore gr ound-only pixel-space alignment method (“ener gy harmonization”) that maps im- ages to a low-ener gy r eference while pr eserving lesion mor- phology . W e benchmark CNN and transformer models on thr ee clinically r elevant tasks: diagnosis (benign vs. malig- nant), BI-RADS classification, and density estimation. T wo- view models consistently outperform single-view models. EfficientNet-B0 achie ves an A UC of 93.54% for diagnosis, while Swin-T achieves the best macr o-A UC of 89.43% for density pr ediction. Harmonization impr oves performance acr oss ar chitectur es and pr oduces mor e localized Gr ad- CAM r esponses. Overall, LUMIN A pr ovides (1) a vendor - diverse benchmark and (2) a model-agnostic harmonization frame work for r eliable and deployable mammogr aphy AI. 1. Introduction Breast cancer is the most prev alent type of cancer and one of the leading causes of cancer-related deaths among women [ 18 , 34 ]. Recent advances in deep learning hav e demonstrated the potential to improve diagnostic accuracy and detect subtle lesions that can be ov erlooked by human readers [ 17 , 30 ]. Ho we ver , training robust and generaliz- able models requires large-scale, high-quality datasets. In the mammography domain, publicly av ailable datasets such as CBIS-DDSM [ 14 ] and INbreast [ 20 ] are limited in size and heterogeneity , restricting the dev elopment of artificial intelligence (AI) systems that can perform reliably across div erse clinical settings. This underscores the need for comprehensiv e mammography datasets that capture high- resolution images across multiple vie ws, patient popula- tions, and imaging systems. T o address this gap, we intro- duce the LUMINA dataset along with a foreground-only pixel-space CDF alignment method that reduces vendor/en- ergy appearance drift and consistently improv es accuracy and A UC across three tasks. Our contribution can be summarized as follo ws: • LUMINA dataset. Unlike prior resources that are single-vendor or film-based (e.g., CBIS-DDSM, INbreast), LUMINA is explicitly multi-vendor and energy-annotated FFDM at 12–14-bit depth, with pathology-confirmed outcomes, per-breast BI-RADS, and density labels. This combination enables controlled stress-tests for vendor/ener gy shifts and ev aluation of single- vs. tw o-vie w modeling at clinically used resolu- tions. Fig. 1 presents representati ve benign and malignant mammograms. • For eground-only histogram harmonization. A simple, 1 BI - RADS 4 Breast Density BI - RADS 5 BI - RADS 3 BI - RADS 2 Malignant Cases Category A Category B Category C Catego ry D Benign Cases Figure 1. Representati ve benign and malignant mammograms. vendor -agnostic histogram matching that excludes back- ground pixels and preserv es lesion contrast. • Three-task benchmark with multi-view modeling. Unified ev aluation on (i) pathology , (ii) BI-RADS risk grouping (binary and 3-class), and (iii) density; two-vie w models outperformed single-view for diagnosis, with EfficientNet-B0 reaching 93.61% A UC; Ef ficientNet-B0 also obtains the highest A UC (93.97%) for BI-RADS, and Swin-T yields the best A UC (89.10%) for density . • Harmonization impr oves models and attention. Fore ground histogram matching consistently raises A UC/A CC across settings (Fig. 6 in Sec. 6.3 ) and yields more focal Grad-CAMs around suspicious regions (Fig. 7 in Sec. 6.3 ), indicating better localization of lesion-related signal. 2. Related W orks Mammography datasets: The Mammographic Image Analysis Society (MIAS) database [ 31 ], the Digital Database for Screening Mammography (DDSM) [ 4 ], and its curated extension CBIS-DDSM [ 14 ] hav e been widely used in early computer-aided detection system dev elop- ment, providing digitized film mammograms with associ- ated lesion annotations and pathology verification. How- ev er , these datasets contain relatively lo w-resolution screen- film mammography (SFM) scans, limiting their applicabil- ity to current clinical practice. T o address these limitations, sev eral institutions have released modern full-field digi- tal mammography (FFDM) datasets such as INbreast [ 20 ], V inDR-Mammo [ 23 ], RSNA Screening Mammography [ 6 ], Chinese Mammography Database (CMMD) [ 5 ], CDD- CESM [ 5 ], KA U-BCMD [ 1 ]. Despite recent progress, many existing mammography datasets face limitations, in- cluding small sample sizes, reliance on film-based scans, or incomplete integration of radiological and pathological la- bels. Compared with these resources in T able 1 , LUMINA provides high-resolution multi-view FFDM images with pathology-confirmed outcomes, expert-pro vided BI-RADS risk categories, and full breast density annotations. These allow LUMIN A to fill critical gaps in existing datasets and establish a valuable benchmark for de veloping and e v aluat- ing AI algorithms in breast cancer imaging. Mammography classification: CNN-based studies adapted architectures such as AlexNet [ 21 ], VGG [ 19 , 25 ], and ResNet [ 7 , 24 ] for mammography classification, show- ing clear improvements over handcrafted features [ 2 , 9 ]. More specialized designs, such as multi-view CNNs that jointly model cranio-caudal (CC) and mediolateral oblique (MLO) views, hav e further enhanced diagnostic perfor- mance [ 17 , 30 ]. Recently , transformer-based architectures hav e been explored, lev eraging self-attention mechanisms to capture long-range dependencies across mammographic views and re gions [ 3 ]. Medical image harmonization: Harmonizing medical im- ages across different scanners, acquisition protocols, and vendors is critical to enabling robust and generalizable AI systems in healthcare. Statistical approaches such as Com- Bat [ 22 ] employ an empirical Bayes frame work to cor- rect batch-effects for MRI images by adjusting location and scale parameters of extracted imaging features, and hav e been sho wn to significantly reduce inter-site vari- ability while preserving biological signal. Deep learning approaches, such as HarmoFL [ 12 ], further address fea- ture drift by normalizing frequency domain amplitudes and guiding model con vergence in federated learning setups across heterogeneous clients. How we differ: Prior mammography studies typically ad- dress one task (diagnosis or BI-RADS or density) within a constrained imaging domain, often single-vendor FFDM or film-based datasets. In contrast, LUMINA couples (i) multi-vendor FFDM with energy metadata, (ii) uni- fied ev aluation across thr ee clinically relev ant tasks, and (iii) a fore gr ound-only , pixel-space CDF alignment that re- duces vendor/energy intensity drift while preserving le- sion morphology . Unlike ComBat-style feature harmoniz- ers or federated normalization methods, our approach is model-agnostic , runs as a lightweight pre-processing step, and consistently improves A UC and attention localization across backbones (Fig. 6 in Sec. 6.3 ). W e further report view-ablations showing that two-view models outperform four-view configurations while maintaining parameter ef- ficiency (T able 4 in Sec. 6.2 ). 3. LUMINA Dataset Intr oduction The LUMINA dataset is a curated collection of FFDM dev eloped in collaboration with the University of Health Sciences, Prof. Dr . Cemil T ascioglu City Hospital, Is- tanbul, T urkey . It consists of 1,824 images from 468 pa- tients, including 960 images from 250 benign patients and 864 images from 218 malignant patients, with malignancy confirmed by pathology . Patient ages range from 30 to 88 years, as shown in Fig. 2a . Most cases include four-vie w mammograms (CC and MLO vie ws for both breasts), while 2 T able 1. Comparison of publicly available mammography datasets. Pathology BI-RADS Breast Acquisition Dataset Origin Patients Images Labels Assessment Density T echnique MIAS [ 31 ] UK 161 322 Y es No No SFM DDSM [ 4 ] USA 2,620 10,480 Y es Y es Y es SFM CBIS-DDSM [ 14 ] USA 2,620 10,239 Y es Y es Y es SFM INbreast [ 20 ] Portugal 115 410 No Y es Y es FFDM V inDR-Mammo [ 23 ] V ietnam 5,000 20,000 No Y es Y es FFDM RSN A [ 6 ] USA 1,970 9,594 Y es Limited* Y es FFDM CMMD [ 5 ] China 1,775 3,728 Y es No No FFDM CDD-CESM [ 13 ] Egypt 326 1,003 Y es Y es Y es CESM KA U-BCMD [ 1 ] Saudi Arabia 442 1,774 No Y es No FFDM LUMINA (Ours) T urkey 468 1,824 Y es Y es Y es FFDM *RSN A provides simplified BI-RADS labels (0: follow-up, 1: negativ e, 2: normal) instead of the full BI-RADS scores from 0 to 6. 30 40 50 60 70 80 90 Age 0 5 10 15 20 25 Number of P atients (a) Age distribution. 0 1 2 3 4 5 6 BI-R ADS 0 25 50 75 100 125 150 175 Number of Br east 173 126 162 12 57 91 20 (b) BI-RADs distribution. A B C D Br east Density 0 50 100 150 200 250 Number of Br east 65 217 262 97 (c) Density distribution. Figure 2. Age, BI-RADS, and breast distrib ution. a subset contains only two views due to incomplete acqui- sition or prior surgical history . Images are accompanied by e xpert-provided annotations, including BI-RADS risk assessments (categories 0–6) and breast density classifica- tions (A–D), alongside the pathology-confirmed outcome, as summarized in Fig. 2 . While the dataset contains 1,824 images in total, only 1,282 images have fully interpretable BI-RADS and density annotations. This discrepancy arises because malignancy typically appears unilaterally . Only the breast exhibiting malignancy (as confirmed by pathology) is included in the malignant class, while the contralateral breast is discarded. The mammography images were collected from six mammography imaging systems: IMS, Metaltronica, FU- JIFILM Corporation, Siemens, Carestream Health, and GE Medical Systems. Details of these v endors are summa- rized in T able 2 . Mammograms are stored in DICOM format with nativ e resolutions ranging from 2364 × 2964 to 4800 × 6000 pixels and a bit depth of 12–14 bits per pixel, preserving fine diagnostic details. Most im- ages use the MONOCHROME2 format (higher pixel v al- ues correspond to brighter regions), while FUJIFILM sys- tems use MONOCHR OME1, where the intensity mapping is in verted. These MONOCHR OME1 images were con- verted to MONOCHR OME2 to ensure consistent visualiza- tion across the dataset. Because mammograms ha v e significant domain shifts as mentioned before, we applied a foreground-only histogram T able 2. V endor distribution. V endor # Patients # Images Energy IMS 341 1326 High Metaltronica 91 354 Low FUJIFILM Corporation 29 116 Low SIEMENS 4 16 Low Carestream Health 1 4 Low GE MEDICAL SYSTEMS 2 8 High T otal 468 1824 T able 3. Breast cancer diagnosis task data distribution. Num- bers outside and inside brackets are cases and images, respecti vely . V iew Benign Malignant T otal Single 592 (592) 344 (344) 936 (936) T wo 296 (592) 172 (344) 468 (936) harmonization (Section 4 ) to align intensity distrib utions across v endors to ward a unified lo w-energy style while pre- serving lesion integrity . Representativ e samples from LU- MIN A are sho wn in Fig. 1 . 3.1. Evaluation Pr otocol W e e valuate the LUMINA dataset using three clinically relev ant classification tasks: breast cancer diagnosis, BI- RADS risk assessment, and breast density prediction. All tasks are performed on standard two-vie w mammograms (CC and MLO) unless otherwise noted. Breast cancer diagnosis: This is the primary task in this study , as it is clinically important for early detection and risk assessment. Models are trained using labels confirmed by pathology to distinguish benign from malignant cases. Images with BI-RADS 0 are excluded, as BI-RADS 0 indi- cates incomplete assessments requiring additional imaging. W e e valuate single-view and two-vie w configurations. Only images corresponding to malignant findings are included in 3 P r ep r ocessing 1 (F or FU JIFILM Co rpo r a tion) Object : MONOCHR OME1 → MON OC HR OME2 Method: Int ensity In v erting + T e xt Anno t a tion Rem o val P r epr oc ess in g 2 (F or IMS and GE MED IC AL S Y S TEMS) Object : High - Ener g y → Lo w - Ener g y Method: F or egr ou nd - Onl y P ix el - Sp a ce Har mo n iz a tio n Conv 3x3 M BC onv1 3x3 M BC onv6 3x3 M BC onv6 3x3 M BC onv6 5x5 M BC onv6 5x5 M BC onv1 3x3 M BC onv1 3x3 M BC onv1 3x3 M BC onv6 5x5 M BC onv6 5x5 M BC onv6 5x5 M BC onv6 5x5 M BC onv6 5x5 M BC onv6 5x5 M BC onv6 5x5 M BC onv6 3x3 Lin ear EfficientNet - B0 Bac kbone Classifier Di agnosis Ben ig n M ali gn an t Lin ear Lin ear Classifier Conca t ena t e CC ML O Ef ficien t Net - B0 Ba ckbon e Ef ficien t Net - B0 Ba ckbon e Sha r ed W eight s BI - R ADS Lo w - Risk Hig h - Risk Br eas t Cancer Diagnosis , BI - RA DS Cl assific a tion, and Br eas t Density A ssessme nt Single - View Mod el f or Br ea s t Ca ncer Diagno sis T w o - View Mod el f or Thr ee T ask s High - Ener g y Sour ce Sour ce Mask Sour ce F or egr ou nd His t ogr am Harmo niz ed Im ag e Lo w - Ener g y Ref er ence Ref er ence Mask Harmoniz ed Im ag e MONOCHR OME1 MONOCHR OME2 MONOCHR OME1 MONOCHR OME2 His t ogr am Ma t ching Ref er ence F or egr ou nd His t ogr am Di agnosis Ben ig n M ali gn an t Density A B C D Harmoniz ed Im ag es Bac k gr ou nd (0) is e x cluded fr om count s! V en der - Specific P r epr ocessing Figure 3. LUMINA pipeline. The EfficientNet-B0 backbone can be replaced by other backbones (ResNet-50, DenseNet-121, and Swin-T). T wo-view shar ed-backbone reached accuracy comparable to independent-backbone with 48% less parameters (T able 7 ) and outperformed four-view v ariants (T able 4 ). the single- and two-vie w malignancy subsets, and other im- ages from the malignant patients are discarded. As T able 3 presents, 936 images are used for single-vie w e valuation and 468 cases (936 images) for two-vie w e v aluation. BI-RADS classification: This task focuses on predict- ing BI-RADS risk categories to mimic radiologists’ assess- ments. Only the standard two-view images are used, as BI- RADS annotations are assigned per breast without patho- logical confirmation. W e ev aluate two schemes: (1) binary classification, distinguishing lo w-risk (BI-RADS 1–3) from high-risk (BI-RADS 4–6), and (2) three-class classification, grouping cases into low-risk (BI-RADS 1–2), intermediate- risk (BI-RADS 3–4), and high-risk (BI-RADS 5–6). Im- ages with BI-RADS 0 are excluded as in the previous task. As a result, 468 cases (936 images) are used for e v aluation. Breast density assessment: Accurate breast density pre- diction is essential because higher-density breasts (C–D) can obscure lesions and reduce mammography sensitivity . Models are trained to predict the four density categories (A–D) using two-vie w images for each breast. Since BI- RADS 0 does not affect density determination, these im- ages are included. The e valuation includes 641 cases (1,282 images), enabling de velopment of models that reliably pre- dict breast density across multiple vendors and support risk stratification and AI-assisted interpretation. 4. Pixel-Space Harmonization Modern FFDM systems typically acquire images using ei- ther lo w-energy or high-ener gy X-ray settings. Low-ener gy mammograms are optimized for soft-tissue contrast, en- hancing the visibility of subtle lesions, while high-energy mammograms emphasize denser structures such as calci- R e f er en c e So ur ce St a nda r d M a t chi ng F o r e gr o und - O n l y M a t chi ng Figure 4. Background influence. Standard histogram matching is degraded by lar ge black background re gions, whereas foreground- only histogram matching remains unaffected. fication. Ho wever , these acquisition differences, combined with vendor-specific processing, introduce significant inten- sity and contrast v ariations across de vices. Such inconsis- tencies can degrade the generalization performance of deep learning models, as models trained on one vendor’ s imaging style may perform poorly on another . Therefore, harmoniz- ing intensity distributions across systems is critical for de- veloping v endor -agnostic and clinically reliable AI models. T o address these discrepancies, the LUMINA dataset was harmonized using a histogram-matching-based ap- proach. This method aligns the intensity distribution of each image to a reference histogram, thereby improving consis- tency across multi-v endor datasets while preserving fine di- agnostic details. Histogram matchi ng [ 26 , 28 , 29 , 33 ] trans- forms the intensity distribution of a source image to match that of a reference image. Howev er , unlike nature images, mammograms contain large black background regions. In- cluding these areas in the histogram can degrade the qual- ity of the matching, as Fig. 4 shows. Therefore, these re- gions are excluded before applying histogram matching. Let M s = { ( x, y ) | I s ( x, y ) > 0 } and M r = { ( x, y ) | I r ( x, y ) > 0 } denote the sets of fore ground (breast) pixels in the source image I s and reference image I r , respecti v ely . W e compute histograms only ov er these foreground pixels 4 to av oid bias from black background re gions: H s ( k ) = # { ( x, y ) ∈ M s | I s ( x, y ) = k } , (1) H r ( k ) = # { ( x, y ) ∈ M r | I r ( x, y ) = k } , (2) and the total foreground pix el counts: N s = X k H s ( k ) = | M s | , (3) N r = X k H r ( k ) = | M r | . (4) W e then form the normalized cumulative distribution func- tions (CDFs) ov er the foreground intensities: C s ( p ) = p X k =1 H s ( k ) , ¯ C s ( p ) = C s ( p ) N s , (5) C r ( q ) = q X k =1 H r ( k ) , ¯ C r ( q ) = C r ( q ) N r , (6) where the summation starts from intensity 1, as intensity 0 represents the background and is excluded. The mapping function T ( · ) is defined by matching these CDFs: T ( p ) = arg min q ∈{ 1 ,..., 2 b − 1 } ¯ C s ( p ) − ¯ C r ( q ) . (7) Finally , the harmonized image I o is obtained by applying T to fore ground pixels and leaving background pixels as zero: I o ( x, y ) = ( T I s ( x, y ) , ( x, y ) ∈ M s , 0 , otherwise. (8) Fig. 3 illustrates an e xample: the source image exhibits high contrast, and its CDF is adjusted to follow that of the refer- ence image, resulting in improv ed intensity consistency . Practical notes: W e derive the reference histogram from a representativ e subset of low-ener gy FFDM im- ages to stabilize soft-tissue contrast. Foreground mask- ing is computed by thresholding at intensity > 0 af- ter MONOCHROME1 → 2 con v ersion to avoid background bias (Fig. 3 ). Histogram computation uses 12-bit bins to preserve detail. This pre-processing is model-agnostic and applied identically across tasks and backbones. The harmo- nization algorithm is summarized in Algorithm 1 . 5. Deep Lear ning Appr oaches for Multi-V iew Mammography Classification W e adopt EfficientNet-B0 [ 32 ] as the representativ e back- bone, though alternati ve architectures such as ResNet- 50 [ 10 ], DenseNet-121 [ 11 ], and Swin-T [ 15 ] can also be utilized. All backbones are pretrained on the ImageNet-1K dataset [ 8 ] to provide robust initialization. In the single- view setting, the model is fine-tuned through con ventional Algorithm 1 Foreground-only CDF Matching for V en- dor/Energy Harmonization Require: Source image I s , reference image I r (low-ener gy style), bit depth b 1: Con vert MONOCHR OME1 to MONOCHR OME2 if needed; remov e textual b urn-ins (see Fig. 3 ). 2: Foreground masks: M s ← { ( x, y ) | I s ( x, y ) > 0 } , M r ← { ( x, y ) | I r ( x, y ) > 0 } 3: Compute histograms over foreground: H s , H r ∈ N 2 b ; set H s (0) = H r (0) = 0 4: Compute normalized CDFs ¯ C s , ¯ C r (Eqs. ( 5 )–( 6 )) 5: for p = 1 to 2 b − 1 do 6: T ( p ) ← arg min q ∈{ 1 ,..., 2 b − 1 } | ¯ C s ( p ) − ¯ C r ( q ) | { monotone mapping } 7: end for 8: Initialize I o ← 0 ; f or ( x, y ) ∈ M s : I o ( x, y ) ← T ( I s ( x, y )) 9: retur n I o transfer learning. In the two-vie w setting, the CC and MLO images of the same breast are independently processed through a shared-weight backbone. The resulting feature embeddings are concatenated and passed through a series of fully connected layers for classification. This shared- weight configuration enables efficient parameter utilization and promotes consistent feature learning across views while lev eraging complementary information from both projec- tions for improv ed diagnostic accuracy . The BI-RADS clas- sification and breast density prediction models follow the same two-vie w architecture, dif fering only in the output layer of the classification head. 6. Experimental Results 6.1. Experimental Setup Baseline fair ness: All backbones used the same data splits, augmentations, and training schedule to ensure compa- rability . W e applied horizontal flip and resizing, repli- cate grayscale to three channels, with identical optimiza- tion settings across tasks. CNN backbones (ResNet-50, DenseNet-121, EfficientNet-B0) were trained by AdamW optimizer [ 16 ] with an initial learning rate of 1 × 10 − 3 , while Swin-T started with 1 × 10 − 5 . All models were trained for 100 epochs with a weight decay of 1 × 10 − 5 , the learning rate decayed by a factor of 0 . 1 ev ery 30 epochs, and the selection of the model by the best validation A UC under 5- fold cross validation. This protocol av oids method-specific tricks and isolates architectural ef fects. PyT orch and CUD A determinism flags are enabled for all reported runs. All ex- periments were implemented in PyT orch on a server with 8 NVIDIA A6000 GPUs. The LUMINA dataset and source code will be released upon paper acceptance. Evaluation: W e reported accuracy (ACC), area under the R OC curve (A UC), F1-score, sensitivity (recall), precision, 5 T able 4. Mammogram cancer diagnosis benchmark. The best and second-best results are highlighted in green and yellow , respectiv ely . V iew Model Input Params Flops A CC(%) A UC(%) Precision(%) Recall(%) F1(%) Specificity(%) Single ResNet-50 224 2 23.51M 4.13G 79.49 ± 5.99 87.42 ± 4.21 81.29 ± 10.90 61.97 ± 18.17 67.52 ± 13.09 89.68 ± 9.63 DenseNet-121 224 2 6.95M 2.90G 79.49 ± 3.37 87.14 ± 3.08 80.45 ± 9.45 62.55 ± 17.56 67.79 ± 9.57 89.38 ± 7.52 EfficientNet-B0 224 2 4.01M 0.41G 83.12 ± 4.13 90.66 ± 4.21 79.78 ± 6.31 73.89 ± 15.77 75.50 ± 7.95 88.51 ± 5.00 Swin-T 224 2 27.52M 3.13G 81.84 ± 5.92 88.62 ± 5.18 78.27 ± 8.63 71.83 ± 12.10 74.16 ± 8.36 87.66 ± 7.45 ResNet-50 512 2 23.51M 21.58G 77.68 ± 7.18 86.69 ± 4.37 82.79 ± 14.09 59.36 ± 28.73 61.41 ± 22.78 88.38 ± 12.29 DenseNet-121 512 2 6.95M 15.14G 79.38 ± 5.55 90.52 ± 3.61 81.32 ± 16.39 68.09 ± 21.96 69.22 ± 11.98 85.99 ± 14.42 EfficientNet-B0 512 2 4.01M 2.13G 86.43 ± 3.85 92.13 ± 4.21 86.61 ± 5.58 75.03 ± 9.46 80.00 ± 6.35 93.08 ± 3.31 Swin-T 512 2 27.52M 16.47G 84.94 ± 3.57 91.34 ± 4.22 85.33 ± 4.48 71.55 ± 10.46 77.38 ± 6.35 92.73 ± 2.55 T wo ResNet-50 224 2 24.03M 8.26G 76.70 ± 7.80 88.71 ± 2.82 87.99 ± 14.28 48.87 ± 27.42 55.53 ± 24.63 92.89 ± 9.12 DenseNet-121 224 2 7.22M 5.80G 84.40 ± 1.64 89.86 ± 1.21 88.67 ± 5.88 66.81 ± 7.49 75.68 ± 3.62 94.59 ± 3.63 EfficientNet-B0 224 2 4.34M 0.82G 86.11 ± 2.47 92.99 ± 3.04 86.83 ± 2.93 73.26 ± 5.63 79.39 ± 4.18 93.58 ± 1.26 Swin-T 224 2 27.72M 6.26G 81.22 ± 9.77 91.99 ± 3.40 63.41 ± 32.06 66.57 ± 33.56 64.92 ± 32.73 89.88 ± 5.93 ResNet-50 512 2 24.03M 43.16G 72.62 ± 14.72 87.56 ± 5.14 70.66 ± 16.28 71.45 ± 27.02 64.29 ± 17.57 73.23 ± 30.35 DenseNet-121 512 2 7.22M 30.29G 72.46 ± 11.81 88.33 ± 5.46 64.93 ± 13.99 79.01 ± 13.83 68.88 ± 5.96 68.56 ± 25.60 EfficientNet-B0 512 2 4.34M 4.27G 85.04 ± 5.92 93.54 ± 3.88 91.34 ± 11.37 69.87 ± 22.03 75.75 ± 12.85 93.91 ± 9.75 Swin-T 512 2 27.72M 32.94G 83.96 ± 4.25 92.42 ± 4.27 80.92 ± 10.00 76.15 ± 9.13 77.67 ± 5.36 88.50 ± 6.91 T able 5. BI-RADS classification benchmark. T wo-Class (BI-RADS 1/2/3 VS 4/5/6) Three-Class (BI-RADS 1/2 VS 3/4 VS 5/6) Model Input A CC(%) A UC(%) F1(%) A CC(%) A UC(%) F1(%) ResNet-50 224 2 71.98 ± 12.34 88.23 ± 3.52 62.45 ± 10.33 69.02 ± 5.14 79.58 ± 3.00 55.36 ± 1.97 DenseNet-121 224 2 77.55 ± 3.67 87.89 ± 3.52 58.98 ± 14.70 68.15 ± 3.12 80.90 ± 3.74 48.63 ± 3.49 EfficientNet-B0 224 2 83.56 ± 4.76 92.80 ± 4.13 74.18 ± 9.32 71.78 ± 5.03 83.27 ± 4.91 55.15 ± 4.65 Swin-T 224 2 79.29 ± 9.01 90.80 ± 4.61 60.82 ± 31.02 70.51 ± 4.45 81.69 ± 5.55 49.55 ± 6.85 ResNet-50 512 2 75.22 ± 4.46 89.08 ± 5.42 64.78 ± 9.96 66.66 ± 3.10 78.92 ± 4.91 50.71 ± 3.73 DenseNet-121 512 2 74.56 ± 10.73 88.76 ± 3.95 59.09 ± 24.68 64.97 ± 5.95 80.54 ± 4.29 52.50 ± 3.48 EfficientNet-B0 512 2 85.48 ± 3.04 92.75 ± 4.10 76.83 ± 5.45 71.13 ± 5.22 82.85 ± 4.41 55.73 ± 3.22 Swin-T 512 2 83.31 ± 6.21 91.44 ± 4.41 76.29 ± 7.12 70.07 ± 5.02 81.68 ± 5.88 47.98 ± 5.66 T able 6. Density classification benchmark. Model Input A CC(%) A UC(%) F1(%) ResNet-50 224 2 64.74 ± 3.33 85.66 ± 1.62 56.94 ± 6.43 DenseNet-121 224 2 66.29 ± 4.20 86.39 ± 2.92 56.70 ± 2.97 EfficientNet-B0 224 2 59.43 ± 5.23 84.72 ± 3.54 48.25 ± 5.68 Swin-T 224 2 70.35 ± 4.60 89.43 ± 2.22 65.28 ± 6.48 ResNet-50 512 2 65.37 ± 4.07 87.06 ± 2.10 58.29 ± 7.57 DenseNet-121 512 2 66.31 ± 5.31 86.60 ± 3.76 61.42 ± 7.62 EfficientNet-B0 512 2 67.54 ± 3.89 86.83 ± 2.80 63.10 ± 4.90 Swin-T 512 2 69.41 ± 7.23 89.14 ± 3.36 61.50 ± 12.60 and specificity for breast cancer diagnosis, and A CC, A UC, and F1 for the three-class BI-RADS and density classifica- tion (macro-A UC and macro-F1 for multi-class). A UC is considered the primary metric from a clinical perspectiv e. Results were reported as mean ± std ov er 5 folds. 6.2. Benchmark Results Breast cancer diagnosis: T able 4 shows that EfficientNet- B0 consistently outperformed ResNet-50 and DenseNet- 121 in terms of A UC, indicating its strong capability for mammographic image analysis. For instance, single-view EfficientNet-B0 achieves 90.66% A UC at 224 2 and 92.13% A UC at 512 2 , outperforming both ResNet-50 (87.42% / 86.69%) and DenseNet-121 (87.14% / 90.52%). Higher in- put resolutions generally improve performance, highlight- ing the importance of preserving fine mammography de- tails. Ne v ertheless, 224 2 inputs still provide competi- tiv e results, of fering computational efficienc y . For ex- ample, single-view Ef ficientNet-B0 has 4.01M parameters and 0.41G FLOPs at 224 2 , compared to 4.01M parameters and 2.13G FLOPs at 512 2 . T wo-vie w models outperform single-view models across all backbones, highlighting the value of combining CC and MLO vie ws. Notably , two- view EfficientNet-B0 with 512 2 inputs achieves the high- est overall performance, reaching an A UC of 93.54%, rep- 6 40 20 0 20 40 40 20 0 20 40 Benign Malignant (a) Single-view features, 224 2 . 20 10 0 10 20 30 30 20 10 0 10 20 Benign Malignant (b) T wo-view features, 224 2 . 30 20 10 0 10 20 60 40 20 0 20 40 60 Benign Malignant (c) Single-view features, 512 2 . 20 10 0 10 20 30 20 10 0 10 20 30 Benign Malignant (d) T wo-view features, 512 2 . Figure 5. t-SNE visualization for diagnosis task. Higher resolu- tion increases benign/malignant separation in the latent space. resenting the most ef fecti ve configuration in our bench- mark. Fig. 5 illustrates the t-SNE visualization, which shows how EfficientNet-B0 learned representations sepa- rate benign and malignant cases more clearly at higher input resolution. BI-RADS classification: The BI-RADS classification benchmarks are summarized in T able 5 . Across all experi- mental settings, Ef ficientNet-B0 achiev ed the highest A UCs (92.80% in the two-class classification and 83.27% in the three-class classification), followed by Swin-T , which con- sistently ranked second (91.44% and 81.68%). Density classification: As presented in T able 6 , Swin-T always achiev ed the highest A UC across both input resolu- tions, demonstrating its ef fectiv eness for multi-class density prediction. W ith 512 2 inputs, Swin-T achieved a Macro- A UC of 89.14%, outperforming ResNet-50 (87.06%), DenseNet-121 (86.39%), and EfficientNet-B0 (84.72%). While higher resolutions generally improved the perfor- mance of CNN-based models, Swin-T obtained a slightly higher A UC (89.43%) at 224 2 resolution. W e attribute this to the f act that the publicly av ailable pretrained weights (from PyT orch T orchvision) were trained with 224 2 inputs, and Transformer -based attention mechanisms are particu- larly sensitiv e to input scale. 6.3. Ablation Study And Discussion Shared vs. independent backbone: W e compared two- view models using either shared or independent backbone weights. In the independent setting, the two EfficientNet- B0 branches are initialized and trained separately , while T able 7. Shared vs. independent two-view EfficientNet-B0 backbones. Flops are 0.82G for 224 2 and 4.27G under 512 2 . Backbone Input Params A CC(%) A UC(%) F1(%) Indepen- 224 2 8.34M 84.82 ± 3.00 93.54 ± 2.38 77.41 ± 6.13 dent 512 2 8.34M 88.46 ± 4.91 92.71 ± 4.63 82.19 ± 8.61 Shared 224 2 4.34M 86.11 ± 2.47 92.99 ± 3.04 79.39 ± 4.18 512 2 4.34M 85.04 ± 5.92 93.54 ± 3.88 75.75 ± 12.85 Diagnosis BI-R ADS Density 55 60 65 70 75 80 85 90 95 100 Har monized R aw 86.11 ±2.47 81.43 ±7.07 A CC 83.56 ±4.76 80.56 ±5.80 A CC 70.35 ±4.60 69.11 ±5.45 A CC 92.99 ±3.04 91.42 ±5.02 AUC 92.80 ±4.13 89.98 ±4.29 AUC 89.43 ±2.22 88.41 ±2.45 AUC 79.39 ±4.18 65.82 ±17.07 F1 74.18 ±9.32 63.90 ±15.88 F1 65.28 ±6.48 62.72 ±6.12 F1 (a) 224 2 input. Diagnosis BI-R ADS Density 50 60 70 80 90 100 Har monized R aw 85.04 ±5.92 82.48 ±7.77 A CC 85.48 ±3.04 79.50 ±6.68 A CC 69.41 ±7.23 67.07 ±7.84 A CC 93.54 ±3.88 91.27 ±5.11 AUC 92.75 ±4.10 89.21 ±4.60 AUC 89.14 ±3.36 88.92 ±3.59 AUC 75.75 ±12.85 67.75 ±19.26 F1 76.83 ±5.45 63.19 ±21.73 F1 63.10 ±4.90 56.28 ±10.97 F1 (b) 512 2 input. 0.0 0.2 0.4 0.6 0.8 1.0 F alse P ositive R ate 0.0 0.2 0.4 0.6 0.8 1.0 T rue P ositive R ate Har monized 224x224 Har monized 512x512 R aw 224x224 R aw 512x512 Chance (c) T wo-view diagnosis. 0.0 0.2 0.4 0.6 0.8 1.0 F alse P ositive R ate 0.0 0.2 0.4 0.6 0.8 1.0 T rue P ositive R ate Har monized 224x224 Har monized 512x512 R aw 224x224 R aw 512x512 Chance (d) T wo-class BI-RADS. Figure 6. Harmonization impro ves A CC, A UC, and F1-Score across tasks. Bars show mean ± std o ver 5 folds, and curves sho w the mean R OC. How to read: In (a) and (b), darker bars (harmo- nized) consistently e xceed lighter bars (raw). In (c) and (d), areas under the blue and orange (harmonized) curves are respectiv ely larger than areas under the green and red (raw) curv es. T akeaway: Pixel-space CDF alignment helps regardless of backbone or input size, supporting its use as a robust pre-processing step. in the shared setting, both views share the same backbone parameters. T able 7 sho ws that although the computa- tional cost between the two approaches is identical, shar- ing weights substantially reduces model size from 8.34M to 4.34M parameters without sacrificing performance. The shared-backbone EfficientNet-B0 achie ved 92.99% mean A UC at 224 2 and 93.54% at 512 2 , comparable to or slightly better than the independent-backbone configuration, which reached 93.54% and 92.71%. These results indicate that shared backbones are sufficient for this task, which offers a fa vorable trade-of f between efficiency and A UC. Effect of f or eground-only histogram harmonization: W e compared the performance of the best model in each task on raw mammograms versus harmonized mammograms. 7 57L (a) Malignant case 57L. 83 R (b) Malignant case 83L. 105R (c) Malignant case 105L. Figure 7. Attention becomes more focal after harmoniza- tion. Shown are raw (left two columns) vs. harmonized (right two columns) inputs with Grad-CAM overlays for two malignant cases. Observation: Harmonization reduces diffuse activations and concentrates attention on lesion-bearing regions. Implication: Harmonization not only improves metrics (Fig. 6 ) but may also enhance clinical interpretability by focusing on suspicious tissue. In this section, the con version from MONOCHR OME1 to MONOCHR OME2 was still applied. As shown in Fig. 6 , histogram matching consistently improv ed the performance across all settings. These results highlight that aligning in- tensity distributions across multi-vendor mammograms en- hances the model’ s discrimination between benign and ma- lignant cases, making histogram matching an effecti ve pre- processing step for robust pathology classification. Furthermore, we visually compared Grad-CAM atten- tion maps [ 27 ] generated by the breast cancer diagno- sis classifier on raw and histogram-harmonized two-view mammograms ( 512 2 ). As shown in Fig. 7 , harmonization improv es the spatial focus of the model’ s acti vations, direct- ing attention to ward clinically relev ant regions. In Fig. 7a , the model trained on raw images attended primarily to the MLO view , whereas the harmonized model successfully identified the suspicious area in both CC and MLO views. In Fig. 7b and Fig. 7c , the raw-image model’ s attention was distracted by the chest wall above or belo w the breast, while harmonization guided the model tow ard the actual breast tissue, better aligning with lesion-related structures. Diagnosis L ow-Ener gy Diagnosis High-Ener gy BI-R ADS L ow-Ener gy BI-R ADS High-Ener gy Density L ow-Ener gy Density High-Ener gy 50 60 70 80 90 100 AUC(%) 83.75 94.19 91.50 91.75 91.77 93.31 84.64 90.17 84.02 86.14 89.19 89.71 R aw Har monized L ow-Ener gy High-Ener gy Figure 8. Energy-specific A UC. Histogram harmonization im- prov ed A UC, particularly for low-energy images. Energy-specific analysis: T o ev aluate energy-specific per- formance, predictions and labels from fiv e patient-specific folds were concatenated to obtain full-dataset predic- tions. A UC was then computed separately for lo w- and high-energy subsets using the best models for each task (EfficientNet-B0 for two-vie w diagnosis and two-class BI- RADS, and Swin-T for density). All models were with 224 2 inputs. As sho wn in Fig. 8 , the histogram harmonization re- duces the distribution gap between the two energy types, improving generalization. Notably , when high-energy im- ages dominate the dataset, low-ener gy images benefit most from harmonization. 7. Conclusion W e present LUMIN A, a multi-vendor FFDM dataset with comprehensiv e pathology , BI-RADS, and density annota- tions. W e also introduced a fore ground-only histogram- based harmonization method to mitigate inter-scanner v ari- ability . Extensiv e experiments demonstrate that harmo- nization consistently improves performance across multiple tasks and architectures. These findings highlight the impor - tance of vendor-le vel normalization for robust mammogra- phy AI. W e expect LUMINA to bridge the gap between aca- demic benchmarks and real-world clinical deployment. 8. Data and Code The LUMINA dataset and the associated source code are publicly av ailable at the following links: • OSF (Dataset): https://osf.io/b63jc/ • Kaggle (Dataset): https : / / www . kaggle . com / datasets / phy710 / lumina - mammography - dataset • GitHub (Code): https : / / github . com / NUBagciLab/LUMINA 9. Acknowledgment This research was partially funded by NIH: R01- HL171376. 8 References [1] Asmaa S Alsolami, W afaa Shalash, W afaa Alsaggaf, Sawsan Ashoor , Haneen Refaat, and Mohammed Elmogy . King ab- dulaziz uni versity breast cancer mammogram dataset (kau- bcmd). Data , 6(11):111, 2021. 2 , 3 [2] John Arev alo, Fabio A Gonz ´ alez, Ra ´ ul Ramos-Poll ´ an, Jose L Oliv eira, and Miguel Angel Guev ara Lopez. Representation learning for mammography mass lesion classification with con v olutional neural networks. Computer methods and pr o- grams in biomedicine , 127:248–257, 2016. 2 [3] Gelan A yana, K okeb Dese, Y isak Dereje, Y onas Kebede, Hika Barki, Dechassa Amdissa, Nahimiya Husen, Fikadu Mulugeta, Bontu Habtamu, and Se-W oon Choe. V ision- transformer-based transfer learning for mammogram classi- fication. Diagnostics , 13(2):178, 2023. 2 [4] Ke vin Bowyer , David Kopans, W illiam P Kegelme yer , R Moore, M Sallam, K Chang, and K W oods. The digital database for screening mammography . In Third international workshop on digital mammography , page 27, 1996. 2 , 3 [5] Hongmin Cai, Jinhua W ang, T ingting Dan, Jiao Li, Zhihao Fan, W eiting Y i, Chunyan Cui, Xinhua Jiang, and Li Li. An online mammography database with biopsy confirmed types. Scientific Data , 10(1):123, 2023. 2 , 3 [6] C Carr, Felipe Kitamura, G Partridge, J Kalpathy-Cramer, J Mongan, K Andriole, V azirabad M La vender , M Riopel, R Ball, S Dane, et al. Rsna screening mammography breast cancer detection. Kaggle , 2022. 2 , 3 [7] Y uanqin Chen, Qian Zhang, Y aping W u, Bo Liu, Meiyun W ang, and Y usong Lin. Fine-tuning resnet for breast cancer classification from mammography . In The international con- fer ence on healthcar e science and engineering , pages 83–96. Springer , 2018. 2 [8] Jia Deng, W ei Dong, Richard Socher , Li-Jia Li, Kai Li, and Li Fei-Fei. Imagenet: A large-scale hierarchical image database. In 2009 IEEE conference on computer vision and pattern r ecognition , pages 248–255. Ieee, 2009. 5 [9] Neeraj Dhungel, Gusta vo Carneiro, and Andrew P Bradley . Deep learning and structured prediction for the segmentation of mass in mammograms. In International Confer ence on Medical image computing and computer-assisted interven- tion , pages 605–612. Springer , 2015. 2 [10] Kaiming He, Xiangyu Zhang, Shaoqing Ren, and Jian Sun. Deep residual learning for image recognition. In Pr oceed- ings of the IEEE confer ence on computer vision and pattern r ecognition , pages 770–778, 2016. 5 [11] Gao Huang, Zhuang Liu, Laurens V an Der Maaten, and Kil- ian Q W einberger . Densely connected conv olutional net- works. In Pr oceedings of the IEEE conference on computer vision and pattern r ecognition , pages 4700–4708, 2017. 5 [12] Meirui Jiang, Zirui W ang, and Qi Dou. Harmofl: Harmoniz- ing local and global drifts in federated learning on heteroge- neous medical images. In Pr oceedings of the AAAI Confer- ence on Artificial Intelligence , pages 1087–1095, 2022. 2 [13] Rana Khaled, Maha Helal, Omar Alfarghaly , Omnia Mokhtar , Abeer Elkorany , Hebatalla El Kassas, and Aly Fahmy . Categorized contrast enhanced mammography dataset for diagnostic and artificial intelligence research. Sci- entific data , 9(1):122, 2022. 3 [14] Rebecca Sawyer Lee, Francisco Gimenez, Assaf Hoogi, Kanae Kawai Miyake, Mia Gorov oy , and Daniel L Rubin. A curated mammography data set for use in computer-aided detection and diagnosis research. Scientific data , 4(1):1–9, 2017. 1 , 2 , 3 [15] Ze Liu, Y utong Lin, Y ue Cao, Han Hu, Y ixuan W ei, Zheng Zhang, Stephen Lin, and Baining Guo. Swin transformer: Hierarchical vision transformer using shifted windows. In Pr oceedings of the IEEE/CVF international conference on computer vision , pages 10012–10022, 2021. 5 [16] Ilya Loshchilov and Frank Hutter . Decoupled weight decay regularization. arXiv pr eprint arXiv:1711.05101 , 2017. 5 [17] William Lotter , Abdul Rahman Diab, Bryan Haslam, Jiye G Kim, Gior gia Grisot, Eric W u, K evin W u, Jorge Onieva Oniev a, Y un Boyer, Jerrold L Boxerman, et al. Robust breast cancer detection in mammography and digital breast tomosynthesis using an annotation-efficient deep learning approach. Natur e medicine , 27(2):244–249, 2021. 1 , 2 [18] Sergiusz Łukasiewicz, Marcin Czeczelewski, Alicja Forma, Jacek Baj, Robert Sitarz, and Andrzej Stanisławek. Breast cancer—epidemiology , risk factors, classification, prognos- tic mark ers, and current treatment strategies—an updated re- view . Cancers , 13(17):4287, 2021. 1 [19] Sidratul Montaha, Sami Azam, Abul Kalam Muhammad Rakibul Haque Rafid, Pronab Ghosh, Md Zahid Hasan, Mir- jam Jonkman, and Friso De Boer . Breastnet18: a high accu- racy fine-tuned vgg16 model evaluated using ablation study for diagnosing breast cancer from enhanced mammography images. Biology , 10(12):1347, 2021. 2 [20] In ˆ es C Moreira, Igor Amaral, In ˆ es Domingues, Ant ´ onio Car - doso, Maria Joao Cardoso, and Jaime S Cardoso. Inbreast: tow ard a full-field digital mammographic database. Aca- demic radiology , 19(2):236–248, 2012. 1 , 2 , 3 [21] Emmanuel Lawrence Omonigho, Micheal David, Achonu Adejo, and Saliyu Aliyu. Breast cancer: tumor detection in mammogram images using modified alexnet deep conv o- lution neural network. In 2020 international conference in mathematics, computer engineering and computer science (ICMCECS) , pages 1–6. IEEE, 2020. 2 [22] Fanny Orlhac, Jakoba J Eertink, Anne-Segolene Cottereau, Josee M Zijlstra, Catherine Thieblemont, Michel Meignan, Ronald Boellaard, and Ir ` ene Buvat. A guide to combat har- monization of imaging biomarkers in multicenter studies. Journal of Nuclear Medicine , 63(2):172–179, 2022. 2 [23] Hieu Huy Pham, H Nguyen T rung, and Ha Quy Nguyen. V indr-mammo: A large-scale benchmark dataset for computer-aided detection and diagnosis in full-field digital mammography . Sci Data , 2022. 2 , 3 [24] T Sathya Priya and T Ramaprabha. Resnet based feature ex- traction with decision tree classifier for classificaton of mam- mogram images. T urkish J ournal of Computer and Mathe- matics Education , 12(2):1147–1153, 2021. 2 [25] V inoth Rathinam, R Sasireka, and K V alarmathi. An adaptiv e fuzzy c-means segmentation and deep learning model for ef- ficient mammogram classification using vgg-net. Biomedical Signal Pr ocessing and Contr ol , 88:105617, 2024. 2 9 [26] Jannick P Rolland, V V o, B Bloss, and Craig K Abbey . Fast algorithms for histogram matching: Application to texture synthesis. Journal of Electr onic Imaging , 9(1):39–45, 2000. 4 [27] Ramprasaath R Selvaraju, Michael Cogswell, Abhishek Das, Ramakrishna V edantam, Devi Parikh, and Dhruv Batra. Grad-cam: V isual explanations from deep networks via gradient-based localization. In Pr oceedings of the IEEE in- ternational confer ence on computer vision , pages 618–626, 2017. 8 [28] Dori Shapira, Shai A vidan, and Y acov Hel-Or . Multiple his- togram matching. In 2013 IEEE international confer ence on image pr ocessing , pages 2269–2273. IEEE, 2013. 4 [29] Dinggang Shen. Image registration by local histogram matching. P attern Recognition , 40(4):1161–1172, 2007. 4 [30] Li Shen, Laurie R Margolies, Joseph H Rothstein, Eugene Fluder , Russell McBride, and W eiva Sieh. Deep learning to improv e breast cancer detection on screening mammogra- phy . Scientific reports , 9(1):12495, 2019. 1 , 2 [31] John Suckling. The mammographic images analysis society digital mammogram database. In Exerpta Medica. Interna- tional Congr ess Series, 1994 , pages 375–378, 1994. 2 , 3 [32] Mingxing T an and Quoc Le. Efficientnet: Rethinking model scaling for conv olutional neural networks. In International confer ence on machine learning , pages 6105–6114. PMLR, 2019. 5 [33] Liangping Tu and Changqing Dong. Histogram equaliza- tion and image feature matching. In 2013 6th International Congr ess on Image and Signal Pr ocessing (CISP) , pages 443–447. IEEE, 2013. 4 [34] Louise W ilkinson and T oral Gathani. Understanding breast cancer as a global health concern. The British journal of radiology , 95(1130):20211033, 2022. 1 10 LUMIN A: A Multi-V endor Mammography Benchmark with Ener gy Harmonization Pr otocol Supplementary Material 0.0 0.2 0.4 0.6 0.8 1.0 F alse P ositive R ate 0.0 0.2 0.4 0.6 0.8 1.0 T rue P ositive R ate F old 1 ROC (AUC=0.8520) F old 2 ROC (AUC=0.9178) F old 3 ROC (AUC=0.8337) F old 4 ROC (AUC=0.8961) F old 5 ROC (AUC=0.8575) Mean ROC (AUC=0.8714±0.0308) ±1 std. dev . Chance (a) Single-view 224 2 harmonized. 0.0 0.2 0.4 0.6 0.8 1.0 F alse P ositive R ate 0.0 0.2 0.4 0.6 0.8 1.0 T rue P ositive R ate F old 1 ROC (AUC=0.8993) F old 2 ROC (AUC=0.9289) F old 3 ROC (AUC=0.8699) F old 4 ROC (AUC=0.9614) F old 5 ROC (AUC=0.8665) Mean ROC (AUC=0.9052±0.0361) ±1 std. dev . Chance (b) Single-view 512 2 harmonized. 0.0 0.2 0.4 0.6 0.8 1.0 F alse P ositive R ate 0.0 0.2 0.4 0.6 0.8 1.0 T rue P ositive R ate F old 1 ROC (AUC=0.8887) F old 2 ROC (AUC=0.9017) F old 3 ROC (AUC=0.9133) F old 4 ROC (AUC=0.9083) F old 5 ROC (AUC=0.8809) Mean ROC (AUC=0.8986±0.0121) ±1 std. dev . Chance (c) T wo-view 224 2 harmonized. 0.0 0.2 0.4 0.6 0.8 1.0 F alse P ositive R ate 0.0 0.2 0.4 0.6 0.8 1.0 T rue P ositive R ate F old 1 ROC (AUC=0.7824) F old 2 ROC (AUC=0.9477) F old 3 ROC (AUC=0.8925) F old 4 ROC (AUC=0.9038) F old 5 ROC (AUC=0.8903) Mean ROC (AUC=0.8833±0.0546) ±1 std. dev . Chance (d) T wo-view 512 2 harmonized. 0.0 0.2 0.4 0.6 0.8 1.0 F alse P ositive R ate 0.0 0.2 0.4 0.6 0.8 1.0 T rue P ositive R ate F old 1 ROC (AUC=0.8412) F old 2 ROC (AUC=0.9506) F old 3 ROC (AUC=0.9322) F old 4 ROC (AUC=0.9756) F old 5 ROC (AUC=0.8714) Mean ROC (AUC=0.9142±0.0502) ±1 std. dev . Chance (e) T wo-view 224 2 raw input. 0.0 0.2 0.4 0.6 0.8 1.0 F alse P ositive R ate 0.0 0.2 0.4 0.6 0.8 1.0 T rue P ositive R ate F old 1 ROC (AUC=0.8760) F old 2 ROC (AUC=0.9235) F old 3 ROC (AUC=0.9448) F old 4 ROC (AUC=0.9821) F old 5 ROC (AUC=0.8370) Mean ROC (AUC=0.9127±0.0511) ±1 std. dev . Chance (f) T wo-view 512 2 raw input. Figure 9. R OC curves of the EfficientNet-B0 model for breast cancer diagnosis. Fig. 9 shows the ROC curves of EfficientNet-B0 for the breast cancer diagnosis task, where we plot the ROC for each fold and the mean ROC. The two-view model consis- tently outperforms the single-view variant, demonstrating the benefit of combining CC and MLO information. Higher input resolution ( 512 2 ) further improv es A UC compared to the 224 2 setting. In all configurations, object-histogram- based harmonization yields a noticeable upward shift in the R OC curves, confirming its ef fecti veness in stabilizing image appearance and enhancing diagnostic performance. Fig. 10 shows the R OC curves of Ef ficientNet-B0 for the two-class BI-RADS classification task. It also supports that 0.0 0.2 0.4 0.6 0.8 1.0 F alse P ositive R ate 0.0 0.2 0.4 0.6 0.8 1.0 T rue P ositive R ate F old 1 ROC (AUC=0.9078) F old 2 ROC (AUC=0.9397) F old 3 ROC (AUC=0.9529) F old 4 ROC (AUC=0.9798) F old 5 ROC (AUC=0.8596) Mean ROC (AUC=0.9280±0.0413) ±1 std. dev . Chance (a) 224 2 harmonized input. 0.0 0.2 0.4 0.6 0.8 1.0 F alse P ositive R ate 0.0 0.2 0.4 0.6 0.8 1.0 T rue P ositive R ate F old 1 ROC (AUC=0.9172) F old 2 ROC (AUC=0.9343) F old 3 ROC (AUC=0.9333) F old 4 ROC (AUC=0.9904) F old 5 ROC (AUC=0.8621) Mean ROC (AUC=0.9275±0.0410) ±1 std. dev . Chance (b) 512 2 harmonized input. 0.0 0.2 0.4 0.6 0.8 1.0 F alse P ositive R ate 0.0 0.2 0.4 0.6 0.8 1.0 T rue P ositive R ate F old 1 ROC (AUC=0.8833) F old 2 ROC (AUC=0.9123) F old 3 ROC (AUC=0.9426) F old 4 ROC (AUC=0.9359) F old 5 ROC (AUC=0.8247) Mean ROC (AUC=0.8998±0.0429) ±1 std. dev . Chance (c) 224 2 raw input. 0.0 0.2 0.4 0.6 0.8 1.0 F alse P ositive R ate 0.0 0.2 0.4 0.6 0.8 1.0 T rue P ositive R ate F old 1 ROC (AUC=0.8966) F old 2 ROC (AUC=0.8725) F old 3 ROC (AUC=0.9353) F old 4 ROC (AUC=0.9409) F old 5 ROC (AUC=0.8152) Mean ROC (AUC=0.8921±0.0460) ±1 std. dev . Chance (d) 512 2 raw input. Figure 10. ROC curves of the EfficientNet-B0 model for two- class BI-RADS classification. higher resolution and harmonization improv es the results. T able 8 lists the distinguishing characteristics of LU- MIN A compared to existing mammography datasets and prior harmonization strategies. T able 9 summarizes the unified hyperparameter settings and pre-processing operations used across all model archi- tectures, respecti vely . These settings and operations en- sured a controlled and fair comparison in our benchmark experiments. 1 T able 8. Positioning. LUMIN A provides pathology , BI-RADS, and density on multi-vendor FFDM, plus a simple, effecti ve pixel-space harmonization baseline. Family Examples Labels/Supervision Architectur e/Objective Limitations vs. LUMIN A Film (SFM) datasets MIAS [ 31 ], DDSM [ 4 ], CBIS-DDSM [ 14 ] Pathology (yes), BI- RADS (varies) Early CNNs / CAD; single- task classification Film scans, lower resolution; limited modern FFDM rele- vance. Digital (FFDM) datasets INbreast [ 20 ], V inDR-Mammo [ 23 ], RSN A [ 6 ], CMMD [ 5 ], KA U-BCMD [ 1 ] Pathology or BI- RADS; density varies CNNs/V iTs; single- or dual- task Often single vendor/system; partial labels; limited multi- task scope. Harmonization (feature space) ComBat [ 22 ] Batch-effect correc- tion on features Empirical Bayes (location/s- cale) on radiomics/latent fea- tures Requires feature extraction; not pixel-space; modality- agnostic assumptions. Harmonization (federated learning) HarmoFL [ 12 ] Federated frequency-domain drift normalization Joint optimization across clients Heavy infra; task/model cou- pling; not a simple preproc. LUMINA (Ours) Multi-vendor FFDM (6 systems); energy meta- data Pathology + BI- RADS + density F or e gr ound-only pixel-space CDF matching + unified 3-task benchmark; single- /two-/four-vie w baselines V endor/energy di versity; three tasks; consistent harmoniza- tion gains; improved attention focus. T able 9. Hyperparameter parity across backbones. Shared schedule and augmentations ensure a fair comparison (see Sec. 6.1 ). Backbone Pre-trained Learning Rate W eight Decay Epochs Learning Rate scheduler Batch A ugmentation ResNet-50 ImageNet-1K 1 × 10 − 3 1 × 10 − 5 100 × 0 . 1 e very 30 32 flip, resize DenseNet-121 ImageNet-1K 1 × 10 − 3 1 × 10 − 5 100 × 0 . 1 e very 30 32 flip, resize EfficientNet-B0 ImageNet-1K 1 × 10 − 3 1 × 10 − 5 100 × 0 . 1 e very 30 32 flip, resize Swin-T ImageNet-1K 1 × 10 − 5 1 × 10 − 5 100 × 0 . 1 e very 30 32 flip, resize T able 10. Shared pre-pr ocessing. Ensures identical inputs across backbones; isolates model differences. Stage Operation (applied to all models equally) DICOM handling Con vert MONOCHR OME1 to MONOCHR OME2; remove text b urn- ins. Fore ground mask Define M = { ( x, y ) | I ( x, y ) > 0 } ; ex- clude background from histograms. Harmonization Foreground CDF matching to low-energy reference (Eqs. 1–8); training-free, model- agnostic. Resize/replicate Resize to 224 2 or 512 2 ; replicate grayscale to 3 channels for ImageNet backbones (Sec. 6.1 ). Augment Random horizontal flip (all backbones, all tasks). Normalization As in backbone defaults; no per-model spe- cial tuning beyond LR noted in Sec. 6.1 . 2
Original Paper
Loading high-quality paper...
Comments & Academic Discussion
Loading comments...
Leave a Comment