Exploring Novelty Differences between Industry and Academia: A Knowledge Entity-centric Perspective
Academia and industry each possess distinct advantages in advancing technological progress. Academia's core mission is to promote open dissemination of research results and drive disciplinary progress. The industry values knowledge appropriability an…
Authors: Hongye Zhao, Yi Zhao, Chengzhi Zhang
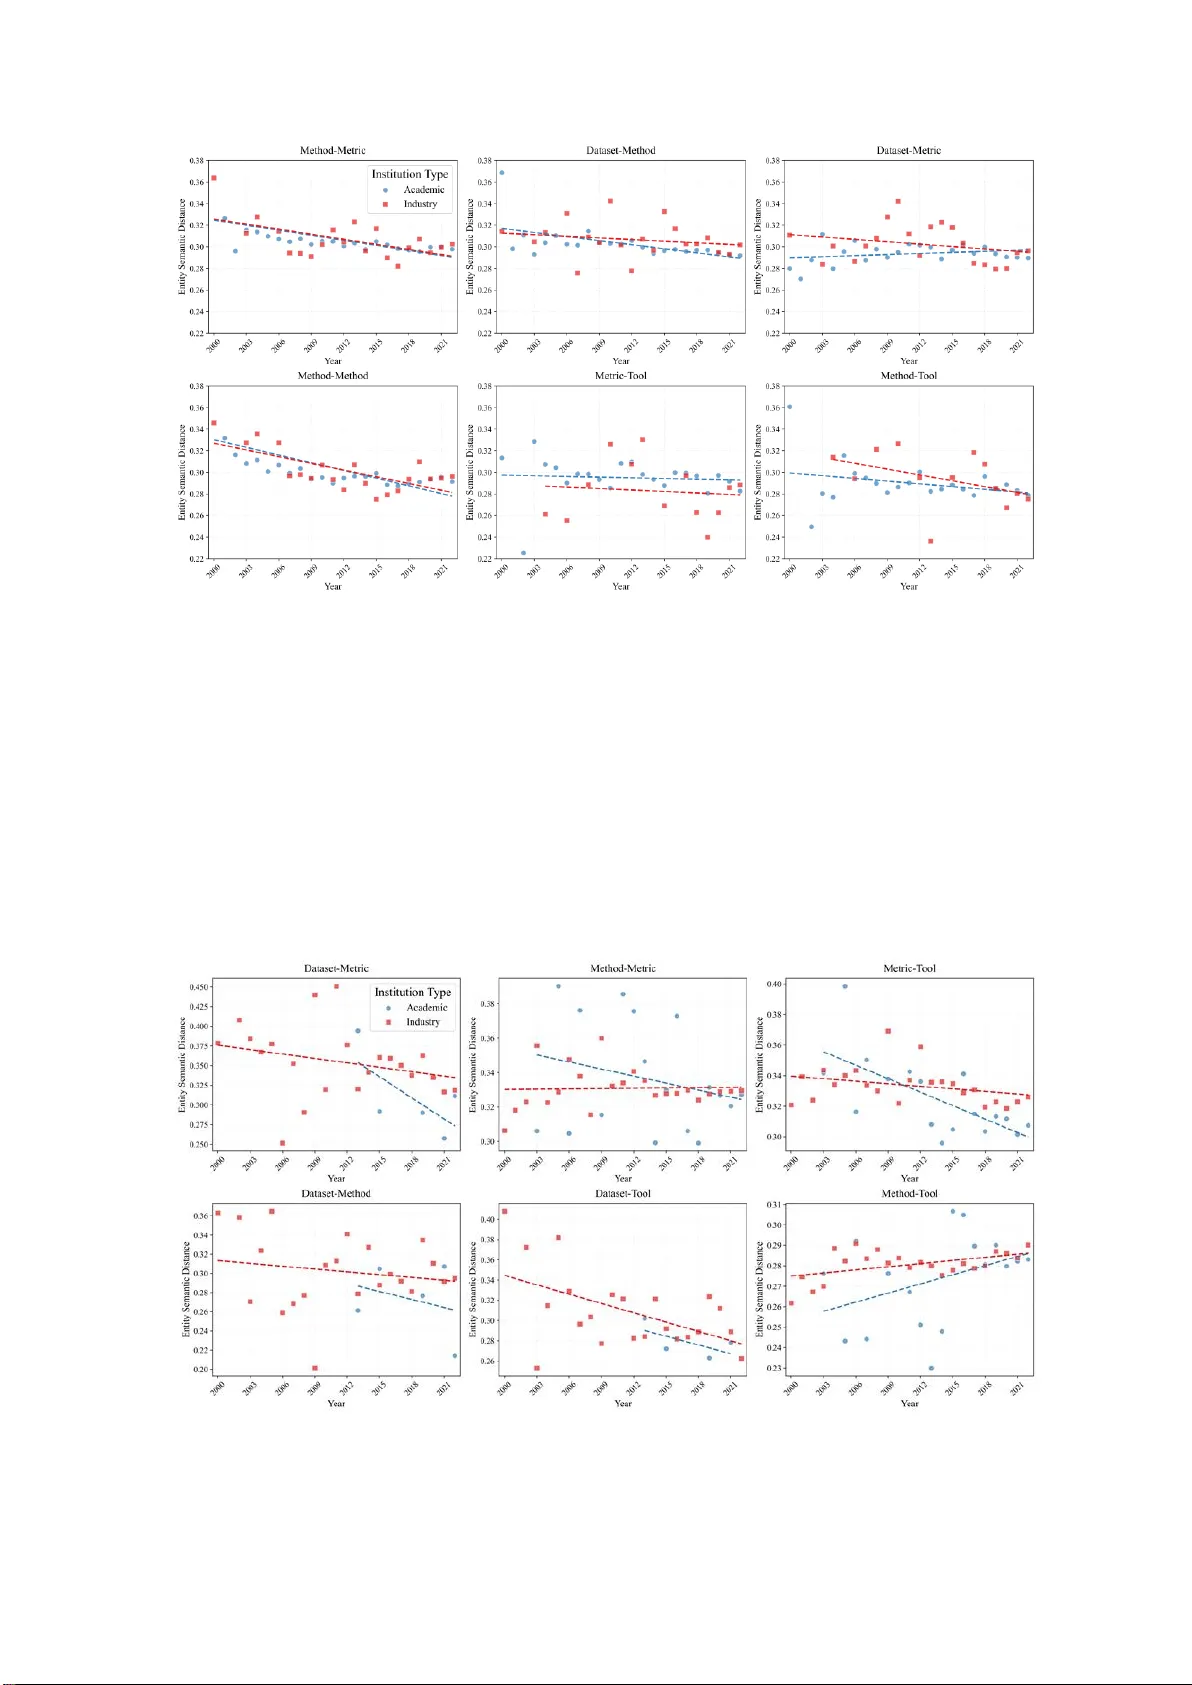
Exploring No velty Differences betwe en Industry and Academia: A Knowledge Entity -centric Perspective Hongye Zhao a , Yi Zhao b , Chengzhi Zhang a, a De partment of Information Management, Nanjing University of Sc ience and Technology, Nanjing, 210094 China b School of Management, Anhui University, Hefei, 230601, China. Abstract : Academia and industry eac h possess distinct advantages in adv ancing technologi cal prog ress . Academia's core mission is to promote open dissemination o f research results and drive disciplinary progress. The industry values knowledge appropr iability and core co mpetitiveness, yet actively engages in open practices like academic conference s and platform sharing, creating a knowledge strategy parad ox. Highly novel and publicly accessible knowled ge serves as the driving force behind techn ological advancemen t. However, it remains unclear whether industry or academia can produce more novel research outcomes. Some studies argue that academia tends to generate more novel ideas, while others suggest that industry researcher s are more likely to dr ive brea kthroughs. Previous studies have b een limited by data so urces and in consistent measures of no velty. To addr ess these g aps, this study conducts an analysis u sing four t y pes of fin e-grain ed knowledge e n tities (Method , Tool, Dataset, Metric) , calculates semantic distances b etween entities within a unified semantic space to quantify novelty, and achiev es comparab ility of n o velty across different ty pes of literature. Then, a regression model is constructed to analyze the differences in publication novelty between ind ustry an d academia. The results indicate that academia demonstrates higher no velty o utputs , which is particularly evident in patents. At the entity level, both academia an d industry emphasize method-driven advancements in papers, while industry hold s a unique advantag e in datasets. Additionally , academia -industry collaboration has a limited effect on enhancing the novelty of research p apers , but it helps to enhance the novelty of patents. This fram ework overcomes the limitations of literature type, providing a gen eralizable tool for comparing novelty b etween academia and industry. We release our data and associated codes at h ttps://github.co m/tinierZhao/entity_no velty. Keywords : Fine-g rained knowledge entities; Nov elty of literature; Unified sem antic space; Appr opriability and openness Introduction Academic research focuses on theoretical inquiry and the advancement of fundamental science, aiming to expand human knowledge and drive disciplinar y progress (Merton, 1973; Sauermann & Stephan, 2010). In contrast, the industrial sector emphasizes core comp etitiveness (Geisler, 1995), prioritizing economic returns and often safeguarding int ellectual appropr iabilit y by restricting the disclosur e of research outcomes (Chirico et al., 2020). Following thi s logic, t he indust ry would typically choose to limit the disclosure of novel research outcomes to safeguard its competit ive advantage. However, this traditional notion is being challenged in the field of artifici al intelligence (AI). Although different from the in stituti onal positioning of open knowledge sharing in academia, the industry act ively explores openness while maintaining core competi tiveness (Zhao et al., 2026). For example, leading tech companies have released cutti ng-edge technologies in algorithms and models, such as the BERT model (Devlin et al., 2019) and var ious other open-source large language models. Additionally, they have signi ficantly lowered the barriers to adopting artificial intelligence technologi es by offering application programmi ng interfaces (APIs) an d detailed technical docume ntation. Moreover, the industrial sect or’s active participati on in the most active and popular AI conferences has spurred numerous disruptive innovations (Liang et al., 2024). While these measures reduce knowledge appropriabilit y, they yield significant benefits: attracting developer communiti es to cut maintenance costs while generating revenue through technical services, and enabling access to external knowledge via collaborat ions to sustain technological leadership, foster product optimizati on through knowle dge spillovers (Jiang et al., 2024), and expand market share . This raises an unresolved question: do industry research o utcomes exhibi t lower novelty than academia ’ s? Currently, schol ars are still divided on the issue. Some scholars argue that academia contr ibutes more novel ideas, while industry tends to adopt and refine academi c advancement s (Bikard & Marx, 2020). Subsequent studies further confirm academia ’ s l eadership in AI inn ovation (Liang et al., 2024). H owever, Dwivedi et al. Corresponding author . E-maiL : zhangcz@njust.edu.cn. (2021) suggest t hat industry r esearchers are more likely to drive ne w A I technologies. The rise of pre-trained models such as Transformer and GPT, along wi th the rapid devel opment of large-scal e language model s like ChatGPT, Ahmed et al. (20 23) highlight s the ind ustry ’ s dominance in computat ional resources, data, and talent. As a key branch of artifi cial i ntelligence, NLP has witnessed a surge of groundb reaking achievem ents from both academ ia and ind ustry, making it a typical scenario for exploring t his quest ion. Patents and papers are the main scientific and technical outputs in academia and industry. Patents carry technology and business knowledge, and their text a nalysis is an impor tant tool f or tec hnology development and management (Arts et al., 2021; Lee et al., 2009). As the core of basic research, papers are the key medium for academ ic e xchanges (Ba et al., 2024). This stu dy measures the no velty of indust ry and aca demia t hrough patents and papers. However, evaluating the novelty of scientific and technical literature is inherently challenging. Multiple studies have confirmed that highly innovative research is difficult to identify during peer revi ew (K oppman & Leahey, 2 019; Lia ng et al., 2023; Riera & Rodrí guez, 2022; Wang et al., 2017). In addition, the current research on novelty in AI primaril y focuses on papers (Chen et al., 2024; Liang et al., 2024) and fails to comprehensi vely consid er various scientifi c and technical literature such as patents. This research limit ation does not stem from issues of data availability but rather from differences in the methods used to evaluate novelty between patents and scientifi c papers. For scientific paper s, novelty is typically measured through journal citati on pair analysis (Lee et al., 2015; Uzzi et al., 2013; Wang et al., 2017). Moreover, the clas sificati on codes commonly us ed in patents cannot be al igned with those used in sci entific papers (Verhoeven et al., 2016), making it impossi ble to reconcile the two. Additionally, some studi es have attempted to conduct evaluations based on sentence-level semantics (Jeon et al., 2022, 2023), but sentence semantic vectors are easily influenced by academic writing styles, and the writing styles of patents and papers differ signi ficantly, r esulting in incompat ibility with this m ethod. By further focusing on knowl edge elements in the lit erature, precise alignment of measurements can be achieved through refining the granularit y of their representati on and relying on a unified conceptual spa ce constructed by word embedding models. As noted by Aceves and Evans (2024), concepts and conceptual spaces serve as crucial knowledge foundati ons for the development of numerous organizational theories. Even when knowledge is expressed in different forms across various scenarios, the semanti c connections and differences among them can be quantified through a unified word embedding model (Aceves & Evans, 2024). This study addresse s the gap by using a unifi ed novelty evaluat ion framework that lever ages fine-grained knowledge entities to assess the novelty of publicat ions across acad emia, industry, and their collaborations in NLP. S pecificall y, we m ap these fine-gr ained know ledge entities to a uni fied conceptual space (Aceves & Evans, 2024), calculat e the semantic distances between fine-grained knowledge entiti es, and assess the difficult y of different entity combinat ions. Specificall y, we address the following three researc h questi ons: RQ1 : How to unify the nov elty calculation method based on fine-grained knowledge entities for both papers and pat ents? RQ2 : How do novel ty manif estations differ across entities in var ious insti tutions and document types? RQ 3 : Is there a difference in the novelty of scientific and technical literature between industry and academia? The contribut ions of this pa per are as f ollows: First, this s tudy extracts know ledge entities from patents and papers, mapping both to a unified semantic space construct ed by SciBERT. By calculating the semantic distance between entity pairs to quantify combination difficulty, this fram ework pres erves fine-grai ned int erpretabili ty at the ent ity l evel whil e providing a fou ndation for n ovelty comparison across document s. Second, existing research is constrained by relying on a single type of lit erature, and conclusions remain inconsistent . This st udy integr ates top conference pap ers wi th the United States Patent and Tradem ark Office (USPTO) patent dataset to achieve rel iable validat ion of the research hypot heses. The code and data used in this study are open -sourced on G itHub and can be accessed via the following website: htt ps://git hub.com/tini erZhao/entit y_novelty. Related work For the research questions proposed in this paper, w e conducted a revie w of the scientific and technical literat ure on novelty measur es, as well as the fact ors influenci ng novelty. Novelty measures i n the scienti fic and technical literature The measurement of novelty helps identi fy valuable innovations in advance and provides key insights for technological transfer and innovat ion. Currentl y, novelty is primarily measured through com binations, as Nelson and Winter (1985) argued, “ the creati on of nove lty mainly involves the recombi nation of exist ing conceptual and physical mat erials ”. Traditional methods for measuring novelty include the use of journal pairs and classi fication code pairs t o assess the novel ty of li terature. Wi th the avail ability of large- scale data and the adv ancement of machi ne learning and n atural languag e processing technol o gies, novelt y measurement methods have been continuously innovat ed. The combinati on of other types of knowledge elements has gradually become an important approach for assessing novelty. A ddition ally, some studies have explored new avenues by treating novelty as a binary classif ication task, using classificat ion or outlier detection met hods to distinguish bet ween novel and non- novel liter ature. From a combinati on-based view, ear ly meth ods pr imaril y f ocused on citation reference s and cl assificat ion codes. Uzzi et al. (2013) compared the observed and Monte Carlo-simulated frequencies of journal pairs to calculate the z-scor e for each pair, using the lowest 10th percent ile z-score to indicate a paper ’ s novelt y and the median z-score to indicate its conventi onality. Lee et al. (2015) impr oved Uzzi ’ s method in terms of computational difficulty by adopting a multi- year time window, which reduced the previous single-year window and calculated the commonness of citation pairs. Wang et al. (2017) measured novelty through the first-tim e combination of different citation journal pairs in a paper. Specifically, they constructed a co-cit ation matrix for the journals an d used cosine simil arity betwe en the ve ctors of each journ al t o assess the diff iculty of combining t he journal pairs. Regarding patent novelty measurement, early traditional methods focused on patent classification codes and backward citations (Lee & Lee, 2019; Verhoeven et al., 2016). However, citati ons merely describe existing technologies and fail to reflect the technology of the patent itself, often presenting incomplete and biased represe ntations (Arts et al., 2021). Measur ing technol ogical novelty t hrough patent IP C codes (Fleming, 2001) is overly broad and tends to capture interdisciplinari ty rather than technological uncertainty. With the cont inuous development of NLP technologi es, tasks such as scientifi c terminology extraction (entiti es, keywords) and semantic embedding have matured, measuring novelty based on scienti fic text content is a m ore reasonable and eff ective approach . Liu et al. (2022) used the BioB ERT model to calculate the semantics of biological entities, determini ng entity pair novelty based on semantic similarity. The novelty score for each paper is calculated as the proportion of novel entity pairs to the total possible entity pairs . Similarl y, Chen et al. (2024) applied an entity similarit y-based approach to evaluate the novelty of conference papers in NLP. Luo et al. (2 022) employed BERT word embeddings to measure novelty by assessing the novelty of research questions, methods, and their combinat ions. Arts et al. (2021) extracted keywords from patent titles and abstracts, calculating “new_ngram” and correspondi ng “new_ngram_ re use” to measure patent novelty. Wei et al. (2024) used the BERT model to extract innovative sentences from patent claims and distilled them into knowledge element triples, measuring novelty scores for the triples by projecting entities and relati ons into a common space. Shi and Evans (2023) measure research novelty by leveragi ng hypergraph embeddings to capture high-dimens ional content correlations. Their findings reveal that breakthroughs more fr equently em erge from “kn owledge expedi tions” rather than traditi onal interdisci plinary team s. From the perspe ctive of bina ry classification, Jang et al. (2023) treated patent novelty as a classificat ion task, using RoBERTa for semantic embedding of patent claims to develo p a self-explainable novelty classifi cation model. Jeon et al. (2022) embedded patent claims and used the local outlier factor (LOF) algorithm to calculate patent novelty. Their study sho wed that, although ELMo and BERT provide high- quality patent embedding vectors, they are less suitable for modeling the technological features of patents, particular ly in single technical domains, comp ared to Doc2 Vec. X. Liu et al. (2025) const ructed an unsupervised learnin g frame w ork using the Doc series model and the LOF. Jeon et al. (2023) trained a FastText model using paper titles in the biomedical field and applied the LOF algorithm to measure the novelty score of each paper. From the above-mentione d studies, the methods for measuring novelty have evol ved from the early approaches relying on citati on and classif ication co des to those based on text conte nt analysis. However, there are stil l shortcomings in evaluati ng novelty. First, early methods based on citations (Lee et al., 2015; Uzzi et al., 2013; Wang et al., 2017) and patent classif ication codes (Fleming, 2001; Lee & Lee, 2019; Verhoeven et al., 2016) suffer from inherent flaws: citation metrics are affected by sel f-citati on bias, incomplete records, and may confuse "interdisciplinari ty" with "novelty" (Fontana et al., 2020), and the computational cost of anal yzing large-scale data is proliferating and inefficient . Patent classificati on codes are overly granular and diff icult to align with papers. Although text-based methods have improved the granularity and int erpretabil ity of m easurements in r ecent years, existi ng r esearch mostly f ocuses on a si ngle field (or paper s or patents) a nd lacks a framework f or uniformly assess ing the novelty of the two. In the following chapters, fine-grained knowledge entities will be unifor mly extracted from papers and patents, mapped to a shared conceptual space constructed based on w ord embeddings, and novelty will be evaluated by calculating se mantic distance. This framework not only retains the in terpretabil ity and fine- grained advantages of the subst antive method but also provides a unified basis for cross-domain novelt y comparison bet ween papers and patent s, filli ng the gap in cur rent evaluati on tools. Factors influenci ng the novelty of scientifi c and technical l iterature Previous st udies have explored the relationship between novelty from various p erspectives, incl uding institut ional nature, t eam size, and aut hor attribut es within team s. Regarding team size, existing research presents inconsist ent findings. Uzzi et al. (2013) found that resear ch teams are more likely to introduce novel combinati ons w ithin familiar knowledge domains compared to single-author papers. Lee et al. (2015) identified an inverted U -shaped relationship between team size and novelty, with t his effect lar gel y driven by the interplay between team si ze and kn owledge di versity. Wu et al. (2019) suggest ed that smal ler t eams are more likely t o disrupt science and technology with new ideas, whil e larger teams tend to focus on existing ones. Shin et al. (2022), using Web of Science data, found that scientifi c collaborati on negatively affects novelty, as collaborative research tends to remain within established fields. However, Wu et al. (2024) argued that collaboration fosters trust and problem-solving abiliti es, and that knowledge diversity enhances knowledge transfer and promotes the impact of science on technology. Conversely, some studies indicate that excessive team heterogeneity may reduce trust, hinder knowledge sharing, and obst ruct innovation (Chen et al., 20 15). At the author attribute level within teams, teams with diversifi ed expertise tend to produce more original work and have a long-term advantage in terms of impa ct (Zheng et al., 2022). Mori and Sakaguchi (2020) examined how differentiated knowledge amo ng inventor s enhances patent novelty usi ng Japanese patent s. Gender diversi ty within teams has also becom e a favored t opic in recent year s. Teams with gender di versity produce papers w ith hi gher novelty and greater impact compar ed to single-gender t eams (Yang et al ., 2022) . Liu et al. (2024) explored the relationship between novelt y and gender heterogeneity in doctoral theses, finding that female authors had lower average novelt y scores than male authors, and male advisors were more likely to supervise students who produced theses with higher novelty. Notably, this gender difference was more pronounced in lower-prest ige universities. Similarly, Chan and Torgler (2020) found that among elite scientist s, female sci entists tend to recei ve more ci tations t han their mal e counterparts. At the institutional level , academ ia tends to lead indust ry in t erms of novel ty at the pap er level, ge nerating mo re explorator y ideas , w hile industry is more likely to produce high im pact pap ers (Liang et al., 2024) . Chen et al. (202 4) m easured the novelty in the N LP field, finding that academia and collaborative instituti ons tend to be more novel than industry, based on fine-grai ned combinations of knowledge entities . Other st udies suggest that papers involving companies have a higher impact, and collaborations between industry and academia exhibi t greater n ovelty (Jee & Sohn, 202 3). Chen et al. (2024) share similarit ies with this study in exploring novelty within the NLP domain. However, this research further incorporates patent data to compare novelty performance between academia and industry across both types of literatur e. It is important to note that th is is not merely a dat a expans ion exercise. Instead, it is grounded in a unified bottom-up conceptual space, leveraging word embedding models to establish comparabili ty in semant ic dist ances bet ween entiti es across different t ypes of sci entific l iterature (Aceves & Evans, 2024). This approach offers greater versatility, transcending limitat ions imposed by document types and writing styles, and demonst rates superior scalability. Compared to Chen et al. (2024), which focused solely on entity frequency distribution and type proportions, this study further analyzes trends in semantic distance vari ations across different i nstitutions wit hin various i nnovation categ ories. Additionally, we comprehensivel y address the issue of “diminishing marginal returns in in novation with i ncreasing component count” (Fleming & Sorenson , 2001), which was not explored in Chen ’ s research. Further more, our findings diverge from theirs: we observe that academia-indust ry collaboration has a limited impact on enhancing paper novelty, consist ent wit h the conclusi ons of Liang et al. (2024) . This study examines the n ovelty performance of different institutional types in patents and papers. Currently, research on instit utional types at the substantive level remains scarce and is largely confined to single datasets. A lthough academia and industry produce abundant papers and patent s, respectively, few studies have employed a comparative framework to assess the novelty of these two sectors across mult iple types of scient ific lit erature. Methodology This study aims to quantify the performance of different team composit ions on the novelty of scientific and technical l iterature. The research fr amework in Fi gure 1 outlines four key phase s: Phase 1. Da taset constructi on: We constructed an origin al dataset that includes scientifi c and technical literat ure in the NLP field, c omprising papers and pat ents publ ished bet ween 2000 and 2022. Phase 2. Entity ext raction: Fine-grained knowledge entities were extr acted from both scient ific papers and patents, with t he knowledge from scientific paper s being t ransferred to pat ents. Phase 3. Novelt y measurement: A unified pre-trained model is applied to obtain the semantic vectors of each extracted knowl edge entity. The difficulty of combining these entities is measured based on the semantic distance between them (Che n et al., 2024; Liu et al., 2022, 2024). We then use this semanti c distance-based method to evaluat e the novelty of each d ocument. Phase 4. Regression modeling: Conducted a combined regression analysis on the standar dized data to reveal the overal l novelt y trends across di fferent li terature t ypes. Subseque ntly, separate regressi on analyses were performed for patents and papers as a heter ogeneity test to examine whether the obse rved trends varied by literat ure type. Figure 1. Frame work of this s tudy Data collect ion Both p aper a nd patent dat asets of this st udy are deri ved f rom the unified NLP field. Paper data was collected from the ACL Anthology 1 website. We selected three repre sentative conferences for our study: ACL (Annual Meeting of the Association for Computational Linguistics) , EMNLP (Conference on Empirical Methods in Natural Language Pro cessing), and NAACL (North Am erican Chapter of t he Associati on for Computational Linguistics ). A total of 17 ,783 full -text papers f rom 2000 to 2022 were collected. The patent data was collected from the United States Patent and Trademark Office (USPT O) through the PatSnap 2 system. We conducted a search for patents withi n the tim e frame of 2000 to 2022, using the following query: CPC:(G06F 40* 3 ) AND APD:[20000101 TO 20221231] AND COUNTRY:US. We focused on invent ion pate nts and filtered out those with legal statuses such as withdrawal, rejection, abandonment, application termination, or complete invalidati on. Addit ionally, patents with the same priorit y were consolidated i nto famili es. Ult imately, a t otal of 25,305 p atents were o btained. Institut ional type class ification For the classifi cation of authors ’ institutional types in papers, we b uilt on the work of Chen et al. (2 024), who manually integrated the Global Research Identification Database (GRID) 4 . We further supplemented the missing institutional data for papers in our database by combining manual annotation with OpenAlex queries , 1 https://aclanthology .org/ 2 https://www . patsnap.com/ 3 CPC: G06F40, Handling natural language data 4 The Global Research Identificati on Database (GRID) classifies institution types into eight categories: government, education, company , facility , healthcare, nonprofit, archive and other . GRID collects institution names globally and supplements institution data, such as country and city of location, using W ikipedia (www .wikipedia.org) and GeoNam es (www .g eonames.org). aiming to address the issue of missing institut ional information for papers (Zhang, Cao, et al., 2024). It should be noted that OpenAlex adopts the same institutional classification standards as GRID, with both being based on the Research Organization Registry 5 (ROR) system . The system includes the following types of institut ions: education, com pany, facil ity, nonprofit , government , healthcare, archi ve, and other. Fi nally, we completed the author information a nd their correspond ing instit utional affiliati ons for 17,783 papers. For each author, following previous research, we considered the first-listed institution as the author ’ s primary affiliation (Hottenrott et al., 2021). At the institutional classificat ion level, given that this study aims to explore novelty differences between the academic and industrial sectors, we focused on two categories: academic instituti ons and industrial institut ions. Specifically, institutions categorized as “ company ” were classifi ed into the industrial sector, while those categorized as “ education ” were classif ied into the academic sector. Addit ionally, in line with the definition criteria from existing studies (Chen et al., 2024; Xu et al., 2022), for healthcare- type institut ions, the main purpose of their publications is research-oriented, so we classi fy educ ational and healthcare institut ions into the academic category. As for other types of institutions, they are not covered in this s tudy, so we ignore them . Specially , a paper is classified as “ A cademia” if all its authors are affil iated with a cademic institutions (such as universiti es or r esearch institutes), as “ I ndustry” if al l author s are af filiated with industry institut ions (such as compa nies or corp orations), and as “ C ooperat ion” if it involves authors from both academi a and industry. If t he paper cont ains neit her industry aut hors no r academic authors, it is c ategori zed as “Other” . The patent data processing begins with extracting standardized applicant information from databases, where all non-personal names are presented in either Chinese or English. An Edit distance algorithm (Levenshtein, 1965), combined with a local dictionary, is then applied to normalize institut ional names. Based on lexical features, two sets of keywords were defined: one for academic instit utions and one for industrial organizations, covering both English and Chinese terms. The algorithm classifies institutions containing education- related terms (such as “ edu ” , “ univer ” ) as academic, and those with compa ny- re lated terms (suc h as “ inc ” , “ ltd ” , “ lp ” ) as industri al. This method ens ures effici ency and ac curacy, as the databas e provides standardized applicant fields. For unrecognize d instit utions, spaCy 6 named entity recognition is used to determine w hether the applicant is “Individual” . For individual applicants appearing more than twice , we validate with ChatGPT to check for missed categ orizations from industry or academi a (prompt see Appendix Table 5). Those confirmed as individual applicant s through ChatGPT verification will be categorized as “Individual”. A ll unidentified institutions that cannot be assigne d to academ ic, industr ial, or individual categories through the above process are defined as “Other”. Finally, the results are manually reviewed to cor rect and supp lement the algorit hm ’ s outpu t. The specifi c instit utional distri bution for papers a nd paten ts is shown in Table 1. Table 1. The insti tutional dist ribution of sci entific and techn ical literature Instituti on T ypes Count Ratio (%) Count Ratio (%) Paper Patent Academia 1 1,965 67.28 470 1.86 Industry 1,409 7.92 21669 85.63 Cooperati on 3,652 20.54 71 0.28 Individual 0 0 2932 1 1.59 Other 757 4.26 163 0.64 Knowledge entity extrac tion and nor malization This study draws on the classical theory of combinatorial novelty (Fleming, 2001; Uzzi et al., 2013), measuring novelty based on atypical combinations of knowledge component s. This degree of atypical could be quantif ied by cal culating semantic di stance, a m ethod w idely adopt ed in bibliomet rics (Chen et al., 2 024; Liu et al., 2022, 2024). Consider ing that most natural language processing research typically encompasses the following key elements: 1) dataset construction or selection, often involving text resources such as corpora and dictionaries, which serve as the foundation for model training and validation; 2) method selection and application, which defines the strategies and steps for solving problems; 3) the choice of evaluation 5 https://ror .org/ 6 https://pypi.org/project/spac y/ metrics, used to measure model performance and task quality; 4) the use of tools, including programming languages, sof tware, and open-source t ools requi red for implement ing and testing N LP met hods (Pramanick et al., 2025; Zhang, Zhang, et al., 2024). Based on this framework, w e extract fine-grained knowledge entities from each patent and paper , covering t he categor ies of Met hod, Tool, Metric, and D ataset. In the fine- grained knowledge entity recognition task, we used the pre-trained SciBERT model. Due to differences in writ ing st yle and text structure between patents and papers, we t rained se parate entity recognition models for eac h type of document. Specifically, for papers, we adopt ed the fram ework pr oposed by Zhang et al. (2024). For patents, we initially applied a pre-trained model to annotate the patent texts, followed by re-annotati on of the extracted entities according to the labelling rules. Additionally, for unique entities in patent texts, such as Storage medium, w e performed extra annotat ion. After several rounds of iterati on and adjustments, we obtained the pat ent ent ity recognition model (SciBERT + CRF), which achieved the fol lowing performance: Precision of 78.8 3%, Rec all of 82.51%, and F1 sc ore of 80.63%. Giv en that extract ing entiti es only f rom titles and a bstracts w ould m iss many , we perf ormed f ull-text extracti on for both patents and paper s. Pap er data were extract ed from PDFs, and t he patent databas e was also exported in full text. For entity normalization, we used Edit distance (Levenshtein, 19 65) to cluster entities. Ultimately, we identified 37, 236 entities in t he papers and 9,5 23 entities in the patent s. Appendix Table 4 presents the top 5 entities in each category for both patents and papers. Since patents are rarely evaluated on public datasets, the proportion of Dataset entities in patent s is quite low, and as a result, the r ecognition perfor mance for these ent ities is somewhat weaker. Addi tionally, a di stinctive f eature of patent terminology is its level of abstraction, parti cularl y evident in the claims section. Unlike general discourse, which relies on precise w ording to accurately convey content and avoid vague or overly broad terms, patent claims intentionally use generalized vocabul ary (Codina-Filbà et al., 2017). This strategy enables companies to broaden the scope of their intellectual property protection, ensuring more extensive exclusivit y over their innovations (Ashtor, 2022). Furthermore, descriptions of Tool entities in patents tend to be more ge neralized, ref lecti ng this sit uation. Semantic di stance-based novelty measure ment We explore the novel ty of enti ty combinations through an analysis of the fine-grain ed knowledge entities extracted from scientific and techni cal literature. We draw on t he work of Liu et al. ( 2022, 2024) i n the fi eld of scientific novelty assessment for biomedical papers. They treated biological entities as core elements of the research meth od and used the pre-trained Bio-BERT model to quanti fy the semantic distance between these entities to measure novelty. We applied this approach to evaluate the novelty of papers and patents in NLP, using pr e-trained Sci BERT to calculate the s emanti c simil arity of enti ties for novelty m easurement. Specificall y, when using SciBERT for embedding processing, we analyze its built-in [CLS] token. This token serves as the starti ng point of a sentence and aggregates the contextual infor mation of the entire sentence, thus serving as the vector representation of the entire sentence. Based on this characteristic, we treat patent entity phrases as short sentences and obtain the semantic vector represe ntation of the patent entity by outputting t he vector at the [CL S] position. To concretize t he semantic vect or repre sentation, we take the NLP core entit y “transformer ” as an illust ration: we input the ent ity to SciBERT in the standardized format, and the model outputs a 768-dimensi onal dense vector via the [CLS] token. The first 5 dimensions of this vector are presented below: [3.70797575 e -01, 1.42690563e +00, -8.87082458e- 01, -5.18282456 e-03, 5.78712046e -01, … (subseq uent 763 dimensions omi tted)] For an entity pair , the dist ance between the two is denote d as D , and represents the semantic si milarity bet ween the enti ties. We marke d the top 10% of entit ies with the high semantic distance as high novelty entities. Finally, we analysed the frequency of these high novelty entities in the text and measured the novelty of each paper based on their proport ion in all ent ity com binations. Analysis of novel ty differ ences To investigate the differenc es in novelty across various i nstituti ons, this study employs regression analysis to quantify and compar e the novelty demonstrated in the scientifi c and technical literature produced by different institutions. The f ollowing se ctions provide a detailed descript ion of th e process of variable selection and t he constr uction of the regr ession mo del. Dependent variables: In t he sett ing of independent variables, w e first use the cont inuous novel ty indi cator (Novelty Score) calculat ed in the previous section for analysi s. This score measures the proportion of novel entities in each paper or patent, valued between 0 and 1, where a higher score signifies greater novelty. It enables comparison of mean novelty output differences between industry and academia. Second, to address potential uncertainty in nov elty outcomes and validate conclusion robust ness, we define the top 10% of papers/patent s ranked annual ly by t his score as “high novelty” and c onstruct a binary variable ( NS Top) (Jeon et al., 2022), coded 1 for the top 10% and 0 otherwise. This variabl e primarily serves to analyze which type of sector is m ore likely t o generate hi gh novelty papers/p atents. Independent variables: T his study defines the independent variables as the type of institut ion. After excluding instituti ons categorized as “ other ” and “ individ ual ” , the remaining instituti ons are classifi ed into three categories: academia, cooperation, and industry. Specifical ly, two binary variabl es (Academ ia and Cooperati on), are defined . The Academia variabl e is set to 1 if the literature belongs to an academic instituti on, and the C ooperation variable is set to 1 for literat ure from coop erative inst itutions, wit h both variables set t o 0 for liter ature from i ndustry. Control variables : To eliminat e the interference of other factors and identify the net effect of insti tutional type on novelty, this study included multiple control vari ables. First, team-related variables were consi dered, including the numb er of institut ions (Institut ions num) and the number of authors or invent ors (Au/In num). This is because large R&D teams typically possess broader and more extensive knowledge bases, and collaborati on among team members can increase opportunities for cross-disc iplinary knowledge integrati on (Wu et al., 2025). Additi onally, such teams tend to conduct developmental research (Wu et al., 2019), and their characteristics may influence novelty. For patents, we also include t he size of the patent fam ily (Family size), which is commonly associated w ith w elfare value and technological impact (Kabore & Park, 2019) . Furthermore, the number of I PC classi fication codes at the subgroup level ( IPC num) is controlled to account for the diversity of the patent ’ s knowledge components (S un et al., 2022). Addit ionally , consideri ng that t his study cal culates novelty t hrough entity combinations, the number of entities (Entity num) is al so incl uded as a control variable to elim inate the interference of entity quantity. Furthermore, year dummy variables were introduced to contr ol for potential annual differences that could influence t he results. For cont inuous co ntrol variables, following the method of Wu et al. (2024, 2025 ), a log transformation was applied to address their skewed dist ributions. When performi ng regression, we only retained scientific literature from industry, academia, and academi a- industry collaborations. In additi on, we excluded outli ers: entries with fewer than five entities and novelty scores of zero. The final dataset contained 16,295 papers and 20,934 patents. The summary statistics of the variables and the correlation coefficients between the variables are presented in Table 2 and Figure 2 , respectivel y. We found a strong correlati on between the continuous and discrete forms of the dependent variabl e (novelty), w hile the correlations between the independent and dependent variables were weak. We then calculated the variance inflation factors (VIFs) for all explanator y variables to assess multicoll inearity. The VIF for paper s was 2.30 and for patents was 1.0 6, both below the threshold of 5 (Ma rcoulides & Raykov , 2019). These r esults indicat e that m ulticoll inearity has minimal impact on our model, ensur ing the rel iability of the estim ates. Table 2. Summary statistics of var i ables for regress ion analysis (N = 20,934 pa tents, N = 16,295 papers) V ariable Paper Patent Mean Std. Dev . Min Max Mean Std. Dev . Min Max Novelty Score 0.10 0.06 0.01 0.52 0.12 0.07 0.01 0.67 NS T op 0.10 0.30 0 1 0.10 0.30 0 1 IPC num - - - - 1.95 1.00 1 10 Family size - - - - 2.08 1.94 1 82 Au/In num 3.82 2.24 1 77 3.30 2.13 1 26 Institut ions num 1.84 1.24 1 44 1.05 0.42 1 15 Entity num 34.93 14.53 8 153 29.81 14.95 8 98 Academia 0.70 0.46 0 1 0.02 0.14 0 1 Cooperati on 0.22 0.41 0 1 0.00 0.05 0 1 Note: The p apers do not i nclude IP C numbers or Family size, which are represente d as “ - ” . Then multivari able regression was conducted to examine how differ ent types of institut ions influence the novelty scores of the li terature. Where represents the novelt y score of each lit erature . The independent variables and indicate whether the literature is from an academic or cooperat ive institut ion, respectivel y. The variable Controls includes a set of control variables, denotes the publication year, and represents the error term in the model. To fur ther refine the analysis, this study constructed a logist ic regression model to verify the robustness o f research conclusi ons and analyze wh ether insti tutional t ype correlates with literat ure being highly novel . eq uals 1 i ndi ca te s tha t t he ith do cum ent be long s to the top nov el ty liter atu re of t hat yea r. It should be noted that the formula does not include an explicit residual term, as logistic regression uses maximum likelihood estimation (MLE) for model fitting, rather than the ordinary least squares (OLS) method used in linear r egression. Therefore, t he error term is not di rectly incl uded in the mod el expression. Figure 2. Pearson c orrelation co efficient matrix (a) Correlation be t ween variables in papers (b) Correlation be tween variables in patents However, OLS regression focuses on the effect of ind ependent variabl es on the mean of the dep endent variable, the logistic regression model concentrat es on a single extreme outcome. To fully examine how institut ional types shape novelty across the entire distribution of novelty scores, we further employed quantile regression. By estimati ng the conditional ef fects of indepe ndent vari ables at specific quant iles of the novelty score, this m ethod compl ements the t wo aforement ioned model s. The model specifica tion is as follows: Where denotes the quantile function, represents the target quantile (with ), and indicates the conditional effect on the novelty at the quantile. Specificall y, w e examined the 25th, 50th, and 75th quanti les, w hich c orrespond to lo w , me dium, and high novel ty level s, to observe how different types of institut ions perform across these heter ogeneous n ovelty quant iles. It can be observed that the distribution scales of the novelty scores for patents and papers exhibit significant differences in Table 2. Direct ly condu cting a pooled analysis may lead t o result biases du e to sc ale inconsistency. To address this issue, this stud y first applies the z-scor e standardizat ion method to separatel y transform t he patent and pap er data. By mapping t he raw dat a to a standard norm al distr ibution with a m ean of 0 and a standar d deviat ion of 1, the scale differenc es between different data sources are eliminated, enabling fair comparison and pooled an alysis of the novel ty scores of patents and papers under a unifi ed standard scale. The transformati on formula is a s follows : where represents the raw novelty score, the population mean of this indicator, and the population st andard deviation. Results This study analyses papers published between 2000 and 2022 in three r epresentati ve conferences and patents filed with the USPTO, focusi ng on the novelty differences across three types of publishing institutions : academia, industry, and collaborati on. Our research compares the performance of different instituti on types in terms of novelty in literature and investigates the relationship between team size and novelty. The aim is to reveal ho w team size i nfluences i nnovation acr oss diffe rent types of scientifi c and techni cal liter ature. Trends in publ ication vol ume of papers and patents The field of N LP has experi enced rapid growth, with a s teady annual increas e in patents and papers since 2000. The slight decrease in patent numbers in 2022 compared to 2021 is due to the America Invents A ct (AIA), Section 35 U.S.C. § 122(b), which requires patents to be publi shed 18 mont hs after the earliest filing date, unless the applicant requests early publicati on. As of the retrieval date, some 2022 patents had not yet been publishe d, which is co mmon. Figure 3. Annual pub l ication volum e of papers and patents. (a) Annual publ i cation volume o f papers (b) Annual publ i cation volume o f patents In addition, the distribut ion of patent num bers across i nstitut ions is more uneven compared to papers, with specific proportions detail ed in the previous section on i nstituti onal dist ribution. Despi te the concentration of the w orld ’ s top higher education resources in the U nited States and the majority of government research funding directed towards universities, university-originat ed patents account for less than 4% of the total national patents, with corpor ate patents dominating the majority, followed by individu al applications 7 . This phenomenon also exist s in the fiel d of NLP, with the ac ademic sector participati ng in significantly fewer patent applicati ons than the indust rial sector. The annual publicati on volume of paper s and patents is shown in Figure 3. Novelty measure ment results under a unified framework In thi s secti on, we addres s RQ1. We first use the ent ity r ecognition models discussed in previous cha pters to extract fine-grained knowledge entities from each paper and patent. Then, we leverage the pre-trained SciBERT model to obtain s emantic vectors for the entities in both patents and papers. We evaluate their novelty based on the semant ic distance between differe nt entities, with the overall distri bution of entity semantic di stance novelty sh own in Figure 4. 7 https://ncses.nsf.gov/pubs/nsb20204/invention-u-s-and-comparative-global-trends Figure 4. Semant ic distance di st ribution of f ine-grained knowledge ent ities (a) Se mantic distance distribu tion of paper en tities; (b) Semant ic distance distribution of patent ent i ties. These semant ic distances will be used t o determ ine simi larity. Speci fically, w e classify combinations into two types b ased on the sema ntic distance. Combi nations are classi fied into Novelt y (top 10%) and Com mon pairs by semant ic distance. Final novelty depe nds on the proportion of Novelty p airs to total pairs. To further explore the differences in the contribution of entit y combinati ons to novelty between patents and papers, we analyze the average semantic distance of four entity combinations in the top 10% of papers and patent s with the highest novelty. The results for paper s are presented in Appendix Figure 8, and those for patents i n Appendix Figure 9. Trends in novel ty manif estations acros s different entity types In this sect ion, we an swer R Q 2. Using t he degree of atyp icality in entity com binations as the core met ric for novelty, w e further analyzed the trends in semantic distance changes for entit y combinations in papers and patents, as sho wn in Figure 5 and Figure 6. Given the stud y ’ s focus on novelty, this sec tion analyzes o nly the top 6 rankings from A ppendix Figure 8 and Appendix Figure 9. Overall, as the field continues to evolve, the semantic di stance between e ntities shows a gener al downward trend. This phenomeno n reflects a narrowing gap in how patents and papers leverage prior knowledg e, indicating increasingly seamless integrat ion of knowledge within the domai n (Park et al., 2023). Specificall y, regarding the Method-Metric combinati on identified as the primary innovation model in the field, Figure 5 reveals that there is virtually no difference between indust ry and academia in terms of semantic distance for Method-Met ric entit y combinati ons. Further more, no significant difference exists between the two sectors in the semantic distance of Method-Method combinations. These findings indicate that both industry and academia focus on innovation at the methodological level, and their innovation pathways consistentl y maintain a hi gh degree of knowledge coherence within this di mension. Figure 5. Trend s in semantic d istance variat ions among d i fferent entity c ombinations in th e paper In Dataset- related entity combinat ions, the ind ustrial sector exhibits significantly higher semantic distanc e than the academic sector. This disparity highlight s the industry ’ s distinctivenes s in dataset innovation, a characterist ic closely l inked to its access t o larger -scale data resources (Ahmed et al., 2 023). With suc h dat a scale advantages, the industrial sector can suppor t forward-l ooking research. In cont rast, the academi c se ctor shows higher semantic dist ance than t he indust ry in Tool-Metric com binations. The industry ’ s lo wer semantic distance in this category may derive from its stronger focus on pract ical applications of mature technologies: this focus demands higher stabili ty for Tool-Metric compatibility, fostering relatively fixed association patterns. Conversely, academic research, unconstrai ned by practical implementation scenarios, tends to explore i nnovati ve combinat ions of tools a nd metr ics. We subsequentl y anal yzed the semantic distance tr ends of entity combinations within patent s, with results presented in Figure 6. Due to the relativel y limited number of patent disclosures in t he academic domain, certain enti ty combinati ons did not emerge in the e arly stages. Figure 6. Trend s in semantic d istance variat ions among d i fferent entity c ombinations in th e patent For Dataset-relat ed entity co mbinations (Dataset-Metric, Dataset-Method, and Dataset -Tool), the analysis revealed patterns si milar t o t hose observed in the paper research: across all three Dataset-related combinations, the industrial sector exhibited higher se mantic distance compared t o the academic sector. The consistent trends across both papers and patents clearly demonstrate that the industri al sector benefi ts not only from the existence of papers on datasets but also from their applicat ion in patent technolog y development. This indicates that the industry explores more boundary-pushing, dat aset-driven innovation pathways in patent devel opment. In terms of method entities, the two sectors exhibi t distinct di fferences. For the Method-Metric combination, the academic domain demonstrates a higher semantic distance than the industrial domai n. This fin ding indicates that the academic dom ain holds a relative advantage in the validation of methodol ogical innovations. Conversely, for the Method-Tool combin ation, the advantage shifts to the industrial sector. The industry exhibits a higher semantic distance in the Method-Tool combination, r eflecting i ts stronger capa bility to integrat e methods with practical tools. Regression res ult of novelty dif ferences across var ious types of insti tutions In thi s secti on, we answer R Q3. We conducte d a series of multivari ate regr essions to com pare the novelty of patents and paper s across different institutional types. Fi rst, we sho w the summary analysi s results of patent s and papers, and then analyze patents and papers separately to obser ve their heterogeneity. In addition, quantile regr ession is furt her introduced t o explore t he heterogenei ty effect under differ ent novelty. Table 3 present s the regr ession analysis results based on the full sample of scientific and technological literat ure. To el iminate differences in the original novelty value dist ributions between patents and p apers, w e first standardized the novelty values using F ormula 4 t o p erform z-score normali zation. This process aligned the novelty values of patent s and pap ers onto the sam e dist ribution dim ension. Table 3. Regression re sults for all scientific l iterature nove l ty Novelty Score (Z -score transform ed) NS Top (TOP 10% O R NOT) VARIABL ES Model (1) Model (2) Model (3) Model (4) Academic 0.127*** 0.080*** 0.518*** 0.278*** (0.026) (0.025) (0.091) (0.087) Cooperation 0.109*** 0.079** 0.347*** 0.210* (0.029) (0.032) (0.105) (0.110) Ln( Authors nu m ) 0.055*** 0.081*** (0.010) (0.031) Ln( Institut ions num ) 0.025 0.150*** (0.018) (0.056) Ln( Entities nu m ) -0.367*** -1.541*** (0.013) (0.037) Constant -0.067 1.061*** -2.389*** 2.294*** (0.081) (0.089) (0.222) (0.248) Year fixed ef fects Yes Yes Yes Yes Type fixed eff ects Yes Yes Yes Yes Observations 37,229 37,229 37,229 37,229 R-squared 0.005 0.033 0.002 0.068 Note: Robust st andard err ors in par entheses , *** p<0.01, ** p<0.05, * p < 0.1 In the specific regression models, Models (1) and (2) em ploy z-score standardi zed novelty values as the core dependent variable, fo cusing on examining the impact of different participant s on novelty. The regression results indicate that the coefficients for the core explanatory variables “Academic” and “Cooperati on” both passed statistical significance tests, with positive signs for both coefficient s. This finding indicates that wit hin an analyti cal framework encom passi ng all scientific and tech nological liter ature, direct participat ion by the academic sector or participation through collaborat ion positively promotes the novelty level of outcom es. Furthermore, the logistic regression results indicate that both in Model (3) w ithout control variables and Model (4 ) with control variables, the effects of “Academic ” and “Cooperation” remain statistically significant . Specificall y, in Model (4 ) with control variables, the coef ficient for “Academi c” is 0.278, with an OR of ; The coefficient for “Cooperation” is 0.210, OR is . This indicates that, controlli ng for other variables, academic institut ion participation increases the odds ratio of achieving high novelty by 32% , while aca demia collaborati on participat ion increases t his odds ratio by 23% . In terms of model spe cification, this study not only contr ols for fixed effects by year to eliminate potential interference from tempor al trends on novelty but also fully accounts for the inherent differ ences bet ween patents and papers within the sample. Although the aforement ioned z-score standardizati on and unified conceptual space constructio n have mitigated the hetero geneity between the two document types to some extent, to avoid potential confounding factors. This study additionally controlled for a fixed effect of document type in all regression models. Novelty hetero geneity between papers and patents Then, w e anal yze the heterogeneity of patents and papers. We first made a prelim inary analysis of the novelty di fferences bet w een papers and patents of different types of instituti ons, and t he results are shown in Figure 7. Figure 7 (a) illustrat es the distribution of novelty in the papers. Numerical results indicate that the mean novelty scor e for acad emic papers is 0.1013, while the industry sector averages 0.0987 and acad emia- industry collaboration papers average 0.1015. These three groups exhibit closely aligned novelty levels. Notably, the distribution patterns reveal that academic papers exhibit greater dispersion, featuring a sm all number of extremely novel values. This suggests academi c institutions may possess greater potential for innovation in t heir papers, with a hi gher probabil ity of producing hi ghly nov el research. Figure 7 (b) presents the result s for patents. The mean novelty score for academic pate nts is 0.1373, whil e the industry average is 0.1146, indicating that academ ic institut ions significant ly outperform industry in novelty. T he mean num ber of collaborati on types is 0.1427. Com pared to resea rch papers, ac ademic institut ions produce more highly novel outcomes in patent innovation, with a mean novelty score markedly higher than that of indust ry. Figure 7. Violin P lots of n ovelty distribu tion. (a) Novelty diff erences across p ubli shing institutions in the p apers (b) Novelty differences a cross publishing institut ions in the pa tents Further regression results of the paper are shown in Appendi x Table 6. In the ordina ry linear regression Model (5) that only includes institution type, the coefficient for “Academia” is 0.003, which is statistically significant at the 5% level ( β = 0.003, p < 0.05). This indicates that the average novelty score of academic papers is 0.003 higher than that of industri al papers. The coeffi cient for “Cooperat ion” is al so 0.003, but the difference is not signifi cant. This suggests that although the novelty of collaboration papers is numerically higher than that of ind ustrial papers, this di fference lacks st atistical si gnificance. After incorpor ating cont rol variables into Model (6), the coefficient for “Ac ademia” decreases to 0.002 and becomes insignificant ( p = 0.168 > 0.1). T he novelty gap betwe en academi c and ind ustrial papers is no longer stat istically si gnificant. We supplemented the quantil e regression analysis (see Appendix Table 8 for the results), found that the coefficient of academic var iables increas ed wit h the increase of t he quant ile and was st atistically s ignificant, indicating that there were dif ferences i n t he performance of di fferent novelty i ntervals: the coefficient was ( β = 0.002,0.001) at the 25% quantile (low novelty) was no significant difference with the industry. The coefficient at 75% quantile (high novelty) was ( β = 0.007,0.004) and significant ( p < 0.1, p < 0.01) . This shows that the perform ance of academia is simil ar to that of indust ry in conventional research, but it has obvious advant ages in hi ghly novel res earch. Therefore, we further analyzed the di fferences in the possibi lity of becoming a highly novel paper. Res ults from the logisti c regression Model (3) show that the coefficient for “Academia” is 0.331 ( β = 0.331, p < 0.01). Converting this to an odds r atio indicates that, without controlli ng for other variables, academic papers are 1.39 ti mes more l ikely to be high novelty outputs than industrial papers. The coefficient for “Cooperat ion” in Model (7) is 0.1 58, which r emains insignifi cant. This al igns with findi ngs from studies such as Liang et al. (2024), who noted that “ academic – indust ry collaborations struggle to replicate the novelty of academic team s and tend to look si milar t o industry team s ” . After adding all control variables to Model ( 8), the coefficient for “Academia” decreases to 0.204, with an odds ratio of . This indicates that even when accounting for confounding factors, the odds of academic papers being highly novel are still 23% higher than those of indust rial papers. It retains marginal statistical signif icance ( p < 0.1), validating ac ademia ’ s relati ve advantage. The coefficient for “Cooperati on” in Model (4) drops to 0.057 , meaning collaboration papers have a limit ed likelihood of being high novelty, with no su bstantial stati stical differ ence from indust rial papers. In summary, there is no significant difference in the average novelty score between academia and industry. However, academi a has a more prominent advantage in high novelty outputs. As for academia-industry collaborati ve papers, their novelt y is only slightly higher t han that of i ndustry papers in numerical terms, but such a difference lacks statistical significance across all m odels. Appendix Table 7 presents the regression results for patents. Model (9) includes only insti tutional type and year fixed effects. The coefficient for “Academia” is 0.022 ( p <0.01), indicating that the average novelty score of patents from academic institutions is significantly higher than th at of patent s from industrial instituti ons by 0.022. The coefficient for “Cooperation” is 0.026 ( p <0.05), w ith an average novelty score a lso significant ly higher than industrial institution patents by 0.026 unit s. After introduci ng control variables in Model (10), the coefficient for “Academia” remained statist ically significant at the 1% level, while the “ Cooperati on ” coefficient decreas ed to 0.022 ( p <0.1). This indicat es that although the novelty advantage of patents from collaborative institutions did not completely disappear, it weakened significant ly after controlli ng for other variabl es. Further anal ysis of the quantile regression result s (see Table 9 in the appendix) rev eals that as the quantil e rises from 25% to 75%, the coefficient increas es consist ently. This indi cates t hat, si milar t o the performance observed in papers, academi a also demonst rates a more prominent advantage in high novel ty within the patent domain. In addition, the results of the logistic regression Model (11) results indicate that the coefficient for “ Academic ” is 0.762 and signi ficant at the 1% level ( β = 0.762, p <0.0 1). Converting this to an odds ratio reveals that, without contr olling for other variables, patents from academic institut ions have an advantage in high novelty over patents from industrial institutions by a factor of 2.14 . The coeffici ent for “Coo perati on” was 0.695, si gnificant at the 5% level ( β = 0.695, p <0.05) . After incorporating all control vari ables in Model (12), the coefficient for “ A cademi c” decreased to 0.369 but remained significant at the 1% level ( β =0.369, p <0.01), and At this point, the coefficient for “Cooperation” decreased to 0.502 ( β =0.502, p >0.1). This indicates that while there is a numerical di fference, thi s difference i s not stati sticall y significant. We observed the effect of control variables, and the coefficient f or the number of IPC classif ication codes was ( β = 0.005,0.253, p <0.0 1), indicating that higher div ersity in t he kn owledge domains cover ed b y patents is more likel y t o drive cross-domain innovat ion, thereby enhancing patent novelty. The coefficient for patent family size was -0.004 and -0.100 ( p <0.01), suggest ing that larger patent famili es tend to focus on incremental impr ovements rather than breakthrough innovations, thus reduci ng novel ty. The per formanc e of entity number aligns w ith Fleming and Sorenson’s (2001) theory, where the marginal benefit of increasing component quanti ty diminishes for patent enhancem ent. Given that novelty in this study is calculated based on the proportion of novel entit ies, it maintai ns a negative value in the regression model. Furthermor e, the addition of control variables significantl y improved the R-squared value for all models, confirmi ng that incorporating t hese variables enhanced the model s’ expla natory power. Discussion This study adopted fine-grained knowledge entity analysi s to evaluate the novelty of patents and papers within the NLP field. Through regression analysis, the level of novelty in academia surpasses that in indust ry when co nsidering bot h paper s and pat ents. This finding is cons istent with the results of previous work (C hen et al., 2024; Liang et al., 2024). Regarding innovation focus, both academia an d industry emphasize methodological innovation in papers. Industry holds a unique advantage over acade mia in term s of dataset resources. Notably, the academi c sector demonstrates a more pronounced advantage in producing highly novel outcomes. Regarding collaborative research output s, academic – indust ry collaborat ions struggle to replicate the novel ty of academ ic teams and tend to resem ble the work of indust ry teams (Liang et al., 2024) . As a catalyst , academia significant ly promotes the enhancement of novelty, both in terms of fili ng patents individuall y and participat ing in collabor ative patent research. Implications The theoretical impli cations of this study lie in three aspect s. First, by transferring knowled ge from ent ity recognition models in the academic paper domai n to the patent enti ty recognit ion task and integrating an entity-based novelty m easure ment approach, we a chieved a unif ied quantitati ve assessment of nov elty across both patent and paper. This establishes a viable frame work for subse quent cross-level novelty evaluat ion between papers a nd patents on larger dat asets. Second, to address the dive rgence in novelty percepti ons between academ ia and indust ry in existing research, this st udy integrates top conference papers with patent data to provide new e mpirical evi dence. Th e findings reveal novelty differences between patents and papers, with knowledge entities across different scientifi c literatures also exhibiting innovation dispariti es. At the paper level, the overall novelty gap between academia and industry is relatively small, particularly in Method-based innovation domains, where the difference is negligible. This is attributable to the rigorous peer -review mechanisms of the three major conferences in natural language processing. Concurrent ly, the industry leverages its inherent dataset advantages to conduct ext ensive i nnovation activi ties. Third, this study enriches the empirical foundation of Recombinant Search Theory (Fleming, 2001; Fleming & Sorenson, 2001) at the entity level: It refines the core perspective that tec hnological innovation originates from component local search and recombinati on (IPC subclass) to the micro-level of knowledge entities . Building upon Aceves and Evans ’ (2024) conceptual space t heory, this study aligns paper and patent measurement dimensions through a unified word embeddi ng model, thereby enriching the analytical dimensions of component combinations in technological innovation research. Within this framework, this study similarl y identifies a diminishing marginal returns trend in output associated with increasing component numbers. This phenomenon stems partly from cogniti ve constraint s limi ting the full utilizati on of multiple components (Fle ming & Sorenson, 2001). It may also result from reduced innovation due to the narrower appl ication of pri or kno wledge (Park et al., 202 3). This study also has clear practi cal value. Our research reveals that academia demonstrates higher overall novelty outputs, w hich aligns with the view of Brescia et al. (2016), that the openness and collaborat ive environment of academia are mor e condu cive to fostering new ide as a nd s upporti ng inter disciplinar y innovation. The findi ngs of this study facilitate the formulat ion of differentiated incentives for academia- industry collaboration for policymakers. At the patent innovation level, greater support should be provided for joint patent applicati ons between industry and academi a. This could be achieved thr ough measures such as subsidi zing patent applic ation costs and establi shing priority review channels, thereby fully leveragi ng academia's role in enhancing patent novelty. At the paper innovation level, avoid mandating col laboration models. Instead, priorit ize supporti ng independent university teams in conducting fundamental research while guiding enterpr ises to participate in paper research through data sharing rather than joint authorship, thereby enhanci ng innovation effect iveness. Limitations and f uture works Although this st udy has empirical ly revealed the n ovelty differences between ac ademia and indust ry through a unified semantic space, it nevertheless has several limitations. First, the research sample is constrained in scope. The analyzed papers are limited to three repres entati ve NLP confere nces, excludi ng NLP research published in other relevant conferences and journals. Pat ents are restricted to the core CPC class G06F40, omitti ng related patent activit ies in adjacent CPC classe s crit ical to NLP (e.g., mach ine learning G 06N20, informati on retrieval G06F16). While this sampling strategy guarantees highly relevant data, it may underestimat e the act ual breadt h of NLP-r elated res earch papers and patent acti vities. Second, new words i n the NLP field iterate quickly, which may trigger dynami c fluctuations in semanti cs. While entity normalizat ion versus annual fixation effects can mitigate this situation, it can still introduce fine bias to the novelty measure of the entity combination. Third, the study focuses solely o n NLP. A s a rapidly emerging field with deep engagement across academia, industry, and research, other domains may exhibit heterogeneity due to differences in development pace, institutional participation models, or knowledge production logic. Thus, caution should be exercised when generali zing the research conclusions to other domains. Finally, although this study employs an analytical approach grounded in clas sical combinatorial innovation theory (Liu et al., 2022), it curre ntly lacks a gold-standar d validat ion pro cess, whic h const itutes a chal lenge perv asive in conte mporary relevant researc h. Future research may advance in three directions: First, expand the scope of research data. For papers, future studies can extend the data coverage to a wider range of NLP-related conferences and journals. For patents, more refined classification and filtering approaches can be employed to identify and incorporat e patents from adjacent technical fields, thereby comprehensi vely capturing patent activities in NLP. Second, it can overcome t he limit ations of relying sol ely on semantic dist ance metrics to measure novelty, expl oring a more c omprehensive and mul tidimensi onal innovati on evaluati on frame work. Finally, suppl ement a validation process based on gold standar ds. By integrating exper t revie w opinions, systemati cally test the model’s effectivenes s in disti nguishing documents with speci fic novelty levels, further enhancing the rigor and reliabil ity of the res earch outcomes. Acknowledg m ent This paper was suppor ted by the National Natural Science Foundation of China (Grant N o.72074113) and Jiangsu Province Graduate Student Research Practice Innovation Program ( Grant No. KYCX25_08 20). This paper is an extended v ersion of the ISSI 2025 paper “ Zhao, H., Zhao, Y., & Zhang, C. (2 025). Exploring novelty differences between industry and academi a: A knowledge entity-centr ic perspective. 20th International Conference on Sci entometrics & Informetrics . Yerevan, Armenia. https:// doi.org/10.51408/i ssi2025_088 ” . Declarations Conflict of interest: The author(s) declared no potential conflicts of interest with respect to the research, authorship, and/or publicat ion of this ar ticle. References Aceves, P., & Evans, J. A. (2024). Mobilizing Conceptual Spaces: How Word Embedding Models Can Inform Measurem ent and Theory Wi thin Organi zation Sc ience. Organization Science , 35 (3), 788 – 8 14. https:// doi.org/10.1287/orsc .2023.1686 Ahmed, N., Wahed, M., & Thompson, N. C. (2023). The growing influence of industry in AI research. Science , 379 (663 5), 884 – 886. https: //doi.org/10.1126/ science.ade 2420 Arts, S., & Fleming, L. (2018). Paradise of novelty — or loss of human capit al? Exploring new fields and inventive output . Orga nization Science , 29 (6), 1074 – 1092. htt ps://doi.org/10.1287/ors c.2018.1216 Arts, S., Hou, J., & Gomez, J. C. (2021). Natural languag e processing to identify the creat ion and impact o f new technologies in patent text: Code, data, and new measures. Research Policy , 50 (2), 104144. https:// doi.org/10.1016/j .respol.2020.1 04144 Ashtor, J. H. (2022) . Modeling patent cl arity. Research Policy , 51 (2), 104415. https:// doi.org/10.1016/j .respol.2021.1 04415 Ba, Z., Meng, K., Ma, Y., & Xia, Y. (2 024). Disco vering t echnological opportuniti es by identifying dynamic structure- coupling patterns and lead-lag distance b etween science and technol ogy. Technological Forecasting a nd Social Ch ange , 200 , 123147. ht tps:// doi.org/10.1016/ j.techfore.20 23.123147 Bikard, M., & Marx, M. (2020) . B ridgin g Academia and Indust ry: How Geographic Hubs Connect University Science and Corporat e Technology. Manageme nt Science , 66 (8), 3425 – 3443. https:// doi.org/10.1287/m nsc.2019.3 385 Brescia, F., Colombo, G., & Landoni, P. (2016). Organizational structures of Knowledge Transfer Offices: An a nalysis of the w orld’s top -ranked universities. The Journal of Technolo gy Transf er , 41 (1), 132 – 151. https:// doi.org/10.1007/s10961-014- 9384-5 Chan, H. F., & Torgler, B. (2020). Gender differences in performanc e of top cited scientists by field and country. Sciento metrics , 125 (3), 2421 – 2447. https://doi.or g/10.1007/s1 1192-020-037 33-w Chen, C.-J., H siao, Y.-C., Chu, M.-A., & Hu, K. K . (2015). The Relationship Betwee n Team D iversity and New Product Performance: The Moderating Role of Organizational Slack. IEEE Trans actions on Engineering M anagement , 62 , 568 – 577. https://doi.org/10.1109/ TEM.2015.2458891 Chen, Z., Zha ng, C., Zhang , H., Zhao, Y., Yang, C., & Yang, Y. (2024) . Exploring t he relat ionship betwee n team institutional composition and novelty in academic papers based on fine-grai ned knowledge entities. The Electroni c Library , 42 ( 6), 905 – 9 30. https:// doi.org/1 0.1108/EL-03- 2024-0070 Chirico, F., Criaco, G., Baù , M., Naldi, L., Gomez -Meji a, L. R., & Kotlar , J. (2020). To patent or not to patent: That is the question. Intellectual property protection in family firms. Entrepreneur ship Theory and Practice , 44 (2), 339 – 367. https: //doi.org/10.1177/10422587 18806251 Codina-Filbà , J., Bouayad-Agha, N., Burga, A., Casamayor , G., Mille, S., Mü ller, A., Saggion, H., & Wanner, L. (2017) . Using genre-s pecifi c features for patent summaries. Information Processing & Manage ment , 53 (1), 151 – 174 . https://doi.org/10.1016/j .ipm.2016.07.002 Devlin, J., Chang, M.-W., Lee, K., & Toutanova, K. (2019). BERT: Pre -training of Deep Bidirectional Transformers for Language Understanding. In J. Burstein, C. Doran, & T. Solorio (Eds.), Proceedings of the 2019 Conference of the North Am erican Chapter of the Association for Computati onal Linguistics: Human Language Technologies, Volume 1 (Long and Short Papers) (pp. 4171 – 4186). Association for Computational Linguist ics. ht tps://doi .org/10.18653/v1/N 19-1423 Dwivedi, Y. K., Hughes, L., Ismagilova, E., Aarts, G., Coombs, C., Crick, T., Duan, Y., Dwivedi, R., Edwards, J., Eirug , A., Galanos, V., Ilavar asan, P. V., Janssen, M., Jones, P., Kar, A. K., Kizgin, H ., Kronemann, B., Lal, B., Lucini, B., … William s, M. D. (2021). Artifici al Intelli gence (AI): Multidisc iplinary perspectives on emerging chal lenges, opportunities, and agen da for research, pract ice and policy. Internat ional Journal of Information Man agement , 57 , 101994. https:// doi.org/htt ps://doi.org/10.1016/ j.ijinfom gt.2019.08 .002 Fleming, L. (2001). Recombinant Uncertainty in Technologi cal Search. Management Science , 47 (1), 117 – 132. https:// doi.org/htt ps://doi.or g/10.1287/mnsc .47.1.117.10671 Fleming, L., & Sorenson, O. (2001). Technology as a compl ex adaptive system: Evidence from patent data. Research Poli cy , 30 (7), 10 19 – 1039. https:// doi.org/10.1016/ S0048-7333(00) 00135-9 Fontana, M., Iori, M., Montobbio, F., & Sinatra, R. (2020). New and aty pical combinat ions: An assessment of novelty and interdisciplinarit y. Research Policy , 49 (7), 1040 63. https:// doi.org/10.1016/j .respol.2020.1 04063 Franceschini, F., Maisano, D., & Turina, E. (2 012). European research in t he field of product ion technology and manufacturing systems: An exploratory analysi s through publicati ons and patents. The International Journal of Advanced Manufacturi ng Technology , 62 (1 – 4), 329 – 350. https:/ /doi.org/10.100 7/s00170- 011-3791-7 Geisler, E. (1995). When whales are cast ashore: The conversi on to relevancy of American universit ies and basic sci ence. IE EE Transact ions on Engineering Manage ment , 42 (1), 3 – 8. https:// doi.org/10.1109/17.3 66398 Hottenrott, H. , Rose, M. E., & La wson, C. (2021) . The rise of m ultiple i nstitutional affiliations in acade mia. Journal of the Association for Information Science and Technology , 72 (8), 1039 – 1058. https:// doi.org/10.1002/asi .24472 Jang, H ., K im, S., & Yoon, B. (2023). An eXplainable AI (XAI) model for text-based patent novelty analysis. Expert Syste ms with Appli cati ons , 231 , 120839. htt ps://doi .org/10.1016/j.es w a.2023.12 0839 Jee, S. J., & Sohn, S. Y. (2023). Firms’ influence on the evolution of published knowledge when a science - related technology emerges: The case of artifici al intelligence. Journal of Evolutionary Economics , 33 (1), 209 – 247 . https://doi.org/10.1007/s0 0191-022-00804 -4 Jeon, D., Ahn, J. M., K im, J., & Lee, C. (2022) . A doc2vec and local outlier factor approach to measuri ng the novelty of patent s. Technologi cal Forecasti ng and Social Change , 174 , 121294. https:// doi.org/10.1016/j .techfore.2021. 121294 Jeon, D., Lee, J., Ahn, J. M., & Lee, C. (2023). Measuring the novelty of scientifi c publications: A fastText and local outli er factor approach. J ournal of I nformetrics , 17 (4), 10145 0. https:/ /doi.org/10.1016/j .joi.2023.10145 0 Jiang, F., Pan, T., Wang, J., & Ma, Y. (2024). To academi a or industry: Mobility and impact on ACM fellows’ scientifi c careers. Inf ormation Processing & Manage ment , 61 (4), 103736. https:// doi.org/10.1016/j .ipm.2024.10373 6 Kabore, F. P., & Park, W. G. (2019). Can pat ent family size and compositi on signal patent value? Applied Economics . https:// www.tandfonli ne.com/doi/ abs/10.108 0/00036846.2 019.1624914 Koppman, S., & Leahey, E. (2019). Who moves to the methodological edge? Factors that encourage scientist s to use unconvent ional methods. Research Poli cy , 48 (9), 103807. https:// doi.org/10.1016/j .respol.2019.1 03807 Lee, C., & Lee, G. (2019). Technology oppor tunity analysi s based on recombinant search: Patent landscape analysis for idea generat ion. Scientometrics , 121 (2), 603 – 632. https://doi.or g/10.1007/s111 92-019- 03224-7 Lee, S., Yoon, B., & Park, Y. (2009). An approach to discoveri ng new technology oppor tunities: Keyword - based patent m ap approach. Technovation , 29 (6), 481 – 497. https:// doi.org/10.1016/j .technovati on.2008.10 .006 Lee, Y .-N., Walsh, J. P., & Wang, J. (2015). Creativity in scienti fic teams: Unpacking novelty and impact. Research Poli cy , 44 (3), 68 4 – 697. https: //doi.org/ 10.1016/j.res pol.2014.10.00 7 Levenshtei n, V. I. (1965). Binary codes capable of correct ing deletions, insertions, and reversals. Soviet Physics. Doklady , 10 , 707 – 710. Liang, L., H an, Z., Zou, J., & Acuna, D. E. (2024). The complementary contributions of academia and industry to AI r esearch . ArXiv. https: //doi.org/10.48550/arXiv.240 1.10268 Liang, Z., M ao, J., & Li, G. (2023). Bias against scientifi c novelty: A prepubli cation per spective. Jour nal of the Association for Information Science and Tech nology , 74 (1), 99 – 114. https:// doi.org/10.1002/asi .24725 Liu, M., Bu, Y., Chen, C., Xu, J., Li, D., Leng, Y., Fre eman, R. B., Mey er, E. T., Y oon, W., Su ng, M., Je ong, M., Lee, J., Kang, J., Min, C., Song, M., Zhai, Y., & Ding, Y. (2022). Pandemics are catalysts of scientifi c novelty: Evidence from COVID ‐19. Journal of the Association for Informati on Science and Technology , 73 ( 8), 1065 – 1078. https:/ /doi.org/10.100 2/asi.24612 Liu, M., Xie, Z., Yang, A. J., Yu, C ., X u, J., Ding, Y., & Bu, Y. (2024). The prom inent and heterogeneous gender disparities in scientifi c novelty: Evidence from biomedical doctoral theses. Information Processing & M anagement , 61 (4), 103 743. https://doi.or g/10.1016/j .ipm.2024.10374 3 Liu, X., Li, X., Liu, J., & Zhang, P. (2025). A novel unsupervise d learning fram ework for measur ing the technological innovati on of patent s. Sciento metrics . https: //doi.org/10.1007/s11192-0 25-05380-5 Luo, Z., Lu, W., He, J., & Wang, Y. (2022). Combi nation of research questions and methods: A new measurement of scientific novelty. Journal of Informetri cs , 16 (2), 101282. https:// doi.org/10.1016/j .joi.2022.10128 2 Marcoulides, K. M., & Raykov, T. (2019). Evaluation of variance inflation factors in regression models using latent variable model ing met hods. Educat ional and Psychologi cal Meas urement , 79 (5), 874 – 882. https:// doi.org/10.1177/0013 164418817803 Merton, R. K. (1973). The no rmative structure of sc ience. The sociology of science. In University of Chicago Press, Chicago . Mori, T., & Sakaguchi, S. (2020) . Creation of knowledge through exchanges of knowledge: E vidence from japanese pat ent data ( No. arXiv:1908 .01256). arXiv. http s://doi.org/10.48550/ar X iv.1908.01 256 Nelson, R. R., & Winter, S. G. (1985). An evoluti onary theory of economic change . Harvard University Press. Park, M., Leahey, E., & Funk, R. J. (2023). Papers and patents are becomi ng less disrupti ve over time. Nature , 613 (7942), 138 – 144. https://doi.or g/10.1038/s415 86-022-05543-x Pramanick, A., Hou, Y., Mohammad, S. M., & Gurevych, I. (20 25). The nature of NL P: analyzing contributi ons in NLP papers. In W. Che, J. Nabende, E. Shut ova, & M. T. Pilehvar (Eds.), Proceedi ngs of the 63rd Annual Meeting of the Association for Co mputational Linguistics (volume 1: Long Papers ) (pp. 25169 – 25191). Associa tion for Com putational Linguisti cs. https: //doi.org/ 10.18653/v1/2025.acl - long.1224 Riera, R., & Rodrí guez, R. (2022). What if Peer-Review Process Is Killing Thinking-Out-of-the-Box Science? Frontiers in M arine Sci ence , 9 , 924469. https: //doi.org/ 10.3389/fmars.202 2.924469 Sauermann, H., & Stephan, P. (2010). Tw ins or Strangers? Differences and Similarities between Industrial and Academic Science (No. w16113; p. w16113). National Bureau of Economic Research. https:// doi.org/10.3386/w 16113 Shi, F., & Evans, J. (2023). Surprising combinations of research contents and contexts are related to impact and emerge with scientific outsiders from distant disciplines. Nature Communications , 14 (1), 1641. https:// doi.org/10.1038/s414 67-023-36741-4 Shin, H., Kim, K., & Kogler, D. F. (2022). Scientific collaborat ion, researc h funding, and novelty in scientific knowledge. PLOS One , 17 (7 ), e0271678. https://doi .org/10.1371/ journal.pone. 0271678 Sun, X., C hen, N ., & Ding, K. (2022). Measuring latent combinational novelty of technology. Expert Systems with Applicati ons , 210 , 1185 64. https://doi.org/10.101 6/j.eswa.2022.1185 64 Uzzi, B., Mukherj ee, S., Str inger, M., & Jones, B. (201 3). Atypical Combinations and Scient ific Impact . Science , 342 (615 7), 468 – 472. https: //doi.org/10.1126/ science.12 40474 Verhoeven, D., Bakker, J., & Veugelers, R. (2016). Measuring technological novelty with patent-based indicators. Research Pol icy , 45 (3), 707 – 723. https: //doi.org/ 10.1016/j.respol.2 015.11.010 Wang, J., Veugelers, R., & St ephan, P. ( 2017). Bias again st novelty in sci ence: A caut ionary t ale for users of bibliomet ric indicators. Res earch Policy , 46 (8), 1416 – 1436. https:// doi.org/10.1016/j .respol.2017.0 6.006 Wei, T., Feng, D ., Song, S., & Zhang, C. (2024). An extraction and novelty evaluat ion framew ork for technology knowled ge elements of patents. Scientometri cs , 129 (11), 7417 – 7442. https:// doi.org/10.1007/s111 92-024-04990-9 Wu, K., Sun, J., Wang, J., & Kang, L. (2025). How does scien ce converge nce inf luence technology convergence? Different impact s of science-push and tec hnology-pull . Technological Forecast ing and Social Change , 215 , 124114. https: //doi.org/10.1016/j.techfor e.2025.124114 Wu, K., X ie, Z., & Du, J. T. (2024). Does science disrupt technol ogy? Examining science intensity, novelt y, and recency through patent- paper citati ons in the pharmaceutical field. Scientometrics , 129 (9), 5469 – 5491. https:// doi.org/10.1 007/s11192-024- 05126-9 Wu, L., Wang, D., & Evans, J. A. (2019). Large teams develop and small teams disrupt science and technology. Nature , 566 (7744), 378 – 382. https://doi.or g/10.1038/s41586- 019-0941-9 Xu, H., Bu, Y ., Liu, M., Zhang, C., Sun, M., Zhang, Y., Meyer, E., Salas, E., & Ding, Y. (2022). Team power dynamics and team impact: New per specti ves on sc ientifi c col laboration usi ng career age as a prox y f or team power. Journal of the Association for Information Science and Technology , 73 (10), 1489 – 15 05. https:// doi.org/10.1002/asi .24653 Yang, Y ., Tian, T. Y., Wood ruff, T. K., Jo nes, B. F., & Uzzi, B. (2022) . Gender-diverse teams produce more novel and higher-impact scienti fic ideas. Proceedings of the National Academy of Sciences , 119 (36), e2200841119. ht tps:// doi.org/10.1073/pn as.2200841 119 Zhang, H ., Zhang, C., & Wang, Y. (2024). R evealing the technology development of natural language processing: A Scientifi c en tity -centric perspective. Information Processing & Managem ent , 61 (1), 103574. https: //doi.org/10.1016/j.i pm.2023.10357 4 Zhang, L., Cao, Z., Shang, Y., Sivertsen, G., & H uang, Y. (2024). Missing institut ions in OpenAlex: Possible reasons, implicat ions, and solutions. Scientomet rics , 129 (10), 5869 – 5 891. https:// doi.org/10.1007/s111 92-023-04923-y Zhao, H ., Zhao, Y., & Zhang, C . (2026). Quantifying the knowledge proximity between academic and industry research: A n entity and semantic perspective. Technological Forecasting and Social Change , 226 , 124598. ht tps:// doi.org/10.1016/ j.techfore.202 6.124598 Zheng, H., Li, W., & Wang, D. (2022). Expertise D iversi ty of Teams Predicts Origin ality and Long-Term Impact in Sci ence and Technology. SS RN Electronic Journal . https:// doi.org/10.2139/s srn.4243054 Appendix Table 4. Top 5 en t ities in four types extracted from papers and patents Type Paper Patent Entity Frequency Entity Frequency BERT 4160 Neural network 3021 Method LSTM 3565 Machine learni ng 1608 Attention Mecha nism 3392 N-gram 1365 Transformer 3321 Language mo dels 1160 N-gram 3287 Deep learni ng 960 Pytorch 742 Computer system 11646 MOSES 654 Storage medium 10413 Tool GIZA++ 54 User interface 9323 Python 438 Computer pro gram 8738 NLTK 397 Operating system 7636 Wikipedia 3542 Emoji 306 WordNet 2152 Email 122 Dataset Twitter 1210 So cial medi a 86 Wall Street Journal 1006 World wide w eb 67 Amazon Mech anical Turk 982 Twitter 43 Accuracy 10696 Accuracy 5278 F 1 6956 Confidence 2500 Metric Precision 6075 Efficiency 2195 Recall 5578 Relevance 1612 BLEU 3264 Error 1453 Table 5. Prompt for c l assifying ins titution names in the list I am providing a list of names that may include indiv iduals, academic institut ions (e.g., universities , research institutes) , or industrial organizations (e.g., companies, corporations). Please review each name and classify i t into one of t he followi ng categori es: “Academia” if it refers to a university , college, research instit ute, or other research or ganization with an education focus . “Industry” if it refers t o a company , corporation, enterpri se, or business enti ty . “Individual” i f it appears t o be a perso nal name (not an inst itution). Do not provide rationales for classifi cations. If a name is ambiguous or cannot be clearly categorized, label it as “Other”. Results of sem antic simil arity for di fferent ent ity combinat ion types As sho wn in Appendix Figure 8, com binations of enti ties within the same category, such as tools, metrics, and datasets, have relat ively high semantic similarity. This indicates that these combinations are closer in semantic distance and contribute relatively little to novelty. The top-ranked combinations are Method-Metric, Dataset-Method, Dataset-Met ric, and Method-Method. Among the core combinati ons mentioned above, Method-Metri c exhibits the lowest semantic similarity ( highest semantic distance). In fact, method design and metric definition share a deeply intertwined relationshi p: the introducti on of new methods must be accompanied by cor respondi ng metrics f or validity assessment, and the “method validation logic” repres e nts a typical pathway for producing highly novel researc h outcom es. Additionally, the Method-Dataset pairing ranks prom inently. High -quali ty datas ets for m a crucial foundati on for methodological innovation. Research by Pramanick et al. (2025) confirms this: first, new datasets tend to attract higher citation rates; second, papers introduci ng ne w methods al so garner incre ased citation att ention. Appendix Figure 9 presents patent entity combination similarity. Among these, same-type entity pairs (Dataset-Dataset , Tool-Tool, Method-Method, Metric-Metri c) exhibi t the highest semanti c sim ilarity, whi ch aligns with Fleming and Sorenson’s (2001) technology landscape recombination search theory. When inventors adopt a modular strategy for patent development, while it reduces uncertaint y in technological restructuri ng and enhances i nvention success rates, it simultaneousl y narrows the s pace for cross-modul e collaborati ve innovation, ultimately limiting breakthrough inventions. For high novelty patents, their core entity combinati ons are Dataset-Metric, Method-Metric, Metric-Tool, and Datas et - Method, sharing similar ities w ith the entity combi nation patterns of pa pers discussed earlier . Howev er, patents and papers differ signi ficantly i n researc h focus: pat ents rarely use data and metrics t o verify tec hnical validity; instead, they demonstrate value by describing technical features and achieved effects. Nevertheless, combining datasets wit h evaluation m etrics or i ntegrating dat asets with methods still generates novel out comes. Furthermore, patents emphasi ze practical applications with higher engagement from Tool-based entities, where certai n Tool-Metri c combinat ions emerge as key pathways for technol ogical in novation. Figure 8. Semantic similarity di fferences bet w een paper entiti es Figure 9 Semantic similarity differ ences between patent entities Results of l inear and logi stic regression Table 6. Regressi on results for p aper novelty Novelty Score (Continuous variable) NS Top (TOP 10% O R NOT) VARIABL ES Model (5) Model (6) Model (7) Model (8) Academic 0.003** 0.002 0.331*** 0.204* (0.002) (0.002) (0.105) (0.108) Cooperation 0.003 0.001 0.158 0.057 (0.002) (0.002) (0.115) (0.128) Ln( Authors nu m ) -0.001 -0.098 (0.001) (0.061) Ln( Institut ions num ) 0.003** 0.194*** (0.001) (0.065) Ln( Entities nu m ) -0.009*** -1.153*** (0.001) (0.067) Constant 0.121*** 0.144*** -2.185*** 0.750 (0.015) (0.016) (0.491) (0.517) Year fixed ef fects Yes Yes Yes Yes Observations 16,295 16,295 16,295 16,295 R-squared 0.005 0.009 0.002 0.029 Note: Robust st andard err ors in par entheses , *** p<0.01, ** p<0.05, * p < 0.1 Table 7. Regressi on results for p at ent novel ty Novelty Score (Continuous variable) NS Top (TOP 10% O R NOT) VARIABL ES Model (9) Model (10) Model (11) Model (12) Academic 0.022*** 0.013*** 0.762*** 0.369*** (0.004) (0.004) (0.125) (0.138) Cooperation 0.026** 0.022* 0.695** 0.502 (0.013) (0.012) (0.333) (0.352) Ln( Authors nu m ) 0.005*** 0.121*** (0.001) (0.038) Ln( Institut ions num ) -0.002 -0.075 (0.003) (0.142) Ln( Entities nu m ) -0.036*** -1.906*** (0.001) (0.049) Ln( IPC num ) 0.005*** 0.253*** (0.001) (0.053) Ln( Family si ze ) -0.004*** -0.100** (0.001) (0.043) Constant 0.113*** 0.217*** -1.986*** 3.342*** (0.005) (0.006) (0.224) (0.265) Year fixed ef fects Yes Yes Yes Yes Observations 20,934 20,934 20,934 20,934 R-squared 0.007 0.064 0.003 0.111 Note: Robust st andard err ors in par entheses. *** p <0.01, ** p<0.05, * p < 0.1. Results of quant ile regressi on Table 8. Regressi on results of nove l ty scores of pap ers under different quanti les Novelty Score Q (0.25) Novelty Score Q (0.50) Novelty Score Q (0.75) VARIABL ES Model (13) Model (14) Model (15) Model (16) Model (17) Model (18) Academic 0.001 0.002 0.002 0.002 0.007*** 0.004* (0.002) (0.002) (0.002) (0.002) (0.002) (0.002) Cooperation 0.003 0.001 0.002 0.002 0.004* 0.003 (0.002) (0.002) (0.002) (0.002) (0.002) (0.003) Ln( Authors nu m ) 0.001 0.002 -0.002 (0.001) (0.001) (0.002) Ln( Institut ions num ) 0.001 0.001 0.003* (0.001) (0.001) (0.002) Ln( Entities nu m ) 0.016*** -0.000 -0.021*** (0.001) (0.002) (0.002) Constant 0.037*** -0.007 0.101*** 0.086** 0.205*** 0.265*** (0.010) (0.006) (0.035) (0.036) (0.021) (0.020) Year fixed ef fects Yes Yes Yes Yes Yes Yes Observations 16,295 16,295 16,295 16,295 16,295 16,295 R-squared 0.018 0.025 0.007 0.007 0.004 0.012 Note: Robust st andard err ors in par entheses. *** p <0.01, ** p<0.05, * p < 0.1. Table 9. Regressi on results of nove l ty scores of pa tents under different quan t iles Novelty Score Q (0.25) Novelty Score Q (0.50) Novelty Score Q (0.75) VARIABL ES Model (19) Model (20) Model (21) Model (22) Model (23) Model (24) Academic -0.001 0.001 0.021*** 0.016** 0.043*** 0.019*** (0.004) (0.004) (0.007) (0.007) (0.010) (0.005) Cooperation 0.005 -0.001 0.031*** 0.019 0.024** 0.021 (0.011) (0.013) (0.010) (0.022) (0.011) (0.017) Ln( Authors nu m ) 0.004*** 0.004*** 0.006*** (0.001) (0.001) (0.001) Ln( Institut ions num ) 0.001 -0.003 -0.005 (0.003) (0.003) (0.005) Ln( Entities nu m ) 0.003*** -0.026*** -0.059*** (0.001) (0.001) (0.001) Ln( IPC num ) 0.002** 0.005*** 0.007*** (0.001) (0.001) (0.001) Ln( Family si ze ) -0.003*** -0.004*** -0.006*** (0.001) (0.001) (0.001) Constant 0.054*** 0.045*** 0.103*** 0.178*** 0.154*** 0.336*** (0.003) (0.005) (0.010) (0.005) (0.011) (0.007) Year fixed ef fects Yes Yes Yes Yes Yes Yes Observations 20,934 20,934 20,934 20,934 20,934 20,934 R-squared 0.003 0.006 0.005 0.023 0.007 0.073 Note: Robust st andard err ors in par entheses. *** p <0.01, ** p<0.05, * p < 0.1. The relationshi p between novelt y and citations In the vie w of Fra nceschini et al. ( 2012), cit ations in papers primarily r eflect scholar ly inf luence, whereas patent forward citations possess dual attributes as both vehicles for knowledge flow and indicators of technological application val ue. Existing research has extensively examined citation patterns of highly novel outcomes: most studies indicate that increased patent novelt y typically cor relates with m ore forward ci tations ( Jeon et al., 2022; Liu et al., 2025). However, it must be clarif ied that citation metr ics measure ex post impact s after publication, not the intrinsic novelty of t he w ork. Contrary perspe ctives exist. A rts & Fleming (2018) found that while exploring novel domai ns enhances invention novelty, insuffici ent knowledge reserves and high learning costs may dimini sh immedi ate value. Wa ng et al. (2017) found that highly n ovel research exhi bits greater citation variance and often struggles to achieve high citation counts during its initial publication phase. Liang et al. (2023) further supplemented that highly novel outcomes typicall y face longer review and revision cycles, reflecti ng a “delayed recogni tion” bias in academi c evalu ation that resonates with ci tati on lag phenome na. To verify the robustness of novelty-citation associations, we employed the Mann-Whitney U test to compare citation outcomes between high novelty and comm on paper s/patents. Drawing on five-year citation data for 15,871 papers from O penAlex and forward citation data for 20,934 patents from proprietary databases, our analysis revea led: a) For papers: High novelty sa mples exhibited signi ficantly l ower five-year citation counts, wit h this pattern being st atistically robust across both the o verall sample and academ ia subgr oup ( p <0.001; see Appendix Figure 10 ); b) For patents: High novelty samples recei ved significantly m ore forward ci tations, a consist ent trend validated in bot h the overal l patent sample and in dustry s ubgroup ( p <0.001; see Appendix Figur e 11 ). These findings align with existing literatur e: Patent novelty is positively correlated with subsequent technological impact, as novel patents exhibit more active technology diffusion and greater average technical influence. In contrast, the associat ion between paper novel ty and citation performance remai ns negative or uncertain. This stems from high novelty papers being susceptible to systematic biases in evaluation, hindering their abil ity to gain wides pread scholar ly attenti on and re cognition in t he short term . Figure 10 . Diff erences in 5-year cit ations between novel and co mmon papers Figure 11 . Diff erences in 5-yea r citations between novel a nd common pat ents
Original Paper
Loading high-quality paper...
Comments & Academic Discussion
Loading comments...
Leave a Comment