UNICORN: Ultrasound Nakagami Imaging via Score Matching and Adaptation for Assessing Hepatic Steatosis
Ultrasound imaging is an essential first-line tool for assessing hepatic steatosis. While conventional B-mode ultrasound imaging has limitations in providing detailed tissue characterization, ultrasound Nakagami imaging holds promise for visualizing …
Authors: Kwanyoung Kim, Jaa-Yeon Lee, Youngjun Ko
1 UNICORN: Ultrasound Nakagami Imaging via Score Matching and Adaptation for Assessing Hepatic Steatosis Kwan young Kim ∗ 1 , Jaa-Y eon Lee ∗ 2 , Y oungjun K o 3 , GunW oo Lee 3 , Jong Chul Y e † 1 Abstract —Ultrasound imaging is an essential first-line tool f or assessing hepatic steatosis. While con ventional B-mode ultra- sound imaging has limitations in pro viding detailed tissue char - acterization, ultrasound Nakagami imaging holds promise f or visualizing and quantifying tissue scattering in backscattered sig- nals, with potential applications in fat fraction analysis. However , existing methods for Nakagami imaging struggle with optimal window size selection and suffer fr om estimator instability , lead- ing to degraded image resolution. T o address these challenges, we propose a novel method called UNICORN (Ultrasound Nakagami Imaging via Score Matching and Adaptation), which offers an accurate, closed-form estimator for Nakagami parameter estimation based on the score function of the ultrasound en velope signal. Unlik e methods that visualize only specific regions of interest (R OI) and estimate parameters within fixed window sizes, our appr oach pr ovides comprehensive parameter mapping by pro viding a pixel-by-pixel estimator , resulting in high-resolution imaging. W e demonstrated that our proposed estimator effec- tively assesses hepatic steatosis and pro vides visual distinction in the backscatter ed statistics associated with this condition. Through extensive experiments using real en velope data from patient, we validated that UNICORN enables clinical detection of hepatic steatosis and exhibits rob ustness and generalizability . I . I N T R O D U C T I O N Hepatic steatosis, characterized by the accumulation of excessi ve fat within li ver cells forming fatty vacuoles [18], can advance to more severe conditions such as nonalcoholic steatohepatitis, fibrosis, cirrhosis, and hepatocellular carci- noma [1, 44, 57]. Nonalcoholic fatty li ver disease (N AFLD), primarily driv en by hepatic steatosis, has emerged as the foremost cause of chronic li ver disease [30]. Consequently , accurate diagnosis and assessment of hepatic steatosis are crucial to pre venting the progression of liver diseases, thereby enhancing opportunities for curati ve treatment and improving patient surviv al. Liv er biopsy is regarded as the gold standard for diag- nosing hepatic steatosis [21, 5]. Ho we ver , this method has notable limitations, such as sampling error and in vasi ve side effects [35, 43]. Consequently , noninv asive imaging techniques hav e emerged as valuable alternati ves for the quantitative diagnosis of hepatic steatosis. [29] Among these, magnetic resonance imaging-proton density fat fraction (MRI-PDFF) stands out as a reliable diagnostic tool. Nev ertheless, MRI- PDFF is not used for routine clinical assessments due to its ∗ : Co-first authors with equal contribution. † : Corresponding authors. 1 Department of AI Conver gence, GIST , 2 Kim Jae Chul Graduate School of AI, KAIST , 3 Samsung Medison, Email: jong.ye@kaist.ac.kr . high cost and limited av ailability [36]. Ultrasound B-mode imaging presents an essential alternative for li ver steatosis by pro viding diagnostic clues with properties that are safe, real-time, noninv asiv e, and cost-effecti ve [39, 45]. Howe ver , the assessment of hepatic steatosis using B-mode imaging is prone to inter-clinician variability and is limited in the tissue information. T o ov ercome this limitation, quantitati ve ultrasound (QUS) methods hav e emerged to analyze statistical features of ultra- sound radiofrequency (RF) echo signals in the li ver , including tissue backscatter [32] and ultrasonic wa ve attenuation [4]. QUS enables finer distinctions among tissue types beyond the capabilities of B-mode imaging alone. The backscattered ultra- sound signals, specifically the en velope statistics, encapsulate the characteristics of scatterers within tissue, such as their shape, size, density , and other properties [3, 16]. Consequently , QUS methods utilizing these signals ha ve been explored to visualize the scatter properties of ultrasound within tissue [46]. Initially , the Rayleigh distrib ution was employed to model backscattered signal data. Howe ver , scatterers in tissue e xhibit varied scattering patterns, ranging from pre-Rayleigh to post- Rayleigh distributions [40, 9]. T o better account for these variations, the Nakagami distribution has been studied as a more general statistical model. The Nakagami parameter , estimated from backscattered echoes, can characterize various backscattering distributions in medical ultrasound [53]. This parameter has been successfully used in ultrasound parametric imaging to assess hepatic steatosis, demonstrating a significant correlation between tissue scattering imaging results and MRI- PDFF measurements [14, 27, 51]. Previous Nakagami imaging studies in ultrasound com- monly use moment-based and maximum-lik elihood estimators (MLE) for mapping Nakagami distrib ution parameters. In the moment-based approach, Nakagami parameters are computed within a sliding local window , which is typically optimized to be three times the transducer pulse length for optimal performance [46]. Conv ersely , MLE-based Nakagami imaging provides more consistent results with smaller variances [7]. W indow-modulated compounding (WMC) Nakagami imaging utilizes a momentum estimator with varying local window sizes to enhance image smoothness [48]. Howe ver , both moment-based and MLE rely on the sliding windo w technique, which inv olves a trade-off between image resolution and estimator stability [23]. Larger window sizes improve image smoothness b ut reduce resolution, while smaller windo w sizes 2 offer finer resolution at the expense of stability . Therefore, selecting the optimal window size is crucial and depends heavily on the specific hyperparameters used. T o address these issues, here we introduce a novel frame- work for U ltrasound N akagami i maging via S cor e Matching and Adapatio n , termed UNICORN. Inspired by the success of the self-supervised denoising approach that utilizes the score function, i.e. the gradient of log-lik elihood [20, 19], this frame- work offers a closed-form solution for mapping Nakagami parameters in terms of the scor e function of the measurement. Specifically , instead of using momentum and MLE, our esti- mator calculates the posterior mean and provides an optimal solution from a Bayesian perspecti ve. By integrating the score function of RF env elope signals, UNICORN directly computes Nakagami images, eliminating the need for the sliding window technique. Consequently , our proposed technique preserves ultrasound imaging resolution in Nakagami imaging while ensuring stability . Our contrib utions can be summarized as: • T o the best of our knowledge, we present the first closed- form solution for estimating the Nakagami parameter using the score function of RF en velope data, which addresses limitations of con ventional methods. • Through extensi ve experiments including simulation and real RF env elope data, our proposed method, called UNICORN, demonstrates its superiority in estimation performance and the distinction between normal and fatty liv er . • Extensiv e analysis on a real-patient dataset v alidated the clinical effecti veness of our proposed Nakagami imaging method in diagnosing hepatic steatosis. I I . R E L AT E D W O R K A. Quantitative Assessment for Hepatic Steatosis Recently , a number of quantitative ultrasound (QUS) tech- niques have been developed and validated for diagnosing hepatic steatosis by e xploiting the intrinsic acoustic properties of tissue to characterize its microstructure [24, 37, 12, 56]. These approaches typically measure the attenuation coeffi- cient, backscatter coefficient, and sound-speed, all of which are sensitiv e to hepatic fat content [11, 17]. In fatty li ver , increased scattering leads to a higher backscatter coefficient compared with normal liv er tissue [33]. T o detect early steatosis, both parametric backscatter analyses[38] and non-parametric statistical methods [26, 6] hav e been proposed. Paramet- ric backscatter models are often expressed with generalized probability-density functions that encompass backscattering distributions such as the homodyned-K [9] and Nakagami [49, 51] models. Numerous experimental studies have reported a positi ve correlation between backscatter metrics and steatosis grade [52, 3, 54]. Among the many QUS techniques, this w ork concentrates on Nakagami-based ultrasound imaging for the assessment of hepatic steatosis. B. Ultrasound Nakagami Imaging The Nakagami distribution is widely used in speckle anal- ysis to characterize the statistical properties of tissue scat- tering in ultrasound imaging [15, 53]. It offers a simple moments-based method for estimating the shape parameter m , which is easy to implement and yields low bias. How- ev er, MLE estimators provides a lower-v ariance estimate of m [8]. T o reduce the error of MLE-based m estimates, sev eral approximations hav e been proposed, including the T olpare v-Polyakov , Lorenz, Greenwood-Durand, and recur - siv e Bowman estimators [22]. The WMC technique further improv es the smoothness of parametric maps by fusing re- sults from different window sizes, thereby balancing spatial resolution and v ariance [48, 55]. In addition, coarse-to-fine approaches that employ p yramidal layers effecti vely preserv e details in heterogeneous tissues [13]. Ultrasound Nakagami imaging has been applied to a v ariety of tissue-characterization tasks, including li ver fibrosis [15, 49, 10], thermal lesions [34, 53], and breast masses [41, 50]. The technique has sho wn particular promise for fatty-li ver assessment through backscatter-statistics analysiss [14, 51]. One notable study used the Nakagami shape parameter to quantify li ver-tissue echo-amplitude statistics, distinguishing pre-Rayleigh, Rayleigh, and post-Rayleigh regimes [47]. This work highlights the potential of Nakagami imaging for a more accurate ev aluation of hepatic steatosis. Nev ertheless, most previous studies relied on existing es- timators (moments-based or MLE). In contrast, we introduce a novel estimator based on the score function and posterior mean. T o the best of our kno wledge, this is the first such estimator proposed, and we validate its performance using real-patient data. I I I . B AC K G RO U N D A. Nakagami Distribution The probability density function of the ultrasound backscat- tered en velope R under the Nakagami statistical model can be described as follows: p R ( r | m, Ω) = 2 Γ( m ) m Ω m r 2 m − 1 exp − m Ω r 2 U ( r ) (1) where r is a value of the random variable R , Γ( · ) and U ( · ) represent the Gamma function and the unit step function, respectiv ely . Ω denotes the scale parameter, while m is the Nakagami parameter or shape parameter that determines the statistical distribution of the ultrasound backscattered en ve- lope [31]. Specifically , a Nakagami parameter ranging from 0 to 1 indicates a transition from a pre-Rayleigh to a Rayleigh distribution, while a parameter lar ger than 1 implies that the statistics of the backscattered signal conform to post-Rayleigh distributions. B. Momentum Estimator s The momentum estimators are classical methods used for estimating parameters in statistical methods. Nakagami [31] provides the momentum estimator for the Nakagami parameter m as follows: m in v = [ E ( R 2 )] 2 E [ R 2 − E ( R 2 )] 2 , ˆ Ω = E [ R 2 ] , (2) where m in v denotes the esimated Nakagmi paramter by the momentum estimator . The second moment of the Nakagami 3 Fig. 1: Nakagami imaging using conv entional methods and our UNICORN framew ork. (a) Momentum-based approach uses a sliding windo w for Nakagami parameter calculation. (b) Maximum likelihood method obtains Nakagami image through ML estimation. (c) UNICORN consists of two stages: training a score model to learn RF env elope score function, and inference step estimates Nakagami image in terms of score function. distribution is Ω . Therefore, ˆ Ω is an unbiased estimator for Ω . By employing the momentum estimators, ultrasound Nakagami imaging can be obtained by adopting the sliding window algorithm [46, 50]. In other w ords, the local Nakagami parameter is estimated within a square window of a specific size and assigned to the ne w pixel located at the center of the window . This process is repeated until the window cov ers the entire en velope image by sliding across it, as illustrated in Fig. 1 (a). C. Maximum Lik elihood Estimator In MLE approach [7], the Nakagami parameter m ML is de- termined by maximizing the likelihood function. Let R 1 , · · · , R N be random v ariables which are i.i.d according to Eq. (1). The log-likelihood function of the independent multiv ariate Nakagami distribution is giv en by: L ( m, Ω | r ) = − N log (Γ( m )) + N m log( m ) − N m log(Ω) (3) +(2 m − 1) N X i =1 log( r i ) − m Ω N X i =1 r 2 i where { r i , i = 1 , · · · , N } are the samples of { R i , i = 1 , · · · , N } . By differentiating the log-likelihood with respect to m and setting it equal to zero, we obtain the following expression: log( m ) − ψ ( m ) = log 1 N N X i =1 r 2 i ! − 1 N N X i =1 log( r 2 i ) (4) where ψ ( m ) is the digamma function, which is the deriv ati ve of the logarithm of the Gamma function. T o solve nonlin- ear Eq. (4), the T aylor approximation is adopted, ψ ( m ) ≈ log( m ) − (1 / 2 m ) : m ML = 1 2(log 1 N P N i =1 r 2 i − 1 N P N i =1 log( r 2 i ))) (5) where m ML denotes the esimated Nakagmi paramter using ML estimator . Similar to the momentum estimator , the ML estimator also adopts a sliding window approach to calculate the locally estimated Nakagami parameter as shown in Fig. 1 (b). D. W indow modulated Compound Estimator In WMC estimator [48], the Nakagami parameter m com is calculated by averaging K different Nakagami parameters { m i , i = 1 , · · · , K } , each obtained from a momentum esti- mator with a dif ferent windo w size Eq. (2): m com = 1 K K X i =1 m i (6) where K denotes the number of different windo w size, m com denotes the Nakagami parameter estimated by WMC estima- tor . I V . M E T H O D S Recent works of Noise2Score [20, 19] pro vided a highly efficient closed form formula for self-supervised image denois- ing using T weedies’ formula that utilizes the score function, i.e. the gradient of loglik elihood of the measurement. Inspired by this, here we introduce a nov el frame work for Ultrasound Nakagami Imaging with Score Matching and Adaptation, termed UNICORN. UNICORN consists of two steps: firstly , we learn the score function of the ultrasonic en velope data via denoising score matching loss. Then, we estimate the Nakagami parameter m per pix el, follo wed by a lo w-pass 4 filter , and reconstruct the Nakagami Imaging, as illustrated in Fig. 1 (c). In Section IV -A, we provide details of our proposed estimator for the Nakagami parameter . In Section IV -B, we explain the adaptation with low-pass filter . In Section IV -C, we introduce the loss function for learning the score function. A. Nakagami parameter Estimator with Scor e function Instead of maximizing the likelihood function with respect to m in the MLE [7], which entails complex computation and approximation errors, we calculated the posterior mean of the Nakagami parameter using the env elope data R , thereby achieving Minimum Mean Square Error Estimation (MMSE). According to Bayes’ rule, the joint posterior distribution can be represented as follo w: p R ( m, Ω | r ) = p R ( r | m, Ω) p ( m ) p (Ω) /p R ( r ) (7) where p ( m ) , p (Ω) , and p R ( r ) denote the marginal distribution of m , Ω and r , respectively . The mode of the posterior distrib u- tion can be obtained by finding the maximum of p R ( m, Ω | r ) . Specifically , by calculating the gradient of log p R ( m, Ω | r ) with respect to r and setting it zero, the posterior estimate of the parameter m should satisfy the follo wing equality: ∇ r log p R ( r | m, Ω) − ∇ r log p R ( r ) = 0 , (8) where ∇ r log p R ( r | m, Ω) and ∇ r log p R ( r ) are score function. By using this equality , we can deri ve the following closed-form estimator for the Nakagami parameter . Proposition 1. F or the given measurement model (1) , the estimate of the unknown Nakagami parameter m is given by ˆ m = E [ m | r ] = 1 r + ∇ r log p R ( r ) 2 r − 2 r ˆ Ω , (9) wher e ∇ r log p R ( r ) is the score function of the RF envelope data R and ˆ Ω = E [ R 2 ] Pr oof. See Sec. A. Notably , in the deri vation of Proposition 1, no approxi- mations are necessary , leading to more accurate estimations compared to existing methods. W e demonstrated that the posterior mean of the Nakagami parameter can be calculated using a nonlinear formula in volving the score function of the measurement. T o the best of our knowledge, this is the first attempt to estimate the Nakagami parameter using the score function of the measurement. B. Adaptation via Low-P ass F ilter In con ventional methods, the local Nakagami parameter is calculated within a predefined windo w size to stabilize the estimation at the expense of resolution. Instead of adopting a sliding window approach, our proposed method uses a pixel-by-pix el estimator to provide high-resolution images. T o further enhance the rob ustness of the algorithm against outliers, we incorporate a small-size low-pass filter , such as a median or av erage filter , to the estimated parameters ˆ m as follows: m UNICORN = low-pass Filter ( ˆ m ) (10) where m UNICORN is the final Nakagami parameter obtained by our proposed method. As indicated in Fig. 1 (c), we obtain the final Nakagami image map using the pix el-by-pixel estimator combined with a lo w-pass filter . C. Loss function for Denoising Scor e Matching T o learn the score function from the ultrasound backscat- tered env elope R , we employ the amortized residual DAE (AR-D AE), which is a stabilized implementation of denois- ing autoencoder [25] Specifically , AR-D AE loss function is defined by: arg min Θ = E R ∼ p R ( r ) ∥ u + σ a s θ ( R + σ a u ) ∥ 2 (11) where s θ is the score model parameterized by θ , u ∼ N (0 , I ) , and σ a ∼ N (0 , δ 2 ) . σ a is perturbed noise which gradually decreases with an annealing schedule. Minimizing Eq. (11) provides the network s θ ∗ which can directly estimate the score function of en velope data, s θ ∗ = ∇ R log p R ( r ) = l ′ ( r ) . Estimating the score function of measurements via Eq. (11) has been demonstrated to be both direct and stable [20, 19]. Therefore, we adopt this approach as the initial step of our method (see Fig. 1 (c)). V . E X P E R I M E N T A L S E T T I N G In this work, we conduct tw o cate gories of e xperiments to validate the effecti veness of our proposed method. Firstly , we perform simulations using synthetic Nakagami distrib utions on grayscale image dataset and ultrasound image dataset. Secondly , we apply our method to real ultrasound RF env elope datasets to v alidate the effecti veness of distinction between normal liv er and fatty liver . A. Datasets Synthetic Simulation Experiments W e conduct ev aluations on both the MNIST and the BUSI ultrasound image datasets. For the MNIST dataset, we train our neural network to learn the score function using the training set and ev aluate its performance on the test set. For the BUSI dataset [2], which consists of breast ultrasound B-mode images from women, we adopt it for our ultrasound image dataset. For simulation experiments, we initially normalize images from the range of 0 to 1 to the range of 0.5 to 2 and set it as the ground truth m . Subsequently , we apply the Nakagami distrib ution (as described in Eq. (1)) per pixel to generate synthetic measurement with Ω = 1 . In-vivo Liver Experiment T o v alidate the effecti veness of clinical usefulness, we ev aluate the in-viv o liver dataset. In viv o liv er experiments were conducted using data collected from Samsung Medical Center (SMC). The hospital’ s Insti- tutional Revie w Board has approved this study (IRB No. SMC 2022-11-026). Written informed consents were obtained 5 T ABLE I: The number of subjects across hepatic steatosis stages determined by MRI PDFF on each dataset. One frame per patient is used for statistical analysis. MRI-PDFF Dataset < 5% (Normal) 5% - 15% (Mild) ≥ 15% (Severe) T otal SMC 224 170 55 449 from all participants to utilize their data. Ultrasound radiofre- quency (RF) data was acquired using the RS85 system and a con ve x probe (CA1-7S) from Samsung Medison. Multiple ultrasound scans of the right intercostal plane were performed by radiologists at each institution to visualize the hepatic parenchyma of the right li ver , and RF data was automatically recorded for each scan. Magnetic resonance imaging proton density fat fraction (MRI-PDFF) data was obtained according to the standardized protocol recommended by the Quantitati ve Imaging Biomarkers Alliance (QIBA) [42]. The distribution of hepatic steatosis severity grades for patients recruited by each institution is summarized in T ab . I. B. Implementation Details T o ensure a fair comparison with other methods, we com- pare our proposed method with conv entional approaches such as the momentum estimator [46], MLE approach [7], and WMC estimator [48]. The baseline windo w size is set to a side length equal to three times the pulse length of the incident ultrasound; for the WMC method the window size is varied from three to fi ve times the pulse length. For training the score network, we use the following batch sizes: 512 for the MNIST dataset, 16 for the BUSI dataset, and 4 for the in-viv o dataset. All datasets are trained for 50 epochs with an initial learning rate of 2 × 10 − 4 , which is halv ed after 25 epochs. Optimization is performed with AdamW (weight decay=0.01). Data augmentation includes horizontal flipping, rotation, and random cropping to 256 × 256 pixels. The model is implemented in PyT orch and run on a sin- gleNVIDIA GeForce 3090 GPU. For the in-vi vo experiments we employ the SMC dataset with 5-fold cross-validation. Low-pass filtering is applied as follo ws: a median filter (kernel size=7) for the synthetic e xperiments and an av erage filter (kernel size=7) for the in-vi v o experiments. C. Evaluation Metric Synthetic Simulation Experiments Since we generate syn- thetic measurements under the Nakagami distrib ution using the ground truth image, we ev aluate the performance of the simulation results using the PSNR (Peak Signal-to-Noise Ratio) and RMSE (Root Mean Square Error) metrics across various methods. Specifically , we calculate the metrics with the following equation: PSNR = 10 log 10 MAX 2 I MSE , RMSE = √ MSE (12) where MAX I is the maximum possible pixel value of the image and MSE is the Mean Square Error between the ground truth image and the estimated image. In-vivo Liver Experiment In this experiment, we are unable to access the ground truth data for Nakagami imaging itself, prev enting a quantitati ve ev aluation against a reference. In- stead of ground truth Nakagami imaging, we utilize the MRI- PDFF v alue with paired en velope data to e valuate our proposed method. The MRI-PDFF is considered a reliable quantification metric of liv er fat fraction. Using MRI-PDFF , we conduct various statistical analyses. First, we calculate the correlation between the estimated Nakagami parameter in the li ver region and MRI-PDFF to validate clinical usefulness. Furthermore, we define steatosis stages based on MRI-PDFF extents as indicated in T ab . I. W e then analyze the differentiation between stages using box plots and Receiv er Operating Characteristic (R OC) curv es with Area Under the R OC Curve (A UR OC). In normal li ver tissue, ultrasound backscatter is typically lower and more uniform. F atty li ver , howe ver , e xhibits in- creased backscatter due to fat deposits and altered tissue architecture, leading to more intense reflection and scattering. The Nakagami parameter , which quantifies backscatter, is therefore higher in f atty liv er , aiding in its distinction from normal liver . Thus, we assess qualitative results based on the differences in Nakagami parameters between normal and fatty liv er cases. T ABLE II: Quantitativ e simulation results for MNIST dataset and ultrasound image BUSI dataset using various methods. The bold numbers indicate the best performance. WS denotes sliding window size. Dataset MNIST BUSI Metric WS PSNR (dB) ↑ RMSE ↓ WS PSNR (dB) ↑ RMSE ↓ Measurement - 9.17 0.695 - 10.14 0.651 Momentum 9 21.01 0.179 9 18.58 0.230 Momentum 11 21.28 0.173 13 21.22 0.174 Momentum 13 20.78 0.184 25 23.31 0.132 MLE 11 20.45 0.191 25 22.65 0.148 WMC 9,11,13 21.69 0.165 9,13,25 22.28 0.154 WMC 7,9,11,13,15 21.53 0.168 9,13,17,21,25 23.01 0.141 UNICORN (Ours) - 28.28 ( +6.75 ) 0.077 ( -0.091 ) - 25.72 ( +2.11 ) 0.011 ( -0.130 ) V I . R E S U LT S A. Synthetic Simulation dataset In T ab . II, we provide a quantitative performance compari- son using various methods on the MNIST and BUSI datasets in terms of PSNR and RMSE. For the MNIST dataset, the PSNR of the measurement method is only 9.17 dB compared to the ground truth, indicating the highly ill-posed nature of the problem. Momentum-based approach results were sensitiv e to varied window sizes. Since MLE needs higher computational cost compared to the momentum-based approach, we select the best window size from momentum-based approaches for MLE and set the step size to half of the windo w size. Our proposed method, UNICORN, does not require any window size optimization but still achieves the highest PSNR of 28.28 dB and the lo west RMSE of 0.077, surpassing all other methods. UNICORN also outperforms the existing state-of- the-art method by a significant margin of +6.75 dB in PSNR. Similarly , on the BUSI dataset, UNICORN achie ves superior performance with a PSNR of 25.71 dB and an RMSE of 0.089, representing a margin of +2.7 dB in PSNR. In Fig. 2, we compare the qualitative results of our proposed method against e xisting methods. W e observ e that the results 6 Fig. 2: Comparison of qualitativ e results across v arious methods: (Row 1) MNIST dataset, (Ro ws 2-3) B USI Ultrasound Image dataset. Comparison against Momentum, MLE, WMC, and UNICORN. The yellow numbers indicate PSNR. T o visualize the results, we normalize the images and conv ert them to grayscale. obtained with Momentum-based approaches and the MLE ap- proach are too blurred out and exhibit artifacts, such as the tile effect. While the WMC approach mitigates blurring to some extent, it introduces speckle noise artifacts. In contrast, our proposed method is capable of closely estimating Nagakami parameter mapping compared to the ground truth label in MNIST and pro vides superior resolution without significant artifacts in BUSI dataset. B. Qualitative Results on Real Clinical data Using the RF en velope dataset from real ultrasound imag- ing, we compare qualitati ve results with various methods as illustrated in Figure 3. The figure displays results from the SMC in-vi vo dataset for three representative cases: a normal liv er, a mildly steatotic li ver , and a sev erely steatotic liver . Con ventional estimators, namely the momentum estima- tor [46], the MLE estimator [7], and the WMC estimator [48], do produce activ ation values within the liv er region, but the acti vations for mild versus severe fatty li ver are hardly distinguishable, making visual discrimination ambiguous at best. Con versely , both mild and severe fatty-li ver cases sho w markedly elev ated Nakagami values that are confined to the liv er region, with a clear gradient reflecting the degree of steatosis. This striking contrast enables an instantaneous and reliable distinction between normal and fatty liver tissue, allowing the practitioner to assess the sev erity of steatosis at a glance. Hence, UNICORN not only overcomes the subtlety problem of existing techniques but also sets a new benchmark for intuitiv e, image-based assessment of hepatic steatosis. C. Analysis on Real Clinical data Correlation Between Nakagami Parameter and MRI-PDFF T o further demonstrate the ef fectiv eness of UNICORN, we calculate the Pearson correlation coef ficient (PCC) between the estimated Nakagami parameter m by each method and MRI-PDFFs, and we test the statistical significance of the correlations as indicated in T ab . III. The momentum estimator and WMC estimator yield moderate PCC values ranging from 0.53 to 0.544, whereas the MLE method achie ve a slightly higher PCC of 0.65. In contrast, UNICORN produce the strongest correlation, with a PCC of 0.77, and the associated p -v alues are significant on dataset. Fig. 4 illustrates the scatter plots of m versus MRI-PDFF for the baseline methods and UNICORN. The conv entional approaches tend to saturate once m exceeds 5, indicating limited scalability and a markedly non-linear relationship with MRI-PDFF . UNICORN, ho we ver , maintains an approximately linear trend across the entire range of m , preserving scalability and yielding a monotonic increase in MRI-PDFF for all subjects. This linearity highlight UNICORN’ s superior ability to model the relationship between the Nakagami parameter and liv er fat fraction, representing a clear improvement ov er existing techniques. T ABLE III: Comparison of Pearson Correlation Coef ficient (PCC) between MRI-PDFF and estimated Nakagami m pa- rameters and Statistical Significance (SS) across various meth- ods Method SMC PCC(r) SS Momentum 0.53 **** MLE 0.65 **** WMC 0.54 **** UNICORN(Ours) 0.77 **** 7 Fig. 3: Comparison of qualitative results obtained using different methods. Each row corresponds to Normal, Mild, and Sev ere liv er cases, with MRI-PDFF values of 0.71, 6.34, and 22.12, respectiv ely . The comparison includes the Momentum, MLE, WMC, and UNICORN methods. Red dashed lines delineate the li ver region. Compared to other methods, our approach provides clearer visual cues for distinguishing between normal, mild, and sev ere fatty liv er cases. Fig. 4: Scatter plots illustrating the relationship between MRI-PDFF and estimated m parameters across various methods and datasets: Columns 1-4 represent Momentum, MLE, WMC, and UNICORN, respecti vely; PCC denotes the Pearson Correlation Coefficient between MRI-PDFF and the estimated m parameter . The trend line follows a locally weighted linear regression model. In vestigation on Different Fact Fraction Stages T o further validate UNICORN’ s ef fectiveness, we compare the estimated Nakagami shape parameter m across three fat-fraction stages as depicted in Fig. 5. W e categorize the stages into three groups: normal (MRI-PDFF < 5 % ), mild (5 % ≤ MRI-PDFF < 15 % ), and se vere (MRI-PDFF > 15 % ). Each box plot displays the distribution of m within a stage, with W elch’ s t- test p-v alues quantifying separability between adjacent stages. Fig. 5 re veals that baseline methods yield sparse, high-variance distributions, while UNICORN produces a stable, low-v ariance distribution, particularly for normal cases. This robustness demonstrates its reliability for stage discrimination. Figure 6 illustrates the ROC curves for the Nakagami parameter in hepatic steatosis classification, e valuated on the SMC dataset across three pairwise comparisons: (A) Normal vs. Mild, (B) Mild vs. Severe, and (C) Normal vs. Sev ere. 8 Fig. 5: Box plots illustrating the relationship between MRI- PDFF and estimated m parameters across different methods at each stage: Methods include Momentum, MLE, WMC, and UNICORN; stages are defined as Normal (MRI-PDFF < 5 % ), Mild (5 % ≤ MRI-PDFF < 15 % ), and Se vere (MRI-PDFF > 15 % ). The p -v alues between neighboring stages are indicated within the box plots. For comparison (A), the momentum and WMC estimators yielded moderate A UR OCs of 0.82–0.83, while the MLE estimator and UNICORN achiev ed higher v alues of 0.88 and 0.87, respectively . In comparison (B), UNICORN significantly outperformed baseline methods, exceeding the momentum estimator by 0.12 A UROC points and the MLE estimator by 0.06 A UR OC points. This advantage arises from UNICORN’ s linear relationship with MRI-PDFF , whereas other methods exhibit saturation at higher f at fractions. For comparison (C), baseline methods demonstrated strong performance (A UR OC = 0.90–0.96), but UNICORN attained near-perfect discrim- ination with an A UR OC of 0.99. Collecti vely , these results confirm UNICORN’ s diagnostic superiority , particularly for advanced steatosis stages. T ab . IV presents the R OC analysis of UNICORN (Fig. 6), reporting sensitivity , specificity , positiv e predictiv e value (PPV), and negati ve predictive value (NPV) at three thresh- olds: (a) the optimal threshold maximizing the F1-score to address class imbalance [28], (b) a fixed 90% specificity threshold, and (c) a fixed 90% sensitivity threshold. For the comparison (A), UNICORN achieves a sensitivity of 0.73 and specificity of 0.87 at the optimal threshold, with corresponding PPV , NPV , and F1-scores of 0.81, 0.80, and 0.77, respec- tiv ely . At the 90% specificity threshold, sensitivity decreases to 0.68, while at the 90% sensitivity threshold, specificity falls to 0.57. In comparison (B), at the optimal threshold, UNICORN yields a sensitivity of 0.83, specificity of 0.62, PPV of 0.42, NPV of 0.92, and F1-score of 0.55. Under the 90% specificity constraint, sensitivity drops to 0.38; at 90% sensitivity , specificity is 0.48. Notably , for comparison (C), a clinically distinct classification, UNICORN demonstrates exceptional performance, with sensitivity and specificity both exceeding 0.93 across all thresholds. These results underscore UNICORN’ s diagnostic rob ustness, particularly in discriminat- ing extreme-stage steatosis (C), while maintaining adaptability to threshold tuning for nuanced classifications (A, B). T ab . V summarizes the ROC analysis comparing baseline methods with the UNICORN model at the optimal threshold (Fig. 6). UNICORN achiev es the highest A UC for distinguish- ing sev ere fatty liv er from mild and normal cases. Due to its lo wer false-positiv e rate, the optimal threshold for task (A) corresponds to relativ ely high specificity and low sensi- tivity . Consequently , UNICORN exhibits substantial gains in specificity (margins: 0.18–0.09) and PPV (margins: 0.06–0.13) for (A), albeit with slight declines in sensiti vity and NPV . When ev aluated by the F1-score, a metric suited to imbalanced data, UNICORN performs comparably to baselines in (A) and surpasses them in (B) and (C). Notably , for (C), UNICORN excels across all metrics. These results collecti vely demon- strate UNICORN’ s superior ability to discriminate steatosis stages, particularly for adv anced cases. T ABLE IV: ROC curve analysis of UNICORN (Fig. 6). (a) optimal threshold, (b) threshold for 90% specificity , (b) threshold for 90% sensitivity . PPV denotes positive predicti ve value and NPV denotes negati ve predictive v alue. A UC Sensitivity Specificity PPV NPV F1 (A) Normal vs Mild 0.87 (a) Optimal 0.73 0.87 0.81 0.80 0.77 (b) 90% Specificity 0.68 0.90 0.85 0.78 0.76 (c) 90% Sensitivity 0.90 0.57 0.62 0.88 0.74 (B) Mild vs Severe 0.80 (a) Optimal 0.83 0.62 0.42 0.92 0.55 (b) 90% Specificity 0.38 0.90 0.57 0.82 0.46 (c) 90% Sensitivity 0.90 0.48 0.36 0.94 0.52 (C) Normal vs Severe 0.99 (a) Optimal 0.98 0.93 0.79 0.99 0.88 (b) 90% Specificity 0.99 0.91 0.73 1.00 0.84 (c) 90% Sensitivity 0.91 0.97 0.88 0.98 0.89 T ABLE V: R OC curve analysis comparing baseline methods corresponding to Fig. 6. The threshold is selected by the highest F1 score. PPV denotes positiv e predicti ve v alue, and NPV denotes negativ e predicti ve value. Method A UC Sensitivity Specificity PPV NPV F1 (A) Normal vs Mild Momentum 0.83 0.85 0.68 0.68 0.85 0.76 MLE 0.88 0.83 0.78 0.75 0.85 0.79 WMC 0.82 0.88 0.65 0.68 0.87 0.76 UNICORN 0.87 0.73 0.87 0.81 0.80 0.77 (B) Mild vs Severe Momentum 0.68 0.70 0.60 0.36 0.86 0.47 MLE 0.74 0.68 0.67 0.41 0.87 0.51 WMC 0.70 0.62 0.71 0.41 0.85 0.50 UNICORN 0.80 0.83 0.62 0.42 0.92 0.55 (C) Normal vs Severe Momentum 0.90 0.76 0.89 0.64 0.93 0.69 MLE 0.96 0.92 0.90 0.71 0.98 0.80 WMC 0.90 0.77 0.88 0.62 0.94 0.69 UNICORN 0.99 0.98 0.93 0.79 0.99 0.88 V I I . A B L AT I O N S T U DY A N D F U RT H E R A N A L Y S I S A. Effect of the Low-pass filter T o validate the rationale behind using the low-pass filter (LPF), we compared the qualitativ e results with and without the LPF , as shown in Figure 7. Unlike baseline methods that apply an average filter at all sliding window steps, our method applies a single step of the low-pass filter . Therefore, the use of the LPF does not introduce any fairness issues. W e 9 Fig. 6: R OC curv es for estimated m parameters in the differentiation of hepatic steatosis stages using ov erall datasets across different methods: Momentum, MLE, WMC, and UNICORN. Stages are defined as Normal (MRI-PDFF < 5 % ), Mild (5 % ≤ MRI-PDFF < 15 % ), and Se vere (MRI-PDFF > 15 % ). (A) Normal vs Mild, (B) Mild vs Severe, and (c) Normal vs Se vere. Fig. 7: Comparison of with and without lo w-pass filter . (a) represents normal liver cases with MRI-PDFF values of 4.2, and (b) represents fatty li ver cases with MRI-PDFF values of 30.4. The red dashed lines indicate the li ver region. T ABLE VI: Computational comple xity including training memory latency and inference speed. Method Momentum MLE WMC UNICORN Train Memory (GB) - - - 13.68 Duration (sec/patient) 0.084 ± 0.003 33.79 ± 2.451 0.131 ± 0.005 0.004 ± 0.001 found that the results without the LPF show minimal changes, primarily eliminating outliers while still pro viding a visual distinction between normal and fatty li ver . After applying the LPF , we obtained smoother and more visually pleasing estimation results. Therefore, we adopt the low-pass filter in our method. B. Comparison on Inference Speed T o validate the efficiency of UNICORN, we compared the inference speed with other baseline methods, considering training memory latency , as shown in T ab . VI. Our framework does not require additional optimization steps, such as the MLE approach. Once the score model is trained, the inference requires only a single step, accelerated by GPU. The training memory requirement is 13.68 GB, which allows for the use of a single NVIDIA GeF orce 3090 GPU. This capability facili- tates local implementation e ven with limited GPU resources. Compared to the existing f astest approach, the momentum- based approach, our method is 20 times faster , making it more suitable for practical applications that require high frames per second (FPS) in ultrasound imaging. V I I I . D I S C U S S I O N A N D C O N C L U S I O N In this work, we introduced UNICORN, a nov el framework for ultrasound Nakagami Imaging, addressing limitations of existing methods in visualizing tissue scattering of ultrasound wa ves. Our method incorporates the score function of a beam- formed radiofrequency env elope and its signals, providing a closed-form estimator per pixel followed by lo w-pass filter adaptation. Unlike conv entional methods, we demonstrate that our proposed method calculates the posterior mean, achie ving the MMSE from a Bayesian perspectiv e. Furthermore, traditional methods typically employ a sliding square window to compute the Nakagami parameter, focus- ing primarily on tissue transitions within the windo w . This approach, howe ver , does not allo w for visualization of the parameter at the individual pixel lev el. In stark contrast, our pix el-le vel estimator method is designed to capture the Nakagami parameter directly at each pixel, marking a clear differentiation from prior techniques. Accordingly , a key ad- vantage of our approach is its ability to provide both stable and high-resolution ultrasound Nakagami imaging, of fering a more nuanced and accurate diagnostic tool compared to con ventional methods. In our simulation experiments, UNICORN demonstrated superior performance over traditional methods, achieving a significant margin of improv ement. Furthermore, by apply- ing real ultrasound en velope data, we rigorously validate UNICORN’ s ef fecti veness through in-depth analysis, demon- strating its capability to not only distinguish normal and fatty liver but also dif ferentiate between steatosis stages with 10 high precision. W e believ e that our framework holds promise for v arious applications in tumor diagnosis and fat fraction estimation, paving the w ay for adv ancements in ultrasound imaging techniques. I X . A C K N OW L E D G M E N T S The study recei ved approval from the Institutional Revie w Board (IRB) of Samsung Medical Center (IRB No. SMC 2022-11-026). This work was supported by Samsung Medison Co., Ltd. A P P E N D I X Pr oof. F or a giv en Nakagmi distribution Eq. (1) and equality Eq. (8), we ha ve ∇ r log p R ( r ) = (2 m − 1) 1 r − 2 m Ω r (13) Accordingly , m 2 r − 2 r Ω = 1 r + ∇ r log p R ( r ) (14) Furthermore, we have, ˆ Ω = E [ R 2 ] (15) Therefore, we have, ˆ m = E [ m | r ] = 1 r + ∇ r log p R ( r ) 2 r − 2 r ˆ Ω , where ˆ Ω = E [ R 2 ] (16) This concluded the proof. R E F E R E N C E S [1] Adams, L., Angulo, P .: Recent concepts in non-alcoholic fatty li ver disease. Diabetic medicine 22 (9), 1129–1133 (2005) [2] Al-Dhabyani, W ., Gomaa, M., Khaled, H., F ahmy , A.: Dataset of breast ultrasound images. Data in brief 28 , 104863 (2020) [3] Bamber , J., Hill, C.: Acoustic properties of normal and cancerous human liv er—i. dependence on pathological condition. Ultrasound in medicine & biology 7 (2), 121– 133 (1981) [4] Bigelow , T .A., Oelze, M.L., O’Brien Jr, W .D.: Estimation of total attenuation and scatterer size from backscattered ultrasound w av eforms. The Journal of the Acoustical Society of America 117 (3), 1431–1439 (2005) [5] Brav o, A.A., Sheth, S.G., Chopra, S.: Liver biopsy . Ne w England Journal of Medicine 344 (7), 495–500 (2001) [6] Chan, H.J., Zhou, Z., Fang, J., T ai, D.I., Tseng, J.H., Lai, M.W ., Hsieh, B.Y ., Y amaguchi, T ., Tsui, P .H.: Ul- trasound sample entropy imaging: A new approach for ev aluating hepatic steatosis and fibrosis. IEEE Journal of T ranslational Engineering in Health and Medicine 9 , 1–12 (2021) [7] Cheng, J., Beaulieu, N.C.: Maximum-likelihood based estimation of the nakagami m parameter . IEEE Commu- nications letters 5 (3), 101–103 (2001) [8] Destrempes, F ., Cloutier , G.: Revie w of env elope statis- tics models for quantitati ve ultrasound imaging and tis- sue characterization. In: Quantitativ e ultrasound in soft tissues, pp. 107–152. Springer (2023) [9] Dutt, V ., Greenleaf, J.F .: Ultrasound echo en velope anal- ysis using a homodyned k distribution signal model. Ultrasonic Imaging 16 (4), 265–287 (1994) [10] Fang, F ., Fang, J., Li, Q., T ai, D.I., W an, Y .L., T amura, K., Y amaguchi, T ., Tsui, P .H.: Ultrasound assessment of hepatic steatosis by using the double nakagami distribu- tion: a feasibility study . Diagnostics 10 (8), 557 (2020) [11] Ferraioli, G., Berzigotti, A., Barr , R.G., Choi, B.I., Cui, X.W ., Dong, Y ., Gilja, O.H., Lee, J.Y ., Lee, D.H., Moriyasu, F ., et al.: Quantification of liv er fat content with ultrasound: a wfumb position paper . Ultrasound in medicine & biology 47 (10), 2803–2820 (2021) [12] Ghoshal, G., Lav arello, R.J., Kemmerer , J.P ., Miller, R.J., Oelze, M.L.: Ex viv o study of quantitativ e ultrasound parameters in fatty rabbit liv ers. Ultrasound in medicine & biology 38 (12), 2238–2248 (2012) [13] Han, M., W an, J., Zhao, Y ., Zhou, X., W an, M.: Nakagami–m parametric imaging for atherosclerotic plaque characterization using the coarse-to-fine method. Ultrasound in Medicine & Biology 43 (6), 1275–1289 (2017) [14] Ho, M.C., Lee, Y .H., Jeng, Y .M., Chen, C.N., Chang, K.J., Tsui, P .H.: Relationship between ultrasound backscattered statistics and the concentration of fatty droplets in livers: an animal study . PLoS One 8 (5), e63543 (2013) [15] Ho, M.C., Lin, J.J., Shu, Y .C., Chen, C.N., Chang, K.J., Chang, C.C., Tsui, P .H.: Using ultrasound nakagami imaging to assess liv er fibrosis in rats. Ultrasonics 52 (2), 215–222 (2012) [16] Insana, M.F ., W agner , R.F ., Brown, D.G., Hall, T .J.: Describing small-scale structure in random media using pulse-echo ultrasound. The Journal of the Acoustical Society of America 87 (1), 179–192 (1990) [17] Jang, W ., Song, J.S.: Non-in vasi ve imaging methods to ev aluate non-alcoholic fatty liv er disease with fat quantification: a revie w . Diagnostics 13 (11), 1852 (2023) [18] Kawano, Y ., Cohen, D.E.: Mechanisms of hepatic triglyc- eride accumulation in non-alcoholic fatty liv er disease. Journal of gastroenterology 48 , 434–441 (2013) [19] Kim, K., Kwon, T ., Y e, J.C.: Noise distrib ution adap- tiv e self-supervised image denoising using Tweedie dis- tribution and score matching. In: Proceedings of the IEEE/CVF Conference on Computer V ision and Pattern Recognition. pp. 2008–2016 (2022) [20] Kim, K., Y e, J.C.: Noise2Score: Tweedie’ s approach to self-supervised image denoising without clean images. Advances in Neural Information Processing Systems 34 , 864–874 (2021) [21] Kleiner , D.E., Brunt, E.M., V an Natta, M., Behling, C., Contos, M.J., Cummings, O.W ., Ferrell, L.D., Liu, Y .C., T orbenson, M.S., Unalp-Arida, A., et al.: Design and val- idation of a histological scoring system for nonalcoholic fatty liver disease. Hepatology 41 (6), 1313–1321 (2005) 11 [22] Kolar , R., Jirik, R., Jan, J.: Estimator comparison of the nakagami-m parameter and its application in echocardio- graphy . Radioengineering 13 (1), 8–12 (2004) [23] Larrue, A., Noble, J.A.: Nakagami imaging with small windows. In: 2011 IEEE International Symposium on Biomedical Imaging: From Nano to Macro. pp. 887–890. IEEE (2011) [24] Li, Z., Liu, R., Gao, X., Hou, D., Leng, M., Zhang, Y ., Du, M., Zhang, S., Li, C.: The correlation between hepatic controlled attenuation parameter (cap) value and insulin resistance (ir) was stronger than that between body mass index, visceral fat area and ir . Diabetology & Metabolic Syndrome 16 (1), 153 (2024) [25] Lim, J.H., Courville, A., Pal, C., Huang, C.W .: Ar- dae: to wards unbiased neural entropy gradient estimation. In: International Conference on Machine Learning. pp. 6061–6071. PMLR (2020) [26] Lin, C.H., Ho, M.C., Lee, P .C., Y ang, P .J., Jeng, Y .M., Tsai, J.H., Chen, C.N., Chen, A.: Clinical performance of ultrasonic backscatter parametric and nonparametric statistics in detecting early hepatic steatosis. Ultrasonics p. 107391 (2024) [27] Lin, S.C., Heba, E., W olfson, T ., Ang, B., Gamst, A., Han, A., Erdman Jr , J.W ., O’Brien Jr, W .D., Andre, M.P ., Sirlin, C.B., et al.: Noninv asiv e diagnosis of nonalcoholic fatty liver disease and quantification of li ver fat using a new quantitative ultrasound technique. Clinical Gastroen- terology and Hepatology 13 (7), 1337–1345 (2015) [28] Lipton, Z.C., Elkan, C., Naryanaswamy , B.: Optimal thresholding of classifiers to maximize f1 measure. In: Machine Learning and Knowledge Discovery in Databases: European Conference, ECML PKDD 2014, Nancy , France, September 15-19, 2014. Proceedings, Part II 14. pp. 225–239. Springer (2014) [29] Ma, X., Holalkere, N.S., Mino-Kenudson, M., Hahn, P .F ., Sahani, D.V .: Imaging-based quantification of hepatic fat: methods and clinical applications. Radiographics 29 (5), 1253–1277 (2009) [30] Mishra, A., Y ounossi, Z.M.: Epidemiology and natu- ral history of non-alcoholic fatty liver disease. Journal of clinical and experimental hepatology 2 (2), 135–144 (2012) [31] Nakagami, M.: The m-distrib ution—a general formula of intensity distribution of rapid fading. In: Statistical methods in radio wav e propagation, pp. 3–36. Elsevier (1960) [32] Oelze, M.L., Mamou, J.: Revie w of quantitati ve ultra- sound: Env elope statistics and backscatter coefficient imaging and contributions to diagnostic ultrasound. IEEE transactions on ultrasonics, ferroelectrics, and frequenc y control 63 (2), 336–351 (2016) [33] Park, J., Lee, J.M., Lee, G., Jeon, S.K., Joo, I.: Quan- titativ e ev aluation of hepatic steatosis using advanced imaging techniques: focusing on new quantitati ve ultra- sound techniques. K orean Journal of Radiology 23 (1), 13 (2022) [34] Rangraz, P ., Behnam, H., T a v akkoli, J.: Nakagami imag- ing for detecting thermal lesions induced by high- intensity focused ultrasound in tissue. Proceedings of the Institution of Mechanical Engineers, Part H: Journal of Engineering in Medicine 228 (1), 19–26 (2014) [35] Ratziu, V ., Charlotte, F ., Heurtier , A., Gombert, S., Giral, P ., Bruckert, E., Grimaldi, A., Capron, F ., Poynard, T ., Group, L.S., et al.: Sampling v ariability of liver biopsy in nonalcoholic fatty li ver disease. Gastroenterology 128 (7), 1898–1906 (2005) [36] Reeder , S.B., Hu, H.H., Sirlin, C.B.: Proton density fat- fraction: a standardized mr-based biomarker of tissue fat concentration. Journal of magnetic resonance imaging: JMRI 36 (5), 1011 (2012) [37] Rou, W .S., Rou, W .S.: Assessment of hepatic steatosis using ultrasound-based techniques: F ocus on fat quan- tification. Clinical Ultrasound 9 (1), 1–17 (2024) [38] Sato, Y ., T amura, K., Mori, S., T ai, D.I., Tsui, P .H., Y oshida, K., Hirata, S., Maruyama, H., Y amaguchi, T .: Fatty liv er e valuation with double-nakagami model under low-resolution conditions. Japanese Journal of Applied Physics 60 (SD), SDDE06 (2021) [39] Schwenzer , N.F ., Springer, F ., Schraml, C., Stef an, N., Machann, J., Schick, F .: Non-inv asiv e assessment and quantification of liver steatosis by ultrasound, computed tomography and magnetic resonance. Journal of hepatol- ogy 51 (3), 433–445 (2009) [40] Shankar , P .M.: A model for ultrasonic scattering from tissues based on the k distrib ution. Physics in Medicine & Biology 40 (10), 1633 (1995) [41] Shankar , P .M., Dumane, V ., Reid, J.M., Genis, V ., Fors- berg, F ., Piccoli, C.W ., Goldber g, B.B.: Classification of ultrasonic b-mode images of breast masses using nakagami distrib ution. IEEE transactions on ultrason- ics, ferroelectrics, and frequency control 48 (2), 569–580 (2001) [42] Shukla-Dave, A., Obucho wski, N.A., Chenev ert, T .L., Jambawalikar , S., Schwartz, L.H., Malyarenko, D., Huang, W ., No worolski, S.M., Y oung, R.J., Shiroishi, M.S., et al.: Quantitativ e imaging biomarkers alliance (qiba) recommendations for improved precision of dwi and dce-mri derived biomarkers in multicenter oncology trials. Journal of Magnetic Resonance Imaging 49 (7), e101–e121 (2019) [43] Sumida, Y ., Nakajima, A., Itoh, Y .: Limitations of li ver biopsy and non-inv asiv e diagnostic tests for the diagnosis of nonalcoholic fatty li ver disease/nonalcoholic steato- hepatitis. W orld journal of gastroenterology: WJG 20 (2), 475 (2014) [44] T argher , G., Day , C.P ., Bonora, E.: Risk of cardiovascular disease in patients with nonalcoholic fatty liv er disease. New England Journal of Medicine 363 (14), 1341–1350 (2010) [45] Thijssen, J.M., Starke, A., W eijers, G., Haudum, A., Herzog, K., W ohlsein, P ., Rehage, J., De Korte, C.L.: Computer-aided b-mode ultrasound diagnosis of hepatic steatosis: a feasibility study . ieee transactions on ultra- sonics, ferroelectrics, and frequency control 55 (6), 1343– 1354 (2008) [46] Tsui, P .H., Chang, C.C.: Imaging local scatterer concen- 12 trations by the nakagami statistical model. Ultrasound in medicine & biology 33 (4), 608–619 (2007) [47] Tsui, P .H., Ho, M.C., T ai, D.I., Lin, Y .H., W ang, C.Y ., Ma, H.Y .: Acoustic structure quantification by using ultrasound nakagami imaging for assessing li ver fibrosis. Scientific reports 6 (1), 33075 (2016) [48] Tsui, P .H., Ma, H.Y ., Zhou, Z., Ho, M.C., Lee, Y .H.: W indow-modulated compounding nakagami imaging for ultrasound tissue characterization. Ultrasonics 54 (6), 1448–1459 (2014) [49] Tsui, P .H., W an, Y .L.: Application of ultrasound nak- agami imaging for the diagnosis of f atty li ver . Journal of Medical Ultrasound 24 (2), 47–49 (2016) [50] Tsui, P .H., Y eh, C.K., Liao, Y .Y ., Chang, C.C., Kuo, W .H., Chang, K.J., Chen, C.N.: Ultrasonic nakagami imaging: a strategy to visualize the scatterer properties of benign and malignant breast tumors. Ultrasound in medicine & biology 36 (2), 209–217 (2010) [51] W an, Y .L., T ai, D.I., Ma, H.Y ., Chiang, B.H., Chen, C.K., Tsui, P .H.: Ef fects of fatty infiltration in human li vers on the backscattered statistics of ultrasound imaging. Proceedings of the Institution of Mechanical Engineers, Part H: Journal of Engineering in Medicine 229 (6), 419– 428 (2015) [52] Zagzebski, J., Lu, Z., Y ao, L.: Quantitative ultrasound imaging: in viv o results in normal liver . Ultrasonic imag- ing 15 (4), 335–351 (1993) [53] Zhang, S., Zhou, F ., W an, M., W ei, M., Fu, Q., W ang, X., W ang, S.: Feasibility of using nakagami distribution in ev aluating the formation of ultrasound-induced thermal lesions. The Journal of the Acoustical Society of America 131 (6), 4836–4844 (2012) [54] Zhou, Z., T ai, D.I., W an, Y .L., Tseng, J.H., Lin, Y .R., W u, S., Y ang, K.C., Liao, Y .Y ., Y eh, C.K., Tsui, P .H.: Hepatic steatosis assessment with ultrasound small-windo w en- tropy imaging. Ultrasound in medicine & biology 44 (7), 1327–1340 (2018) [55] Zhou, Z., W u, S., Lin, M.Y ., Fang, J., Liu, H.L., Tsui, P .H.: Three-dimensional visualization of ultrasound backscatter statistics by window-modulated compound- ing nakagami imaging. Ultrasonic Imaging 40 (3), 171– 189 (2018) [56] Zhou, Z., Zhang, Q., W u, W ., W u, S., Tsui, P .H.: Hepatic steatosis assessment using quantitativ e ultrasound para- metric imaging based on backscatter en velope statistics. Applied Sciences 9 (4), 661 (2019) [57] Zoller , H., T ilg, H.: Nonalcoholic fatty liv er disease and hepatocellular carcinoma. Metabolism 65 (8), 1151–1160 (2016)
Original Paper
Loading high-quality paper...
Comments & Academic Discussion
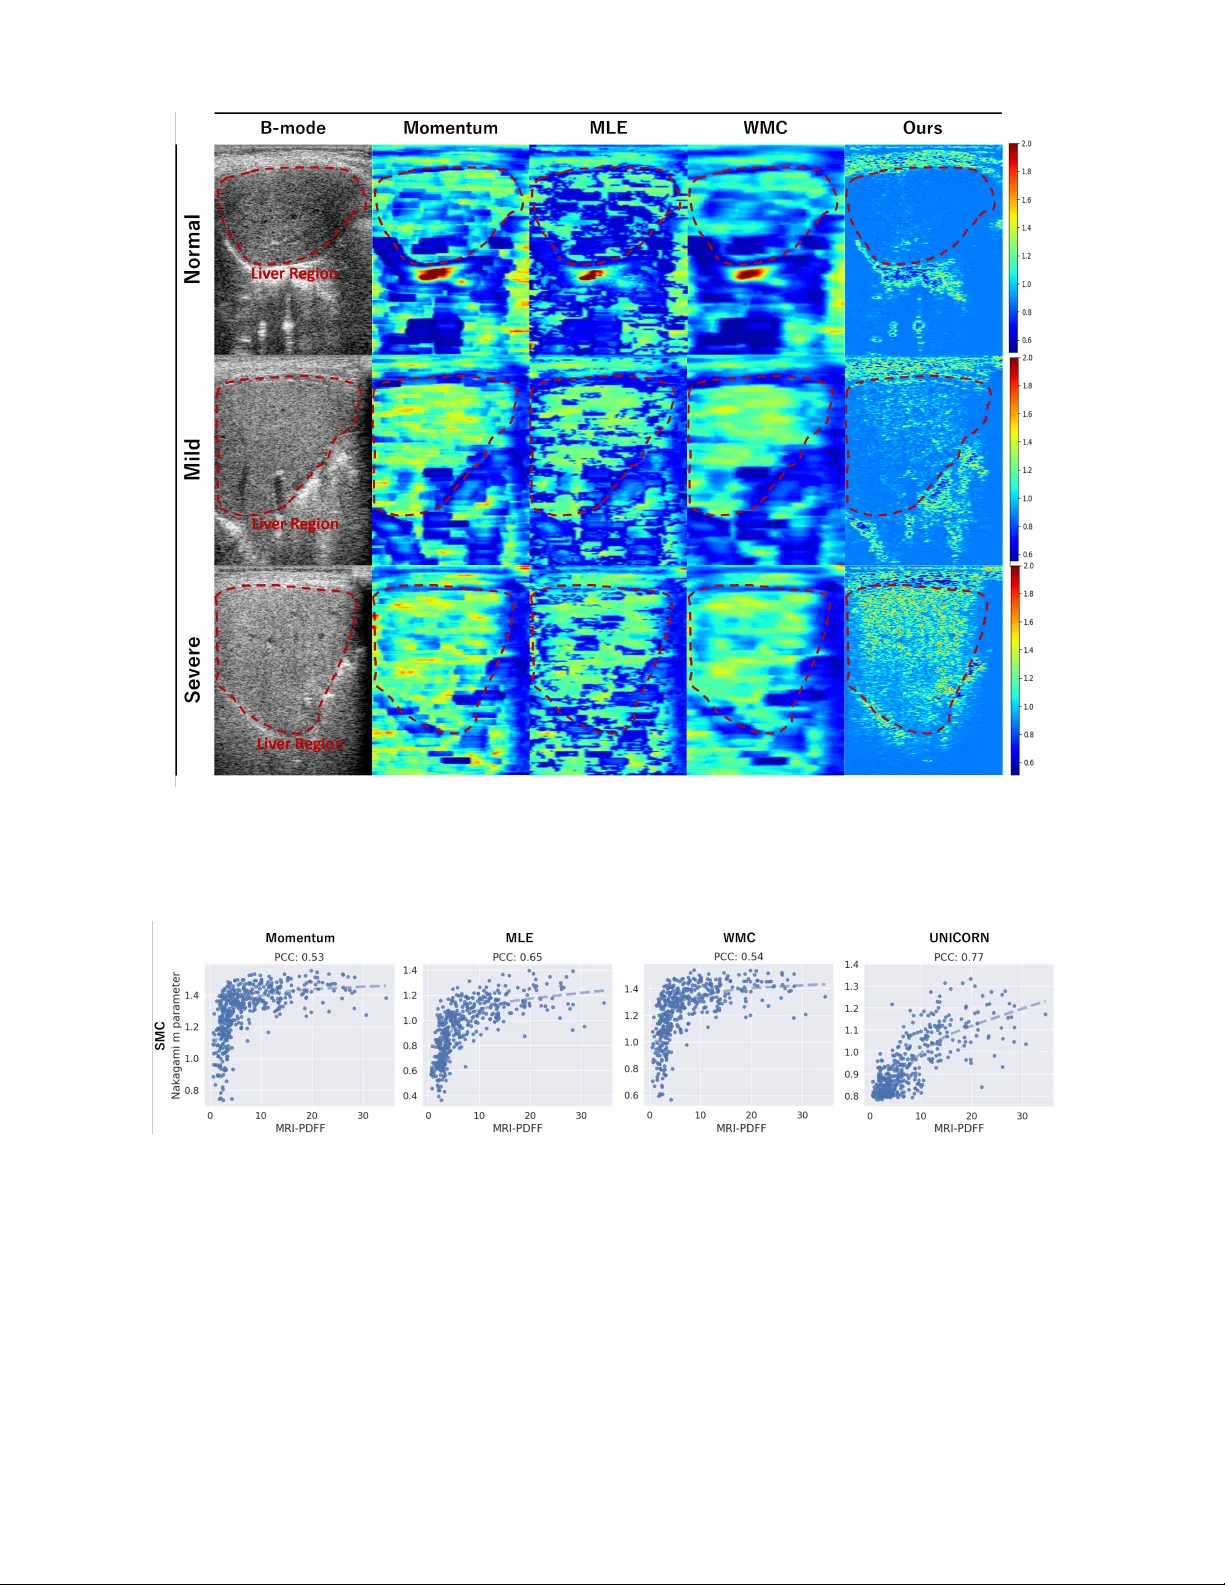
Loading comments...
Leave a Comment