Rethinking Frequency Control in Power Systems
Frequency control in power systems is implemented in a hierarchical structure traditionally known as primary frequency control (PFC), secondary frequency control (SFC) and tertiary control reserve (TCR) and, some jurisdictions, include time error con…
Authors: Taulant Kerci, Angel Vaca, Andrew Groom
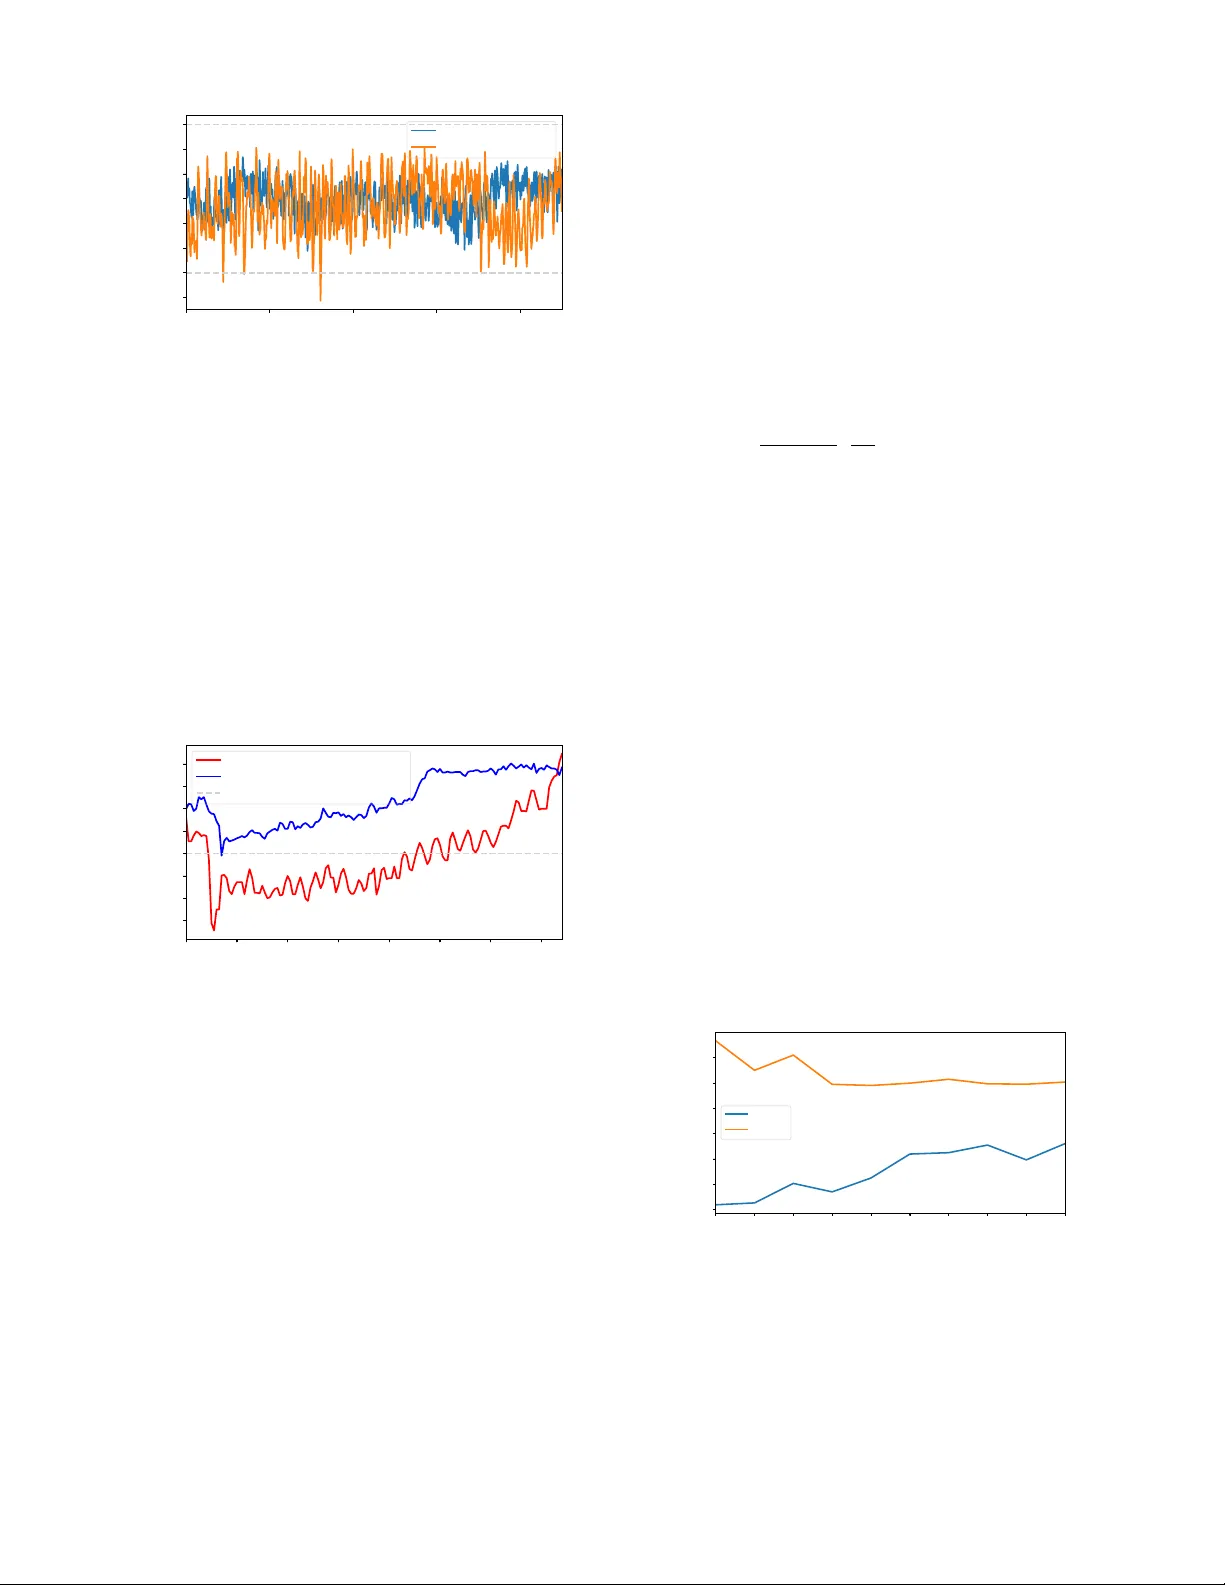
Rethinking Frequenc y Control in Po wer Systems T aulant K ¨ erc ¸ i, Senior Member , IEEE , ´ Angel V aca, Senior Member , IEEE , Andre w Groom, Julia Mate vosyan, F ellow , IEEE , and Federico Milano, F ellow , IEEE Abstract —Frequency control in power systems is implemented in a hierarchical structur e traditionally known as primary frequency contr ol (PFC), secondary fr equency control (SFC) and tertiary control reserve (TCR) and, some jurisdictions, include time error control (TEC) as well. This hierarchical structure has been designed around a century ago based on timescales sepa- ration, that is, approximately an order of magnitude differ ence between each control structur e. This paper argues, based on r eal- world observations as well as detailed dynamic simulations on a model of the All-Island power system (AIPS) of Ireland, that this frequency control structure is not necessary in curr ent and future converter -dominated power grids. The paper proposes to redesign this structure by removing the SFC and TCR and rely on PFC and a r eal-time energy market. The PFC is responsible for addressing fast power imbalances in timescales of tens of ms to few minutes (e.g., 100 ms to 5 minutes) while the real-time energy market is responsible for addressing longer imbalances in timescales of minutes to hours (e.g., 5 minutes to 1 hour). TEC, on the other hand, is considered as optional. Index T erms —Hierarchical contr ol, primary frequency control, deadband, stringent requir ements, real-time energy market. I . I N T RO D U C T I O N A. Motivation Since the late 1920s, the structure of the frequenc y control has remained substantially unaltered. It consists of real-time automatic primary frequency control (from speed gov ernors), an automatic secondary frequenc y control (SFC) — also known as automatic generation control (A GC) — and an allocation of generation, based on economic considerations, known as tertiary control reserve (TCR). In some cases, there can exist an automatic time error correction (TEC) that operates in a longer time scale than TCR. These controls establish a hierarchal structure which is based on timescales separation. This structure is lar gely still in place today . How- ev er , as a consequence of the mo ve tow ards po wer systems with high shares of in verter -based resources (IBRs), the power system community has recognized the need to rediscuss needs, features and requirements of frequency control [1], [2]. In this context, we argue that the existing structure is not necessary in power systems with high penetration of IBRs, this leading to a T . K ¨ erc ¸ i and ´ A. V aca are with the Irish Transmission System Operator , EirGrid, Ireland. A. Groom is with the Australian Energy Market Operator, Melbourne, V ictoria, 3000, Australia. J. Matevosyan is with the Energy Systems Integration Group, Reston, V A 20195 USA. F . Milano is with School of Electrical and Electronic Engineering, Uni- versity College Dublin, Belfield Campus, Dublin 4, Ireland. Corresponding author . e-mail: federico.milano@ucd.ie. This work was partially supported by Sustainable Energy Authority of Ireland (SEAI) by funding Federico Milano through FRESLIPS project, Grant No. RDD/00681. simpler , yet equally secure, and potentially more economical operation of the grid. B. Backgr ound Figure 1 shows, assuming for illustration purposes an un- derfrequency (UF) e vent, that PFC (which includes fast fre- quency response (FFR)) is responsible to contain and recover frequency in timescales of seconds to sev eral minutes (e.g., 5 minutes), then SFC is responsible to recover frequency to normal operating le vels and remov e the steady-state error following PFC provision in timescales of tens of seconds to tens of minutes (e.g., 5-15 minutes) and then TCR acts to replace SFC reserves in timescales of tens of minutes to one hour . Finally , TEC makes sure that the accumulated time error does not exceed predefined limits such as ± 10 s or ± 20 s in timescales of hours to days. [Hz] 5 9 . 9 8 5 9 . 9 6 0 . 0 0 0 20 40 60 S y s t e m F r e q u e n c y 10 S e c o n d s M i n u t e s 20 30 0 20 40 60 10 S e c o n d s M i n u t e s 20 30 A r r e s t i n g P e r i o d R e c o v e r y P e r i o d P o s t R e c o v e r y P e r i o d P o w e r [MW] H o u r s 10 1 H o u r s 10 1 E l e c t r o m a g n e t i c E n e r g y I n e r t i a l R e s p o n s e P r i m a r y F r e q u e n c y C o n t r o l G o v e r n o r r e s p o n s e a n d F F R S e c o n d a r y F r e q u e n c y C o n t r o l R e s o u r c e s o n A G C a n d / o r m a n u a l ( r e - ) d i s p a t c h T e r t i a r y Con trol Reserv e R e s o u r c e s t h r o u g h o p e r a t o r d i s p a t c h T i m e E r r o r C o n t r o l R e s o u r c e s o n A G C o r m a n u a l ( r e - ) d i s p a t c h F F R (w i nd t urbi ne s w / o he a droom ) G o v e rnor re s p on s e F F R (O t he r form s ) Fig. 1: Illustration of timescales of frequency control (adapted from [3]). Based on the classification given in Fig. 1, transmission system operators (TSOs) hav e defined standard frequency reserve products to be procured in ancillary services markets. For instance, Fig. 2 depicts the different products defined by the European network of TSOs for electricity (ENTSO-E). These reserves include frequency containment reserve (FCR) or PFC with a full activ ation time (F A T) of 30 s, frequency restoration reserve (FRR) or SFC including both automatic frequency restoration reserv e (aFRR) with F A T of 5 minutes and manual frequency restoration reserve (mFRR) with F A T of 12.5 minutes. The aFRR represents automatic SFC (A GC) while mFRR both manual SFC and part of manual TCR, and replacement reserv e (RR) represents TCR. The interested reader is referred to [4] and references therein for further detailed information on the hierarchical frequency control structure and the above reserves defined and used by ENTSO- E, respectively . T o av oid possible confusion, in the rest of the paper we will refer to PFC, SFC/A GC and TCR. 1 2 . 5 m i n 3 0 s RR T e r t i a r y T i m e 5 m i n 6 0 m i n m F R R S e c onda r y/ T e r t i a r y a F R R S e c ondar y F C R P r i m a r y r e s e r v e r e s e r v e r e s e r v e r e s e r v e Do wn w ard [MW] Up w ard [MW] Fig. 2: Illustration of ENTSO-E standard products (adapted from [5]). C. Contributions This manuscript argues that SFC and TCR are not strictly necessary anymore in real-w orld con verter -based power sys- tems. Based on this observ ation, the paper proposes to redesign the existing frequenc y control structure by removing the SFC and TCR and relying on PFC and a real-time energy market. Specific novel contributions are as follows. • A comprehensiv e, evidence-based discussion, on why there is a need to rethink frequenc y control in real-world power systems. • A new frequency control management approach that improv es frequenc y quality , reduces power system com- plexity and potentially reduces ancillary services costs. A case study based on a realistic model of the All-Island power system (AIPS) of Ireland supports the proposed new frequency control management approach. D. Or ganization The rest of the manuscript is or ganized as follo ws. Section II provides a detailed list of real-world e vidence on why there is a need to rethink frequency control. Section III illustrates and discusses the proposed frequency control management approach and Section IV provides a discussion on economic considerations related to it. A case study based on a model of the AIPS is then presented in Section V. Finally , concluding remarks and future work directions are gi v en in Section VI. I I . R E T H I N K I N G F R E Q U E N C Y C O N T R O L This section discusses, based on practical considerations, pros and cons of existing control structure; the importance of mandatory stringent frequency control requirements; real- world e vidence of PFC from different resources such as renew able energy sources (RES); distrib uted ener gy resources (DER) and high v oltage direct current (HVDC) interconnectors (ICs); and their impact on different aspects of frequency such as frequency recovery , distribution, and maximum frequency deviations. 1 The section also discusses, at a high-le vel, market design aspects. A. Pr os and Cons of Existing F r equency Contr ol Structur e The advantages of the existing frequency control struc- ture are certainly many and relev ant. Most importantly , it is relativ ely simple and is based on a century of operational 1 Some system operators rely on PFC from loads — e.g., loads with controllable droop-type response in Hydro Qu ´ ebec. Howe ver , for space limitation, PFC from loads is not discussed in this section. experience. It is thus well understood and has prov en to work well under a large v ariety of operating conditions, including extreme e vents. The hierarchical structure prev ents control interactions and unwanted oscillations. Moreover , it addresses frequency , tie-line load and TEC simultaneously and is substantially decoupled from energy markets and dynamics. On the other hand, existing frequency control structure has also sev eral drawbacks. The following is a list of the major issues that ha ve been recognized by TSOs and practitioners: • Relati vely slow for power systems that are increasingly experiencing faster dynamics. • Dif ficult to adapt to nov el technologies. For instance, making A GC work using battery energy storage systems (BESS) with fast ramp rates and con ventional units with relativ ely slow ramp rates is not straightforward. • Balances v arious objectives simultaneously (A GC) lead- ing in some instances to opposite control signals [6]. • SFC has communication delays. • Designed based on large inertia and limited number of slow con v entional synchronous generators. • Prone to cyber-attacks. • Generally neglects cost of po wer used for control. • No adaptiv e control and/or based on static parameters. • Includes single point failures due to centralized strate gies. • Needs coordination and has low scalability and fle xibility . • Relati vely too many frequency control services/products. • Includes manual control. • Does not recognize dev elopments in energy markets (e.g., real-time market with high time interval resolution). Furthermore, key parameters such as the control area’ s frequency bias characteristic (part of AGC), are difficult terms to quantify . This is due to the fact that the frequency bias rep- resents the combined droop characteristics of all the generators serving the load plus the frequency dependency of the load. Howe ver , as most A GC use integral controllers, this inability to accurately quantify the control area’ s frequency response characteristic has not caused particular issues [7]. B. Remarks on Mandatory PFC TSOs rely on minimum grid code requirements from transmission-connected resources to maintain system stability and security . One critical requirement is the capability and ongoing enablement to provide mandatory PFC as part of the connection process. For instance, the European Union legis- lation requires all transmission-connected resources, including RES and HVDC ICs, to be able to pro vide PFC with narrow deadband (e.g., ± 15 mHz) and PFC with wide deadband (e.g., ± 200 mHz), for both UF and OF . In addition to mandatory requirements, and to make sure there is sufficient reserve av ailable, system operators usually procure certain amount of balancing capacity through dedi- cated ancillary service products. Frequency control ancillary services/products work in tandem with mandatory PFC to ensure control frequenc y within and outside the standard fre- quency range (e.g., ± 200 mHz). Howe ver , it is distinguished from mandatory PFC in the following key aspects: • Ancillary services are provided by the reserved head- room, footroom, stored energy and defined frequency settings, as specified in a market ancillary service offer (e.g., based on day-ahead procurement). Mandatory PFC, on the other hand, is a response based on a scheduled resource a vailable capacity and energy at the time and with fixed frequency response settings. • Ancillary services requirements may change continuously such as every 5 minutes in Australia (A US), whereas mandatory PFC is an ongoing power system security requirement ev ery time a resource recei ves a dispatch instruction to generate a volume greater than zero MW . In addition, an y frequency response provided within the standard range (e.g., ± 200 mHz) by an ancillary service provider providing mandatory PFC, is considered as contribut- ing towards its deliv ery requirements for contingency ancillary service. Another aspect to consider is the deviation from market dispatch due to mandatory PFC provision. Howe ver , these changes tend to be small and short duration and will be minimised by having maximum participation in PFC. Thus, it will allo w market participants to maintain close compliance with their energy market dispatch instructions. For instance, when testing the implementation of narrow PFC deadbands in T ansmania (T AS) in 2018 the Australian Energy Market Op- erator (AEMO) stated: “As expected, narrowing the frequency deadband caused incr eased deviation in the gener ator’ s output away fr om its dispatched load setpoint. The deviations wer e r elatively small however and did not cr oss thr esholds for ener gy dispatch non-conformance to be monitor ed” [8]. In terms of benefits of mandatory PFC, it can enable the experimentation of new market structures or changes. For example, because frequency control and related standards hav e been tightly enforced by the North American Electric Reliability Corporation (NERC), see T able I [9], the actual performance of the interconnected power systems has not been affected by e xperimentation with ne w market structures [10]. That is, the ov erall frequency performance has been relatively good because of the very stringent frequency standards. For instance, the Electric Reliability Council of T exas (ERCO T), the T exas system operator states that: “ERCO T saw big impr ovement in its primary fr equency capability following implementation of BAL-TRE-001 Re gional NERC Standard. ” [11], which required, among others, that mechanical and electronic and digital governor deadbands of all generators to be no greater than ± 36 mHz and ± 17 mHz, respectively . This is not the case, for example, in the Continental European (CE) power system where TSOs implement less stringent PFC requirements compared to those in North America. This is, in turn, one of the main reasons the quality of frequency control in the CE under normal operating conditions has been steadily degrading (last 20+ years). Figure 3 shows the ev olution of the standard de viation of the frequenc y , σ f , for CE and different North American systems. For comparison, the T exas po wer grid sho ws steady and lower σ f than CE despite being around 5 times smaller (see T able II) and with much higher IBR penetration lev els. As a matter of fact, in 2023, CE exceeded for the first time the annual target of less than 15,000 minutes outside ± 50 mHz range (15,389 minutes). 2020 2021 2022 2023 2024 Y ear 0 . 016 0 . 017 0 . 018 0 . 019 0 . 020 0 . 021 0 . 022 σ f [Hz] Eastern W estern T exas Qu´ eb ec CE Fig. 3: σ f in recent years in CE and different North American systems [12]. T ABLE I: PFC requirements for CE and different North American systems. Power System Max droop Max db Narrow db Narrow db (%) ( ± mHz) at all times? for all resources? Eastern 4–5 36 Y es Y es W estern 4–5 36 Y es Y es T exas 4–5 17–34 Y es Y es Qu ´ ebec 5 0 Y es Y es CE 12 (default 4-5) 500 No No 10 (PFC) 200 (PFC) Hence, frequency quality is expected to deteriorate if TSOs integrate more and more uncertain, variable and inertialess RES without requiring these resources and other relev ant resources such as BESS to operate at all times with narrow PFC deadband. Other rele vant measures that TSOs could consider include: • increase volumes of procured reserv es; • change frequency response settings (e.g., lower droop %). A scenario where the provision of mandatory PFC is par- ticularly critical is during sev ere system conditions such as system splits. Indeed, dealing with system splits is the main concern of lar ge interconnected power systems such as the CE rather than dealing with single contingencies (i.e., N-1). One could argue that part of the reason of the Chilean and Iberian blackouts in 2025 was the lack of mandatory frequency and v oltage support for the v ast majority of resources. In other words, despite the CE dimensioning PFC needs based on a N-2 criterion (3 GW) and not N-1 [13], this volume is proportionally shared within the CE synchronous area where the Spanish and Portuguese TSOs procure only a small share of 3 GW (e.g., around 300-400 MW). But if mandatory PFC was in place then in the system split scenario the TSOs would hav e had much more reserves to deal with the situation. For instance, following the system separation event in A US on 25/08/2018 where Queensland and South A US re- gions were separated from the remainder of the National Electricity Market (NEM) AEMO noted [14]: “This event indicates that the r esulting decr ease in primary fr equency contr ol has significantly reduced the ability of the power system to arr est the impact of non-cr edible contingency events in time to avoid the risk of cascading failur es” , and made the primary recommendation of: “incr easing the pr ovision of primary frequency contr ol fr om capable generation to arr est the decline in system r esilience to larger contingency events and maintain frequency closer to 50 Hz” . These excerpts suggest that stringent requirements for frequency control are needed to enforce “grid discipline” and, in turn, maintain good or excellent frequency performance and stability (same thing can be said for voltage control). In other words, mandating frequency control for a diverse set of resources substantially increases the number of facilities that are tightly controlling frequency which, in turn, makes the grid more resilient. Of course, the economics need to be kept in mind as strict mandatory frequency control requirements, such as those im- plemented in North America, may lead to an ov er-consumption that can result in higher costs to market participants which, in turn, can result in higher costs to consumers. For instance, generators may not be able to recover costs including wear and tear caused by continual go vernor activity due to PFC with narrow deadband. This same argument has been raised by industry in A US after the introduction of mandatory PFC in 2020. T o address such concerns from industry , the A US regulatory authority (RA) and TSO decided to implement fre- quency performance payments that include financial incentives and penalties to encourage facilities such as generators, large loads and BESS to operate their plant in a way that helps to control frequency [15]. In this context, we think that it is prudent that power system needs should come first. Then, based on those identified needs, the TSOs, along with the RAs, can focus on how to best design energy / ancillary frameworks to meet those needs from an economic perspectiv e. C. PFC fr om Larg e-Scale RES In this section, we discuss a real-world example of large- scale wind po wer plants providing PFC with ± 15 mHz dead- band. More specifically , Fig. 4 shows frequency traces from 27/01/2024, namely 6 consecutiv e hours, 3 h when the PFC deadband was set ± 200 mHz and 3 h when the PFC deadband was set ± 15 mHz. During this period, the AIPS experienced high wind generation of around 3.5 GW . 16:51:00 17:32:40 18:14:20 18:56:00 19:37:40 Time [hour:min:sec] 49 . 80 49 . 85 49 . 90 49 . 95 50 . 00 50 . 05 50 . 10 50 . 15 50 . 20 F requency [Hz] Without Wind PFC With Wind PFC Fig. 4: Frequency traces of the AIPS with & without wind PFC. Figure 4 shows that when wind generation pro vides PFC with ± 15 mHz deadband, overall frequency performance improv es. This is particularly visible at the beginning of the figure where frequency becomes less v olatile. In turn, this means that when using narrow deadbands on RES con- trol room operators spend less time issuing manual dispatch instructions (e.g., to conv entional generating units) to keep frequency within the ± 200 mHz range. Observe that the AIPS does not utilize an A GC. Also, note that if wind is not pre- curtailed it will only provide downward regulation. Of course, enabling narro w deadbands means wind is being curtailed more to provide balancing services and thus induces a cost to wind farm owners and, ultimately , to end consumers. But if this balancing service is incentiv ed TSOs could increase the flexibility of their systems and better maximize the integration of RES while achieving economic benefits and having more reserves av ailable. Howe ver , as demonstrated in [16], this type of PFC from wind introduces asymmetry in the frequency distribution. This issue is discussed in Section II-H. D. PFC fr om DER The reliable PFC provision from DER, including through the virtual power plant concept, is critical for secure operation of current and future power systems [17]. Real-world testing such as those in [18] demonstrate that roof-top photo voltaic (PV) systems are able to provide PFC services. It is important that these capabilities are enforced into national grid codes to manage relev ant scenarios such as blue-skies where, for example, most of the demand is being met by distributed roof- top PV . As a matter of fact, in Europe, new revised network codes on requirements for generators and demand connection code will require DER such as, for example, distributed PV and electric vehicles and heat pumps to pro vide mandatory OF and UF PFC services. Bidirectional PFC from DER is also enforced in A US, where the y are capable of doing so. E. PFC fr om HVDC Inter connectors Modern HVDC links have the capability to operate with nar- row deadbands and thus greatly support frequency regulation. In fact, it is shown in the literature that making HVDC ICs frequency supportiv e is also cost effecti ve [19]. Howe ver , their PFC contribution is often overlook ed or not kno wn by po wer system engineers and researchers. In this section, we provide a real-world example from T AS, where the HVDC link between T AS and A US is a major source of frequenc y regulation. It should be noted that while older HVDC links may not be suitable for continuous power changes due to wear and tear , modern HVDC ICs have this issue less and so can provide significant more frequency support. In addition, it is also worth mentioning that future grid-forming (GFM) HVDC ICs will inherently have superior frequency control capabilities. Figure 5 depicts two 1 h 2026 frequency traces of T AS from 23/02/2026 namely one where the HVDC link provides PFC and one where it does not. It is clear that when the HVDC link does not pro vide PFC, the frequency is much more volatile and spends quite some time outside the standard frequenc y range namely ± 150 mHz. Note that in both cases A GC is enabled in the system. This means that the ef fectiv eness of A GC is negligible compared to the contribution of PFC and, in this case, PFC of only one service pro vider . 00:00:00 00:13:20 00:26:40 00:40:00 00:53:20 Time [hour:min:sec] 49 . 80 49 . 85 49 . 90 49 . 95 50 . 00 50 . 05 50 . 10 50 . 15 F requency [Hz] With HVDC PFC Without HVDC PFC Fig. 5: Frequency traces for one hour in the T AS power system with (08:30 a.m to 09:30 a.m) and without (01:30 a.m to 02:30 a.m) HVDC PFC. F . Impact of PFC on F requency Recovery An important aspect of frequency control is ho w quickly it can recover frequenc y within normal operating bands such as ± 150 mHz for A US follo wing credible contingencies. W e illustrate the impact of PFC and, in particular , mandatory PFC on frequency reco very using operational data from the A US. Specifically , we select similar contingencies in 2018 (without mandatory PFC) and 2025 (with mandatory PFC) namely trip of the Loy Y ang B No. 1 generating unit from 530 MW at 15:28 on 18/01/2018 and trip of Loy Y ang B po wer station unit 2 from 579 MW at 15:41 on 12/01/2025, respecti vely . 00:00:04 00:01:24 00:02:44 00:04:04 00:05:24 00:06:44 00:08:04 00:09:24 Time [hour:min:sec] 49 . 70 49 . 75 49 . 80 49 . 85 49 . 90 49 . 95 50 . 00 50 . 05 F requency [Hz] Without Mandatory PFC With Mandatory PFC Normal Operating F requency Band Fig. 6: Frequency traces for the A US system with & without mandatory PFC. Apart from some differences in the operating conditions, Fig. 6 clearly shows that the mandatory PFC rule has con- tributed to a rapid reco very of frequency within the normal band and toward 50 Hz compared to the slow recovery in the case of without mandatory PFC. In f act, AEMO reports that: “ System fr equency is now reco vering to within the normal operating frequency band within 10 to 20 seconds for larg e cr edible contingency e vents due to abundant PFR, which is faster than A GC’ s typical contr ol cycle, meaning AGC plays only a minor r ole in these shorter frequency deviations. ” [20]. Such improvement in the dynamic performance is expected to continue if we consider the significant increase in the number of resources capable of providing fast and accurate PFC. Therefore, it is fair to say that based on real-w orld evidence having an AGC to deal with contingency ev ents for frequency recov ery purposes does not seem relev ant anymore. In fact, it has been shown in the industry that the fast response from IBRs also enables a reduction in required MW reserves [21]. G. Impact of PFC on Maximum F r equency Deviations W ith regard to maximum frequency de viations, Fig. 6 shows that for similar contingency sizes mandatory PFC in A US has led to an improv ed, in this case, frequenc y nadir . This has to be expected giv en the aggregate frequency response av ailable, in particular , from fast-acting resources such as BESS. For instance, AEMO anticipates approximately 20 GW of BESS by the early 2030s. If this is the case, it means that 20 GW of BESS with 1.7% droop (requirement) and ± 15 mHz PFC deadband applied will provide 3.176 GW of response by the time frequency reaches the normal operating frequency band threshold of 50 ± 150 mHz, as given by [20]: F req . Resp . = 100 Dro op % · ∆f 50 · BESS total = 3 . 176 GW , (1) A similar calculation shows the same BESS fleet would provide 235 MW for e very 0.01 Hz beyond their ± 15 mHz PFC deadband. T aking into account that sudden changes in the supply-demand balance in A US rarely e xceed 700-800 MW at present (i.e., represent lar gest single infeed loss), this suggests that the largest credible generation contingencies will mov e system frequency by approximately ± 30 mHz, which is slightly higher than PFC deadband. Therefore, this simple theoretical example also shows that managing frequency with PFC should be feasible in current and future con verter-based power systems. This statement is further supported by oper- ational data from the AIPS (see Fig. 7) where the maximum frequency de viations have improv ed in recent years despite the increase in IBR penetration. The main reason for this improv ement is increased PFC provision from BESS units. These real-world evidences suggest that once PFC reaches some critical mass of MW/0.1 Hz, relative to typical MW contingency sizes, SFC starts to become unnecessary as there will not be enough of a sustained frequency error for AGC to play a useful role in correcting the error . And with IBRs, especially BESS, on low frequency droop settings, this is what is expected to happen in high IBR systems. 2016 2017 2018 2019 2020 2021 2022 2023 2024 2025 Y ear 49 . 2 49 . 4 49 . 6 49 . 8 50 . 0 50 . 2 50 . 4 F requency [Hz] Nadir Zenith Fig. 7: Ev olution of maximum instantaneous frequency de viations in the AIPS. H. Impact of PFC on F requency Distrib ution Here, we discuss the impact of PFC, including mandatory PFC, on the frequency distribution and, in particular , on asymmetry of frequency distribution which is a concern for some TSOs [16]. W ith this aim, Fig. 8 shows the frequency distribution for different po wer systems namely Great Britain (GB), AIPS, A US, T AS, CE, Nordic and T exas. For GB, AIPS, A US, T AS, CE, and Nordic we use September 2025 frequency time series data with 0.1s, 1s and 4s resolutions while for ERCO T we utilize 2h data with 10s resolution from 22/01/2026 (still suf ficient to illustrate impact of PFC). 49 . 8 49 . 9 50 . 0 50 . 1 50 . 2 F requency [Hz] 0 5 10 15 20 Probability density GB AIPS AUS TAS CE Nordic (a) GB, AIPS, A US, T AS, CE, Nordic 59 . 8 59 . 9 60 . 0 60 . 1 60 . 2 F requency [Hz] 0 10 20 30 40 50 Probability density Texas (b) T exas Fig. 8: Frequency distributions for different power systems. It is interesting to see that while no power system shows exactly the same frequency distribution, 6 out of the 7 selected systems (i.e., except the Nordic) show a bi-modal distribution. A possible explanation on why the Nordic system shows a normal distribution could be related to the fact that being a hydro-dominated system it means that water column physics smear the ef fect out. It is worth mentioning that while all TSOs require mandatory PFC provision from all resources, not all of them operate all resources with narro w deadband (e.g., ± 10-15 mHz). For instance, TSOs in Europe generally do not operate RES with narro w deadbands but rather with wide ones, that is, with PFC deadband of ± 200 mHz. When frequency is outside ± 200 mHz resources contracted to provide the market service with narrow deadband can remain in the same mode of operation, but all other resources need to provide PFC using ± 200 mHz deadband (mandatory). As discussed abov e, such requirements differ from those in North America and A US where all resources, including wind, solar and BESS, are mandated to operate at all times with a narrow PFC deadband. As discussed in [16], the main source of this asymmetry is RES such as wind and solar power providing PFC with narrow deadband such as ± 10 – 17 mHz. Other rele vant sources include control limits and network losses. Note that frequency spends less time below the deadband due to the fact that most wind and solar resources are being operated at maximum output (through the maximum power point tracking controller) leading to an inability to increase output when frequency falls below the deadband. Nev ertheless, it is worth recognizing that while narrow PFC deadband on RES intro- duces asymmetry , it also allows keeping frequency within a narrow band. For instance, despite the significant asymmetry , the T exas power grid shows that frequency stays very close to 60 Hz. This is due to the fact that the “Standar d BAL-001- TRE-112 r equir es all resour ces in the T exas Inter connection to pr ovide pr oportional, non-step primary frequency r esponse with a ±17 mHz. dead-band. As a result, if any time frequency exceeds 60.017 Hz, r esources automatically curtail themselves. That has r esulted in far less operation in frequencies above the deadband since all resour ces, including wind and solar , ar e backing down” [12]. The fact that frequenc y stays around the PFC deadband means the ef fect of A GC is neglible. This statement is in agreement with rele vant literature such as [22] where it is shown that the PFC deadband width and aggreg ate system droop are the major parameters determining σ f . 49 . 84 49 . 92 50 . 00 50 . 08 50 . 16 F requency [Hz] 0 . 0 2 . 5 5 . 0 7 . 5 10 . 0 12 . 5 15 . 0 17 . 5 Probability density January 2018 AUS January 2021 AUS January 2025 AUS January 2018 T AS January 2021 T AS January 2025 T AS Fig. 9: Frequency distributions for 2018, 2021, and 2025 for A US and T AS. Mandatory PFC with narrow deadband is also the main reason why frequency is staying within a narrow band in A US and T AS as shown in Fig. 9. Ho wever , in contrast to A US, asymmetry does not seem to hav e increased in T AS despite the fact that the mandatory PFC deadband rule was introduced in 2020 in both A US and T AS [23]. This could be explained by the excellent and, apparently , symmetric frequency response provided by the HVDC link in the T AS system as seen in Fig. 5. Note that both T AS and A US utilize an A GC. This means that the A GC ef fectiv eness when it comes to reducing asymmetry of frequency distrib ution is negligible compared to, for example, PFC from HVDC. Therefore, a solution to asymmetry could be, where possible, operating HVDC links with narrow deadbands. GFM BESS might also be a good candidate to reduce the asymmetry as sho wn in [24]. I. F r equency Control P erformance T o illustrate the importance of operating with narrow PFC deadbands we compare the frequency control performance of a small island system such as T AS, with a large one such as mainland A US. With this aim, we select 1 h from the same day namely 17 May from 17:00–18:00 in 2018 and 2024 in T AS where it was operating with narrow PFC deadbands and in 2018 and 2024 in A US where it was operating with wide (i.e., ± 150 mHz) and narrow (i.e., ± 15 mHz) PFC deadbands, respectiv ely . Figure 10 shows the relev ant frequency traces. The comparison suggests that size of power systems alone may not be an important factor but rather width of the 17:00:04 17:13:24 17:26:44 17:40:04 17:53:24 Time [hour:min:sec] 49 . 80 49 . 85 49 . 90 49 . 95 50 . 00 50 . 05 50 . 10 50 . 15 F requency [Hz] 2018 T AS with Narrow PFC Deadbands 2024 T AS with Narrow PFC Deadbands 2018 AUS with Wide PFC Deadbands 2024 AUS with Narrow PFC Deadbands Fig. 10: Frequency traces for T AS and A US in 2018 and 2024. T ABLE II: Relev ant characteristics of different selected power systems. Item GB AIPS A US T AS CE Nordic Te xas Peak demand [GW] 44 7.5 34 2 > 400 60 85 PFC provision Market/Mandatory Market/Mandatory Mandatory Mandatory Market/Mandatory Market/Mandatory Market/Mandatory deadband [mHz] ≤ ± 15 ≤ ± 15 ≤ ± 15 ≤ ± 15 ≤ ± 10 ≤ ± 10 ≤ ± 17 Droop [%] 3-5 3-5 ≤ 5 ≤ 5 ≤ 5 ≤ 5 ≤ 5 FFR Y es (FA T = 1 s) Y es (FA T = 0.15-2 s) Y es (FA T = 0.5-1 s) Y es (FA T = 0.5-1 s) Limited Y es (F A T = 0.7-1.3 s) Y es (F A T ≈ 0.25 s) AGC No No Y es (FA T = 5 mins) Y es (F A T = 5 mins) Y es (FA T = 2-15 mins) Y es (F A T = 5 mins) Y es (F A T = 5 mins) Dispatch model Self Central Central Central Mainly self Self Central frequency deadbands, the response capabilities of the genera- tion/demand resources as well as the level of MW noise/sizzle the system experiences relative to its size are equally important as well. For instance, T AS generally shows similar or better frequency performance than mainland A US when the latter was applying wide PFC deadbands in 2018 despite being more than 15 times smaller than A US. The figure also shows that when A US w as operating with narro w deadbands in 2024 following the mandatory PFC rule in 2020 then, as e xpected, frequency v ariations are smaller in bigger systems (2024 A US) than small systems (2024 T AS). Note that in all cases A GC was enabled. These real-world observations challenge the gen- eral understanding that small island po wer systems f ace greater frequency control challenges than large systems (i.e., due to lower inertia) and instead place the importance onto how actually TSOs and the respecti ve RAs design and implement frequency control arrangements, including mandatory ones. J. Need for P erfect T racking F r equency Controller An obvious question for systems operating without a perfect tracking integral controller (i.e., A GC) is whether they can be operated securely or ho w can frequenc y be managed without such a controller . Real-world data presented in this paper show that it is possible to operate po wer systems securely , including low-inertia ones, without a perfect tracking controller from a frequency perspectiv e. Note that AGC may be used for other purposes such as, for example, for market dispatch purposes where 5-minute dispatch results are ramped into the A GC to pre vent any large step change in MW output (i.e., A US). Howe ver , this aspect is not strictly related to frequency control and, thus, is outside the scope of the paper . Moreover , one may argue that even today A GC is not really doing perfect tracking of system frequency deviations as system is nev er in steady state due to continuous load and generation fluctuations and slow A GC timescales (e.g., 5 minutes F A T). K. Remarks on TEC, TCR and T ie-Line Contr ol TEC, including automatic TEC through A GC, is still widely performed by TSOs worldwide. Ho wev er , in recent years some jurisdictions such as A US ha ve removed the re gulatory obligation to correct time error to within certain bands. NERC has follo wed a similar path with the retirement of NERC Standard B AL004-0 meaning that “TEC is no longer initiated when the time err or cr osses pr edefined thr esholds. However , TEC may still be initiated if needed for reliability concerns or other unfor eseen reasons” [25]. Therefore, it is fair to say that TEC is becoming less and less relev ant for time k eeping and in the future it may be completely remov ed as there are fewer devices relying on it. But ev en if it will be required (e.g., as a useful diagnostic for MW balance), its long timescales, that is, hours to days, means that it will be a relati vely easy task for TSOs (e.g., intentionally dispatching more or less generation). Regarding TCR, A US hav e run a 5-minute MW dispatch cycle since 1998, which serves the role of TCR. This has allowed A US to av oid doing MW tie-line control between areas in the A US grid, as 5 minutes was considered short enough that tie-line MW errors could be corrected via re- dispatch at the next run. This has, in turn, allo wed A US to run the system as a single flat frequency control area under normal conditions, which greatly simplifies ancillary services market operation. W ith re gard to tie-line control, while it is embedded into a frequency control process namely AGC, strictly speaking, it is a problem of load control rather than frequency control. This was stated by researches since its beginning around a century ago: “Re gulation of tie lines inter connecting two electric power systems is a pr oblem of load contr ol rather than one in volving principally system frequency; for best r esults, the contr ol equipment must be automatic. ” [26]. Being a load control problem, it means it could be managed through real- time security-constrained economic dispatch markets. Excel- lent frequency control w ould help tie-line control as well. I I I . P RO P O S E D F R E Q U E N C Y C O N T R O L S T RU C T U R E Figures 11 and 12 illustrate the en visioned frequency control timescales and management in power systems. W e can no w see that, as opposed to Fig. 1, where frequenc y reco vers to nominal within 10 minutes, it does so no w within 30 s follo wing the contingency due to f ast and abundant PFC. The latter is also the reason why frequency nadir has improv ed. Additionally , it displays a tighter regulation around the nominal during frequency post recov ery period and in steady-state due to fast and abundant PFC and, to a lesser extent, due to efficient real- time energy markets able to keep good power balance close to physical delivery . [Hz] 5 9 . 9 8 5 9 . 9 6 0 . 0 0 0 20 40 60 S y s t e m F r e q u e n c y 5 S e c o n d s M i n u t e s 10 20 0 20 40 60 5 S e c o n d s M i n u t e s 10 20 A r r e s t i n g P e r i o d R e c o v e r y P e r i o d P o s t R e c o v e r y P e r i o d P o w e r [MW] H o u r s 10 1 H o u r s 10 1 E l e c t r o m a g n e t i c E n e r g y I n e r t i a l R e s p o n s e P r i m a r y F r e q u e n c y C o n t r o l Real-Time/Con tin uous Energy Mark et Automatic mark et dispatc h instructions T i m e E r r o r C o n t r o l Mark et dispatc h o r man ual frequency o ff set F F R (w i nd t urbi ne s w / o he a droom ) FFR and g o v e rnor re s p on s e F F R (O t he r form s ) Fig. 11: Illustration of new timescales of frequency control. In contrast to Fig. 2 that includes PFC, SFC and TCR, Fig. 12 shows that po wer systems could be operated securely by relying on strict mandatory PFC requirements similar to those in A US and North America, ancillary services markets that properly address any gap between mandatory PFC and acceptable frequenc y quality levels and, last but not least, efficient real-time energy markets. Note that depending on the resource mix and market structures TSOs may implement different PFC reserv e dimensioning approaches (e.g., co ver - ing largest single infeed/outfeed losses plus additional PFC reserves to tackle imbalances resulting from forecast errors). Moreov er , it is worth mentioning that the PFC and market timescales are for illustrati ve purposes and are not exact as they may not work for all po wer systems. This is the case ev en today for existing standard reserv e products in Fig. 2 where, for example, a PFC with 30 s F A T is (still) working for CE but would be too slow for secure operation of small island systems like the AIPS. Here, it is relev ant to note that the procurement of PFC services such as, for e xample, those procured by the GB TSO (see Fig. 13) have become cost- effecti ve with relati vely low prices (e.g., 1-5 £/MW/h). 10 m i n 1 0 s T i m e 5 m i n 15 m i n Real-Time/ Con tin uous Energy Mark et P r i m a r y Reserv e Do wn w ard [MW] Up w ard [MW] F ast PF C Slo w PF C 1 s (Mark et/Mandatory) Fig. 12: Illustration of proposed new frequency control management concept. It is also worth observing that the frequency control, as well as the voltage control, remains intrinsically hierarchical but timescales are shifted of tw o orders of magnitude and ‘compressed’ inside the con verters. These, in fact, include an inner control, an outer control and the actual frequency/v oltage control, each of which is separated by an order of magnitude in the frequency domain to prev ent undesirable couplings. The need for such a hierarchy is for stability concerns. Howe ver , the reason why con ventional frequency control is assigned a specific set of timescales is strictly dependent on the dynamics of synchronous machines and their turbine governors. W ith power electronic con verters, the control, while remaining hierarchical, can be made faster . A. Differ ent and Adaptive PFC Services As discussed abov e, the proposed concept relies on strict mandatory PFC requirements and well-defined PFC ancillary services. But in contrast to mandatory PFC that provides a defined response for both normal and abnormal conditions in terms of fixed parameters (e.g., deadband of ± 15 mHz, droop ≤ 5% and response time ≤ 10s as is the case in A US), TSOs may want, depending on system needs, to separate the tasks of dealing with normal and abnormal operating conditions and define/procure different PFC ancillary services. This is the case, for example, in GB where the TSO has defined three distinct PFC products namely dynamic containment (DC), dynamic moderation (DM) and dynamic regulation (DR) to deal with abnormal (DC) and normal (DR and DM) conditions, respectiv ely . These products are depicted in Fig. 13. Note that similar to the AIPS GB does not implement an A GC. 1 0 0 % 4 9 . 8 5 0 . 2 Hz 4 9 . 5 D e a d b a n d + 1 5 m H z Hz 1 0 0 % 5 % 5 0 . 5 5 % 5 0 . 1 5 0 . 0 4 9 . 9 D y n a m i c R e g u l a t i o n ( D R ) D y n a m i c C o n t a i n m e n t ( D C ) D y n a m i c M o d e r a t i o n ( D M ) _ Fig. 13: New PFC reserve products introduced in GB (adapted from [27]). As can be seen, DC with a response time of 1s is aimed at tackling post-fault operating conditions whereas DM (response time of 1s) and DR (response time of 10s) address pre-fault operating conditions in terms of keeping frequency within operational limits namely ± 200 mHz range. In particular , observe that DM and DC apply adaptiv e droop/trajectories, that is, relati vely little MW provision when frequenc y is within ± 100 mHz range and ± 200 mHz range, respectiv ely . The Irish TSOs also apply adaptive PFC. For instance, they can change the BESS PFC deadbands and droops/trajectories based on system conditions. Similarly , the Irish TSOs also hav e the ability to change in real-time the deadbands of wind and solar plants, that is, ± 15 mHz or ± 200 mHz if frequency regulation and stability is challenging or not challenging, respectiv ely . As a matter of fact, the Irish TSOs hav e recently changed the PFC deadbands of wind and solar units to ± 15 mHz to address potential OF issues driven by lack of f ault ride-through from demand facilities. Therefore, in practice, narrow PFC deadbands are also used to deal with contingency conditions and not just to regulate the frequency under normal operating conditions. In particular, ha ving narrow deadbands on fast-acting resources such as BESS could significantly address frequency nadir/zenith issues as shown in [24]. It can be concluded that a key advantage of today’ s and future power systems is the ability to implement (if required) adaptiv e PFC. This was not possible in conv entional po wer systems where it was hard, if not impossible, to change, for example, the droops or deadbands of synchronous generators in real-time. I V . E C O N O M I C C O N S I D E R AT I O N S The proposed concept assumes the existence of a real-time energy market that co-optimizes the procurement of energy and PFC reserves (see Fig. 12). It is also prudent that such mar - kets integrate balancing and congestion/stability management (i.e., network and stability constraints are e xplicitly modeled in the optimization process) to ensure overall system efficienc y . These mark ets reduce the gap between mark et outcomes and physical conditions or constraints of the po wer system. F or example, if the output of such markets reduce o verall po wer imbalance, less frequency control will be needed and the less TSOs will need to intervene or correct operational issues. The closest real-world energy markets that reflect such char- acteristics are most of the North American real-time markets and that in A US. In particular , A US uses a self-commitment central real-time dispatch market (no day-ahead market) that runs ev ery 5 minutes and produces dispatch instructions for scheduled units. Because of the short timescales these markets also help deal with contingencies, in particular , non-credible contingencies that push frequency outside defined operational limits. F or e xample, due to significant cascading e vents in A US on 13/02/2024 at 13:08, AEMO lost approximately 2.7 GW of generation and 1 GW of load was shaken off in V ictoria following the disturbance. Redispatch of the real-time energy market occurred at 13:10 for the 13:15 trading interval and, thus, acted to successfully replace lost generation commencing within 5 minutes [20]. Due to similar timescales, the dynamics of such markets overlap with the dynamics of A GC (see T able II). For this reason, one may ar gue that similar short c ycle markets will effecti vely replace most, if not all, of the A GC objectiv es as they can be considered as some sort of market- based A GC or non-perfect-tracking A GC [28]. But observe that in contrast to A GC, real-time ener gy markets have an important adv antage because only some resources participate under A GC while in general all resources above a certain MW size (e.g., ≥ 10 MW) must participate in energy markets. Moreov er , from a frequency control perspective we are of the view that market arrangements such as those in CE that strongly rely on unconstrained wholesale ener gy markets and market participants or balancing responsible parties (BRPs) for maintaining the balance between generation and demand (self- dispatch models) are not efficient. For instance, despite BRPs being responsible financially for any imbalances they cause in the system, they are more focused on economic aspects rather than helping to keep the overall po wer balance which is the task of TSOs. These market arrangements are also known to lead to significant deterministic frequency deviations [29]. Finally , another critical aspect of efficient and proper func- tioning ener gy markets are accurate demand and generation forecasts. As a matter of fact, market participants and TSOs are heavily inv esting in advanced and reliable forecasting. Therefore, it could be expected that in the future demand and generation forecasts, in particular short-term ones from a frequency perspectiv e, will improv e. But of course there could be instances where forecasts will be wrong for dif ferent rea- sons. It is important that TSOs ha ve the necessary mitigation measures in place to deal with such situations. For instance, during the third quarter of 2025 A US had one ev ent where frequency was outside the normal band ( ± 150 mHz) for more than five minutes without an identified contingency ev ent [30]. This ev ent happened due to a significant self-forecasting error of around 1.8 GW of RES with a single forecasting provider that affected se veral generators leading to frequency exceeding the 50.15 Hz operational limit. Once the issue was detected by the provider , the self-forecasts for all relev ant generators were suppressed resulting in the dispatch forecasts being sourced from AEMO’ s internal wind and solar forecasting systems, mitigating the issue. Therefore, such rare ev ents should be able to be primarily dealt with by market mechanisms, rele vant TSO operational policies and then by abundant PFC a vailable from both ancillary markets and mandatory requirements. V . C A S E S T U DY T o complement the analysis under conditions not directly comparable in real cases, we perform simulations using Dome [31] on a detailed dynamic model of the AIPS. This model, dev eloped from publicly available data pro vided by the Irish TSOs, represents a realistic lar ge-scale network comprising 1,479 buses, 1,851 transmission lines, 20 con ventional syn- chronous generators, and 302 wind po wer plants. Four op- erating scenarios are considered to ev aluate the impact of controllers operating at dif ferent timescales: • Scenario 1: Con ventional operation with AGC [28], with gain set to k 0 = 10 . A GC setpoints are issued every 2 s. • Scenario 2: Same as Scenario 1, plus PFC-enabled wind generators using a deadband of ± 15 mHz. • Scenario 3: Same as Scenario 2 b ut without A GC. • Scenario 4: Synchronous machines are replaced by GFM. 100% IBR-based resources (GFM+Grid-follo wing), with- out A GC. T o excite the system dynamics, a continuous acti ve and reactiv e po wer perturbation is applied to the network loads. This disturbance follo ws an Ornstein–Uhlenbeck stochastic process and has a total magnitude equi valent to 10% of the system demand, distributed across the load b uses. On top of the continuous disturbances, complementary perturbations are included to capture different operativ e conditions of the system. These are implemented as load ramps and stochastic jumps. Ramps are modeled as 5% v ariations of the load, last- ing 5 minutes each, as follows: (i) positiv e ramps around 7:00 am to model morning load pickup; (ii) negati ve ramps around 12:00 pm to represent PV injection; and (iii) positiv e ramps around 6:00 pm to represent the e vening peak. Stochastic jumps are modeled as discussed in [32] and emulate short-term intermittency of RES as sudden load v ariations of 2 . 5% . The primary v ariables of interest are the deviation of the system center-of-inertia frequency , ∆ ω CoI , and the percentage of time during which the frequency exceeds a giv en threshold of ± 200 mHz, over a total time of simulation of 24 h. T ABLE III: Frequency statistics of the AIPS under stochastic perturbations. Scenario σ CoI [mHz] % Time Out of Range Con v + A GC 177 12.25 Con v + A GC + PFC 116 8.64 Con v + PFC 118 9.12 100% IBR 86 3.82 The results of T able III rev eal a progressive tightening of the frequency distribution as faster control mechanisms are introduced. Scenarios 1 and 4 represent the extreme cases, exhibiting the widest and narro west frequency distributions, respectiv ely . Most notably , Scenarios 2 and 3 e xhibit nearly identical statistical performance, despite the absence of A GC in Scenario 3. This observation highlights the ke y physical insight that PFC provided by in verter -based wind generators efficiently operates on shorter timescales than the SFC. As a result, PFC directly suppresses frequency excursions at their origin, significantly reducing the magnitude and persistence of deviations before slo wer secondary controllers become acti ve. Consequently , the contribution of A GC becomes marginal when effecti ve PFC is present, as the primary disturbance is already mitigated by fast electromagnetic and con verter- driv en control actions. These findings confirm that PFC from IBRs fundamentally reshapes the hierarchy of frequency con- trol, shifting the dominant stabilization mechanism from slow centralized regulation toward fast, decentralized IBRs. V I . C O N C L U D I N G R E M A R K S This paper proposes to ‘re-engineer’ the frequenc y control of current and future con verter -dominated power grids. That is, this position paper rethinks the ‘old’ hierarchal structure of frequency control that is based PFC, SFC, TCR and TEC and proposes a ne w one that is based on PFC and real-time (e.g., 5- minute) energy markets. The main findings and contributions of the paper are summarized below . • While the existing frequency control structure has some pros such as being based on many years of operational experience it also shows several important drawbacks. In particular , it is slow; dif ficult to adapt to new technolo- gies; and does not recognize developments in markets. • Mandatory stringent PFC requirements (e.g., with ± 15 mHz deadband), are critical in addressing several aspects of frequency such as improved frequency stability , recov- ery and long-term frequency quality . • IBR-based resources such as BESS, HVDC units and RES are shown to provide excellent PFC. In particular, despite PFC from RES introducing asymmetry it allows keeping frequency within a tight range. • If PFC reaches some critical mass of MW/0.1 Hz, rel- ativ e to typical MW contingency sizes, A GC becomes unnecessary . • TEC, TCR and tie-line control are less and less rele vant to frequency control. • Size of power systems alone is not an important factor but rather width of the frequency deadbands, the response capabilities of the generation/demand resources as well as the lev el of MW noise/sizzle the system experiences relativ e to its size are equally important as well. • Based on the above measurement-based findings, it pro- poses a new frequency control management approach that relies on PFC and a real-time ener gy market. • The viability of the proposed concept is supported by dynamic simulations on a realistic model of the AIPS. It presents opportunities for reduced ancillary services costs and power system complexity . • The proposed concept appears compatible with real-time electricity markets. Future work will focus on further assessments of the proposed concept including detailed dynamic simulations for 100% IBR-based power systems, and real-world trials to gain confidence with stak eholders, in particular , TSOs and RAs. R E F E R E N C E S [1] N. Hatziargyriou et al. , “Definition and classification of power system stability – revisited & extended, ” IEEE Tr ansactions on P ower Systems , vol. 36, no. 4, pp. 3271–3281, 2021. [2] F . Milano et al. , “Foundations and challenges of low-inertia systems (in vited paper), ” in P ow . Syst. Comput. Conf. (PSCC) , 2018, pp. 1–25. [3] “IEEE standard for interconnection and interoperability of in verter-based resources (IBRs) interconnecting with associated transmission electric power systems, ” IEEE, pp. 1–180, 2022. [4] T . K ¨ erc ¸ i and F . Milano, Fr equency Quality in P ower Systems: Definition, Metrics, Control and Operation . Springer Nature, 2026. [5] N. Kraftwerke, “What is frequency containment reserve (FCR)?” 2025. [Online]. A vailable: www .next- kraftwerke.com/ [6] AEMO, “Market ancillary service specification, ” 2024. [Online]. A vailable: https://www .aemo.com.au/ [7] R. King et al. , “Interconnected system frequency response, ” in Pr oceed- ings of 28th Southeastern Symp. on System Theory , 1996, pp. 306–310. [8] AEMO, “T asmanian frequency control tests, ” AEMO, T ech. Rep., 2018. [9] NERC, “Reliability guideline. primary frequency control, ” NERC, T ech. Rep., 2023. [10] I. Arnott et al. , “Frequency control practices in market environments, ” in CIGRE/IEEE PES Int. Symposium Quality and Security of Electric P ower Delivery Systems, 2003. , 2003, pp. 143–148. [11] ERCO T, “Frequency control and grid resiliency , ” 2018. [Online]. A vailable: https://www .energy .gov/ [12] NERC, “2025 frequency response annual analysis, ” NERC, T ech. Rep., 2025. [13] ENTSO-E, “Operational reserve ad hoc team report final version, ” ENTSO-E, T ech. Rep., 2012. [14] AEMO, “Final report – Queensland and South Australia system separa- tion on 25 August 2018, ” AEMO, T ech. Rep., 2019. [15] AEMC, “National electricity amendment (primary frequency response incentiv e arrangements) rule 2022, ” AEMC, T ech. Rep., 2022. [16] T . K ¨ erc ¸ i et al. , “ Asymmetry of frequency distribution in po wer systems: Sources, estimation, impact and control, ” IEEE Open Access Journal of P ower and Energy , vol. 12, pp. 135–145, 2025. [17] W . Zhong et al. , “Impact of virtual po wer plants on power system short- term transient response, ” Elect. P ow . Sys. Res. , v ol. 189, p. 106609, 2020. [18] IEA, “Provision of frequency related services from PV systems, ” IEA, T ech. Rep., 2024. [19] A. T osatto et al. , “Sharing reserves through HVDC: Potential cost savings in the Nordic countries, ” IET Generation, Tr ansmission & Distribution , vol. 15, no. 3, pp. 480–494, 2021. [20] AEMO, “T echnical revie w of the NEM frequency control landscape, ” Australian Energy Market Operator, T ech. Rep., 2025. [21] ERCO T , “Inertia: Basic concepts and impacts on the ERCOT grid, ” ERCO T , T ech. Rep., 2018. [22] P . V orobe v et al. , “Deadbands, droop, and inertia impact on power system frequency distribution, ” IEEE T ransactions on P ower Systems , vol. 34, no. 4, pp. 3098–3108, 2019. [23] T . K ¨ erc ¸ i et al. , “ A comprehensive approach to ev aluate frequency control strength of power systems, ” IEEE Open Access Journal of P ower and Ener gy , vol. 13, pp. 39–50, 2026. [24] ——, “Frequency quality assessment of GFM and GFL con verters and synchronous condensers, ” in IEEE PES General Meeting , 2026, pp. 1–5. [25] California ISO, “Time error correction, ” CAISO, T ech. Rep., 2025. [26] T . E. Purcell et al. , “Tie line load control, ” Electrical Engineering , vol. 51, no. 4, pp. 256–260, 1932. [27] NESO, “W ebinar: Pre-fault frequency control modelling, ” 2025. [Online]. A vailable: www .neso.energy/document/356951/download [28] T . K ¨ erc ¸ i et al. , “On the impact of discrete secondary controllers on power system dynamics, ” IEEE T rans. on P ow . Sys. , vol. 36, no. 5, pp. 4400–4409, 2021. [29] M. Celi Cort ´ es et al. , “Deterministic grid frequency deviations and the provision of frequency containment reserve with battery storage systems, ” Energy Reports , vol. 13, pp. 1029–1040, 2025. [30] AEMO, “Frequency monitoring – Quarter 3 2025, ” AEMO, T ech. Rep., November 2025. [31] F . Milano, “ A Python-based software tool for power system analysis, ” in IEEE PES General Meeting , V ancouver , BC, 2013, pp. 1–5. [32] F . Mele et al. , “Modeling load stochastic jumps for power systems dynamic analysis, ” IEEE T ransactions on P ower Systems , 09 2019.
Original Paper
Loading high-quality paper...
Comments & Academic Discussion
Loading comments...
Leave a Comment