Multi-Year Spectral Structure of 6G Candidate Bands at 2.7 GHz and 4.4 GHz
Mid-band spectrum between 2 and 8 GHz is a critical resource for sixth-generation (6G) systems as it uniquely balances favorable propagation characteristics with scalable bandwidth. Recent U.S. policy highlights candidate bands near 2.7, 4.4, and 7.1…
Authors: Amir Hossein Fahim Raouf, Ismail Guvenc
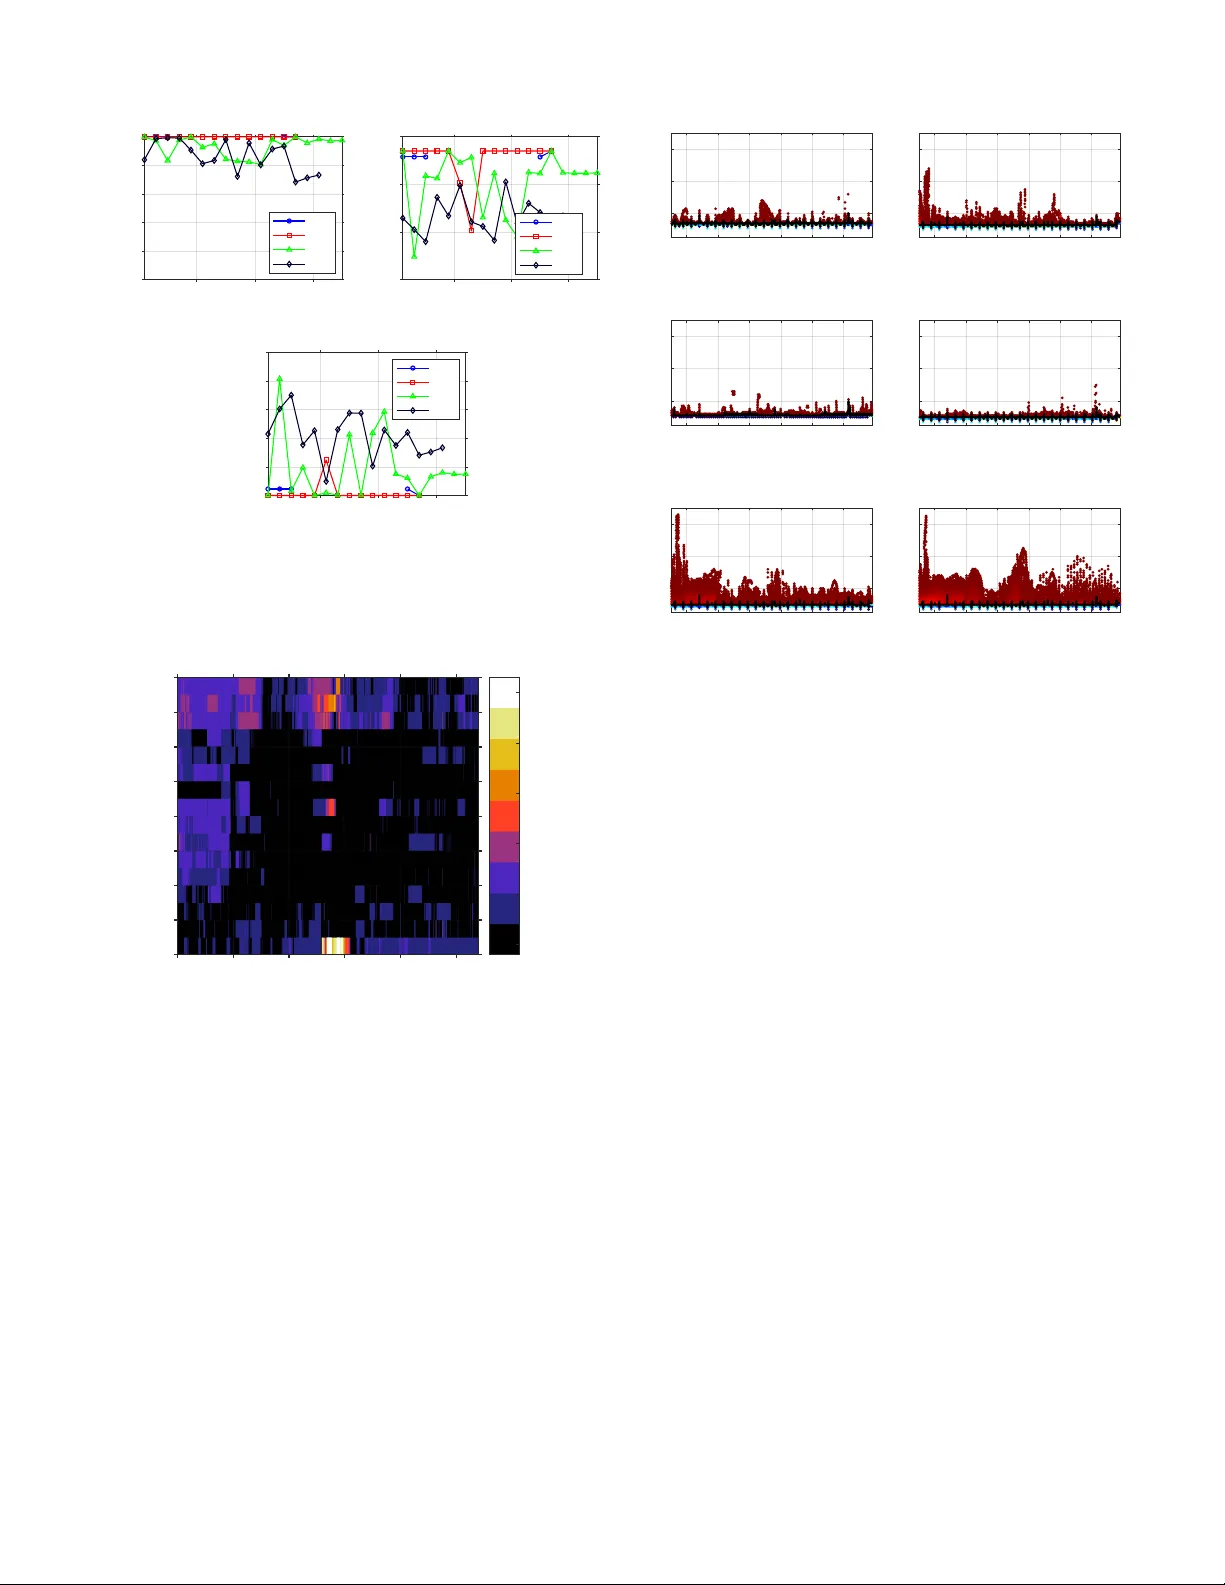
Multi-Y ear Spectral Structure of 6G Candidate Bands at 2.7 GHz and 4.4 GHz Amir Hossein Fahim Raouf Department of Electrical and Computer Engineering North Car olina State University Raleigh, NC, USA amirh.fraouf@ieee.org ˙ Ismail G ¨ uvenc ¸ Department of Electrical and Computer Engineering North Car olina State University Raleigh, NC, USA iguvenc@ncsu.edu Abstract —Mid-band spectrum between 2 and 8 GHz is a critical resour ce for sixth-generation (6G) systems as it uniquely balances fav orable propagation characteristics with scalable bandwidth. Recent U .S. policy highlights candidate bands near 2.7, 4.4, and 7.1 GHz, all of which host substantial federal and non-federal incumbency , including high-power radiolocation and aeronautical telemetry systems. Although these segments are being considered for potential relocation of federal in- cumbents to enable commercial use, their long-term viability depends on the structural integrity of the spectrum. In such en vironments, the practical value of spectrum depends on the reliability and contiguity of av ailable spectrum opportunities. This paper presents a measurement-driven feasibility analysis of two repr esentative segments, 2.69–2.9 GHz and 4.4–4.94 GHz, using Softwar e-Defined Radio (SDR) measurements collected during P ackapalooza campaigns fr om 2022 to 2025. Deployment- oriented metrics are introduced to quantify scan-window reli- ability (SWR), altitude-dependent usable spectrum availability ratio (USAR), largest contiguous clean bandwidth (LCCB), spectral fragmentation, and extreme interference excursions. The results re veal significant year-to-y ear structural variability . In the 2.69–2.9 GHz band, USAR remains near unity in 2022 and 2023, but drops to approximately 0.65 in 2024 and 0.8 in 2025, accompanied by fragmentation and limited contiguous bandwidth across altitudes. The 4.4–4.94 GHz band exhibits a similar temporal pattern, but with smaller reliability degradation and larger contiguous support, often exceeding several hundred megahertz ev en during incumbent-dominant periods. The r esults highlight that wideband feasibility in these candidate bands depends strongly on spectral contiguity and structural stability rather than nominal bandwidth alone. Index T erms —5G, 6G, AERP A W , Radar , software-defined radio, spectrum monitoring. I . I N T RO D U C T I O N Mid-band spectrum between 2 GHz and 8 GHz plays a central role in the e volution of sixth-generation (6G) wireless systems. Compared with millimeter-wa ve allocations, these frequencies provide a fav orable compromise among cover - age, penetration, and scalable channel bandwidth, enabling wideband air interfaces while maintaining practical link bud- gets [1]. International harmonization efforts in the upper 6 GHz range target contiguous allocations of se veral hundred This work was supported in part by the National Science Foundation under Grants CNS-2332835 and CNS-2450593. megahertz to support high-throughput carrier configurations and flexible numerologies [2]. In the United States, howev er , several candidate mid-band segments under consideration for future commercial use are heavily occupied by federal and non-federal incumbents, in- cluding 2.69–2.9 GHz, 4.4–4.94 GHz, and portions of 7.125– 7.4 GHz [3]. These bands host radiolocation systems, aero- nautical telemetry , fixed microw ave links, and satellite ser- vices operating with substantial transmit power and structured emission patterns. T able I summarizes the principal incumbent services and their typical interference characteristics. In such incumbent-dense en vironments, nominal bandwidth alone does not determine operational deployability [8], [9]. W e define operational deployability as the ability of a band to sustain reliable, contiguous wideband operation at the relev ant reconfiguration time scale under incumbent coexistence con- straints. In practice, deployability depends on three interrelated structural properties: 1) scan-windo w reliability (SWR) at the operational time scale, 2) spectral contiguity suf ficient for wideband carrier formation, and 3) bounded extreme interfer - ence excursions that do not exceed radio frequency (RF) front- end dynamic-range limits. T ogether , these properties determine whether a nominally wide allocation can support stable, high- throughput operation in shared-spectrum conditions. Existing spectrum characterization approaches are often insufficient for this purpose. Measurement campaigns fre- quently report av erage occupancy or duty-cycle statistics [10]. While v aluable for re gulatory planning, such metrics do not rev eal whether usable spectrum forms sufficiently contiguous blocks, persists over decision intervals relev ant to coordination mechanisms, or remains rob ust to rare but sev ere interference peaks. Short-horizon analyses based on real-world mid-band measurements sho w that channel av ailability v aries across minute-scale time horizons and that a verage occupanc y metrics do not adequately capture the structural behavior relev ant to dynamic spectrum access [11]. Furthermore, high-power inter- ference e vents directly affect User Equipment (UE) blocking and adjacent-channel selectivity [12]. As a result, extreme interference le vels become practical recei ver design constraints rather than merely statistical outliers. These observations motiv ate a deployment-oriented struc- T ABLE I: Primary U.S. Incumbent Services and Characteristics in Candidate 6G Mid-Band Segments [3], [4]. Band Segment Primary Federal Services Current Non-Federal Status T ypical Interference Characteristics 2.69–2.9 GHz Radiolocation (ASR-9/11, NEXRAD), Aeronautical/Maritime radionavigation [4], [5] Radio Astronomy (2.69–2.7 GHz), Secondary Experimental [5] High-power pulsed radar emissions, rotating beams, localized high-peak excursions, sensitiv e passive receiv ers in adjacent 2.69 GHz 4.4–4.94 GHz Aeronautical Mobile T elemetry (AMT), T actical Military systems [4], [6] 4.94–4.99 GHz National Band Manager framework (Public Safety), International 5G/6G candidate [7] Frequency-selecti ve occupancy , high-EIRP airborne emitters (AMT), geometry-dependent coupling, altitude-sensitiv e interference profiles 7.125–8.4 GHz Federal Fixed Service, Fixed-Satellite (uplink), Space Research, EESS [4], [5] 7.125–7.4 GHz prioritized for commercial reallocation, overlap with unlicensed U-NII-5/8 [3] Narrowband point-to-point links, high-gain satellite uplinks, aggregate interference from densified terrestrial 6G and unlicensed deployments tural ev aluation framework for incumbent-hea vy mid-band spectrum. This paper contributes a measurement-based methodology that quantifies scan-window reliability , largest contiguous clean bandwidth, spectral fragmentation, and e x- treme interference excursions using multi-year Software- Defined Radio (SDR) measurements collected during four annual urban campaigns. By linking spectrum identification with practical wideband carrier formation under coexistence constraints, the proposed framework provides an empirical ev- idence for assessing the feasibility of dynamic 6G deployment in incumbent-dense en vironments. It is important to note that the incumbent landscape in these bands is subject to ongoing policy revie w and potential reallocation. Federal systems may be relocated, reconfigured, or transitioned over time. The analysis in this paper therefore ev aluates structural deployability under the presently observed interference environment, without presuming permanent incumbency . I I . R E L A T E D W O R K The strate gic importance of mid-band spectrum for future International Mobile T elecommunications (IMT) systems is articulated in multiple 6G vision and framework documents, including ITU IMT -2030 and 3GPP study items on 6G sce- narios and requirements [1], [13], [14]. These documents emphasize the need for wide, contiguous allocations capa- ble of supporting scalable numerologies and high-throughput air interfaces. In particular , harmonization initiativ es in the upper 6 GHz range target channel bandwidths on the order of several hundred megahertz to enable wideband carrier configurations and simplified RF design [2]. Howe ver , such discussions primarily address spectrum identification and high- lev el performance objectives, with limited empirical analysis of deployability under incumbent coexistence. Dynamic spectrum access in incumbent-heavy bands has been studied extensi vely , most prominently in the 3.5 GHz Citizens Broadband Radio Service (CBRS) framework [15]. Related radar–communications coexistence research has de- veloped protection criteria, exclusion zones, interference mod- eling approaches, and coordination mechanisms [16]. While these works provide important regulatory and architectural foundations, they focus largely on coexistence enforcement and protection requirements rather than on whether suf ficiently large and structurally stable wideband opportunities emerge within the shared spectrum. Measurement-driv en spectrum characterization has further examined utilization across time and geography [10]. Such campaigns typically report average occupancy , duty cycle, or power statistics. Although valuable for regulatory planning, these metrics do not fully capture structural properties that de- termine wideband feasibility . Specifically , av erage utilization does not indicate whether usable frequencies form contiguous blocks, whether av ailability persists over operational decision intervals, or whether rare high-power excursions impose front- end blocking or dynamic-range constraints. W ideband 6G air interfaces require coherence across frequency and stability ov er time, not merely low mean occupancy . More recent 6G discussions highlight artificial intelli- gence (AI)-nati ve spectrum management, adapti ve sharing, and fine-grained coordination in heterogeneous environments [13], [14]. In such settings, structural characteristics including con- tiguity , fragmentation, and temporal reliability become central performance determinants, as they directly constrain achiev- able bandwidth, aggre gation strategies, and scheduling fle xibil- ity . The present work addresses this gap by integrating multi- year measurement data with deployment-oriented structural metrics, thereby providing an empirical frame work that links spectrum identification with the practical formation of wide- band carriers under contiguity , reliability , and RF blocking constraints in incumbent-dense mid-band en vironments. I I I . S T RU C T U R A L C H A R AC T E R I Z ATI O N M E T R I C S This section defines the measurement-driv en metrics used to ev aluate the operational deployability of 6G systems un- der incumbent coexistence. Rather than relying on aggregate utilization statistics, these metrics quantify sustained usability , spectral contiguity , and interference morphology as observed in multi-year measurement data. These dimensions map di- rectly to 6G performance requirements across three primary technical domains: • Service A vailability: The reliability and temporal per- sistence of spectrum opportunities at operational scales determine the feasibility of sustained wideband links. • Peak and User -Experienced Data Rates: The av ailabil- ity of contiguous usable bandwidth imposes fundamental bounds on achie vable throughput and the practical con- figuration of wideband wa veforms. • RF Design and Energy Efficiency: High-power inter - ference excursions constrain receiv er headroom, thereby impacting RF front-end design margins and ov erall sys- tem energy ef ficiency [1], [13]. Mapping these high-lev el 6G performance objecti ves to concrete, actionable metrics requires a high-fidelity charac- terization of the spectral environment across multiple spatial and temporal dimensions. The subsequent subsections briefly revie w the experimental methodology and de velop the formal mathematical frame work utilized to deriv e structural charac- terization metrics from the empirical spectral observations. A. Measurement Campaign and Dataset The metrics dev eloped herein are derived from the AER- P A W spectrum-monitoring campaigns conducted during the annual Packapalooza events at North Carolina State Univer - sity . The sensing platform, deployed on a tethered Helikite, captured sub-6 GHz spectrum acti vity in a dense urban envi- ronment under realistic network load conditions. While the experimental architecture and data collection methodologies are detailed in [17], [18], a brief overvie w is provided for context. The payload utilized a USRP-based Software Defined Radio (SDR) integrated with a GPS recei ver . The system operated in a passive sensing mode, sweeping center frequencies from 87 MHz to 6 GHz. Although the Helikite altitude was controlled via a ground tether , aerody- namic drift and operational constraints resulted in non-uniform altitude trajectories across different campaigns, necessitating the altitude-binning approach described in Section III-D. The multi-year datasets, made publicly av ailable through the Dryad repository [19]–[24], provide calibrated power spec- tra with synchronized timestamps and altitude metadata. Let P ( f , t, h ) denote the measured aggre gated receiver power in frequency bin f at time t and altitude h , where P ( · ) represents the calibrated SDR output with a frequency resolution of ∆ f = 60 kHz. Gi ven that absolute calibration and the ef fective noise floor may exhibit variance across campaigns, usability is defined relati ve to a conserv ative, band-specific noise reference deriv ed from the measurement data. B. Measurement T ime Resolution and Scan-W indow The dataset provides per -frequency timestamps and altitudes, so t and h may v ary across frequency bins within a sweep. In the Packapalooza campaigns considered here, one sweep spans approximately 15 s, implying that sub-second incumbent structure is not directly resolved at the sweep lev el. W e therefore aggregate samples into fixed-duration scan- window of length ∆ t = 60 s, aligned with the implementation. All temporal reliability statements in this paper are inter- preted at the ∆ t time scale. Incumbent signals with sub- second dynamics (e.g., rotating radars with short dwell time) may appear intermittent or persistent depending on scan rate, revisit time, and the aggreg ation induced by ∆ t . Accordingly , these results should be interpreted as feasibility constraints for spectrum access methods operating on second-to-minute reconfiguration time scales (e.g., database-assisted selection or modest-latency channel changes), not as a substitute for sub-second sensing. C. Noise Reference and Usability Threshold For each year and band, we estimate a conserv ativ e band noise reference N band using a two-stage robust procedure consistent with the code. First, for each frequency bin, we compute a lo wer temporal quantile (10th percentile across time) to suppress intermittent interferers and approximate the underlying noise-dominated lev el. Second, we apply a frequency-domain quantile (25th percentile across bins) to mit- igate bias from bins that are persistently occupied. The result is a scalar N band that serves as a conservati ve operational reference for that band-year . The usability threshold is then defined as T 6 G = N band + ∆ , (1) where ∆ = 10 dB is a deployment margin representing a minimum SNR headroom target under practical link b udgets. At the sample le vel, a measurement is considered usable if P ( f , t, h ) < T 6 G . (2) This binary usability indicator is the input to the scan-window reliability metrics below . D. Scan-W indow Usability and Reliability T o characterize the reliability of candidate 6G mid-band seg- ments, the framework ev aluates usability at the scan-window lev el. This approach accounts for cases where multiple sam- ples occupy a single time, frequency , and altitude coordinate ( f , h ) during a measurement interval. Let W f ,h,k denote the set of samples within the k -th scan-window of duration ∆ t at frequency f and altitude h . The within-window usable fraction is defined as η f ,h,k = 1 |W f ,h,k | X t ∈W f,h,k 1 { P ( f , t, h ) < T 6 G } , (3) where T 6 G represents the coexistence threshold. A scan- window is considered usable if it satisfies the reliability condition η f ,h,k ≥ 1 − ϵ. (4) In this study , ϵ = 0 . 05 is utilized to enforce a 95% within- window cleanliness requirement. Let K f ,h represent the set of scan-windows possessing sufficient sample support. The altitude-dependent frequency reliability , p usable ( f , h ) , is defined as the fraction of these supported windows that meet the reliability constraint: p usable ( f , h ) = 1 |K f ,h | X k ∈K f,h 1 { η f ,h,k ≥ 1 − ϵ } . (5) This reliability primitive serves as the foundation for the structural metrics detailed in the following sections, including the Usable Spectrum A vailability Ratio (USAR), contiguity , and spectral fragmentation. Implementation Notes: The analysis framew ork enforces threshold constraints on both the sample-le vel support per altitude–time–frequency coordinate and the aggregate scan- window reliability per ( f , h ) pair . This ensures that the re- ported p usable ( f , h ) values are deri ved from a statistically sufficient number of temporal snapshots captured throughout the experiment period. T o prev ent isolated frequency bin volatility , which often arises from the snapshot nature of the receiv er sweeps, a fi ve-bin moving-av erage filter is applied to the reliability mask. All subsequent structural metrics are cal- culated based on this smoothed scan-window reliability state. E. USAR Let B denote the set of frequenc y bins in the band, and N b = |B | . A frequency bin is considered r eliably usable at altitude h if p usable ( f , h ) ≥ 1 − ϵ . The Usable Spectrum A vailability Ratio is defined as USAR( h ) = 1 N b X f ∈B 1 { p usable ( f , h ) ≥ 1 − ϵ } . (6) USAR measures the fraction of the band that is reliably usable at altitude h under the scan-window reliability constraint. In K ey Performance Indicator (KPI) terms, USAR is best interpreted similar to an availability indicator of how much spectrum can be depended upon at the operational time scale ∆ t ; it does not by itself guarantee wideband feasibility , which depends on contiguity . F . Contiguity W ideband air interfaces require contiguous frequency sup- port to form large carriers without excessi ve carrier aggrega- tion ov erhead. Let C ( h ) = { f ∈ B : p usable ( f , h ) ≥ 1 − ϵ } denote the reliably usable bins at altitude h . The Largest Contiguous Clean Bandwidth (LCCB) is defined as LCCB( h ) = max S ⊆C ( h ) |S | ∆ f , (7) where S spans contiguous bins and ∆ f = 60 kHz. LCCB provides a direct structural proxy for the maximum single- carrier bandwidth supportable under coexistence at altitude h . In KPI terms, it constrains the upper bound on achiev able throughput from a single contiguous allocation and indicates whether wideband numerologies are practically supportable without heavy aggregation. G. F ragmentation Let { L i ( h ) } denote the lengths (in bins) of contiguous segments within C ( h ) . The Spectral Fragmentation Index (SFI) is defined as SFI( h ) = 1 − max i L i ( h ) P i L i ( h ) . (8) SFI approaches zero when usable spectrum forms a single dominant contiguous block and increases as it fragments into multiple smaller se gments. Fragmentation matters opera- tionally because it can increase aggregation complexity , guard- band overhead, and control-plane scheduling burden. In KPI terms, higher SFI can indirectly degrade energy efficiency and achiev able user rate through increased overhead, e ven when USAR remains moderate. H. Maximum Measured P ower For completeness, we also report altitude–frequency maps of the maximum measured aggregated power: P max ( f , h ) = max t P ( f , t, h ) , (9) ev aluated over all available samples at each ( f , h ) . P max ( f , h ) is useful for characterizing rare high-po wer excursions that can driv e receiv er headroom requirements. In practice, such ex- cursions translate directly into RF implementation constraints, including front-end compression risk and required analog-to- digital con verter (ADC) dynamic-range margin. Rare high- power ev ents can therefore determine receiv er back-off and blocking tolerance requirements, even when average interfer- ence lev els remain moderate. I V . M E A S U R E M E N T R E S U LT S W e e valuate two mid-band segments representativ e of candidate U.S. 6G allocations: 2.69–2.9 GHz and 4.4– 4.94 GHz. The measurements were collected using the AER- P A W helikite-based spectrum monitoring platform during mul- tiple annual campaigns conducted at the Packapalooza festiv al (urban) and the Lake Wheeler site (rural) in the Raleigh, NC, USA area. Details of the measurement campaign and associated dataset are provided in [17], [18]. For each band and year, the usability threshold T 6 G is deriv ed independently using the two-stage quantile procedure described in Section III-C, with ∆ = 10 dB and ϵ = 0 . 05 . Reliability is e valuated using the scan-windo w formulation at ∆ t = 60 s granularity (Section III-B). Altitude samples are grouped into 10 m bins to improv e statistical stability and visualization clarity . Certain altitude bins do not appear in the results when the minimum data requirements are not satisfied. Specifically , frequency–altitude cells are retained only if they satisfy minimum sample requirements in both the time and frequency dimensions (at least two samples per dimension in this paper). Consequently , gaps in altitude cov erage reflect insufficient data support rather than structural spectrum ef fects. All statements regarding reliability and usability are there- fore tied explicitly to the 60 s operational decision inter- val (i.e., SWR). Sub-second incumbent dynamics, such as rotating radar scan c ycles, are not resolved at this granularity and are outside the scope of the present analysis. A. 2.69–2.9 GHz Fig. 1 shows that the dominant reliability impairment in 2025 is strongly frequency selectiv e. Specifically , p usable ( f , h ) is persistently low near the lo wer band edge (approximately 2.69–2.71 GHz) across essentially all altitudes, and a narrow reliability notch appears around 2.76–2.77 GHz. Outside these 2700 2750 2800 2850 Frequency (MHz) 0 20 40 60 80 100 120 140 160 Altitude (m) 0 0.2 0.4 0.6 0.8 1 Pr(usable) Fig. 1: Altitude–frequency map of p usable ( f , h ) for 2.69– 2.9 GHz band at Packapalooza (urban), 2025. 50 100 150 Altitude (m) 0 0.2 0.4 0.6 0.8 1 USAR 2022 2023 2024 2025 (a) USAR versus altitude. 50 100 150 Altitude (m) 0 50 100 150 200 250 LCCB (MHz) 2022 2023 2024 2025 (b) LCCB versus altitude. 50 100 150 Altitude (m) 0 0.2 0.4 0.6 0.8 1 SFI 2022 2023 2024 2025 (c) SFI versus altitude. Fig. 2: Altitude-dependent structural metrics for the 2.69– 2.9 GHz band across multiple urban datasets (2022–2025): (a) USAR, (b) LCCB, and (c) SFI. regions, most of the band exhibits near-unity reliability over a wide altitude range. The altitude dependence is comparativ ely weak relative to the frequency dependence, suggesting incum- bent acti vity concentrated in specific sub-bands rather than a band-wide elev ation effect. The year-to-year impact of these frequency-localized im- pairments is captured by USAR in Fig. 2a. In both 2022 and 2023, USAR is essentially unity across most altitudes, indi- cating that nearly the full segment satisfies the 60 s reliability criterion. In 2024, USAR drops and remains approximately 0.6–0.7 across altitudes, reflecting persistent loss of reliably usable bins. In 2025, USAR is generally higher than 2024 (around 0.8 ov er much of the altitude range) but exhibits a pronounced dip near 120–130 m, indicating that reliability 2700 2750 2800 2850 Frequency (MHz) 0 20 40 60 80 100 120 140 160 Altitude (m) -60 -50 -40 -30 -20 -10 Power max (dB) Fig. 3: Maximum measured aggregated power P max ( f , h ) for 2.69–2.9 GHz band at Packapalooza (urban), 2025. deficits can couple to geometry at particular heights e ven when the primary impairment is frequency localized. Contiguity provides a more direct indicator of wideband feasibility than aggregate av ailability . Fig. 2b sho ws that in 2024 the largest contiguous clean block is constrained to roughly 60–70 MHz ov er most altitudes. In 2025, LCCB is larger on average (typically around 125 MHz at man y altitudes) but collapses near the same altitude interval where USAR dips, reaching on the order of 62 MHz around 120– 130 m. At the lowest altitude bin, 2025 also shows reduced contiguity (tens of MHz), consistent with localized strong interference in the power maxima. In contrast, 2022 and 2023 measurements support substantially larger contiguous blocks (often approaching the full 210 MHz segment), consistent with their near-unity USAR. Fig. 2c shows fragmentation trends that are consistent with the LCCB contiguity results. The 2024 campaign exhibits sustained fragmentation (SFI ≈ 0.5 across most altitudes), consistent with usable spectrum being split into multiple comparable segments. In 2025, fragmentation is moderate and altitude dependent (typically 0.2–0.45, rising near the altitude interval where LCCB collapses). By contrast, 2022–2023 show near -zero SFI ov er broad altitude ranges, indicating a dominant contiguous usable block. The maximum-power map in Fig. 3 pro vides practical RF insight: elev ated maxima are concentrated near the same fre- quency regions that exhibit reduced p usable , particularly near the lo wer band edge and parts of the upper edge. This indicates that infeasibility is driven not only by frequent exceedances of T 6 G (captured by p usable ) but also by intermittent high-power peaks that impose receiv er dynamic-range requirements. The structural limitations observed in the 2.69–2.9 GHz segment (persistent frequency-localized reliability deficits, moderate USAR in sev eral measurement years, and limited contiguous support) highlight the challenges for wideband single-carrier deployment under incumbent coexistence at the 60 s decision scale. These characteristics suggest that, without 2650 2700 2750 2800 2850 2900 2950 Frequency (MHz) -60 -40 -20 Power (dBm) (a) Lake Wheeler (rural) in 2022 2650 2700 2750 2800 2850 2900 2950 Frequency (MHz) -60 -40 -20 Power (dBm) (b) Lake Wheeler (rural) in 2024 2650 2700 2750 2800 2850 2900 2950 Frequency (MHz) -60 -40 -20 Power (dBm) (c) Packapalooza (urban) in 2022 2650 2700 2750 2800 2850 2900 2950 Frequency (MHz) -60 -40 -20 Power (dBm) (d) Packapalooza (urban) in 2023 2650 2700 2750 2800 2850 2900 2950 Frequency (MHz) -60 -40 -20 Power (dBm) (e) Packapalooza (urban) in 2024 2650 2700 2750 2800 2850 2900 2950 Frequency (MHz) -60 -40 -20 Power (dBm) (f) Packapalooza (urban) in 2025 Fig. 4: CDF and median of recei ved power across 2650– 2950 MHz derived from helikite measurements. The black curve sho ws the median power across snapshots, while colored markers indicate empirical CDF values for each frequency bin. (a) Wheeler 2022, (b) Wheeler 2024, (c) P ackapalooza 2022, (d) Packapalooza 2023, (e) P ackapalooza 2024, (f) Packapalooza 2025. changes to incumbent usage, the band may not readily support broad unlicensed or full-power commercial deployment as currently configured. In light of recent U.S. policy directing formal study of this band’ s suitability for commercial 6G use and potential relocation of federal systems if feasible, such empirical structural insight can inform those assessments by clarifying whether incumbency patterns are “e venly distrib uted and manageable, ” or whether relocation or intensiv e sharing mechanisms would be required to achiev e large contiguous blocks suitable for wideband carriers. Fig. 4 presents the empirical power distribution across 2650–2950 MHz deriv ed from helikite measurements in both rural (Lak e Wheeler) and urban (Packapalooza) en vironments ov er multiple years. While the primary candidate band of interest is 2690–2900 MHz, an additional 50 MHz margin is included on each side to capture activity in adjacent bands and reveal potential guard-band or leakage effects near the band edges. The colored markers represent the empirical CDF of receiv ed power for each frequency bin, while the black curve indicates the median power across measurement snap- shots. The lower portion of the extended range (approximately 2650–2690 MHz) exhibits similarly ele vated po wer le vels in both en vironments, indicating persistent incumbent activity . 4400 4500 4600 4700 4800 4900 Frequency (MHz) 0 20 40 60 80 100 120 140 160 Altitude (m) 0 0.2 0.4 0.6 0.8 1 Pr(usable) Fig. 5: Altitude–frequency map of p usable ( f , h ) for 4.4– 4.94 GHz band at Packapalooza (urban), 2025. Differences become more visible in the central portion of the band, where the urban Packapalooza measurements show a larger spread of power values and more frequent high- power peaks at v arying frequencies. These peaks are not consistently aligned across years, suggesting that they arise from temporally varying transmissions and changing channel utilization rather than persistent fixed-frequenc y emitters. B. 4.4–4.94 GHz The 4.4–4.94 GHz reliability map in Fig. 5 is largely high across the band, but the remaining impairment is not uniformly distributed. Reduced p usable appears as patchy , localized regions, concentrated primarily in the lower portion of the segment (roughly 4.40–4.52 GHz) and most e vident o ver mid-to-high altitudes. Relativ e to 2.69–2.9 GHz, the reliability loss is less pervasi ve and does not partition the band into a small number of consistently unusable sub-bands. USAR (Fig. 6a) remains high in 2022–2023 (near unity over most altitudes). In 2024, USAR is generally between about 0.8 and 1.0 with a mid-altitude dip. In 2025, USAR is more variable, remaining relativ ely high at low-to-mid altitudes but degrading more clearly above 130 m, where it drops to approximately 0.68. Thus, a majority of the segment remains usable at the 60 s decision scale across all years, although altitude-dependent degradation becomes noticeable at higher elev ations. High aggregate reliability often translates into large contigu- ous support, b ut the year dependence remains important. As shown in Fig. 6b, 2022–2023 frequently support contiguous blocks exceeding 500 MHz, approaching the full segment. In 2024, contiguity is still substantial but exhibits some altitude- dependent drops. In 2025, LCCB is consistently lower than 2022–2023 and highly non-monotone with altitude, varying roughly between 160 and 410 MHz depending on height. This indicates that wideband single-carrier operation is often feasible in this segment; howe ver , the maximum supportable carrier bandwidth can vary significantly with altitude. 50 100 150 Altitude (m) 0 0.2 0.4 0.6 0.8 1 USAR 2022 2023 2024 2025 (a) USAR versus altitude. 50 100 150 Altitude (m) 0 200 400 600 LCCB (MHz) 2022 2023 2024 2025 (b) LCCB versus altitude. 50 100 150 Altitude (m) 0 0.2 0.4 0.6 0.8 1 SFI 2022 2023 2024 2025 (c) SFI versus altitude. Fig. 6: Altitude-dependent structural metrics for the 2.4– 4.94 GHz band across multiple urban datasets (2022–2025). (a) USAR, (b) LCCB, and (c) SFI. 4400 4500 4600 4700 4800 4900 Frequency (MHz) 0 20 40 60 80 100 120 140 160 Altitude (m) -70 -60 -50 -40 -30 -20 Power max (dB) Fig. 7: Maximum measured aggregated power P max ( f , h ) for 4.4–4.94 GHz band at Packapalooza (urban), 2025. Fig. 6c shows fragmentation trends that are consistent with the observed LCCB variations. In 2022–2023, SFI stays near zero across most altitudes, indicating a dominant contiguous usable block. In 2024 and especially 2025, SFI increases and becomes altitude dependent, implying that reliability losses oc- cur through partial band break-up rather than wholesale band- wide blocking. Importantly , even when SFI rises, the LCCB curves sho w that a dominant contiguous region often persists. The maximum-power map in Fig. 7 sho ws that high-power excursions are spatially and spectrally localized, with promi- nent peaks around the mid-band (near 4.66–4.71 GHz) at low altitude and additional ele vated regions at higher altitudes. This supports a practical interpretation: compared to 2.69–2.9 GHz, impairment is less dominated by a small number of persistently 4400 4500 4600 4700 4800 4900 Frequency (MHz) -60 -40 -20 Power (dBm) (a) Lake Wheeler (rural) in 2022 4400 4500 4600 4700 4800 4900 Frequency (MHz) -60 -40 -20 Power (dBm) (b) Lake Wheeler (rural) in 2024 4400 4500 4600 4700 4800 4900 Frequency (MHz) -60 -40 -20 Power (dBm) (c) Packapalooza (urban) in 2022 4400 4500 4600 4700 4800 4900 Frequency (MHz) -60 -40 -20 Power (dBm) (d) Packapalooza (urban) in 2023 4400 4500 4600 4700 4800 4900 Frequency (MHz) -60 -40 -20 Power (dBm) (e) Packapalooza (urban) in 2024 4400 4500 4600 4700 4800 4900 Frequency (MHz) -60 -40 -20 Power (dBm) (f) Packapalooza (urban) in 2025 Fig. 8: CDF and median of recei ved power across 4350– 4990 MHz derived from helikite measurements. The black curve sho ws the median power across snapshots, while colored markers indicate empirical CDF values for each frequency bin. (a) Wheeler 2022, (b) Wheeler 2024, (c) P ackapalooza 2022, (d) Packapalooza 2023, (e) P ackapalooza 2024, (f) Packapalooza 2025. unusable sub-bands, but extreme excursions can still impose RF margin requirements and contribute to altitude-dependent contiguity drops. This segment is generally more fa vorable for forming wide contiguous carriers at the 60 s decision scale. In 2024–2025, reliability degradation is smaller than in 2.69–2.9 GHz, but is more clearly altitude coupled at higher elev ations, leading to non-trivial variations in LCCB and moderate fragmentation. Fig. 8 presents the empirical power distribution across 4350–4990 MHz deriv ed from helikite measurements at Lake Wheeler (rural) and Packapalooza (urban) over multiple years. Across all datasets, the median recei ved power remains close to the measurement floor , indicating the absence of persistent wideband acti vity in this band. The colored CDF markers re- veal sporadic high-power peaks at scattered frequencies; how- ev er , their occurrence and locations vary substantially between years. Some datasets exhibit clusters of peaks at particular frequencies, while others remain largely near the background lev el. The lack of consistent frequency alignment across years suggests that these events arise from intermittent transmissions rather than stable incumbents occupying fixed channels. V . C O N C L U S I O N A N D F O RW A R D - L O O K I N G D I S C U S S I O N This study ev aluated the structural feasibility of two incumbent-heavy mid-band segments currently discussed in the U.S. 6G pipeline. Using deployment-oriented metrics deriv ed from multi-year measurement data, we quantified tem- poral reliability , largest contiguous clean bandwidth, spectral fragmentation, and extreme interference behavior at a 60 s op- erational decision scale. The results demonstrate that deploy- ability is governed by spectral structure rather than nominal bandwidth. The 4.4–4.94 GHz segment exhibits consistently high reliability and substantial contiguous clean regions across most altitudes and campaigns, indicating structural conditions compatible with wideband operation under dynamic access framew orks. In contrast, the 2.69–2.9 GHz segment shows persistent frequency-selecti ve reliability constraints and re- duced contiguous support in several measurement years. In this regime, wideband feasibility becomes sensitiv e to channel placement, aggregation strategy , and receiv er dynamic-range margin. T wo interpretiv e considerations are important. First, feasibil- ity is e xplicitly indexed to time scale. All reliability metrics are defined at ∆ t = 60 s granularity . The conclusions therefore in- form coordination mechanisms operating on second-to-minute time scales, such as database-assisted access or periodic channel reassignment. Sub-second incumbent dynamics are av eraged within this interval and may require complementary high-temporal-resolution campaigns if waveform adaptation is expected to track scan-c ycle behavior . Second, extreme-interference statistics represent implemen- tation constraints rather than abstract tail descriptors. Ex- pressing interference excursions relativ e to T 6 G directly links measurement results to recei ver blocking tolerance, adjacent-channel selectivity , and dynamic-range requirements. In incumbent-heavy environments, rare high-po wer events can dominate front-end design even when average occupancy remains moderate. From a spectrum-policy perspective, the measurements es- tablish a structural baseline against which future band ev olu- tion can be assessed. Partial clearing through relocation would be expected to increase contiguous clean bandwidth in af fected sub-bands, whereas structured sharing without full clearing places greater emphasis on intrinsic spectral coherence and receiv er robustness. Changes in incumbent composition or adjacent-band utilization may alter fragmentation patterns e ven without formal reallocation. The central finding is therefore conditional but engineering-driv en: as candidate mid-band segments ev olve from clearing toward coordination, practical 6G feasibility depends on whether the resulting spectrum opportunities remain (i) temporally reliable at the rele vant re- configuration time scale, (ii) sufficiently contiguous to support wideband carriers, and (iii) bounded in extreme interference excursions to a void prohibiti ve recei ver margin requirements. R E F E R E N C E S [1] ITU-R, “Framework and ov erall objectives of the future development of IMT for 2030 and beyond, ” International T elecommunication Union, T ech. Rep. M.2160, 2024. [2] CEPT, “ECC report on the 6 GHz band for IMT, ” 2023. [3] The White House, “Presidential memorandum on winning the 6G race, ” https://www .whitehouse.gov/presidential- actions/2025/12/ winning- the- 6g- race/, Dec. 2025, accessed: Feb 26, 2026. [4] National T elecommunications and Information Administration, “National spectrum strategy , ” U.S. Department of Commerce, T ech. Rep., Nov . 2023. [Online]. A vailable: https://www .ntia.gov/sites/default/ files/publications/national spectrum strate gy final.pdf [5] Federal Communications Commission, “47 CFR § 2.106 - T able of Frequency Allocations, ” Electronic Code of Federal Regulations, 2025. [6] E. Drocella et al. , “ Assessment of the 4.4-4.94 GHz band for potential shared federal and non-federal use, ” NTIA Office of Spectrum Manage- ment, T echnical Report, 2022. [7] International T elecommunication Union, “Final acts of the W orld Ra- diocommunication Conference (WRC-23), ” Dubai, U AE, 2023. [8] H. Flinck et al. , “ An ov erview of flexible spectrum management ap- proaches for 6G, ” IEEE Access , vol. 13, pp. 207 396–207 411, 2025. [9] A. H. F . Raouf and ˙ I. G ¨ uvenc ¸ , “Beyond path loss: Altitude-dependent spectral structure modeling for U A V measurements, ” in Pr oc. IEEE Int. Symp. Dyn. Spectr . Access Netw . , W ashington, DC, USA, May 2026, accepted for publication. [10] M. W ellens and P . M ¨ ah ¨ onen, “Lessons learned from an extensi ve spectrum occupancy measurement campaign and a stochastic duty cycle model, ” Mob. Netw . Appl. , vol. 15, no. 3, pp. 461–474, 2010. [11] J. Mao, R. Sun, M. Poletti, R. Gandotra, H. Guo, and A. Y ener , “ Ai-driv en spectrum occupancy prediction using real-world spectrum measurements, ” in Proc. IEEE V eh. T echnol. Conf. , Nice, France, June 2026, under revie w . [12] 3GPP, “TS 38.101-1: NR; User Equipment (UE) radio transmission and reception; Part 1, ” 3rd Generation Partnership Project (3GPP), T ech. Rep., 2025, release 18, specifies UE RF blocking/selectivity requirements. [Online]. A vailable: https://www .etsi.org/deliv er/etsi ts/ 138100 138199/13810101/18.09.00 60/ts 13810101v180900p.pdf [13] ——, “Study on 6G scenarios and requirements, ” 3rd Generation Part- nership Project, T ech. Rep. TR 38.914, 2025. [14] Next G Alliance, “Roadmap to 6G, ” Alliance for T elecommunications Industry Solutions (A TIS), W ashington, DC, USA, T ech. Rep., 2022. [15] M. M. Sohul, M. Y ao, T . Y ang, and J. H. Reed, “Spectrum access system for the citizen broadband radio service, ” IEEE Commun. Mag. , vol. 53, no. 7, pp. 18–25, 2015. [16] L. Zheng, M. Lops, Y . C. Eldar , and X. W ang, “Radar and communi- cation coexistence: An overvie w: A review of recent methods, ” IEEE Signal Pr ocess. Mag. , vol. 36, no. 5, pp. 85–99, 2019. [17] S. J. Maeng et al. , “Altitude-dependent sub-6 GHz wireless spectrum: Survey , measurements, trends, and modeling, ” Comput. Netw . , 2025, under revie w . [18] A. H. F . Raouf et al. , “W ireless datasets for aerial networks, ” npj W irel. T echnol. , 2025, under revie w . [19] A. H. F . Raouf, O. Ozdemir , I. Guvenc, and M. Sichitiu, “AERP A W helikite spectrum measurements at Packapalooza Festiv al in Aug. 2024, ” Dryad, Dataset, 2024. [Online]. A vailable: https: //doi.org/10.5061/dryad.0zpc8676n [20] S. J. Maeng, O. Ozdemir, I. Guvenc, and M. Sichitiu, “AERP A W helikite spectrum measurements at Packapalooza Festival in Aug. 2023, ” Dryad, Dataset, 2023. [Online]. A vailable: https://doi.org/10. 5061/dryad.mw6m9063f [21] ——, “AERP A W helikite spectrum monitoring at Packapalooza festiv al in Aug. 2022, ” Dryad, Dataset, 2023. [Online]. A vailable: https://doi.org/10.5061/dryad.qbzkh18qd [22] A. H. F . Raouf, O. Ozdemir , I. Guvenc, and M. Sichitiu, “AERP A W helikite spectrum measurements at Lake Wheeler site in August 2024, ” Dryad, Dataset, 2024. [Online]. A vailable: https: //doi.org/10.5061/dryad.pk0p2ngz8 [23] S. J. Maeng, O. Ozdemir, I. Guvenc, and M. Sichitiu, “AERP A W helikite spectrum measurements at Lake Wheeler site in May 2022, ” Dryad, Dataset, 2023. [Online]. A vailable: https://doi.org/10.5061/ dryad.jm63xsjhw [24] A. H. F . Raouf, O. Ozdemir , I. Guvenc, and M. Sichitiu, “AERP A W helikite spectrum measurements at Packapalooza Festiv al in August 2025, ” Dryad, Dataset, 2025. [Online]. A vailable: https: //doi.org/10.5061/dryad.tb2rbp0fw
Original Paper
Loading high-quality paper...
Comments & Academic Discussion
Loading comments...
Leave a Comment