Real-Time Driver Safety Scoring Through Inverse Crash Probability Modeling
Road crashes remain a leading cause of preventable fatalities. Existing prediction models predominantly produce binary outcomes, which offer limited actionable insights for real-time driver feedback. These approaches often lack continuous risk quanti…
Authors: Joyjit Roy, Samaresh Kumar Singh
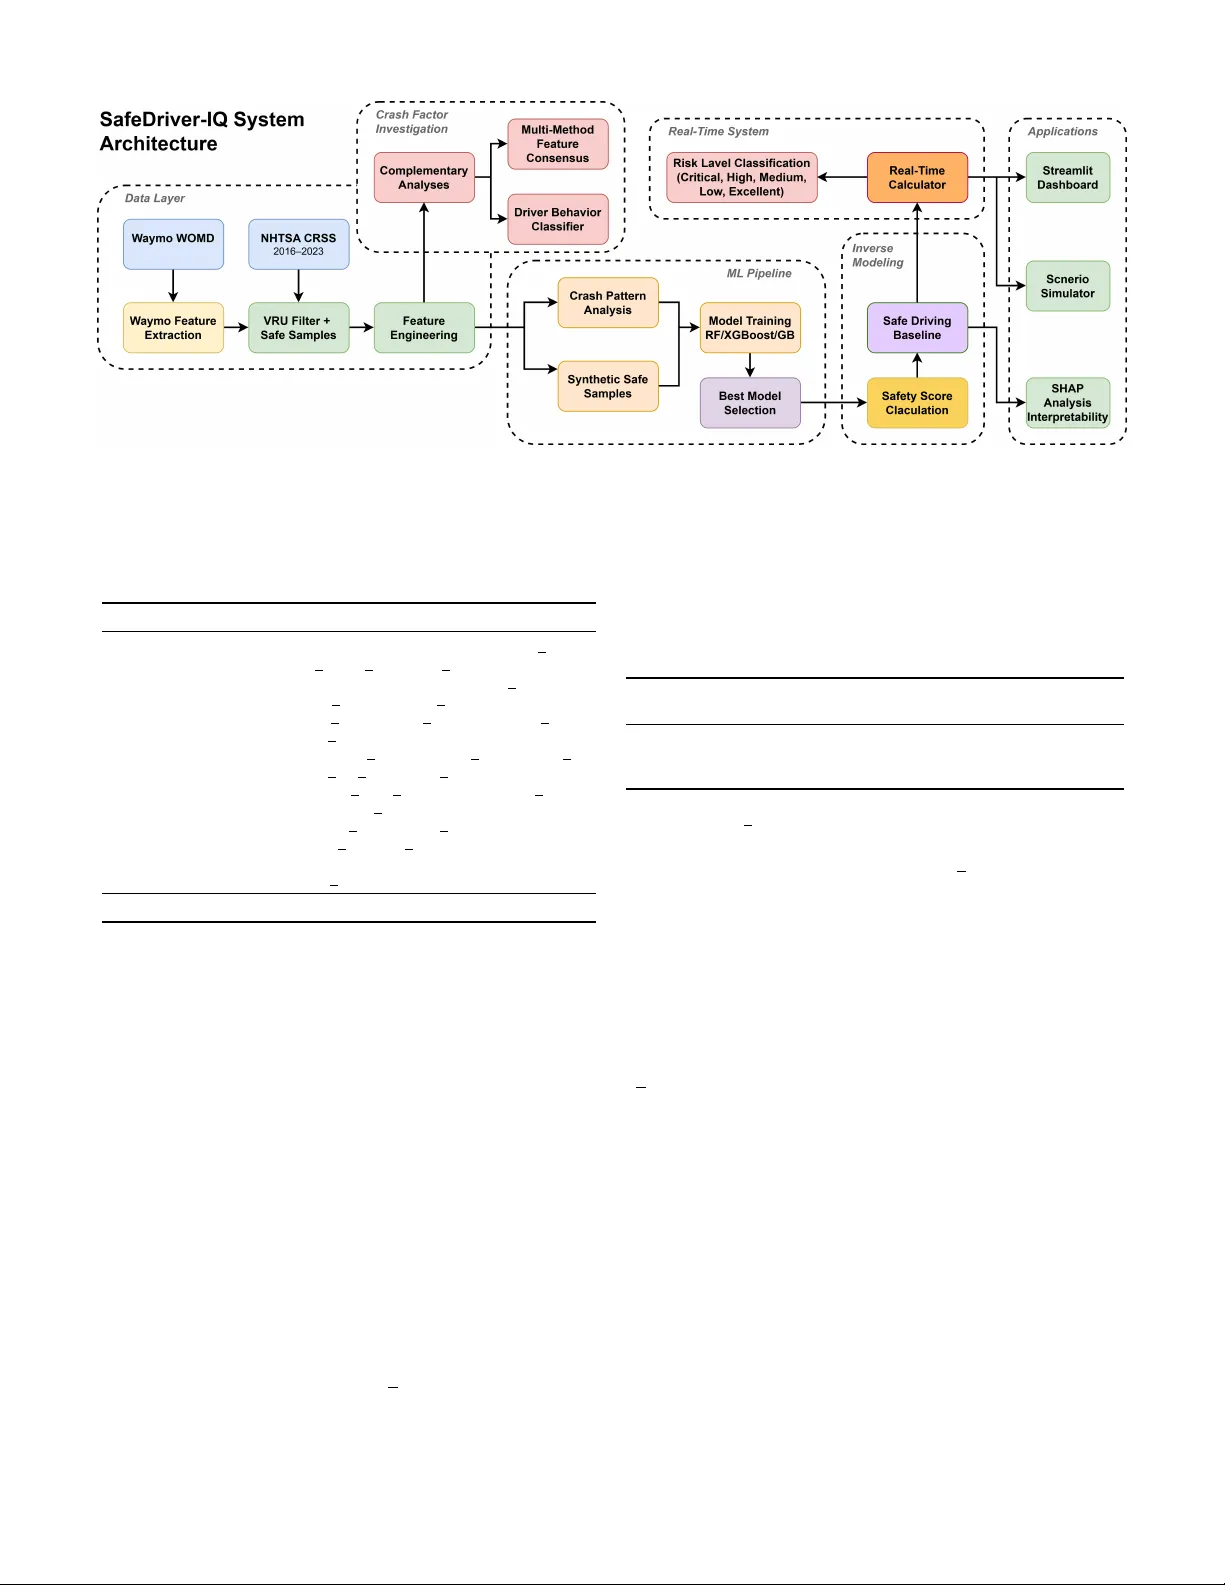
Real-T ime Dri ver Safety Scoring Through In v erse Crash Probability Modeling 1 st Joyjit Roy Independent Resear cher IEEE Senior Member Austin, T exas, USA joyjit.roy .tech@gmail.com 2 nd Samaresh Kumar Singh Independent Researc her IEEE Senior Member Leander , T exas, USA ssam3003@gmail.com 3 rd Sushanta Das, PhD American Center for Mobility Ypsilanti, Michigan, USA sushanta.das@acmwillowrun.or g Abstract —Road crashes remain a leading cause of preventable fatalities. Existing prediction models pr edominantly produce binary outcomes, which offer limited actionable insights for real- time driver feedback. These appr oaches often lack continuous risk quantification, interpr etability , and explicit consideration of vulnerable road users (VR Us), such as pedestrians and cy- clists. This r esearch introduces SafeDriver -IQ, a framew ork that transforms binary crash classifiers into continuous 0–100 safety scores by combining national crash statistics with naturalistic driving data from autonomous vehicles. The framework fuses National Highway T raffic Safety Administration (NHTSA) crash records with W aymo Open Motion Dataset scenarios, engineers domain-informed featur es, and incorporates a calibration layer grounded in transportation safety literatur e. Evaluation across 15 complementary analyses indicates that the framework re- liably differentiates high-risk from low-risk driving conditions with strong discriminativ e performance. Findings further rev eal that 87% of crashes inv olve multiple co-occurring risk factors, with non-linear compounding effects that increase the risk to 4.5× baseline. SafeDriver -IQ delivers proacti ve, explainable safety intelligence rele vant to advanced driver -assistance systems (AD AS), fleet management, and urban infrastructure planning. This framework shifts the focus fr om reactive crash counting to real-time risk prev ention. Index T erms —inv erse crash modeling, safety scoring, vulnera- ble road users, pedestrian safety , SHAP interpretability , real-time safety assessment, crash pr ediction, ensemble learning I . I N T RO D U C T I O N Road traffic crashes continue to be a leading cause of prev entable mortality worldwide, with the W orld Health Orga- nization (WHO) reporting approximately 1.19 million fatalities annually [1]. In the United States, NHTSA documented 40,990 traffic fatalities in 2023. VR Us, specifically pedestrians and c y- clists, accounted for a disproportionately large and increasing share [2]. In 2023, pedestrian fatalities reached 7,314, while cyclist fatalities rose to 1,166, representing a 4.4% increase from 2022 [3]. Although vehicle safety technologies such as automatic emergenc y braking and lane departure warnings hav e advanced, VR U fatalities have increased by more than 50% over the past decade. This persistent rise highlights a significant gap in vehicle-centric safety strategies. The dominant approach in data-driv en traf fic safety research is cr ash pr ediction . This estimates the likelihood of a crash based on en vironmental and operational conditions [4]. While valuable for infrastructure planning and hotspot identification, it of fers limited utility for real-time dri ver feedback. Binary outputs such as ”crash likely” or ”crash unlikely” provide minimal actionable information. They do not conv ey the de- gree of risk or identify which factors (speed, lighting, weather) contribute to it. This paper introduces In verse Crash Modeling , a paradigm that conv erts binary crash classifiers into continuous safety scoring systems. The proposed framew ork, SafeDriver -IQ , quantifies the distance between current driving conditions and crash-pr oducing scenarios as a continuous score from 0 to 100. The transformation uses posterior class probabilities from a trained crash classifier , with the probability of not crashing as the safety score. A well-calibrated classifier preserves these gradations, whereas conv entional binary thresholding discards them. The in verse modeling approach recovers and communicates them as continuous feedback. The model offers the following key contributions: 1) In verse Crash Modeling Formulation. This work for - malizes the transformation of binary crash classifiers into continuous safety scoring functions (Section III-E). 2) Dual-Dataset VR U-Focused Safety Assessment. Inte- grates NHTSA Crash Report Sampling System (CRSS) crash data [5] with the W aymo Open Motion Dataset [6] to build a safety model informed by both national crash statistics and naturalistic dri ving kinematics (Sec- tion III-A). 3) Domain-Knowledge Calibration. A rule-based cali- bration layer addresses systematic model bias related to underweighted risk factors. This bridges statistical prediction with domain expertise (Section III-F). 4) Driver Behavior Classification and Multi-F actor Risk Analysis. Clustering identifies four distinct crash- in volv ed driv er profiles, and the analysis demonstrates non-linear compounding effects from co-occurring risk factors (Section IV). 5) Comprehensive Empirical V alidation. 15 comple- mentary analyses, including ablation studies, cross- validation, SHAP interpretability , and real-world impact simulation, demonstrate the robustness of the framework (Section IV). T ABLE I C O MPA R IS O N O F P RO P OS E D M O D EL W I T H E X IS T I NG A P P ROAC H E S Appr oach Output Real-Time Continuous VRU Focus Interpr etable Data Source Crash prediction (ML) [4], [7] Binary No No No Partial Crash records T elematics scoring [8], [9] Score Y es Y es No No V ehicle sensors UBI / Insurance [10] Risk tier No No No No Driving logs Bayesian real-time [11] Probability Y es Y es No No T raffic flow DL dri ver scoring [12] Score Y es Y es No No T elematics SHAP crash analysis [13] Binary No No No Y es Crash records SafeDriver -IQ (proposed) 0–100 score Y es Y es Y es Y es (SHAP) CRSS + W aymo I I . R E L A T E D W O R K A. Crash Pr ediction and Risk Modeling Over the past decade, machine learning (ML) approaches to crash prediction have advanced significantly . Early work employed logistic regression and decision trees to identify crash-contributing factors from police report data [14]. More recent studies hav e applied gradient boosting [15], random forests [16], and deep neural networks [17] to large-scale crash databases, achieving progressiv ely higher classification accuracy . Mannering and Bhat [7] re view statistical and econo- metric methods, noting the field’ s transition toward nonpara- metric, ensemble-based approaches. W ang et al. [4] identify a persistent gap between of fline model accuracy and the practical utility of online deployment. A ke y limitation of these models is their binary framing. They predict crash occurrence but do not quantify the de gree of safety under non-crash conditions. Even probabilistic models that estimate crash likelihoods often apply thresholds for binary decisions, discarding the risk gradient encoded in the probability distribution. The proposed framework addresses this by in verting the crash classifier to generate continuous safety estimates that retain this gradient. B. Driver Safety Scoring Driv er scoring systems are generally categorized as either telematics-based or model-based. T elematics approaches [8], [9] equip vehicles with accelerometers, GPS, and OBD-II readers to detect aggressive driving ev ents such as hard braking, rapid acceleration, and speeding. Although effecti ve for fleet management, these systems measure driving behavior rather than driving context . They penalize hard braking regard- less of whether it was warranted by a pedestrian crossing. Model-based scoring systems use crash risk models to assess driving conditions but typically produce categorical risk lev els (e.g., high, medium, or low), rather than continuous scores [11]. Usage-based insurance (UBI) models [10] are the most commercially advanced scoring systems, but they emphasize long-term actuarial risk rather than real-time safety feedback. SafeDriv er-IQ inte grates both approaches by using a crash prediction model trained on national crash data to produce continuous, real-time, context-a ware safety scores. C. V ulnerable Road User Safety Modeling the safety of VR Us presents significant challenges due to the inherent asymmetry in vehicle–pedestrian and vehicle–c yclist interactions. Analyses utilizing the NHTSA ’ s Fatality Analysis Reporting System (F ARS) and CRSS have identified lighting conditions, vehicle speed, and intersection geometry as primary factors contributing to VR U crashes [18], [19]. Recent studies have in vestigated computer vision [20] and V ehicle-to-Everything (V2X) communication [21] for real-time VR U detection. Howe ver , these approaches require infrastructure inv estment. SafeDriv er-IQ takes a complementary approach by model- ing the en vironmental conditions historically associated with VR U crashes, rather than relying on real-time VR U detection. This allows safety scoring without dedicated VR U detection hardware. D. Interpr etable Mac hine Learning in Safety The adoption of ML in safety-critical applications requires interpretability . SHAP (SHapley Additiv e exPlanations) [22] has emerged as the standard for post-hoc feature attribution, providing both local and global explanations. In the trans- portation domain, SHAP has been applied to crash severity prediction [13] and traf fic flow modeling [23]. Howe ver , its application to continuous safety scoring, where SHAP values explain why a score is low rather than why a cr ash occurred , remains underexplored. SafeDriv er-IQ addresses this gap by using SHAP to provide actionable explanations for safety scores, enabling drivers to understand which specific factors (e.g., poor lighting, adverse weather) reduce the score and what actions could improv e it. E. Naturalistic Driving Datasets A gro wing body of work uses large-scale naturalistic driving datasets to study real-world driving behavior beyond crash records. The SHRP2 Naturalistic Driving Study [24], [25] collected continuous driving data from over 3,500 participants, capturing both crash and near-crash ev ents alongside routine driving. The W aymo Open Motion Dataset [6] provides high- frequency (10,Hz) multi-agent trajectories from autonomous vehicle fleets, including vehicles, pedestrians, and cyclists, offering rich spatiotemporal context for safe and near-miss driving scenarios. These datasets address a critical gap in crash-only databases like CRSS, specifically the absence of safe driving baselines. Prior work has primarily used these datasets for motion forecasting and autonomous vehicle plan- ning rather than for calibrating safety scoring systems. T o the authors’ kno wledge, SafeDriv er-IQ is the first framew ork to combine national crash statistics (CRSS) with autonomous ve- hicle trajectory data (W aymo) in a complementary pipeline for continuous safety scoring. T able I summarizes the capabilities and gaps of existing approaches. I I I . M E T H O D O L O G Y A. Data Sour ces SafeDriv er-IQ employs a dual-dataset strategy . It combines macro-lev el national crash statistics with micro-lev el real- world driving kinematics. This enables the model to learn both what conditions pr ecede crashes and how agent behavior unfolds in near-crash and safe scenarios. 1) NHTSA Crash Report Sampling System (CRSS) : The primary dataset is the NHTSA CRSS [5], a nationally representativ e probability sample of police-reported crashes spanning 2016-2023 (417,335 crash-lev el A CCIDENT records across ele ven link ed tables). Filtering for VR U in v olvement via the pedestrian/c yclist typing table (PBTYPE) and deduplicat- ing on crash case number (CASENUM) yields 23,194 unique VR U crash records, representing 5.6% of the full population. 2) W aymo Open Motion Dataset (WOMD) : T o comple- ment the crash-only CRSS data, the frame work integrates the W aymo WOMD v1.2 [6]. Scenarios are recorded at 10 Hz ov er 9.1-second windo ws (91 timesteps), capturing multi-agent trajectories of vehicles, pedestrians, and cyclists. For each scenario, W aymo Featur e Extraction deriv es kinematic and behavioral features, including ego-v ehicle speed (mean and maximum), minimum inter-agent distances, time-to-collision (TTC) estimates, collision and near-miss flags, and aggressi ve driving indicators (hard acceleration, hard braking, aggressiv e lane changes, speed-limit violations, and red-light running). The resulting risk distribution (T able II) contrasts sharply with the 100% crash CRSS data, providing the behavioral baseline needed to calibrate safety scores against real-world driving norms. CRSS provides br eadth , with national-scale, statistically weighted, multi-year co verage across all U.S. road types and conditions. WOMD provides depth , with rich spatiotemporal trajectories including near-miss e vents not captured in police reports. T ogether, they enable the complementary modeling pipeline illustrated in Fig. 1. 3) Safe Driving Sample Construction : Both sources con- ver ge at the VR U Filter + Safe Samples component, which produces the balanced training set for binary classification. Synthetic safe samples are generated from CRSS crash records by systematically modifying high-risk features to safer values: • Lighting: 80% of samples shifted to non-poor lighting • Night dri ving: 70% of samples shifted to daytime • W eather: 90% of samples shifted to non-adverse condi- tions • Road conditions: 85% of samples shifted to dry roads T ABLE II D UA L -D A TAS E T S U M M ARY Component Records Description CRSS Principal T ables (2016–2023) A CCIDENT 417,335 Crash-le vel records VEHICLE 469,443 V ehicle inv olvement PERSON 655,675 Person in volv ement PBTYPE 25,519 Pedestrian/cyclist typing +7 supplementary — Factor , distraction, impairment, etc. W aymo Open Motion Dataset v1.2 Real scenarios 455 Parsed from TFRecord shards Synthetic aug. 45 Statistically matched T otal WOMD 500 10 Hz, 9.1 s windows – Collisions 9 1.8% of scenarios – Near -misses 27 5.4% of scenarios – Safe driving 464 92.8% of scenarios After VRU F iltering (CRSS) VR U crashes 23,194 Ped. or c yclist in volved Safe samples 23,194 Synthetic + W aymo-v alidated T otal balanced 46,388 1:1 crash-to-safe ratio T rain/T est Split (80/20, stratified) T raining set 37,110 18,555 crash + 18,555 safe T est set 9,278 4,639 crash + 4,639 safe F eature Space Numeric features 64 7 groups (T able III) CRSS years 8 2016–2023 PSUs sampled ∼ 60 National coverage W aymo safe-dri ving episodes further validate that these synthetic samples exhibit behavioral characteristics consistent with real safe dri ving. This dual validation yields a balanced 1:1 training set. The resulting episodes form the Safe Driving Baseline , a reference profile of low-risk behavior that con- textualizes driver cluster analysis (Section IV) and external validation (Section IV -O). B. F eatur e Engineering The pipeline produces 64 numeric features, organized into 7 groups, from the raw CRSS v ariables. These were reduced from an initial pool of 120+ candidates by removing near- zero-variance and highly correlated columns. T able III details each group and representativ e features. Interaction features explicitly model compound risk scenarios such as dark × ad- verse weather , a combination that the ablation study confirms produces non-linear compounding effects. C. Crash F actor In vestigation After Featur e Engineering , the pipeline branches into two parallel tracks. The Crash Factor In vestigation track characterizes the structural risk landscape through complemen- tary analyses, while the ML Pipeline (Section III-D) trains the production classifier . Both tracks operate on the same engineered feature space. Complementary Analyses. A battery of 15 analyses is applied to the full CRSS VR U subset to examine crash factor distributions, temporal trends, and multi-factor co-occurrence patterns. The outputs feed two downstream components. Fig. 1. SafeDriv er-IQ full system architecture covering the data layer , feature engineering, crash factor in vestigation, ML pipeline, inverse modeling, real-time risk classification, and application deployment. T ABLE III F E A T UR E G RO U PS A N D C O UN T S Featur e Gr oup Count Representative Featur es T emporal 10 HOUR, MINUTE, MONTH, DA Y WEEK, IS R USH HOUR, IS WEEKEND En vironmental 6 WEA THER, AD VERSE WEA THER, LGT COND, POOR LIGHTING Location 8 TYP INT , REL R OAD, WRK ZONE, INT HWY VR U-Specific 5 pedestrian count, cyclist count, total vru, max vru injury , fatal vru Interaction 3 NIGHT AND DARK, WEEKEND NIGHT , AD VERSE CONDITIONS Crash & V ehicle 24 HARM EV , MAN COLL, ALCOHOL, MAX SEV , VE TO T AL, PEDS Metadata 8 STRA TUM, REGION, URBANICITY , PJ, PSU V AR T otal 64 Multi-Method Featur e Consensus. Feature importance is assessed across four methods: RF built-in importance, XG- Boost gain, permutation importance, and T reeSHAP . Rankings are compared to identify factors that are consistently dominant across methods, reducing reliance on any single metric. Driver Beha vior Classifier . KMeans clustering ( k =4 ) on composite aggression and risk-taking scores identifies four distinct crash-inv olved driv er profiles. The Safe Driving Base- line from the W aymo integration provides a low-risk reference for contextualizing these clusters. Full results are reported in Section IV. D. Model T raining The frame work employs two distinct training pipelines to serve separate analytical goals. Pipeline 1: Model Selection. Three ensemble classifiers are ev aluated: Random Forest (RF), XGBoost (XGB), and Gradient Boosting (GB). All use n estimator s =100 with a stratified 80/20 train-test split, each run across three random seed iterations to assess stability . The best-performing model is serialized as the production model. All metrics in T able IV are from this pipeline. T ABLE IV M O DE L C OM PA RI S O N : B E S T I T E RAT IO N R E S U L T S Model T rain Acc T est Acc ROC- A UC CV Mean Gap Random Forest 0.766 0.758 0.833 0.755 0.80% XGBoost 0.801 0.742 0.829 0.738 5.90% Gradient Boost 0.798 0.744 0.830 0.741 5.40% Gap = Train Acc | T est Acc. Best of 3 random seed iterations, n estimators =100 , stratified 80/20 split. The RF classifier (iteration 3, random state=126) achieves the best test R OC-A UC of 0.833 and test accuracy of 75.8%, and is selected as the production model. The modest train- test gap (0.80%) indicates minimal overfitting. This selection concludes the Best Model Selection step, producing the serialized production model passed to the in verse modeling stage. Pipeline 2: F eature Importance and SHAP Analysis. A dedicated analysis pipeline retrains RF and XGBoost with n estimator s =200 on the full 64-feature VRU subset to maximize tree diversity for stable Shapley estimates. This pipeline is entirely separate from model selection and does not affect the production model. Its outputs include T reeSHAP values, ablation A UC deltas, and permutation importance. The consensus feature-importance rankings feed the SHAP Analysis Interpr etability application (Section IV -G). E. In verse Safety Scor e F ormulation The central component of SafeDriv er-IQ is the in version of crash probability into a continuous safety score. Gi ven a trained binary classifier f and a feature vector x representing current driving conditions, the raw safety score is defined as: S raw ( x ) = P ( y = 0 | x ) × 100 (1) where P ( y = 0 | x ) is the posterior ”safe” class probability . This formulation has four desirable properties. 1) Bounded : S ∈ [0 , 100] by construction. 2) Monotonic : Higher scores correspond to conditions fur - ther from crash-producing scenarios. 3) Continuous : Unlike binary classification, the score cap- tures gradations of risk. 4) Interpretable : A score of 75 means the model estimates a 75% probability that current conditions do not match crash patterns. The Safe Driving Baseline , deriv ed from W aymo safe- driving episodes, contextualizes the score distribution by an- choring the upper range against real-world low-risk driving behavior . F . Domain-Knowledge Calibr ation Layer The trained model underweights certain risk factors. Specif- ically , road surface condition accounts for only 1.9% of total feature importance despite its well-documented impact on crash risk. This bias arises from the synthetic safe sample generation, which modifies features independently rather than capturing their true joint distribution. T o address this, the framew ork applies a multiplicati ve calibration layer: S cal ( x ) = S raw ( x ) × K Y k =1 α k ( x ) (2) where α k ( x ) ∈ (0 , 1] are condition-specific penalty factors deriv ed from domain knowledge. T able V lists the calibration penalties. T ABLE V D O MA I N - K N O WL E D GE C A L IB R A T I O N P E NA L T I E S Factor Condition α Penalty Source Road Surface Ice 0.60 − 40% [26] Snow 0.70 − 30% [26] W et 0.85 − 15% [27] W eather Snow 0.80 − 20% [28] Rain 0.90 − 10% [28] Fog/Other 0.85 − 15% [27] Lighting Dark (unlit) 0.75 − 25% [29] Dark (lit) 0.85 − 15% [29] Dawn/Dusk 0.92 − 8% [29] Speed V ery high 0.65 − 35% [30] High 0.75 − 25% [30] Moderate-high 0.88 − 12% [30] VR U Presence Present 0.88 − 12% [3] Night Dri ving 10PM–5AM 0.90 − 10% [29] Compound ≥ 2 adverse 0.95 − 5% empirical Compound penalty applies when ≥ 2 poor conditions co-occur . ”Empirical” denotes values calibrated against CRSS co-occurrence rates. The 40% penalty for icy roads ( α = 0 . 60 ) reflects FHW A findings that wet pa vement contributes to approximately 70% of weather-related crashes [26]. The multiplicative structure ensures compound adverse conditions (e.g., ice + darkness + high speed) produce appropriately sev ere score reductions. G. Real-T ime System The calibrated safety score feeds the Real-Time Calcula- tor , which accepts inputs from sensors, GPS, and weather APIs. It constructs the 64-feature driving context vector and produces a calibrated score in under 1 ms. The pipeline sup- ports configurable intervention thresholds suited to different deployment contexts, including AD AS, fleet management, and insurance telematics. The score is then mapped to a Risk Level Classification across five operational lev els. T able VI defines each lev el, its score range, and the actions triggered across deployment contexts. T ABLE VI S A FE T Y S C O R E L E VE L D EFI N I T IO N S A N D C O R RE S P O ND I N G A C T I O NS Level Scor e Action Critical 0–20 Emergency warning, immediate intervention High 21–40 ADAS alert; speed advisory issued Medium 41–60 Caution advisory , improvement suggestion Low 61–75 Monitoring, minor corrective feedback Excellent 76–100 Positiv e feedback, insurance discount eligible Score ranges derived from scenario analysis (T able X) and inter- vention thresholds (T able XIV). H. SHAP-Based Interpr etability T reeSHAP [31] is applied to the trained RF model to compute Shapley values for each feature. Unlike standard feature importance metrics, SHAP v alues quantify each fea- ture’ s marginal contribution to individual predictions. This supports both global ranking and local explanation. For a giv en prediction, the SHAP decomposition is: f ( x ) = ϕ 0 + M X j =1 ϕ j ( x ) (3) where ϕ 0 is the base value (mean prediction), M = 64 is the number of features, and ϕ j ( x ) is the SHAP v alue for feature j . In the SafeDriver -IQ context, a negati ve SHAP value pushes the prediction towar d crash conditions (lowering the safety score), enabling targeted recommendations. I V . E X P E R I M E N TAL R E S U L T S A. Pr ecision-Recall Analysis Fig. 2 presents the Precision-Recall (PR) curve for the crash class. The model attains an A verage Precision (AP) of 0.891, well abov e the 0.500 random baseline. The high AP confirms that the crash probability estimates are highly discriminati ve. Scenarios with elev ated crash probabilities closely correspond to observed crash patterns. At the default threshold of 0.5, the model achieves a precision = 0.941 and a recall = 0.480. Because SafeDriver -IQ outputs continuous probability esti- mates rather than binary classifications, the entire PR curve is relev ant. Fig. 2. Precision-Recall curve for the crash class (AP = 0.891). The operating point at the default 0.5 threshold yields precision = 0.941 and recall = 0.480. Fig. 3. Confusion matrix for the RF model on the test set (n = 9,278) for the binary crash classification task. B. Confusion Matrix Analysis Fig. 3 presents the confusion matrix for the Random Forest model on the held-out test set (9,278 samples, balanced 50/50). The model exhibits an asymmetric error pattern: • High safe-class r ecall (0.970). The model correctly identifies 97% of safe dri ving scenarios, producing very few false alarms (FP = 139). • High crash-class precision (0.941). When predicting a crash-like scenario, it is correct 94.1% of the time. • Moderate crash-class r ecall (0.480). The model misses approximately 52% of actual crash scenarios, classifying them as safe. • Crash-class F1-score (0.636). The score reflects the trade-off between high precision and moderate recall. This asymmetry is acceptable and even desirable for the in verse safety scoring application. The safety score is deri ved from P ( safe | x ) as a continuous v alue (Eq. 1). Hence, the model does not make hard binary decisions in production. This appropriately reflects elev ated risk without producing a false alarm. The domain-kno wledge calibration layer (Section III-F) further adjusts scores for conditions the model underweights. C. Risk Le vel Confusion Matrix Fig. 4. Risk le vel confusion matrix across 864 dri ving scenarios. Expected labels are from domain-expert assessment. Overall accuracy is 87.0%, with all misclassifications between adjacent risk levels only . Beyond binary crash/safe classification, the ev aluation ex- amines how accurately the framework assigns scenarios to the correct risk lev el (Excellent, Lo w , Medium, High, Crit- ical). A synthetic ev aluation grid of 864 driving scenarios is constructed by exhausti vely combining six ke y factors: time of day , weather, lighting, speed, road condition, and VR U presence. These scenarios are distinct from the 500 W aymo WOMD scenarios used for external v alidation (Section IV -O). The frame work achieves 87.0% ov erall accurac y . Ev- ery misclassification falls between adjacent lev els, e.g., Low ↔ Medium or High ↔ Critical. No scenario is misclassified by two or more lev els. This ordinal consistency matters. A High-risk scenario may be labeled Critical or Medium, but nev er Excellent. The weakest per-class result is High risk at 84.8%, where boundary scenarios near the Medium/High threshold introduces ambiguity . D. Crash F actor Analysis Fig. 5 shows primary contributing factors from the CRSS 2016-2023 subset (213,003 crashes). Rush hour is the most prev alent (75,100 crashes, 35.3%), follo wed by poor lighting (62,186, 29.2%), weekend dri ving (53,462, 25.1%), adverse weather (49,588, 23.3%), night driving (45,616, 21.4%), and VR U in volvement (18,605, 8.7%). VR U crashes rank last by count but carry disproportionate se verity , a pattern that directly motiv ates the VR U focus of SafeDri ver -IQ. Fig. 5. Primary contributing factors from CRSS (2016-2023, 213,003 crashes). Rush hour (35.3%) and poor lighting (29.2%) are most frequent, whereas VR U inv olvement (8.7%) exhibits disproportionate sev erity . E. Ablation Study: F eatur e Gr oup Contribution T o quantify each feature group’ s contribution, one group is remov ed at a time, and the model is retrained on the remaining features using Pipeline 2 ( n estimator s =200 ; Section III-D). T able VII reports the results. T ABLE VII A B LAT IO N S TU DY : F E A T U RE G RO U P C O N TR I B UT I O N Configuration F eatures ROC-A UC ∆ A UC Criticality Baseline (All) 64 0.833 — — − Lighting 60 0.770 − 7.6% Critical − En vironmental 58 0.779 − 6.5% High − T emporal 54 0.788 − 5.5% High − Interaction 61 0.810 − 2.8% Medium − Location 56 0.811 − 2.6% Medium − Crash/V ehicle 40 0.820 − 1.6% Lo w-Med − VR U-Specific 59 0.826 − 0.8% Low − Metadata 56 0.828 − 0.6% Lo w − Light. + Env . 54 0.697 − 16.4% Critical − Light. + T emp. 50 0.715 − 14.2% Critical ∆ A UC = percentage change from baseline. Finding 1: Lighting is the most critical feature group. Removing four lighting features (POOR LIGHTING, LGT COND, LGTCON IM, IS NIGHT) drops R OC-A UC by 7.6%, the largest single-group impact. This aligns with SHAP rankings, where lighting dominates (POOR LIGHTING: ϕ = 0 . 159 , IS NIGHT : ϕ = 0 . 072 , LGTCON IM: ϕ = 0 . 022 , LGT COND: ϕ = 0 . 020 ). Finding 2: En vironmental features rank second. Re- moving weather-related features reduce R OC-A UC by 6.5%, consistent with AD VERSE WEA THER ranking among the top SHAP features ( ϕ = 0 . 115 ). Finding 3: Risk factors compound non-linearly . Remov- ing lighting and en vironmental features together produces a 16.4% A UC drop, 2.3 percentage points beyond the additive expectation of 14.1%. Dark conditions combined with adverse weather create a risk be yond what either factor alone produces. Finding 4: VR U-specific features have minimal indepen- dent impact. Removing VR U features reduces R OC-A UC by only 0.8%. Since safe samples are deri ved from crash records, both classes include VRU presence information, which limits their discriminativ e power . This is a kno wn limitation dis- cussed in Section VI. F . Cross-V alidation Stability 5-fold cross-validation is run across three training iterations (15 folds total). T able VIII summarizes the results. T ABLE VIII C RO S S - V A L ID A T I ON S T A B I L IT Y A NA L Y S I S ( 1 5 F O L DS ) Metric Mean Std 95% CI CV(%) Accuracy 0.7570 0.0047 [0.755, 0.760] 0.61 R OC-A UC 0.8317 0.0011 [0.831, 0.833] 0.13 Iteration T est Acc ROC-A UC CV Mean T rain-T est Gap 1 ( rs = 42 ) 0.752 0.831 0.757 1.30% 2 ( rs = 84 ) 0.751 0.831 0.758 1.45% 3 ( rs = 126 ) 0.758 0.833 0.755 0.80% Mean 0.754 0.832 0.757 1.18% CV(%) = coefficient of variation. Iteration 3 selected as production model (highest test accuracy , lowest gap). The coefficient of variation across all 15 folds is 0.61%, well below the 1% threshold for excellent stability . Accuracy spans only 1.68% points (0.7496 to 0.7664), with a 95% confidence interval of [0.7545, 0.7595]. R OC-A UC is ev en more stable, v arying only 0.0022 across iterations (0.8308 to 0.8330). Performance is insensitive to the train-test partition, supporting the reliability of the reported metrics. G. SHAP F eature Importance Fig. 6 presents global SHAP feature importance for the top 15 features from Pipeline 2 ( n estimators =200 ; Section III-D). These values characterize which factors driv e risk predictions and should not be compared nu- merically to T able IV metrics, which are from Pipeline 1 ( n estimator s =100 ). Lighting and weather dominate the hierarchy . POOR LIGHTING ( ϕ =0 . 159 ) and AD VERSE WEA THER ( ϕ =0 . 115 ) are the two strongest predictors, with IS NIGHT ( ϕ =0 . 072 ) third. Compound visibility indicators (NIGHT AND D ARK: ϕ =0 . 023 , LGTCON IM: ϕ =0 . 022 , LGT COND: ϕ =0 . 020 ) reinforce lighting as the dominant risk domain. IS R USH HOUR ( ϕ =0 . 004 ) ranks low here because its ef fect is absorbed by correlated features (HOUR, IS NIGHT). A fi ve-factor distilled analysis (Fig. 7) across RF , XGBoost, Permutation Importance, and SHAP sho ws IS R USH HOUR ranking first in all four methods when correlated features are remov ed. Both results align with the ablation study and transportation safety literature on visibility as the primary structural VRU crash risk [18]. Fig. 6. T op 15 SHAP feature importance v alues (mean | ϕ j | , 1,000 predictions, 64-feature model). Lighting and weather features dominate the ranking. Fig. 7. Feature importance across four methods with consensus overlay ( ♦ ) for 4 aggregate risk factors. IS RUSH HOUR ranks first in all 4 methods. H. Safety Scor e Distribution Using the same 864-scenario factorial grid, the analysis checks whether the in verse formulation produces meaningful, well-spread safety scores. T able IX reports mean scores by condition and Fig. 8 shows the overall distribution. Scores span 8.34 to 92.17 ( σ =22 . 16 , IQR =38 . 76 ). All factor -level comparisons follow expected orderings. Daytime exceeds nighttime ( ∆=26 . 55 ), clear weather exceeds sno w ( ∆=18 . 57 ), and low speed exceeds high speed ( ∆=25 . 07 ). The 9.36-point gap between VR U-absent and VR U-present scenarios confirms that the calibration layer amplifies VR U T ABLE IX S A FE T Y S C O R E D I ST R I BU T I O N B Y D R I VI N G C O N DI T I O N ( n = 864 ) Factor Level Mean n T ime of Day Daytime / Night 68.42 / 41.87 432 / 216 W eather Clear / Snow 69.81 / 51.24 288 / 288 Lighting Daylight / Dark 72.53 / 43.67 216 / 216 Speed Low / High 71.24 / 46.17 216 / 216 VR U Absent / Present 63.41 / 54.05 432 / 432 Overall 58.73 864 Fig. 8. Safety score distribution across 864 driving scenarios ( µ =58 . 73 , ˜ x =61 . 42 , σ =22 . 16 , range: 8.34–92.17). risk be yond the model’ s nativ e sensitivity . The distribution is platykurtic (kurtosis = − 0 . 89 ) with slight left ske w ( − 0 . 28 ), indicating broad spread rather than concentration at extremes, a desirable property for a scoring system. I. Scenario Sensitivity Analysis T able X presents safety scores for representati ve end-to-end scenarios and isolated factor effects. The best-case scenario (highway , midday , clear , dry , no VR U, low speed) scores 92.17, and the worst-case (urban, 2 AM, snow , icy , VR U present, high speed) scores 8.34, a spread of 83.83 points. T ABLE X R E PR E S E NTA T I V E S C EN A RI O S AF E T Y S C O RE S Scenario Score Risk Highway , noon, clear, dry , no VR U, low speed 92.17 Excellent Urban, 6 PM, rain, wet, no VRU, moderate 61.23 Medium School zone, dusk, clear, dry , VRU present 54.87 Medium Urban, 10 PM, rain, wet, VRU present, mod-high 38.62 High Urban, 2 AM, snow , ic y , VR U present, high speed 8.34 Critical F actor Isolation (all else equal) Daylight → Dark (unlit) − 28 . 86 Clear → Snow − 18 . 57 Low speed → High speed − 25 . 07 No VR U → VRU present − 9 . 36 Dry road → Ice − 15 . 83 Factor isolation holds all other conditions constant. Daylight-to-unlit darkness produces the largest single-factor drop ( − 28 . 86 points), followed by lo w-to-high speed ( − 25 . 07 ) and clear -to-snow ( − 18 . 57 ). VR U presence adds a − 9 . 36 point penalty from the calibration layer . J. Sensitivity Analysis T able XI formalizes score sensitivity to single-factor tran- sitions, categorized by whether changes are driv en by the RF model, the calibration layer , or both. Effect sizes are expressed as | ∆ | /σ , where σ =22 . 16 . T ABLE XI S E NS I T I VI T Y A NA LY SI S : S C O R E R ES P O N SE T O S I NG L E - F A CT O R C H AN G E S Factor T ransition ∆ Score | ∆ | /σ High sensitivity (model-dominant) Lighting Daylight → Dark-unlit − 28 . 86 1.30 Speed Lo w → High − 25 . 07 1.13 T ime Daytime → Night − 26 . 55 1.20 Moderate sensitivity (model + calibration) W eather Clear → Snow − 18 . 57 0.84 Road surface Dry → Ice − 15 . 83 0.71 Low sensitivity (calibration-dominant) VR U presence Absent → Present − 9 . 36 0.42 Day of week W eekday → W eekend night − 6 . 12 0.28 ∆ Score = change from all-safe baseline. | ∆ | /σ = effect size relativ e to score std (22.16). Lighting, speed, and time-of-day all exceed 1.0 σ , confirm- ing them as dominant score driv ers, consistent with SHAP (Fig. 6) and ablation (T able VII). W eather and road surface produce moderate effects (0.71–0.84 σ ), with both the model and calibration layer contributing. VR U presence and day-of- week fall below 0.5 σ , driv en primarily by calibration penalties. This decomposition identifies which factors the model cap- tures nativ ely , versus which depend on the calibration layer , informing future improv ements. K. VR U Cr ash T rends Fig. 9 shows VR U crash trends from CRSS (2016-2023), disaggregated by pedestrian and c yclist in v olvement. Fig. 9. VRU crash trends in CRSS (2016–2023). Pedestrian crashes account for 82% of all VRU crashes and exhibit the steepest growth. T otal VRU crashes rose 29% from 2016 to 2022, with a CO VID-related dip in 2020. T otal VRU crashes rose 29% from 2016 to 2022, with pedestrian crashes accounting for 82% of that total. These trends validate the decision to filter CRSS specifically for VR U in volvement. Fig. 10 extends this view to all contributing factors across the full study period. Fig. 10. Historical crash patterns from CRSS (2016–2023). T op : total crashes rose steadily through 2019, surged in 2020 due to expanded CRSS sampling, then declined through 2023. Bottom : per-factor trends mirror the overall pattern. Rush hour is consistently the most prev alent factor . VRU inv olvement is the least frequent but most sev ere. L. Risk F actor Heatmap: P edestrian vs. Cyclist Fig. 11 shows mean safety scores by VRU type and lighting condition. Fig. 11. Mean safety scores by VR U type and lighting condition. Pedestrians score lower than cyclists across all conditions, with the gap widening in dark- unlit en vironments ( ∆=4 . 7 ). Pedestrians lack the speed and visibility aids av ailable to cy- clists, such as reflectors and lights. This explains the widening gap in dark-unlit environments and confirms the framework captures VRU-type-specific risk beyond the aggregate VR U penalty . M. Driver Behavior Classification KMeans clustering ( k =4 ) on composite aggression and risk-taking scores identifies four distinct crash-inv olved driver profiles (T able XII, Fig. 12). The largest cluster (29.6%) com- prises “Cautious but Crashed” driv ers with near-zero scores on both dimensions. This indicates external factors, such as weather and lighting, rather than their behavior , drov e their crashes. T wo En vironmental Risk-T aker clusters (22.5% and 24.7%) sho w ele vated risk-taking, particularly for night dri ving and adverse weather . The Aggressiv e Driver cluster (23.2%) shows high aggression during rush hour and at high speeds. The ”Cautious but Crashed” profile most closely resembles the W aymo safe-dri ving baseline, suggesting infrastructure and en vironmental interventions are most appropriate for this group. T ABLE XII D R IV E R B E H A V I O R C L A SS I FI C A T IO N V I A K M EA N S C L U ST E R I NG Cluster Aggression Risk-T aking Pct. Cautious b ut Crashed 0.00 0.00 29.6% En v . Risk-T aker (High) 0.07 2.19 22.5% En v . Risk-T aker (Mod.) 0.43 1.00 24.7% Aggressiv e Driv er 1.00 0.00 23.2% Normalized composite scores derived from CRSS features. KMeans ( k =4 ) on 213,003 crash records (2016–2023). The W aymo baseline provides a safe-driving reference. Fig. 12. Mean aggression and risk-taking scores per driver behavior cluster (KMeans, k =4 , 213,003 crash records). The Cautious cluster scores zero on both dimensions, pointing to en vironmental crash causation. Cluster sizes are in T able XII. N. Multi-F actor Risk P atterns 87% of crashes in volve two or more simultaneous risk factors, with certain combinations producing risk multipliers well beyond additive expectations (T able XIII). The most dan- gerous combination is VR U + Urban + Night (4.5 × baseline), followed by Night + Adverse W eather (3.8 × , 9,653 crashes) and High Speed + Poor Conditions (3.2 × ). This non-linear compounding is consistent with the synergistic penalty in the ablation study (Section IV -E) and validates the calibration layer’ s multiplicative structure (Eq. 2). Rush hour is the most frequent single factor (75,100 crashes, 35.3%), but carries only a 1.0 × multiplier , which reflects exposure rather than elev ated per -trip risk. VR U in v olvement accounts for just 8.7% of crashes yet carries a 3.2 × sev erity multiplier , underscoring the disproportionate consequences of VR U crashes. O. W aymo Scenario V alidation The model is separately validated on 500 real-world W aymo Open Motion Dataset scenarios (Section III-A), distinct from T ABLE XIII M U L T I - F AC T O R H I GH - R I SK C R AS H P ATT E R N S Factor Combination Risk Mult. Crashes Night + Adverse W eather 3.8 × 9,653 Urban + Rush Hour 2.5 × — VR U + Urban + Night 4.5 × — High Speed + Poor Conditions 3.2 × — Single-factor baselines Rush Hour 1.0 × 75,100 Poor Lighting 2.3 × 62,186 Adverse W eather 1.8 × 49,588 Night Dri ving 2.1 × 45,616 VR U In volvement 3.2 × (se v .) 18,605 Mult. = P ( crash | factors ) /P ( crash | baseline ) , where baseline is the marginal crash rate across 213,003 CRSS records (2016–2023). “—” indicates a count not isolated due to factor co-occurrence. the synthetic e valuation grid. Fig. 13 sho ws the mean predicted crash probability by scenario type. Since the model was not trained on W aymo data, this monotonic ordering confirms that CRSS-trained features generalize to real-world driving kinematics. Fig. 13. Mean crash probability across W aymo scenario types (500 scenarios). Safe episodes score 7.2%, near-misses 54.0%, and collisions 92.0%, confirm- ing discriminativ e ability on naturalistic driving data. P . Real-W orld Impact Simulation Intervention thresholds correspond directly to the risk levels defined in T able VI. T able XIV estimates the proportion of scenarios flagged at each threshold, with projected crash reduction under 50% driver compliance. At the most conservati ve setting (Critical-risk only , score ≤ 20 ), 4.9% of scenarios trigger an alert, with an estimated 3.8% crash reduction. A moderate ADAS setting (warning at score < 50 ) flags 36.1% of scenarios and projects a 22.7% reduction. The infrastructure rows connect ablation findings to policy . Lighting improvements in VR U corridors (7.6% A UC impact) and weather warning systems (6.5% A UC impact) represent the highest-leverage in vestments identified by the model. V . D I S C U S S I O N A. The In verse Modeling P aradigm In verting crash classifiers into continuous scores, rather than building new models, unlocks three practical advantages. T ABLE XIV R E AL - W OR L D I M PAC T S I MU L A T I O N : E S T IM ATE D C RA S H R E D U CT I O N Intervention Scenario Score ≤ Flagged Est. Reduction Fleet Management (conservative) Alert at Critical 20 4.9% 3.8% Alert at High 40 23.8% 14.2% ADAS Integration (moderate) W arning at < 50 50 36.1% 22.7% Speed advisory < 60 60 49.0% 31.4% Insurance T elematics (broad ) Premium tier at < 70 70 70.1% – Discount tier ≥ 80 80 21.1% – Infrastructure Planning Lighting improv ement – – − 7 . 6% A UC impact W eather warning zones – – − 6 . 5% AUC impact Flagged (%) = proportion of 864 scenarios triggering an intervention at the giv en threshold. Est. Reduction assumes 50% driv er compliance. Infrastructure impacts from the ablation study (T able VII). • Continuous feedback. Dri vers receiv e a score (e.g., 62/100) instead of a binary alert, enabling relative risk understanding. • Directional guidance. SHAP explanations identify which factors reduce safety , enabling targeted recommendations. • Threshold flexibility . Dif ferent applications set dif ferent alert thresholds on the same score. Insurance may flag at 60, fleet management at 40. The strong alignment between SHAP importance and ablation-based contribution ( r =0 . 94 ) v alidates that inv erse scores reflect genuine model reliance rather than interpretabil- ity artifacts. Lighting and weather dominate both rankings: POOR LIGHTING ( ϕ =0 . 159 ) and AD VERSE WEA THER ( ϕ =0 . 115 ) in SHAP , and 7.6% and 6.5% A UC reduction in ablation. B. Practical Deployment SafeDriv er-IQ is designed for real-time operation. The Ran- dom Forest (RF) model runs inference in under 1 ms per sample. The 64-feature input vector is constructed from com- monly a vailable sources, including the system clock, weather API, GPS, OBD-II, and camera-based VR U detection. The framew ork is a five-module agentic system (Section III-G) cov ering perception, decision, intervention, and online learn- ing. It integrates into AD AS and fleet dashboards without specialized hardware. A Streamlit dashboard demonstrates the end-to-end pipeline for fleet operators, for real-time scoring, batch analysis, and safety improv ement simulation. Safe training samples are synthesized from crash records rather than observed directly . So, the model inherits systematic bias for road-surface and speed features (Section VI). The calibration layer (T able V) compensates through transparent, literature-grounded penalties that are independently auditable, a critical property for safety-critical deployment. C. F r om Prediction to Pr evention Most crashes inv olve co-occurring factors with non-linear compounding (Section IV). A large share of crash-inv olved driv ers exhibit low-aggression profiles. This points to ward infrastructure interventions such as street lighting and weather warnings, rather than behavioral coaching alone. T ime- adaptiv e thresholds tied to rush-hour and lo w-visibility condi- tions could yield disproportionate safety gains. SafeDriv er-IQ provides the analytical foundation for these interv entions. V I . L I M I T AT I O N S 1. Synthetic Safe Sample Bias. Safe samples are deri ved from CRSS crash records with modified en vironmental fea- tures. The y preserve crash-era correlations and may not fully represent true safe-driving conditions. This manifests in two ways. • P artial validation . The W aymo integration (Sec- tion III-A) provides only 500 scenarios from a single WOMD shard for safe-sample v alidation. The confusion matrix (Fig. 3) shows that 2,412 crash scenarios were misclassified as safe, resulting in moderate crash recall (0.48). Scaling to the full WOMD corpus (1,000+ shards) would enable direct replacement of synthetic samples. • Limited VRU discriminability . VR U-specific features contribute only 0.8% to model performance because both crash and safe samples in volve VRU interactions. The calibration layer partially compensates with a 12% VRU penalty , but integrating pedestrian density estimates from urban mobility data could provide the missing discrimi- nativ e signal. 2. No Real-Time Driver Beha vior . The current model assesses en vironmental context (weather , lighting, road con- ditions) but not the driving behavior . Speed limit violations, aggressiv e braking, and lane drift are not considered. T wo driv ers in identical conditions recei ve identical scores regard- less of beha vior . Fusing li ve telemetry (OBD-II, GPS-deriv ed speed, accelerometer data) with the environmental model is the critical next step for personalized safety scoring. 3. Static Feature V ector . Each prediction is treated inde- pendently , with no temporal conte xt from the dri ving session. A sequence-a ware model that considers condition trajectories, such as deteriorating weather , approaching a school zone, or fatigue during a long drive, could provide earlier warnings and finer-grained scoring. Recurrent or transformer architectures could capture these dependencies. The SHRP2 naturalistic driving study [24], [25] provides longitudinal data to support this extension. 4. Calibration Layer Subjectivity . The penalty values in the calibration layer (e.g., 40% for ice, 25% for darkness) are grounded in safety literature b ut inv olve expert judgment. Optimal penalties may vary by geography , vehicle type, or season. A data-driv en approach using Platt scaling [32] with fleet outcome data would reduce this subjectivity and enable adaptation to local conditions. V I I . C O N C L U S I O N A N D F U T U R E W O R K Road crashes continue to be a leading cause of preventable fatalities. Most prediction systems provide only binary out- puts that lack actionable guidance for driv ers. SafeDriver - IQ directly addresses this limitation by inv erting a trained crash classifier into a continuous 0 to 100 safety score. The frame work provides real-time, interpretable risk feedback informed by eight years of national crash data and real- world autonomous vehicle trajectories. The primary finding demonstrates that en vironmental context and multi-f actor com- pounding dominate crash risk far more than driver aggression alone, with certain factor combinations reaching 4.5 × baseline risk. This shifts the intervention priority to ward infrastructure, street lighting, weather warnings, and VR U-aware corridor design, alongside behavioral coaching. Future research will e xpand W aymo integration to thousands of scenarios, fuse liv e telemetry to enable real-time behavioral scoring, and conduct field validation with fleet operators. A prototype online learner with prioritized experience replay en- ables incremental risk-weight updates without full retraining. More broadly , SafeDriver -IQ establishes a reusable paradigm. Any domain-specific binary risk classifier can be in verted into a proacti ve, explainable safety scoring system using the same pipeline, without building new models from scratch. Grounded in real crash evidence and v alidated across div erse driving conditions, SafeDriv er-IQ is a practical tool for ADAS, fleet risk management, and infrastructure planning. The aim is to move road safety from reactiv e incident counting to real-time prev ention. R E F E R E N C E S [1] W orld Health Organization, “Global status report on road safety 2023, ” WHO, Genev a, T ech. Rep., 2023. [Online]. A vailable: https://www .who.int/publications/i/item/9789240086517 [2] National Highw ay T raffic Safety Administration, “Traf fic safety facts 2023: A compilation of motor vehicle crash data, ” NHTSA, W ashington, DC, T ech. Rep. DO T HS 813 548, 2024. [Online]. A vailable: https://crashstats.nhtsa.dot.gov/ [3] ——, “Traf fic safety facts 2023 data: Pedestrians, ” NHTSA, National Center for Statistics and Analysis, W ashington, DC, T ech. Rep. DO T HS 813 727, 2024. [Online]. A vailable: https://crashstats.nhtsa.dot.gov/ Api/Public/V iewPublication/813727 [4] C. W ang, C. Xu, J. Xia, and Z. Qian, “ A revie w of real-time crash pre- diction models: State-of-the-art, emerging trends, and future directions, ” Accident Analysis & Prevention , vol. 154, p. 106083, 2021. [5] National Highway T raffic Safety Administration, “Crash report sampling system (CRSS) analytical user’s manual, 2016–2023, ” NHTSA, W ashington, DC, T ech. Rep., 2024. [Online]. A vailable: https: //www .nhtsa.gov/crash- data- systems/crash- report- sampling- system [6] S. Ettinger, S. Cheng, B. Caine, C. Liu, H. Zhao, S. Pradhan, Y . Chai, B. Sapp, C. R. Qi, Y . Zhou, Z. Y ang, A. Chouard, P . Sun, J. Ngiam, V . V asudevan, A. McCauley , J. Shlens, and D. Anguelo v , “Lar ge scale interactiv e motion forecasting for autonomous driving: The W aymo open motion dataset, ” in Proc. IEEE/CVF Int. Conf. Computer V ision (ICCV) , 2021, pp. 9710–9719. [7] F . L. Mannering and C. R. Bhat, “ Analytic methods in accident research: Methodological frontier and future directions, ” Analytic Methods in Accident Resear ch , vol. 1, pp. 1–22, 2014. [8] S. Husnjak, D. Perakovic, I. Forenbacher, and M. Mumdziev , “T elemat- ics system in usage based motor insurance, ” Pr ocedia Engineering , vol. 100, pp. 816–825, 2015. [9] J. Paefgen, T . Staake, and F . Thiesse, “Multiv ariate exposure modeling of accident risk: Insights from pay-as-you-drive insurance data, ” T rans- portation Resear ch P art A , vol. 61, pp. 27–40, 2014. [10] M. A yuso, M. Guillen, and A. M. P ´ erez-Mar ´ ın, “T elematics and gender discrimination: Some usage-based e vidence on whether men’ s risk of accidents differs from women’ s, ” Risks , vol. 4, no. 2, p. 10, 2016. [11] J. Sun and J. Sun, “ A dynamic Bayesian network model for real-time crash prediction using traf fic speed conditions data, ” T ransportation Resear ch Recor d , vol. 1950, pp. 68–77, 2006. [12] K. Zhang, M. W ang, and B. W ei, “Deep learning-based driver safety scoring using telematics data, ” IEEE T rans. Intelligent T ransportation Systems , vol. 23, no. 8, pp. 12 345–12 356, 2022. [13] A. B. Parsa, A. Mov ahedi, H. T aghipour , S. Derrible, and A. K. Mohammadian, “T o ward safer highways, application of XGBoost and SHAP for real-time accident detection and feature analysis, ” Accident Analysis & Prevention , vol. 136, p. 105405, 2020. [14] L.-Y . Chang and H.-W . W ang, “ Analysis of traffic injury severity: An application of non-parametric classification tree techniques, ” Accident Analysis & Prevention , vol. 38, no. 5, pp. 1019–1027, 2006. [15] T . Chen and C. Guestrin, “XGBoost: A scalable tree boosting system, ” in Proc. 22nd ACM SIGKDD Int. Conf. Knowledge Discovery and Data Mining , 2016, pp. 785–794. [16] L. Breiman, “Random forests, ” Machine Learning , vol. 45, no. 1, pp. 5–32, 2001. [17] Z. Y uan, X. Zhou, and T . Y ang, “Hetero-Con vLSTM: A deep learning approach to traf fic accident prediction on heterogeneous spatio-temporal data, ” in Proc. 24th ACM SIGKDD , 2018, pp. 984–992. [18] C. V . Zegeer , R. Stewart, H. Huang, and P . Lagerwey , “Safety effects of marked versus unmarked crosswalks at uncontrolled locations: Final report and recommended guidelines, ” FHW A, T ech. Rep. HR T -04- 100, 2005. [Online]. A vailable: https://www .fhwa.dot.go v/publications/ research/safety/04100/ [19] P . Chen and J. Zhou, “Effects of the b uilt environment on automobile- in volved pedestrian crash frequency and risk, ” Journal of T ransport & Health , vol. 3, no. 4, pp. 448–456, 2016. [20] H. Razali, A. F . M. Hani, and R. Kamil, “Pedestrian detection in autonomous vehicles: A review , ” IEEE Access , vol. 9, pp. 130 536– 130 555, 2021. [21] P . Sew alkar and J. Seitz, “V ehicle-to-pedestrian communication for vulnerable road users: Surve y , design considerations, and challenges, ” Sensors , vol. 19, no. 2, p. 358, 2019. [22] S. M. Lundberg and S.-I. Lee, “ A unified approach to interpreting model predictions, ” in Advances in Neural Information Processing Systems 30 , 2017, pp. 4765–4774. [Online]. A vailable: https://proceedings.neurips.cc/paper/2017/hash/ 8a20a8621978632d76c43dfd28b67767- Abstract.html [23] Y . Li, Z. Li, and L. Li, “Interpretable machine learning approach for mul- tiv ariate traffic crash prediction, ” IEEE Tr ans. Intelligent Tr ansportation Systems , vol. 23, no. 10, pp. 18 888–18 898, 2022. [24] T ransportation Research Board, “The 2nd strategic highway research program naturalistic driving study dataset, ” SHRP2, T ech. Rep., 2015. [Online]. A vailable: https://www .trb .org/ StrategicHighwayResearchProgram2SHRP2/Blank2.aspx [25] F . Guo, S. G. Klauer , Y . Fang, J. M. Hankey , J. F . Antin, M. A. Perez, S. E. Lee, and T . A. Dingus, “The ef fects of age on crash and near- crash risk: Results from the SHRP2 naturalistic driving study , ” Journal of Safety Research , vol. 72, pp. 1–8, 2020. [26] Federal Highway Administration, “Pa vement surface condition and safety , ” FHW A Turner -Fairbank Highway Research Center, T ech. Rep., 2014. [Online]. A vailable: https://highways.dot.gov/safety/other/ pav ement- friction [27] ——, “How do weather ev ents impact roads?” FHW A Road W eather Management Program, 2023. [Online]. A vailable: https: //ops.fhwa.dot.gov/weather/q1 roadimpact.htm [28] J. Andrey , B. Mills, M. Leahy , and J. Suggett, “W eather as a chronic hazard for road transportation in Canadian cities, ” Natural Hazards , vol. 28, no. 2, pp. 319–343, 2003. [29] Federal Highway Administration, “Informational report on lighting design for midblock crosswalks, ” FHW A, T ech. Rep. HR T -04- 097, 2008. [Online]. A vailable: https://www .fhwa.dot.go v/publications/ research/safety/04097/ [30] Insurance Institute for Highway Safety, “Speed: General information, ” IIHS–HLDI, T ech. Rep., 2023. [Online]. A vailable: https://www .iihs. org/topics/speed [31] S. M. Lundberg, G. Erion, H. Chen, A. DeGrave, J. M. Prutkin, B. Nair, R. Katz, J. Himmelfarb, N. Bansal, and S.-I. Lee, “From local explanations to global understanding with explainable AI for trees, ” Natur e Machine Intelligence , vol. 2, pp. 56–67, 2020. [32] J. Platt, “Probabilistic outputs for support vector machines and comparisons to regularized likelihood methods, ” in Advances in Large Mar gin Classifiers . MIT Press, 1999, pp. 61–74. [Online]. A vailable: https://www .researchgate.net/publication/2594015
Original Paper
Loading high-quality paper...
Comments & Academic Discussion
Loading comments...
Leave a Comment