Gated Graph Attention Networks for Predicting Duration of Large Scale Power Outages Induced by Natural Disasters
The occurrence of large-scale power outages induced by natural disasters has been on the rise in a changing climate. Such power outages often last extended durations, causing substantial financial losses and socioeconomic impacts to customers. Accura…
Authors: Chenghao Duan, Chuanyi Ji, Anwar Walid
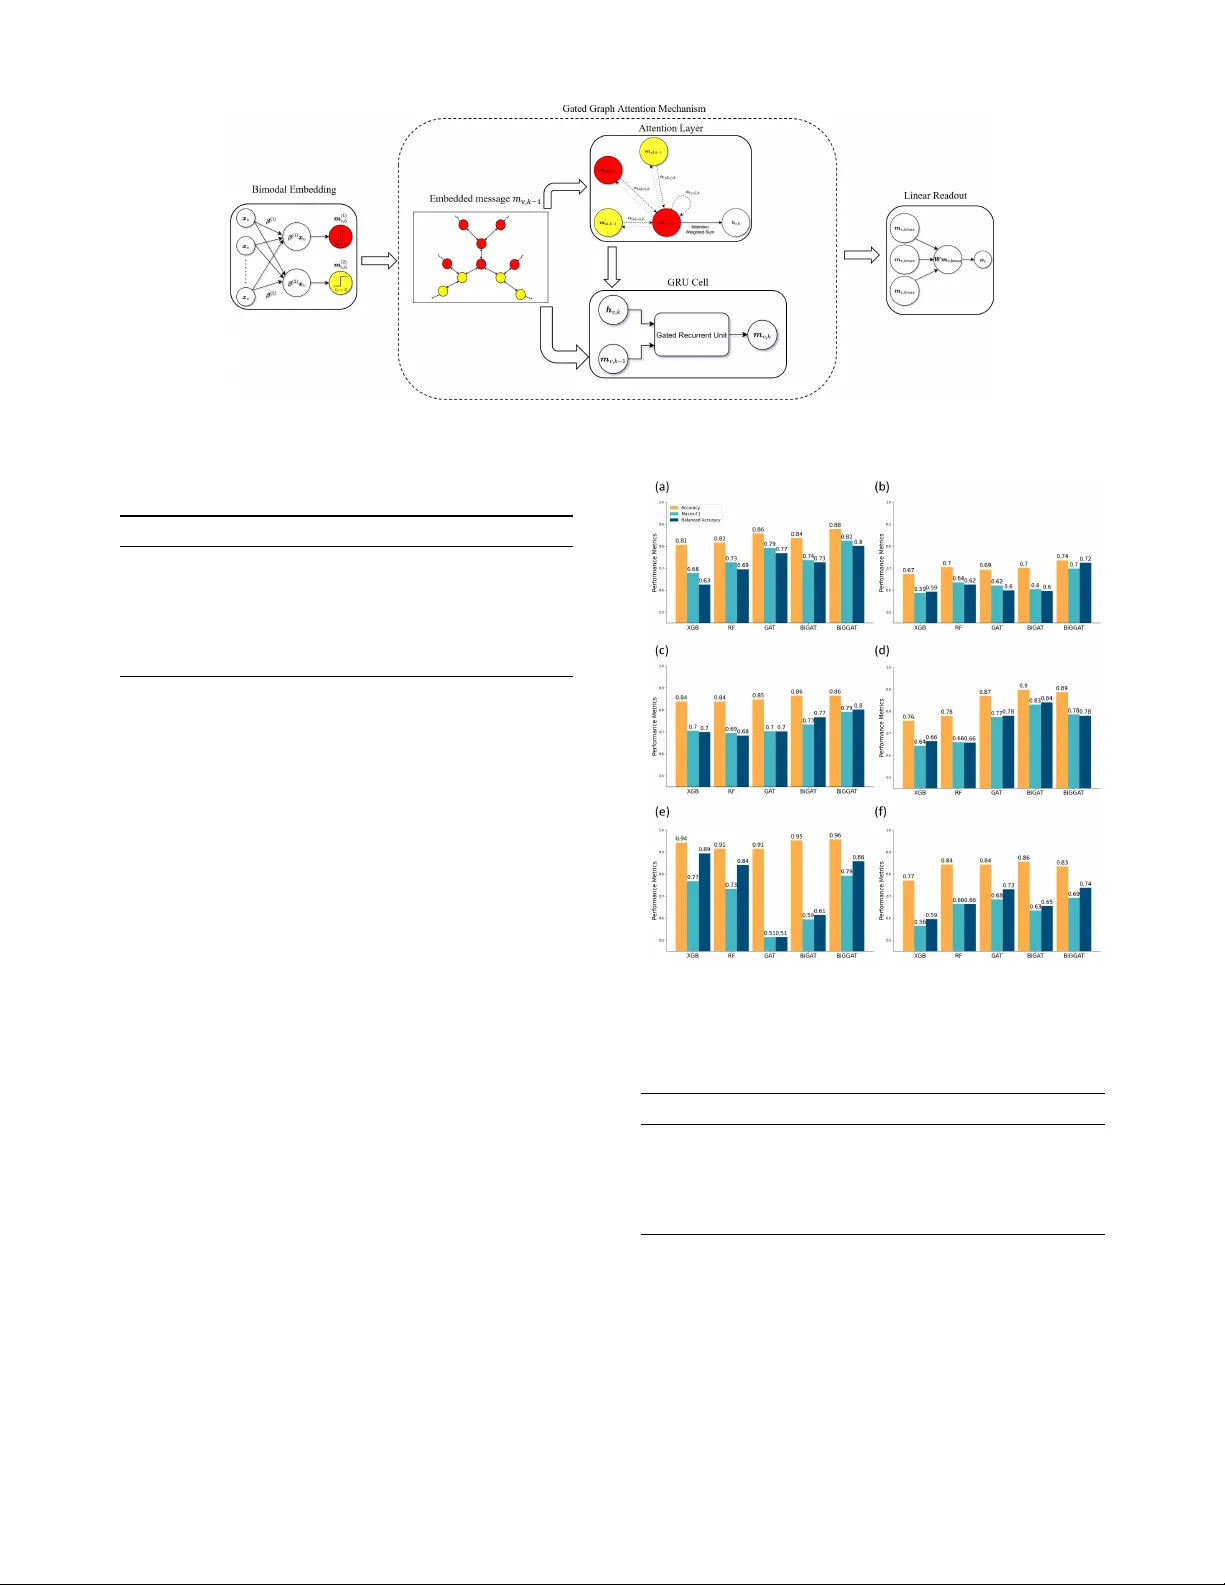
Gated Graph Attention Networks for Predicting Duration of Lar ge Scale Po wer Outages Induced by Natural Disasters Chenghao Duan ∗ , Chuanyi Ji ∗ , Anwar W alid † , Scott Ganz ‡ ∗ School of Electrical and Computer Engineering, Georgia Institute of T echnology , Atlanta, GA, USA Email: cduan8@gatech.edu, jichuanyi@gatech.edu † Department of Electrical Engineering, Columbia Univ ersity , Ne w Y ork, NY , USA Email: aie13@columbia.edu ‡ School of Business, Univ ersity of California, Riv erside, Riv erside, CA, USA Email: scott.ganz@ucr .edu Abstract —The occurrence of large-scale power outages induced by natural disasters has been on the rise in a changing climate. Such power outages often last extended durations, causing sub- stantial financial losses and socioeconomic impacts to customers. Accurate estimation of outage duration is thus critical f or enhanc- ing the resilience of energy infrastructure under sever e weather . W e formulate such a task as a machine learning (ML) problem with focus on unique real-world challenges: high-order spatial dependency in the data, a moderate number of large-scale outage events, heter ogeneous types of such events, and different impacts in a region within each event. T o address these challenges, we develop a Bimodal Gated Graph Attention Network (BiGGA T), a graph-based neural network model, that integrates a Graph Attention Network (GA T) with a Gated Recurrent Unit (GR U) to capture the complex spatial characteristics. W e evaluate the approach in a setting of inductive learning, using large-scale power outage data fr om six major hurricanes in the Southeaster n United States. Experimental results demonstrate that BiGGA T achieves a superior perf ormance compared to benchmark models. Index T erms —Extreme Climate, Graph Neural Network, Gated Recurrent Unit, Machine learning, Po wer outage, Re- silience I . I N T RO D U C T I O N Natural disasters such as hurricanes, winter storms, wild- fires, and flooding hav e become more frequent and intense in a changing climate [1], [2]. Energy infrastructure is particularly vulnerable, as sev ere weather e vents have induced widespread power outages in the US and worldwide [3], [4]. Enhancing the resilience for the energy infrastructure has been advocated by both research communities and industry , where a pertinent aspect of resilience is to reduce interruption duration from power outages [5]. In this conte xt, accurately predicting outage duration is important for emergency preparation and response, resource allocation, and infrastructure planning [6], [7]. © 2026 IEEE. Personal use of this material is permitted. Permission from IEEE must be obtained for all other uses, in any current or future media, including reprinting/republishing this material for advertising or promotional purposes, creating ne w collectiv e works, for resale or redistribution to servers or lists, or reuse of any copyrighted component of this work in other works. Accepted for publication in: Proceedings of the 2026 IEEE PES General Meeting, 18 – 21 January 2026, Montr ´ eal, Canada W e vie w outage duration prediction as a machine learn- ing (ML) problem: giv en large-scale po wer outages induced by prior natural disasters, learn a mapping between outage durations and feature variables on weather , outages, geo- spatial and demographic characteristics. Importantly , we aim to ev aluate how accurately the mapping can predict power outage durations from an impending weather ev ent. This task presents three real-world challenges: (a) Spatial dependency: Sev ere weather induced outage durations and feature variables at one location are correlated with those in neighboring and possibly distant areas [8]. (b) Spatial heterogeneity: W eather sev erity and outages vary spatially , with durations ranging from days near the storm track to hours at locations farther away [7], [9]. (c) Moderate data: Historical data on sev ere weather-induced outage ev ents is either rare or not publicly av ailable. The data scarcity makes it challenging to train a model that generalizes to new ev ents in different locations. The objective of this work is to study these challenges to (1) Develop a graph neural network as the mapping, through a novel combination of Graph Attention Network (GA T) [10] with Gated Recurrent Unit (GR U) [11], [12], which captures spatial heterogeneity and dependency in large-scale po wer outages. (2) Evaluate the model’ s ability to generalize to unseen e vents in a setting of inductiv e learning using field data. A. Related work Statistical machine learning approaches on power out- ages: Prior work on predicting se vere weather-induced outage durations has focused on statistical and machine learning methods. T ree-based models achie ve state-of-the-art perfor - mance for outage duration estimation [13]–[15]. Neural net- works [16] are also used for the problem. These approaches, howe ver , do not model spatial characteristics explicitly , and thus require large datasets on historical power outages [15]. When the data are limited, the studies are often restricted to small spatial scopes [13]. Spatial statistics hav e been applied to outage duration prediction [6], [8]. These methods, Fig. 1. Spatial heterogeneity and dependency of power outages from six hurricanes: (a) Florence, (b) Irma, (c) Laura, (d) Michael, (e) Sally , (f) Zeta. Dark lines: wind boundaries (64, 50, and 34 knots). Clusters on regions with different impacts: Red - significantly impacted counties; Y ellow - less impacted counties. Clustered by wind and outage duration. howe ver , generally assume homogeneous spatial correlation across locations [17], and thus are unable to characterize spatial heterogeneity in weather-induced power outages. Graph neural networks and the power grid: Graph based models have been applied to po wer grid analysis but little to weather-induced large-scale outages using real data. In particular , most prior works focus on power flow prediction, load forecasting, and outage/attack detection [18], [19]. The prior works often rely on synthetic datasets. Field data ha ve mainly been used for outage detection rather than duration prediction [20]. Overall, the research challenges described in the introduc- tion are open and unique for learning from real-world natural disaster-induced large-scale po wer outage using field data. I I . M E T H O D W e now describe the de velopment of BiGGA T model. W e first present variables and datasets, then problem formulation, algorithm design, and experiment setting. A. V ariables W e select the outage duration as the output v ariable Y of BiGGA T model. Here the outage duration Y characterizes the impact of sev ere weather-induced large-scale power failures. The feature v ariables X include (a) hurricane wind swath as an exogenous cause of power outages, (b) the maximum number of affected customers at given locations, (c) geo- spatial and demographic characteristics of af fected regions including spatial adjacency , population density and area, and (d) socioeconomic vulnerability of affected communities. B. F ield data The power outage data we obtain are from the top six major Atlantic hurricanes that made landfall between 2017 and 2021 in the Southeastern United States (Fig. 1) [6]. These ev ents caused outages across 557 counties and affected 15 mil- lion customers. County-level, time-varying outage data from PowerOutage.com [21] provides the number of customers without service. Outage duration of an affected county is defined as the time from the maximum number of disrupted customers to when this number falls below 5% of customers served. W eather variables are sourced from the National Hurricane Center’ s best-track data [22], specifying hurricane wind sw aths at each af fected location. Maximum sustained wind speeds are sorted into three categories (34-49 knots, 50-63 knots, and 64+ knots). Population, area, and spatial adjacency are obtained from the US Census Bureau [23]. Socioeconomic vulnerability is characterized by the CDC/A TSDR Social V ulnerability Index (SVI) [24], which is widely used in prior works [6]. In practice, outage impact is ev aluated by duration le vels rather than precise length, e.g., whether outages are short (lasted for hours) or prolonged (for days) [25]. Thus, we label outage durations to three classes, following Department of Energy (DOE)’ s restoration guidelines [26]: short ( < 2 days), medium (2–6 days), and long ( > 6 days). Outage labels correspond to our model output Y . The labeled dataset is summarized in T able I. T ABLE I D AT A S U M M ARY : N U M BE R O F C O U NT I E S F O R T H RE E C L A S SE S O F O U T A GE D U RAT IO N S E V E N TS S H O RT M E D I UM L O N G F L O R EN C E 68 21 9 I R M A 158 127 29 L AU R A 76 18 17 M I C H AE L 127 31 18 S A L L Y 62 7 1 Z E T A 179 44 12 C. Pr oblem formulation W e formulate the problem as node-level classification using the graph neural network, that is, learning a mapping from input features X to outage-duration labels Y via a graph struc- ture. W e make the follo wing assumptions for our formulation: 1) Spatial dependency is considered up to n th order geo- spatial neighbors with n = 1 for the nearest and n > 1 for farther neighbors. 2) Spatial dependency is modeled within each ev ent. Cross- ev ent dependencies are not considered in this work. 3) County-level variables are used due to data availability . W e let G = { V , E , A } represent the graph structure of the outage data, where V is a set of affected counties (nodes). E consists of neighboring county pairs (edges). A is a symmetric adjacency matrix, with A ij = 1 if nodes i and j are neighbors, 0 otherwise. For each node v ∈ V in the data, x v ∈ R 11 represents an input feature vector , including the maximum number of affected customers, county population, county area, four v ariables for social vulnerability and four for hurricane wind swaths. X = { x v } for all v ∈ V represents the set of all node features. y v ∈ R 3 denotes the node-lev el 3-class duration labels (short, medium and long), as defined in Field Data. The problem is formalized as a graph learning task, i.e., to obtain a GNN model M that predicts class labels of outage duration Y using node features X and graph structure G , Y = M ( X , G ) . D. Bimodal gated graph attention network W e dev elop a GNN with tw o ke y components: (a) a Bimodal Embedding and (b) a Gated Graph Attention mechanism. The Bimodal Embedding is established to capture heterogeneity through unsupervised learning. The Gated Graph Attention mechanism provides a nov el integration of self-attention [10] with GR U [11], [12] for message propagation. 1) Bimodal graph node embedding: For each node v ∈ V , Bimodal Embedding maps the input x v to a message, m v ,k for k = 0 , where k is the number of recurrent iterations for the Gated Graph Attention layer . Through unsupervised learning (K-means algorithm), the data on wind swath and duration labels form two spatial clusters as illustrated by Fig. 1. The distinct clusters characterize the heterogeneous impact of a weather ev ent. The embedding structure is determined accordingly by the number of clusters. For instance, the two clusters for this case result in two distinct sets of learnable weights, β ( l v ) ( l v ∈ { 1 , 2 } ). This results in a simple linear embedding, where for a giv en node v ∈ V , the embedded message m v , 0 is m v , 0 = β ( l v ) x v , where m v , 0 is a three-dimensional vector representing the initial message at iteration k = 0 . The number of clusters can vary to represent the complexity of the model and spatial heterogeneity . 2) Gated graph attention mechanism: Gated Graph At- tention mechanism combines a GR U with self-attention. In particular , after the Bimodal Embedding layer, each node’ s initial message m v , 0 is aggreg ated via the attention layer into an intermediate embedding h v , 1 of the same dimension as m v , 0 . The attention layer characterizes the spatial dependency weights. A GR U cell then propagates messages to higher-order neighbors with memory: at each iteration k ∈ [1 , k max ] , the GR U updates m v ,k from the intermediate embedding h v ,k and the pre vious message m v ,k − 1 . Here k max is a hyperparameter of design. The basic message propagation step is: h v ,k = Attn ( m v ,k − 1 , N v ) , m v ,k = GRU ( m v ,k − 1 , h v ,k ) , where Attn refers to the self-attention based graph message aggregation [10] among the neighbors N v , and GRU refers to the Gated Recurrent Unit [11], [12]. The embedded message m v ,k is fed into the Gated Graph Attention mechanism for multiple iterations to propagate the influence of each node to its higher-order neighbors. After a giv en number k max of iterations, the output message will be passed to a linear readout layer to translate into output labels o v at each node. Fig. 2 illustrates the ov erall structure of the BiGGA T model. The overall pipeline of the BiGGA T can be summarized as in Algorithm 1 Algorithm 1 Overall BiGGA T pipeline 1. Curate graph-structured outage data using geo-spatial statistics. 2. Use K-means to determine the structure of the Bimodal Embedding layer . 3. Embed node message m v , 0 using the Bimodal Embedding layer . 4. Use the self-attention mechanism to update the hidden embedding h v ,k . 5. Feed both the previous embedded message m v ,k − 1 and the current hidden embedding h v ,k into GRU for the current embedded message m v ,k . 6. Repeat step 4 and 5 for k ∈ [1 , k max ] . 7. Feed the embedded message from step 6 to a linear read out layer for prediction o v . Evaluate the loss and accuracy . E. Experiment setting W e adopt the setting of inductiv e learning to apply BiGGA T to real-world scenarios. W e further specify the experiment designs and describe three metrics for performance ev aluation. 1) Inductive learning: The setting of inductive learning is desirable for real-world implementation where a model is trained on historical events and then predicts the outage durations of an unseen e vent. T o implement such a setting, we hold out one event as the testing set and use the other five ev ents to train BiGGA T . For test samples, the cluster labels l v are inferred using input features. One key design for the model is the graph structure of the data - characterized by the neighborhood N v of each node. T o capture suf ficient spatial dependency , we define N v to include all counties up to the highest spatial order of significant correlation. Meanwhile, for simplicity , we defi ne N v to include neighbors up to the same spatial order n for all nodes within a given event. The actual value of n is obtained from data: we measure the spatial correlation of the feature variable, peak outages, using the global Moran’ s I [27]. The Moran’ s I, a widely-used spatial statistic, measures the weighted cov ariance of the v ariables among the immediate geo-spatial neighbors. W e extend the measure to farther spatial neighbors by adapting the spatial weight matrix A in the Moran’ s I calculation with an n-hop neighbor adjacency matrix A ( n ) spatial : A ( n ) spatial = I { A n spatial > 0 } − I { A n − 1 spatial > 0 } Where A spatial denotes the spatial adjacency matrix of affected counties and I denotes an indicator function. Thus, A ( n ) spatial is nonzero only at entries where two giv en loca- tions are exactly n th order neighbor to each other without Fig. 2. Overall BiGGA T structure: Node features are fed into the Bimodal Embedding, then passed through the Gated Graph Attention mechanism. The aggregated messages are transformed to outputs by a Linear Readout layer . T ABLE II G L OB A L N - H O P M O R A N ’ S I O F P E AK O U T A GE N U MB E R E V E N TS H I G H ES T N G L OB A L N - H O P M O R A N ’ S I F L O R EN C E 3 0 . 273 ∗ (6 . 806) I R M A 6 0 . 070 ∗ (4 . 723) L AU R A 5 0 . 112 ∗ (3 . 499) M I C H AE L 3 0 . 053 ∗ (1 . 998) S A L L Y 2 0 . 110 ∗ (1 . 864) Z E T A 4 0 . 154 ∗ (6 . 049) ∗ denotes r ejection of null hypothesis with p ≤ 0 . 1 . V alues in brac kets ar e z-scor es. redundancy . Such an n-hop Moran’ s I ef fectively captures the correlation among the n-hop spatial neighbors. The n-hop Moran’ s I (T able II) shows significant positive spatial correlation for at least the second-order geo-spatial neighbors. Therefore, we select the highest significant n-hop number to define the size of neighborhood N v . In addition, we choose the max recurrence iteration number kmax to be 2 . Thus, with control from GR U, the messages are not only aggregated within neighborhood N v but also propagated to farther neighbors beyond N v . This design ensures that our model can fully capture the high-order spatial correlations present in each ev ent. Our model is trained for node-lev el multi-class classifica- tion. Three metrics are used to benchmark the performances: (1) Classification Accuracy , (2) Macro F1 Score, and (3) Balanced Accuracy . W e use the cross-entropy loss and AD AM optimizer for training, which are implemented using Pytorch, PyGeometrics, and Sklearn packages via Google Colab . I I I . R E S U LT S A. Inductive learning model performance The BiGGA T and benchmark models, including XGBoost (XGB), Rnadom Forest (RF), GA T , and BiGA T , are trained on fiv e events and tested on the remaining unseen event. These experiments are repeated six times, with each ev ent serving as the test set once. For each model, the corresponding hyperparameters are iteratively tuned to the corresponding optimal performances. Fig. 3. Model performance comparison for (a) Florence, (b) Irma, (c) Laura, (d) Michael, (e) Sally , and (f) Zeta. Each subplot sho ws classification accuracy , Macro F1, and balanced accuracy for XGB, RF , GA T , BiGA T , and BiGGA T . T ABLE III E V EN T A V E R AG E P E RF O R M AN C E O F M O D E LS M O D E LS A C C U R AC Y B A LA N C E D A C C M AC RO F 1 X G B 79 . 7% 67 . 8% 0 . 657 R F 81 . 5% 69 . 4% 0 . 682 G A T 83 . 7% 68 . 1% 0 . 678 B I G A T 85 . 1% 70% 0 . 686 B I G G A T 85 . 9% 78 . 3% 0 . 762 Event-wise comparison and averaged metrics are shown in Fig. 3 and T able III respectively . BiGGA T consistently outperforms the tree-based models (XGB and RF), indicating that graph-based models better capture spatial dependencies in the outage data. Among graph-based models, BiGGA T and BiGA T outperforms GA T in fi ve e vents, underscoring the value of modeling spatial heterogeneity via Bimodal Embedding. Compared with BiGA T , which uses only nearest neighbors and without GRU, BiGGA T achie ves better class-balanced performance in all events. These impro vements indicate better accuracies for medium- and long-duration classes in the im- balanced dataset. There are fewer medium and long duration samples in the data, which are more challenging to learn. This also highlights the importance of modeling high-order spatial dependencies. Overall, the BiGGA T shows significant improv ements over existing models on learning outage dura- tions in the challenging setting of inductiv e learning. B. Generalization of GR U and err or analysis The inductive setting for outage duration prediction requires generalization across hurricanes af fecting different regions. T o ev aluate this, we split test counties from unseen events into two groups: those with geographical overlap with the training set (“test with overlap”) and those without any geographical or structural connection (“absolute disjointed”). The latter group contains 265 test counties and represents the most challenging cases for generalization. Nonetheless, their test accuracy (82.4%) is comparable to the overall test accuracy , and errors from these counties account for only 27.3% of all test errors. These results indicate that BiGGA T generalizes well to unseen and structurally unconnected samples. I V . C O N C L U S I O N This work presents a nov el application of graph neural networks for predicting duration of power outages induced by natural disasters. W e de velop BiGGA T that captures spatial heterogeneity and high-order spatial dependencies in the field data. BiGGA T learns from and is tested by six historical Atlantic hurricanes under an inductive learning setting. T o achiev e robustness with moderate ev ent data, the model adopts a relativ ely simple architecture with Bimodal Embedding, self- attention and GRU modules for message passing. Experi- mental results show that BiGGA T significantly outperforms benchmark models. Further , the Gated Graph Attention mechanism enhances the generalization performance and class-balanced metrics in inductiv e learning. The model also performs robustly on the test samples that are located in differently regions from the training data. These results underscore the importance of modeling higher-order spatial dependencies, particularly under sev ere weather ev ents, and validate the use of GR U and self- attention for message passing. There are se veral research directions for future study: (a) ex- tending BiGGA T to other events and disaster types, including wildfires, winter storms and tornadoes, (b) adapting the model to data with finer spatial resolution, e.g., pri vate data owned by power utilities, (c) exploring how predicted outage impacts benefit vulnerability assessments and infrastructure. All these will benefit informed decision-making in disaster preparation and resilience strategies. R E F E R E N C E S [1] S. Seneviratne, X. Zhang, M. Adnan, W . Badi, C. Dereczynski, A. Di Luca, S. Ghosh, I. Iskandar , J. Kossin, S. Lewis, F . Otto, I. Pinto, M. Satoh, S. V icente-Serrano, M. W ehner , and B. Zhou, W eather and Climate Extreme Events in a Changing Climate . Cambridge, United Kingdom and New Y ork, NY , USA: Cambridge University Press, 2021, p. 1513–1766. [2] K. Emanuel, “ Atlantic tropical cyclones downscaled from climate re- analyses show increasing activity over past 150 years, ” Natur e commu- nications , vol. 12, no. 1, pp. 1–8, 2021. [3] A. M. Stankovi ´ c, K. L. T omsovic, F . De Caro, M. Braun, J. H. Chow , N. ˇ Cukalevski, I. Dobson, J. Eto, B. Fink, C. Hachmann et al. , “Methods for analysis and quantification of power system resilience, ” IEEE T ransactions on P ower Systems , vol. 38, no. 5, pp. 4774–4787, 2022. [4] A. Adhikari, C. W ertz, A. Dubey , A. Ahmad, and I. Dobson, “Quan- tifying power systems resilience using statistical analysis and bayesian learning, ” arXiv preprint , 2025. [5] L. Xu, K. Feng, N. Lin, A. Perera, H. V . Poor, L. Xie, C. Ji, X. A. Sun, Q. Guo, and M. O’Malley , “Resilience of renewable power systems under climate risks, ” Nature Reviews Electrical Engineering , vol. 1, no. 1, pp. 53–66, 2024. [6] S. C. Ganz, C. Duan, and C. Ji, “Socioeconomic vulnerability and differential impact of severe weather-induced power outages, ” PNAS nexus , vol. 2, no. 10, p. pgad295, 2023. [7] A. H. Afsharinejad, C. Ji, and R. Wilcox, “Large-scale data analytics for resilient recovery services from power failures, ” Joule , vol. 5, no. 9, pp. 2504–2520, 2021. [8] K. Best, S. K err , A. Reilly , A. P atwardhan, D. Niemeier , and S. Guik ema, “Spatial regression identifies socioeconomic inequality in multi-stage power outage recovery after hurricane isaac, ” Natural Hazar ds , vol. 117, no. 1, pp. 851–873, 2023. [9] C. Ji, Y . W ei, H. Mei, J. Calzada, M. Carey , S. Church, T . Hayes, B. Nugent, G. Stella, M. W allace et al. , “Large-scale data analysis of power grid resilience across multiple us service regions, ” Nature Energy , vol. 1, no. 5, pp. 1–8, 2016. [10] P . V eli ˇ ckovi ´ c, G. Cucurull, A. Casanova, A. Romero, P . Lio, and Y . Ben- gio, “Graph attention netw orks, ” arXiv pr eprint arXiv:1710.10903 , 2017. [11] Y . Li, D. T arlow , M. Brockschmidt, and R. Zemel, “Gated graph sequence neural networks, ” arXiv preprint , 2015. [12] K. Cho, B. V an Merri ¨ enboer , C. Gulcehre, D. Bahdanau, F . Bougares, H. Schwenk, and Y . Bengio, “Learning phrase representations using rnn encoder-decoder for statistical machine translation, ” arXiv preprint arXiv:1406.1078 , 2014. [13] R. Nateghi, S. D. Guikema, and S. M. Quiring, “Forecasting hurricane- induced power outage durations, ” Natural hazar ds , vol. 74, pp. 1795– 1811, 2014. [14] D. B. McRoberts, S. M. Quiring, and S. D. Guikema, “Improving hurricane power outage prediction models through the inclusion of local en vironmental factors, ” Risk analysis , vol. 38, no. 12, pp. 2722–2737, 2018. [15] J. Fang, H. W ang, F . Y ang, K. Y in, X. Lin, and M. Zhang, “ A failure prediction method of power distribution network based on pso and xgboost, ” Australian journal of electrical and electr onics engineering , vol. 19, no. 4, pp. 371–378, 2022. [16] J. Y u, Z. W ang, A. Majumdar, and R. Rajagopal, “Deepsolar: A machine learning framework to efficiently construct a solar deployment database in the united states, ” Joule , vol. 2, no. 12, pp. 2605–2617, 2018. [17] J. LeSage and R. K. Pace, Introduction to spatial econometrics . Chap- man and Hall/CRC, 2009. [18] W . Liao, B. Bak-Jensen, J. R. Pillai, Y . W ang, and Y . W ang, “ A revie w of graph neural networks and their applications in power systems, ” Journal of Modern P ower Systems and Clean Energy , vol. 10, no. 2, pp. 345– 360, 2021. [19] A. K. Dey , Y . R. Gel, and H. V . Poor, “What network motifs tell us about resilience and reliability of complex networks, ” Pr oceedings of the National Academy of Sciences , vol. 116, no. 39, pp. 19 368–19 373, 2019. [20] D. Owerko, F . Gama, and A. Ribeiro, “Predicting power outages using graph neural networks, ” in 2018 ieee global conference on signal and information pr ocessing (globalsip) . IEEE, 2018, pp. 743–747. [21] PowerOutages.US, “Power outage records of the Southeast US, ” 2021. [22] National Hurricane Center , “The revised atlantic hurricane database (hurdat2), ” 2023. [23] Census Bureau, “ American community survey 1-year estimates, ” 2020. [24] B. E. Flanagan, E. J. Hallisey , E. Adams, and A. Lavery , “Measuring community vulnerability to natural and anthropogenic hazards: the centers for disease control and prevention’ s social vulnerability index, ” Journal of envir onmental health , v ol. 80, no. 10, p. 34, 2018. [25] Georgia Power, Georgia P ower Plants Emerg ency Action Plan , 2024. [26] Department of Energy, Energy EmergencyResponse Playbookfor States and T erritories , May 2022. [27] P . A. Moran, “Notes on continuous stochastic phenomena, ” Biometrika , vol. 37, no. 1/2, pp. 17–23, 1950.
Original Paper
Loading high-quality paper...
Comments & Academic Discussion
Loading comments...
Leave a Comment