Extending Sequence Length is Not All You Need: Effective Integration of Multimodal Signals for Gene Expression Prediction
Gene expression prediction, which predicts mRNA expression levels from DNA sequences, presents significant challenges. Previous works often focus on extending input sequence length to locate distal enhancers, which may influence target genes from hun…
Authors: Zhao Yang, Yi Duan, Jiwei Zhu
Published as a conference pap er at ICLR 2026 Extending Sequence Length is Not All Y ou Need: Eec- tiv e In tegration of Multimo dal Signals for Gene Expres- sion Prediction Zhao Y ang 1,2,3,4, † ∗ Yi Duan 1,3,4 ∗ Jiw ei Zhu 1,3,4 Ying Ba 1,3,4 Ch uan Cao 2 Bing Su 1,3,4 † ‡ 1 Gaoling Sc ho ol of Articial Intelligence, Renmin Univ ersity of China, Beijing, China 2 Zhongguancun Academ y , Beijing, China 3 Beijing Key Lab oratory of Re searc h on Large Mo dels and Intelligen t Go vernance 4 Engineering Research Center of Next-Generation Intelligen t Search and Recommendation, MOE Abstract Gene expression prediction, which predicts mRNA expression lev els from DNA sequences, presen ts signican t c hallenges. Previous w orks often fo- cus on extending input sequence length to lo cate distal enhancers, whic h ma y inuence target genes from hundreds of kilobases aw a y . Our w ork rst rev eals that for current mo dels, long sequence mo deling can decrease p erformance. Ev en carefully designed algorithms only mitigate the p erfor- mance degradation caused by long sequences. Instead, we nd that pro xi- mal multimodal epigenomic signals near target genes prov e more essential. Hence we fo cus on how to better integrate these signals, whic h has b een o verlooked. W e nd that dieren t signal types serve distinct biological roles, with some directly marking active regulatory elements while others reect background chromatin patterns that ma y introduce confounding ef- fects. Simple concatenation may lead models to develop spurious associa- tions with these bac kground patterns. T o address this c hallenge, we propose Prism, a framework that learns multiple combinations of high-dimensional epigenomic features to represen t distinct background chromatin states and uses backdoor adjustment to mitigate confounding eects. Our exp erimen- tal results demonstrate that prop er mo deling of m ultimodal epigenomic signals achiev es state-of-the-art p erformance using only short sequences for gene expression prediction. 1 In tro duction Understanding and predicting gene expression is fundamental to deciphering the complex regulatory mechanisms go verning cellular functions (Pratapa et al., 2020). A ccurate gene expression prediction enables breakthroughs across biomedicine (Mamoshina et al., 2016), from unra veling disease pathogenesis (Co okson et al., 2009; Emilsson et al., 2008) and en- abling p ersonalized therap eutic strategies (Blass & Ott, 2021), to guiding the design of sp ecialized regulatory elemen ts (Lal et al., 2024; Y ang et al., 2025a). Ho wev er, accurately predicting gene expression presents signican t c hallenges. First, gene expression dep ends on regulatory elemen ts that can be lo cated h undreds of thousands of base pairs (bps) aw a y (Schoenfelder & F raser, 2019) (Figure 1 (a)), which naturally requires mo dels capable of processing long DNA sequences (Figure 1 (b)) (A vsec et al., 2021; Nguy en et al., 2023; Sc hi et al., 2024; Su et al., 2025). Additionally , gene expression is a cell-type sp ecic pro cess (Shen-Orr et al., 2010) that is dicult to predict precisely using cell-shared ∗ Equal contribution. † W ork was done during Zhao Y ang’s in ternship at Zhongguancun Academ y . ‡ Corresp ondence to: bingsu@ruc.edu.cn 1 Published as a conference pap er at ICLR 2026 …… …… input Strong Strong Weak Weak Current Long- sequence Models ✘ Recency Bias ✘ Fix Hidden States ✘ Performance Degradation SSM Long - sequence DNA Long - range Interaction E1 E2 TSS …… Enhancer TSS Promoter H3K27ac ~50kb …… …… TSS …… …… …… …… …… …… ~100kb ~100kb ~1kb ~1kb Sequence: H3K27ac: DNase: Hi-C: (d) Model Performance by Input Length (e) (Consistent Training/Testing) (a) (b) (c) ~100kb Cadeceus Performance (f) Cadeceus Performance (Full Signals Training, Ablated Signal Testing) Multimodal Signal s Matter 200 kb Figure 1: (a) Long-range regulatory interactions through chromatin lo oping. (b) Current long-sequence models suer from technical limitations. (c) Multimodal epigenomic signals pro vide cell-t yp e sp ecic regulatory information. (d) P erformance of Seq2Exp (Su et al., 2025) and Caduceus (Schi et al., 2024) with v arying input sequence lengths. (e) Dieren t signals show v arying contributions. (f) Performance degradation when sp ecic signals are remo ved during testing from a mo del trained with all signals. DNA sequences alone, necessitating the integration of cell-type sp ecic information suc h as histone mo dications, c hromatin accessibilit y , and other multimodal epigenomic signals (Lin et al., 2024; Su et al. , 2025) (Figure 1 (c)). Previous w orks primarily fo cus on modeling long sequences. Ho wev er, through simple but insigh tful experiments, w e demonstrate that these metho ds merely mitigate the performance degradation inherent in curren t long-sequence mo deling paradigms (Figure 1 (d), details in Section 2 ). In con trast, using short sequences already ac hiev es excellent results, esp ecially when combined with multimodal epigenomic signals. W e attribute the eectiveness of short sequences to the fact that proximal epigenomic signals reect the activit y of distal regulatory elemen ts through c hromatin lo oping and spatial in teractions (Plank & Dean, 2014). As sho wn in Figure 1 (a), although enhancers and genes are separated b y large distances, some epigenomic signals near the gene can reveal the regulatory inuence of these distal elements. State-of-the-art (SOT A) metho ds ( Lin et al., 2024; Schi et al., 2024; Su et al., 2025) utilize epigenomic signals through simple concatenation (Figure 1 (c)) without considering their distinct biological roles. W e conducted a study characterizing the dieren tial contribu- tions of v arious epigenomic signals by training Caduceus (Schi et al., 2024) with DNA sequence alone and with individual signals (H3K27ac, DNase-seq, Hi-C) or all combined. Figure 1 (e) shows each signal impro ves performance, with H3K27ac providing the most sub- stan tial enhancemen t. This aligns with biological understanding: H3K27ac directly marks activ e regulatory elements (Creyghton et al., 2010), functioning as a foreground signal, while DNase-seq and Hi-C serve as background signals indicating chromatin accessibility (Th ur- man et al., 2012) and organization (Rao et al., 2014). Mo dels trained on all signals p erformed comparably to H3K27ac alone, indicating bac kground signals pro vide limited incremental b enet b ey ond foreground signals. Figure 1(f) rev eals a critical paradox: removing bac kground signals during testing from mod- els trained on all signals causes severe p erformance degradation. While background signals pro vide minimal standalone impro vemen t, mo dels develop ov er-dep endence during training. This asymmetric behavior indicates these bac kground patterns in tro duce confounding ef- fects. The underlying mec hanism stems from spurious correlations in training data, where gene expression systematically co-occurs with open c hromatin patterns, causing mo dels to 2 Published as a conference pap er at ICLR 2026 learn non-causal asso ciations b etw een accessibility and expression levels. Ho wev er, gene expression can o ccur independently of c hromatin accessibility (V olp e et al., 2002), and our case study (App endix D) demonstrates high expression in regions with limited accessibility , substan tiating the spurious correlation hypothesis. T o address these confounding eects, we propose a simple yet eective approac h, Prism (Pro ximal regulatory integration of signals for mRNA expression levels prediction), that learns multiple combinations of high-dimensional epigenomic features to represent distinct bac kground chromatin states (Qiang et al., 2022). Eac h learned combination corresp onds to a sp ecic bac kground state. W e then apply backdoor adjustmen t (P earl, 2009) to p erform causal interv en tion across these states, thereby mitigating confounding eects and enhancing the mo del’s predictiv e p erformance. W e summarize our contributions here: • W e c hallenge curren t approac hes that use long sequence mo deling for gene expres- sion prediction, whic h, while biologically plausible, ma y not yield impro vemen ts due to limitations of present technical to ols. • W e systematically analyze the dierential roles of v arious epigenomic signals and iden tify that background c hromatin patterns may introduce confounding eects, leading mo dels to learn spurious asso ciations. • F rom a causal p ersp ective, we propose Prism, an approac h that learns high- dimensional feature combinations to represen t bac kground chromatin states and applies bac kdo or adjustment to mitigate confounding eects. • Through extensiv e exp erimen tation, we demonstrate the eectiv eness of our ap- proac h, achieving state-of-the-art performance using only short sequences through a simple and eectiv e metho d. 2 Curren t metho ds do not b enet from long sequence input Mainstream deep learning metho ds for gene expression prediction fo cus on extending mo del input length. Ho wev er, since the con text length that can inuence gene expression is ex- tremely long (up to 1M bps (A vsec et al., 2025)), quadratic-complexit y T ransformers cannot handle such sequences. Therefore, previous w orks hav e adopted alternativ e approac hes b e- y ond traditional T ransformers, primarily falling into tw o categories. The rst category comprises CNN-T ransformer hybrid mo dels, which rst downsample long sequences into low-resolution bins through conv olutional neural net works (CNNs), then em- plo y T ransformers to mo del these low-resolution bins (A vsec et al., 2021; Linder et al., 2025; A vsec et al., 2025). These works follow Enformer (A vsec et al., 2021) in performing 128- fold do wnsampling, resulting in the loss of single-nucleotide resolution, whic h is sub-optimal for DNA data where single-base v ariations (A vsec et al., 2025) can hav e profound biolog- ical impacts. Although Enformer p erforms well in multi-task prediction, Su et al. (2025) rev ealed that it underp erforms compared to single-nucleotide mo deling approaches like Ca- duceus (Schi et al., 2024) on sp ecialized gene expression prediction tasks. Similarly , recent w ork fo cusing on p ersonalized gene expression prediction (Li et al., 2025) demonstrated that these approaches p erform worse than Caduceus when predicting gene expression in unseen individuals. Therefore, we conclude that for gene expression prediction tasks with sp ecialized training data, main taining single-nucleotide resolution is crucial. Another class leverages neural netw orks with linear complexity , primarily the recently p op- ular state space models (SSMs) (Gu & Dao, 2023; Nguyen et al. , 2023; Sc hi et al., 2024; Nguy en et al., 2024), which directly mo del long sequences at single-nucleotide resolution. Recen tly , Seq2Exp (Su et al., 2025) ac hieved SOT A results in gene expression prediction by in tro ducing learnable masks on top of Caduceus (Schi et al., 2024), whose motiv ation is to learn to fo cus SSMs on imp ortant regulatory elements, pushing SSM-based metho ds to SOT A p erformance. In this work, w e rst challenge the prev alen t approach of using linear-complexity SSMs for single-nucleotide resolution long sequence modeling (Sc hi et al., 2024; Su et al., 2025). 3 Published as a conference pap er at ICLR 2026 These metho ds typically ev aluate their eectiveness on long sequences only . F or instance, Seq2Exp (Su et al., 2025) tested exclusiv ely on 200K-length sequences and demonstrated sup erior p erformance ov er existing metho ds, thereby claiming enhanced long-sequence mo d- eling capabilities. Ho wev er, current SSMs merely oer computational eciency adv antages with linear complexity when pro cessing long sequences, while their actual modeling perfor- mance remains questionable (Figure 1 (b)). Sp ecically , (1) SSMs hav e xed-size hidden states (Gu & Dao, 2023), making it dicult to memorize all information in long sequences. (2) W ang et al. (2025) indicates that SSMs exhibit a strong recency bias, meaning tok ens in the sequence primarily interact with their nearb y context. This contradicts the goal of gene expression prediction, which aims to mo del the relationship b etw een target genes and distan t regulatory elements. 2k 2.5k 3k 5k 10k 200k Sequence L ength (L og Scale) 0.2 0.3 0.4 0.5 0.6 MSE MSE = 0.014 Figure 2: Shortening input length at test time. Hence, we conducted a preliminary study to v al- idate whether SSMs can truly handle long se- quences eectively . Specically , we trained Ca- duceus (Schi et al., 2024) and Seq2Exp (Su et al., 2025) with v arying input lengths centered at the transcription start site (TSS) for gene ex- pression prediction, completely following the ex- p erimen tal settings of Su et al. (2025) except for sequence length. According to Figure 1 (d), w e observe that Caduceus’s p erformance con- sisten tly declines after input lengths exceed 2k. Seq2Exp, despite its carefully designed learning- to-mask mechanism for ltering unimp ortant re- gions, do esn’t show a clear do wn ward trend, but its p erformance with 200k input length remains essen tially comparable to using just 500 bps. Figure 2 (ra w data in T able 4) demonstrates that the Seq2Exp model trained on 200k sequences main tains nearly identical p erformance even when input sequences are shortened to 2.5k during the testing phase, suggesting that ev en Seq2Exp trained on long sequences funda- men tally relies only on proximal information. Therefore, rather than extending sequence length, we fo cus on b etter leveraging multimodal epigenomic signals—a longstanding ov er- lo ok ed direction for enhancing prediction p erformance. 3 Metho d 3.1 Problem F orm ulation Giv en a gene sequence X = [ x 1 , x 2 , . . . , x L ] , where for each i ∈ { 1 , 2 , . . . , L } , x i ∈ R 4 represen ts the one-hot enco ding of a n ucleotide base from the set V = { A, T , C , G } , and L denotes the sequence length surrounding the gene’s TSS (Lin et al., 2024; Su et al., 2025). F or each X , there are asso ciated multimodal epigenomic signals S = [ s 1 , s 2 , . . . , s L ] , where s i ∈ R d with d representing the n um b er of epigenomic signals. Our approac h rst employs a signal enco der g θ : R L × d → R L × d ′ with parameters θ to map the raw epigenomic signals S in to a higher-dimensional feature space H = g θ ( S ) , where d ′ represen ts the dimensionality of this enriched representation following (Su et al., 2025). W e then use a predictor net work h ϕ : ( R L × 4 , R L × d ′ ) → R with parameters ϕ that integrates b oth sequence information X and enco ded epigenomic features H to predict gene expression lev els Y ∈ R . T o optimize our mo del p arameters { θ , ϕ } , we dene the following ob jective function: L 1 = ℓ H ( h ϕ ( X, g θ ( S )) , Y ) , (1) where ℓ H denotes the s mo oth L1 loss (Hub er loss) following Su et al. (2025). 3.2 Structural Causal Mo del 4 Published as a conference pap er at ICLR 2026 H C Y Figure 3: The SCM. F rom the previous analysis, we observed that mo dels may learn spurious asso ciations with bac kground epigenomic signals. T o conceptualize this confounding issue, we formalize the problem using a Structural Causal Mo del (SCM) shown in Figure 3, where no des represent data v ariables and directed edges represen t h yp othesized relationships. F or clarity , w e omit X from the graph, though our mo del ultimately uses b oth X and H . W e rst explain our denition of confounder C . In Section 1 , w e catego- rize H3K27ac as foreground signal and DNase-seq/Hi-C as background signals based on biological priors. Ho wev er, this categorization is o v erly simplistic. H3K27ac alone cannot fully capture causal eects, as incorp orating additional signals improv es p erformance (Figure 1 (e)). Similarly , bac kground signals cannot b e di- rectly dened as confounders. Instead, w e dene the confounder as a more abstract concept: bac kground c hromatin states, whic h represent complex com binations of m ultiple epigenomic signals. This aligns with approaches lik e ChromHMM (Ernst & Kellis, 2017), whic h use com- binatorial patterns of epigenomic signals to dene chromatin states across the genome. The sp ecic functional implemen tation of C is detailed in Subsection 3.4. This denition is inspired b y works in computer vision (Zhou et al. , 2016; Y ue et al., 2020; Qiang et al., 2022), where confounders (representing image background information) are mo deled as com binations of high-dimensional semantic feature representations. Sp ecically , R GB images (analogous to our raw signals S ∈ R L × d ) are enco ded into high-dimensional spaces (analogous to our H ∈ R L × d ′ ), where dierent linear com binations of features can represen t v arious background contexts (Zhou et al., 2016; Qiang et al., 2022). Next, w e explain the meaning of the edges in our SCM (Figure 3 ). H → Y . High-dimensional epigenomic features H con tain comprehensive regulatory infor- mation that directly inuences gene expression Y . H ← C → Y . The confounding path w ay where background chromatin state C simul- taneously aects b oth the observed epigenomic features H and expression lev els Y . F or instance, globally active chromatin regions often exhibit b oth high accessibility signals and high e xpression, creating correlations that may not reect gene-sp ecic regulation directly . 3.3 Causal In terven tion via Backdoor Adjustmen t An eective prediction model should capture the direct regulatory relationship H → Y rather than spurious correlations through the confounding path wa y H ← C → Y . Ho w- ev er, standard approaches optimize P ( Y | H ) , which conates b oth pathw ays. Our goal is to estimate the interv en tional distribution P ( Y | do ( H )) (Pearl et al., 2016) that isolates the direct causal eect by controlling for background chromatin states C . The do op era- tor represents an in terven tion that sets H while remo ving its dep endency on confounders, enabling isolation of the direct causal eect. W e stratify the confounder C into n distinct bac kground chromatin states: C = { C 1 , C 2 , ..., C n } , where n is a hyperparameter. Using bac kdo or adjustmen t, w e formulate: P ( Y | do ( H )) = n i =1 P ( Y | H , C = C i ) P ( C = C i ) . F or computational tractability , we assume C follows a uniform distribution ( Qiang et al., 2022): P ( C = C i ) = 1 n . 3.4 F unctional Implementation T o functionally instantiate the confounder C , w e draw inspiration from metho ds in computer vision that mo del background context using learnable w eights (Qiang et al., 2022). W e in tro duce the confounder enco der g ω : R L × d → R n × d ′ with parameters ω , which pro cesses the ra w epigenomic signals S to generate a set of learnable w eight vectors A = [ a 1 , a 2 , . . . , a n ] . Eac h v ector a i ∈ R d ′ represen ts a distinct background chromatin state C i b y applying a unique weigh ting scheme across the d ′ dimensions of the encoded epigenomic features. These w eights are gene-wise rather than p osition-wise, reecting the assumption that background regulatory patterns are consisten t across a giv en gene region. F or example, one weigh t vector 5 Published as a conference pap er at ICLR 2026 … … … H3K27ac DNase Hi -C … … … … A 𝑑′ 𝑔 𝜔 S … A G C T A T A C A X 𝑔 𝜃 … … 𝑎 1 𝑎 𝑛 … … n ℎ 𝜙 … Y 最上面的 H 的维度是 (L , D) ,中间的 A 的维度是 (n, D) , H 和 A 乘了以后其 实是升维广播了,变成了 [L , D , n] ,有 n 组 [L , D] ,然后 n 组 [L , D] 和 X 计算 Figure 4: Arc hitecture of Prism. Epigenomic signals S are pro cessed by t wo enco ders: a signal enco der g θ extracts high-dimension epigenomic features H , while a confounder enco der g ω learns n distinct weigh ts representing the confounder C . A nal predictor h ϕ uses these w eighted features along with the DNA sequence X to make a prediction. migh t learn to emphasize c hromatin accessibilit y signals, while another migh t prioritize features related to 3D c hromatin organization. This data-driv en approac h allo ws the mo del to capture the complex nature of bac kground confounding eects without relying on ov erly simplistic biological priors. With this imple- men tation, we can compute the interv entional distribution from the bac kdo or adjustment form ula by stratifying across these learned background states. Since w e assume the DNA sequence X is indep endent of the epigenomic features H (Su et al., 2025), we include it directly in the predictor: ˆ Y do = P ( Y | X , do ( H )) = n i =1 P ( Y | X , H , C = C i ) P ( C = C i ) = 1 n n i =1 h ϕ ( X, H ⊙ a i ) , (2) where ⊙ denotes element-wise multiplication. Eac h term h ϕ ( X, H ⊙ a i ) represents a predic- tion under a sp ecic bac kground con text C i . More details ab out the functional implemen- tation of h ϕ , including the signal-sequence fusion strategy and the in terven tional prediction computation, are pro vided in App endix F.3. W e incorp orate this interv entional prediction as a regularization term (Qiang et al., 2022), forming a second loss comp onent that encourages the mo del to b e robust to dierent back- ground c hromatin states: L 2 = ℓ H 1 n n i =1 h ϕ ( X, H ⊙ a i ) , Y . (3) 3.5 T raining Ob jective T o ensure our model learns a meaningful and div erse set of background c hromatin states, w e should preven t the weigh t v ectors { a i } from collapsing into a single pattern. W e introduce a uniform loss function (W ang & Isola, 2020) that encourages the weigh t v ectors to b e distinct from eac h other. This loss p enalizes similarity betw een background representations, promoting div ersity in the learned weigh ts: L 3 = log i,j exp 2 t · ˜ a T i ˜ a j − 2 t , (4) where ˜ a i = a i / ∥ a i ∥ 2 is the L2-normalized w eight vector and t is a temp erature parameter that c on trols the sharpness of the p enalty . Our nal training ob jective combines the standard prediction loss, the interv en tion-based regularization, and the uniform div ersity loss: L = L 1 + α L 2 + β L 3 , (5) 6 Published as a conference pap er at ICLR 2026 where α and β are hyperparameters controlling the relative imp ortance of the interv ention regularization and the uniform diversit y constraint, resp ectively . The complete algorithm w orkow for our Prism framework is provided in App endix E. 4 Exp erimen ts 4.1 Exp erimen tal Setup Datasets. T o ev aluate gene expression prediction, we adopt Cap Analysis of Gene Expres- sion (CAGE) v alues as our prediction proxy , in line with established approaches (A vsec et al., 2021; Lin et al., 2024; Su et al., 2025). Our study focuses on t w o w ell-characterized h uman cell lines: K562 and GM12878. W e use CA GE measuremen ts obtained from the ENCODE (Consortium et al., 2012). F ollo wing the experimental framework established in previous studies (Lin et al., 2024; Su et al., 2025), w e ev aluate our mo del across 18,377 protein-co ding genes. F or input data, we utilize b oth DNA sequences and epigenomic signals. The DNA sequences are derived from the human genome HG38 pro ject, while the epigenomic signals were care- fully selected (Su et al., 2025) to capture dieren t asp ects of gene regulation: H3K27ac marks histone acetylation at active enhancers and promoters. DNase-seq measures c hro- matin accessibilit y in genomic regions, often coinciding with but not causally determining regulatory elements. Hi-C quanties con tact frequencies b etw een genomic p ositions and the target TSS, pro cessed using the ABC pip eline (F ulco et al., 2019). Lik e DNase-seq, we cate- gorize Hi-C as a background signal representing the broader c hromatin environmen t rather than sp ecic regulatory elemen ts. F urthermore, w e incorp orate additional features suc h as mRNA half-life and promoter activ- it y , which are taken from previous studies (Lin et al., 2024; Su et al., 2025). These features are simply concatenated to the nal linear predictor and are not part of our core mo deling approac h for epigenomic signals. Baselines. W e b enchmark our Prism against the following baselines: Enformer (A vsec et al., 2021), a CNN-T ransformer hybrid architecture designed to predict epigenomic signals and gene expression from sequences, here used solely for CAGE prediction; Hy enaDNA (Nguyen et al., 2023), Mam ba (Gu & Dao, 2023), and Caduceus (Schi et al., 2024), three recently dev elop ed DNA foundation mo dels leveraging ecient long-sequence modeling capabilities through SSMs as prediction backbones; EPInformer (Lin et al., 2024), which extends the A ctivity-By-Con tact (ABC) mo del (F ulco et al., 2019) b y utilizing DNase-seq peaks to dene potential regulatory regions and applying atten tion mechanisms to aggregate enhancer signals; and Seq2Exp (Su et al., 2025), a recen t SOT A method that applies information b ottlenec k principles to learn regulatory element masks, av ailable in hard (binary) and soft (con tinuous) v ariants. W e also include Caduceus w/signal, whic h incorporates epigenomic signals directly into Caduceus’s enco der, and MA CS3 (Zhang et al., 2008), which diers from Seq2Exp b y using MACS3-iden tied regulatory elements instead of learned masks. Most baseline mo dels pro cess raw DNA sequences from the input region, while EPInformer op erates on p otential enhancer candidates extracted based on DNase-seq measuremen ts follo wing the ABC mo del (F ulco et al., 2019). Ev aluation Metrics. W e assess mo del p erformance using three metrics following Su et al. (2025): Mean Squared Error (MSE) for measuring prediction v ariance with emphasis on larger errors; Mean Absolute Error (MAE) for quantifying av erage prediction deviation in expression units; and Pearson Correlation for ev aluating ho w w ell models capture expression patterns and gene rankings regardless of absolute scale. These metrics together pro vide a balanced assessmen t of b oth prediction accuracy and pattern preserv ation capabilities. Implemen tation Details. W e partition datasets b y chromosome for training, v alidation, and testing, follo wing Su et al. (2025). Sp ecically , c hromosomes 3 and 21 serv e as the v alidation set, while chromosomes 22 and X are reserv ed for testing. The inclusion of chromosome X provides a more stringen t ev aluation of mo del robustness due to its distinct biological c haracteristics compared to autosomes. 7 Published as a conference pap er at ICLR 2026 T able 1: Performance on Gene Expression CA GE Prediction with Standard Deviation for Both Cell T yp es. K562 GM12878 MSE ↓ MAE ↓ Pearson ↑ MSE ↓ MAE ↓ Pearson ↑ Enformer 0.2920 ± 0.0050 0.4056 ± 0.0040 0.7961 ± 0.0019 0.2889 ± 0.0009 0.4185 ± 0.0013 0.8327 ± 0.0025 HyenaDNA 0.2265 ± 0.0013 0.3497 ± 0.0012 0.8425 ± 0.0008 0.2217 ± 0.0018 0.3562 ± 0.0012 0.8729 ± 0.0010 Mamba 0.2241 ± 0.0027 0.3416 ± 0.0026 0.8412 ± 0.0021 0.2145 ± 0.0021 0.3446 ± 0.0022 0.8788 ± 0.0011 Caduceus 0.2197 ± 0.0038 0.3327 ± 0.0070 0.8475 ± 0.0014 0.2124 ± 0.0037 0.3436 ± 0.0031 0.8819 ± 0.0009 EPInformer 0.2140 ± 0.0042 0.3291 ± 0.0031 0.8473 ± 0.0017 0.1975 ± 0.0031 0.3246 ± 0.0025 0.8907 ± 0.0011 MACS3 0.2195 ± 0.0023 0.3455 ± 0.0018 0.8435 ± 0.0013 0.2340 ± 0.0028 0.3654 ± 0.0017 0.8634 ± 0.0020 Caduceus w/ signals 0.1959 ± 0.0036 0.3187 ± 0.0036 0.8630 ± 0.0008 0.1942 ± 0.0058 0.3269 ± 0.0048 0.8928 ± 0.0017 Seq2Exp-hard 0.1863 ± 0.0051 0.3074 ± 0.0036 0.8682 ± 0.0045 0.1890 ± 0.0045 0.3199 ± 0.0040 0.8916 ± 0.0027 Seq2Exp-soft 0.1856 ± 0.0032 0.3054 ± 0.0024 0.8723 ± 0.0012 0.1873 ± 0.0044 0.3137 ± 0.0028 0.8951 ± 0.0038 Prism 0.1789 ± 0.0041 0.3000 ± 0.0058 0.8751 ± 0.0036 0.1759 ± 0.0054 0.3054 ± 0.0048 0.9016 ± 0.0024 Our signal enco der g θ is implemented as a simple linear lay er (Su et al., 2025), while the confounder enco der g ω utilizes a light weigh t 1D-CNN, with details in App endix F. F or the predictor h ϕ , we adopt Caduceus (Schi et al., 2024) as our backbone mo del, following Seq2Exp (Su et al., 2025). Notably , we main tain the same training h yp erparameters as in Seq2Exp (Su et al., 2025). F urther performance gains could likely be achiev ed through h yp erparameter ne-tuning specic to our approac h. W e use the smooth L1 loss (Hub er loss) as our prediction loss function, while the best mo del is selected based on the MSE metric on the v alidation set following Su et al. (2025). All experiments were conducted on NVIDIA A40 and A100 GPUs. While most baseline mo dels pro cess inputs of length 200k, our Prism implementation operates on sequences of 2k bps. Additional implementation details can b e found in App endix F. 4.2 Results of Gene Expression Prediction T able 1 presents p erformance results across all methods for the K562 and GM12878 cell t yp es, resp ectively . All baseline results are directly cited from Seq2Exp (Su et al., 2025) to ensure fair comparison. Additionally , all results rep orted include the mean and standard deviation from ve runs using dieren t random seeds: {2, 22, 222, 2222, 22222} following Su et al. (2025). The best-p erforming method for each metric is highlighted in b old, with the second-b est underlined. Notably , our Prism consistently outp erforms the previous SOT A Seq2Exp-soft across all datasets and metrics. Among the six total metrics, only K562’s MAE and Pearson correlation show improv ements less than one standard deviation, while all other metrics demonstrate robust improv ements exceeding one standard deviation. These results provide strong evidence that our approach achiev es new SOT A p erformance in gene expression prediction. 4.3 Hyp erparameter Sensitivit y Analysis Our metho d in tro duces several h yp erparameters: the n umber of bac kground chromatin states n , and co ecien ts α and β that balance the loss comp onents in our training ob jectiv e (Equation 5 ). W e conducted a sensitivit y analysis on the K562 cell line, with results (Also a veraged results from ve runs, here only the mean v alues are shown) presented in T able 2 . Our analysis of n shows that while performance peaks at n = 4 , congurations with n ≥ 2 substan tially outp erform the n = 0 baseline, v alidating our in terven tion; w e select n = 2 to balance p erformance and eciency . F or the in terven tion w eight α , we found p erformance is optimal at 1 . 0 and degrades when either disabled ( α = 0 ) or set to o high ( α = 10 . 0 ). This conrms its role as an auxiliary regularizer, consistent with prior work (Qiang et al., 2022). Finally , the div ersity constraint prov es to b e robust. The mo del’s performance is nearly iden tical for β = 0 . 1 and β = 1 . 0 , and shows only a slight degradation even with a large w eight of β = 10 . 0 . 8 Published as a conference pap er at ICLR 2026 T able 2: Hyp erparameter sensitivit y analysis for Prism on the K562 cell line. W e ev aluate the mo del’s p erformance while v arying (a) the num b er of background states n , (b) the in terven tion loss weigh t α , and (c) the diversit y loss weigh t β . (a) Sensitivity on n n MSE ↓ MAE ↓ Pearson ↑ 0 0.1863 ± 0.0035 0.3092 ± 0.0050 0.8713 ± 0.0023 1 0.1891 ± 0.0047 0.3084 ± 0.0039 0.8676 ± 0.0032 2 0.1789 ± 0.0041 0.3000 ± 0.0058 0.8751 ± 0.0036 3 0.1818 ± 0.0091 0.3018 ± 0.0090 0.8739 ± 0.0031 4 0.1762 ± 0.0071 0.2961 ± 0.0070 0.8780 ± 0.0028 5 0.1788 ± 0.0062 0.2996 ± 0.0071 0.8752 ± 0.0030 6 0.1857 ± 0.0078 0.3057 ± 0.0047 0.8737 ± 0.0022 (b) Sensitivity on α α MSE ↓ MAE ↓ Pearson ↑ 0.1 0.1829 ± 0.0065 0.3037 ± 0.0078 0.8725 ± 0.0030 1.0 0.1789 ± 0.0041 0.3000 ± 0.0058 0.8751 ± 0.0036 10.0 0.1916 ± 0.0055 0.3119 ± 0.0071 0.8709 ± 0.0029 (c) Sensitivity on β β MSE ↓ MAE ↓ Pearson ↑ 0.1 0.1789 ± 0.0056 0.2993 ± 0.0037 0.8757 ± 0.0038 1.0 0.1789 ± 0.0041 0.3000 ± 0.0058 0.8751 ± 0.0036 10.0 0.1836 ± 0.0120 0.3027 ± 0.0123 0.8748 ± 0.0036 0 16 32 48 64 80 96 112 128 inde x of featur e dimension inde x of C ENSG00000006757 0 16 32 48 64 80 96 112 128 inde x of featur e dimension inde x of C ENSG00000001497 0 16 32 48 64 80 96 112 128 inde x of featur e dimension inde x of C ENSG00000008056 0.0 0.5 1.0 W eight V alue 0.0 0.5 1.0 W eight V alue 0.0 0.5 1.0 W eight V alue Figure 5: Visualization of learned confounder w eights ( a 1 , a 2 ) for three sampled ge nes. 4.4 Analysis of Learned W eigh ts T o understand ho w our mo del represents the confounder C , we visualize the w eigh ts learned b y the confounder enco der g ω (Figure 5 ). The analysis reveals t wo k ey prop erties. First, w e observ e strong intra-gene div ersity: for a given gene, the tw o learned w eight v ectors ( a 1 and a 2 ) are distinct and often complementary , conrming that our mo del learns non-redundant represen tations for eac h confounder stratum. Second, w e nd evidence of inter-gene struc- tural similarity . The o verall intensit y of the learned weigh ts is clearly gene-specic, reecting eac h gene’s unique local epigenomic con text. Despite this v ariation in magnitude, the rela- tiv e pattern b etw een the tw o states is remarkably consistent across dierent genes, suggest- ing the mo del learns a generalizable strategy—suc h as an ”activ ating” versus a ”suppressiv e” state—whic h it then adapts to each gene’s local con text. These structured representations supp ort t he v alidity of our causal framework. 4.5 P arameter Overhead T able 3: P arameter comparison b etw een mo d- els. Mo del T rainable Parameters Caduceus 574K Seq2Exp 1.1M Prism 585K Our confounder enco der is designed to b e light w eight while deliv ering substantial p erformance improv emen ts. W e compare the additional parameters in tro duced b y Prism and Seq2Exp (Su et al. , 2025) rel- ativ e to the base Caduceus (Sc hi et al., 2024). As shown in T able 3 , Prism adds only 11K trainable parameters to the base 9 Published as a conference pap er at ICLR 2026 mo del. Our light w eight confounder enco der g ω in tro duces minimal parameter ov erhead, whereas Seq2Exp’s mask generator causes its parameter coun t to double compared to Caduceus. Notably , our approac h outp erforms Seq2Exp across all metrics while maintaining an almost unchanged parameter count com- pared to Caduceus. 5 Related W ork Sequence-to-function mo dels are designed to predict functional genomic signals directly from DNA sequences. DeepSEA (Zhou & T ro yanska y a, 2015) established this approac h b y utilizing conv olutional neural netw orks (CNNs) to extract sequence features for multi- task prediction. The eld has evolv ed through arc hitectural innov ations and expanded training datasets (Kelley et al., 2018; Zhou et al., 2018; Chen et al., 2022). Currently , En- former (A vsec et al., 2021) represents the leading metho d, ac hieving exceptional p erformance through its hybrid T ransformer-CNN architecture. While these mo dels simultaneously pre- dict v arious outputs, including epigenomic signals and gene expression lev els, they typically lac k sp ecialized mechanisms for leveraging epigenomic data to enhance expression predic- tion, sp ecically , treating all prediction targets as parallel outputs rather than considering their biological in terdep endencies. Unsup ervised DNA foundation models lev erage the successful paradigm of unsup ervised pre- training established in natural language pro cessing. DNABER T (Ji et al., 2021) was the rst to adapt this approac h to genomics, applying BER T-like Devlin et al. (2019) techniques to learn transferable DNA representations. Subsequen t models ha ve expanded up on this foundation (Zhou et al., 2024; Dalla-T orre et al., 2024; Li et al., 2024; Sanabria et al., 2024). In parallel, generativ e frameworks lik e Evo (Nguyen et al., 2024) hav e emerged (Nguyen et al., 2023; Brixi et al., 2025), enabling functional elemen t design applications (Linder et al., 2025; Y ang et al., 2025a). Despite these adv ances, suc h mo dels’ eectiv eness for gene expression prediction remains limited due to their exclusive reliance on DNA sequence information, without incorp orating the critical epigenomic con text that mo dulates gene activity . Gene expression prediction represents a fundamen tal c hallenge in bioinformatics (Segal et al., 2002). Early approaches like Enformer (A vsec et al., 2021), Borzoi (Linder et al., 2025) and SP A CE (Y ang et al., 2025b) attempted to predict gene expression directly from DNA se- quences, facing inheren t limitations, while GraphReg (Karbala yghareh et al., 2022) enhanced p erformance by incorp orating epigenomic information through graph attention netw orks to mo del ph ysical interactions betw een genomic regions. More recen t metho ds hav e progressed to ward in tegrating both sequence and epigenomic information, with Creator (Li et al., 2023) and EPInformer (Lin et al., 2024) demonstrating impro ved p erformance through this com- bined approach. How ev er, these mo dels typically rely on pre-identied regulatory elements, o verlooking potential contributions from unannotated regions. Seq2Exp ( Su et al., 2025) addressed this limitation through an end-to-end, data-driven methodology that sim ultane- ously learns to identify relev ant regulatory elemen ts and predict expression with epigenomic guidance. Despite these adv ances, current research tends to fo cus predominantly on mo del- ing distal regulatory elements through long sequence architectures, rather than optimizing the utilization of biologically in terrelated epigenomic signals that directly inuence gene regulation. 6 Conclusion This work reveals a critical challenge in gene expression prediction: while previous metho ds fo cus on mo deling longer sequences, curren t technical paradigms suer from inheren t p er- formance degradation with extended sequence length. Instead, we discov ered that proximal epigenomic signals are crucial, but complex background c hromatin states may in tro duce confounding eects, creating spurious correlations in mo dels. Building on these insights, w e prop ose Prism, a ligh tw eigh t framew ork that achiev es state-of-the-art gene expression 10 Published as a conference pap er at ICLR 2026 prediction performance through eectiv e in tegration of m ultimo dal epigenomic signals using only short sequences while adding minimal computational o verhead. Ethics Statement W e ackno wledge that we hav e read and adhered to the ICLR Co de of Ethics. If the reviewers or the communit y raise any ethical concern ab out our w ork, w e are ready to address them transparen tly and resp onsibly . Repro ducibilit y Statemen t T o facilitate reproducibility , we detail the complete pip eline of our Prism framework using pseudo co de in the app endix. W e also provide an exhaustiv e do cumentation of the experi- men tal setups, cov ering computing infrastructure, random seeds, and optimization details suc h as learning rate schedules and batch sizes. F urthermore, the robustness of our re- sults is thoroughly v alidated through systematic ev aluations, detailed ablation studies, and h yp erparameter sensitivity analyses presen ted throughout the pap er. Co de is av ailable at h ttps://github.com/y angzhao1230/Prism. A ckno wledgemen ts This work was supp orted in part by the National Natural Science F oundation of China No. 62376277, Public Computing Cloud, Renmin Universit y of China, and fund for building w orld-class universities (disciplines) of Renmin Universit y of China. References Žiga A vsec, Vikram Agarwal, Daniel Visen tin, Joseph R Ledsam, Agnieszka Grabska- Barwinska, Kyle R T aylor, Y annis Assael, John Jump er, Pushmeet K ohli, and Da vid R Kelley . Eectiv e gene expression prediction from sequence b y integrating long-range in- teractions. Nature metho ds, 18(10):1196–1203, 2021. Žiga A vsec, Natasha Lat yshev a, Jun Cheng, Guido Nov ati, Kyle R T a ylor, T om W ard, Clare Bycroft, Lauren Nicolaisen, Eirini Arv aniti, Joshua P an, et al. Alphagenome: adv ancing regulatory v ariant eect prediction with a unied dna sequence model. bioRxiv, pp. 2025– 06, 2025. Eryn Blass and Patric k A Ott. Adv ances in the developmen t of p ersonalized neoantigen- based therap eutic cancer v accines. Nature reviews Clinical oncology , 18(4):215–229, 2021. Garyk Brixi, Matthew G Durrant, Jerome Ku, Michael P oli, Greg Brockman, Daniel Chang, Gabriel A Gonzalez, Sam uel H King, David B Li, Aditi T Merc hant, et al. Genome mo deling and design across all domains of life with evo 2. BioRxiv, pp. 2025–02, 2025. Kathleen M Chen, Aaron K W ong, Olga G T roy anska ya, and Jian Zhou. A sequence-based global map of regulatory activity for deciphering human genetics. Nature genetics, 54(7): 940–949, 2022. ENCODE Project Consortium et al. An in tegrated encyclop edia of dna elements in the h uman genome. Nature, 489(7414):57, 2012. William Co okson, Liming Liang, Gonçalo Ab ecasis, Miriam Moatt, and Mark Lathrop. Mapping complex disease traits with global gene expression. Nature Reviews Genetics, 10(3):184–194, 2009. Menno P Creygh ton, Alb ert W Cheng, G Grant W elstead, T ristan Kooistra, Bryce W Carey , Ev eline J Steine, Jacob Hanna, Mic hael A Lo dato, Garrett M F rampton, Phillip A Sharp, et al. Histone h3k27ac separates activ e from poised enhancers and predicts developmen tal state. Pro ceedings of the National A cademy of Sciences, 107(50):21931–21936, 2010. 11 Published as a conference pap er at ICLR 2026 Hugo Dalla-T orre, Liam Gonzalez, Ja vier Mendoza-Revilla, Nicolas Lopez Carranza, A dam Henryk Grzyw aczewski, F rancesco Oteri, Christian Dallago, Ev an T rop, Bernardo P de Almeida, Hassan Sirelkhatim, et al. Nucleotide transformer: building and ev aluating robust foundation mo dels for human genomics. Nature Metho ds, pp. 1–11, 2024. Jacob Devlin, Ming-W ei Chang, Kenton Lee, and Kristina T outanov a. Bert: Pre-training of deep bidirectional transformers for language understanding. In Pro ceedings of the 2019 Conference of the North American Chapter of the Asso ciation for Computational Linguistics: Human Language T echnologies, V olume 1 (Long and Short P ap ers), pp. 4171– 4186, 2019. V alur Emilsson, Gudmar Thorleifsson, Bin Zhang, Amy S Leonardson, Florian Zink, Jun Zh u, Sonia Carlson, Agnar Helgason, G Bragi W alters, Stein unn Gunnarsdottir, et al. Genetics of gene expression and its eect on dise ase. Nature, 452(7186):423–428, 2008. Jason Ernst and Manolis Kellis. Chromatin-state disco very and genome annotation with c hromhmm. Nature proto cols, 12(12):2478–2492, 2017. Charles P F ulco, Joseph Nasser, Thouis R Jones, Glen Munson, Drew T Bergman, Vidya Subramanian, Sharon R Grossman, Ro ckw ell Any oha, Benjamin R Dought y , T ejal A Pat- w ardhan, et al. Activit y-b y-contact mo del of enhancer–promoter regulation from thou- sands of crispr p erturbations. Nature genetics, 51(12):1664–1669, 2019. Alb ert Gu and T ri Dao. Mamba: Linear-time sequence mo deling with selective state spaces. arXiv preprint arXiv:2312.00752, 2023. Y anrong Ji, Zhihan Zhou, Han Liu, and Ramana V Da vuluri. Dnab ert: pre-trained bidi- rectional enco der representations from transformers mo del for dna-language in genome. Bioinformatics, 37(15):2112–2120, 2021. Alireza Karbala yghareh, Merve Sahin, and Christina S Leslie. Chromatin in teraction–a ware gene regulatory mo deling with graph atten tion netw orks. Genome Researc h, 32(5):930– 944, 2022. Da vid R Kelley , Y akir A Reshef, Maxwell Bilesc hi, David Belanger, Cory Y McLean, and Jasp er Snoek. Sequential regulatory activit y prediction across chromosomes with con vo- lutional neural netw orks. Genome research, 28(5):739–750, 2018. A v an tika Lal, Da vid Gareld, T ommaso Biancalani, and Gokcen Eraslan. Designing realistic regulatory dna with autoregressive language mo dels. Genome Research, 34(9):1411–1420, 2024. Sh umin Li, Ruibang Luo, and Y uanh ua Huang. Assessing large-scale genomic language mo dels in predicting p ersonal gene expression: promises and limitations. bioRxiv, pp. 2025–07, 2025. Siyuan Li, Zedong W ang, Zicheng Liu, Di W u, Cheng T an, Jiangbin Zheng, Y ufei Huang, and Stan Z Li. Vqdna: Unleashing the p ow er of vector quantization for m ulti-sp ecies genomic sequence mo deling. In F ort y-rst In ternational Conference on Machine Learning, 2024. Y ongge Li, F usong Ju, Zhiyuan Chen, Yiming Qu, Huanhuan Xia, Liang He, Lijun W u, Jian wei Zhu, Bin Shao, and Pan Deng. Creator: zero-shot cis-regulatory pattern mo deling with atten tion mechanisms. Genome Biology , 24(1):266, 2023. Jiecong Lin, Ruibang Luo, and Luca Pinello. Epinformer: a scalable deep learning frame- w ork for gene expression prediction b y integrating promoter-enhancer sequences with m ultimo dal epigenomic data. bioRxiv, pp. 2024–08, 2024. Johannes Linder, Divyanshi Sriv astav a, Han Y uan, Vikram Agarwal, and Da vid R Kelley . Predicting rna-seq cov erage from dna sequence as a unifying model of gene regulation. Nature Genetics, pp. 1–13, 2025. 12 Published as a conference pap er at ICLR 2026 P olina Mamoshina, Armando Vieira, Evgeny Putin, and Alex Zhav oronk ov. Applications of deep learning in biomedicine. Molecular pharmaceutics, 13(5):1445–1454, 2016. Eric Nguyen, Michael Poli, Marjan F aizi, Armin Thomas, Mic hael W orno w, Callum Birch- Syk es, Stefano Massaroli, Aman P atel, Clayton Rabideau, Y oshua Bengio, et al. Hye- nadna: Long-range genomic sequence mo deling at single nucleotide resolution. Adv ances in neural information pro cessing systems, 36:43177–43201, 2023. Eric Nguy en, Michael P oli, Matthew G Durrant, Brian Kang, Dhruv a Katrekar, David B Li, Liam J Bartie, Armin W Thomas, Samuel H King, Garyk Brixi, et al. Sequence mo deling and design from molecular to genome scale with evo. Science, 386(6723):eado9336, 2024. Judea P earl. Causal inference in statistics: An ov erview. 2009. Judea P earl, Madelyn Glymour, and Nic holas P Jewell. Causal inference in statistics: A primer. John Wiley & Sons, 2016. Jennifer L Plank and Ann Dean. Enhancer function: mec hanistic and genome-wide insights come together. Molecular cell, 55(1):5–14, 2014. A dity a Pratapa, Amogh P Jalihal, Jerey N Law, Adit ya Bharadwaj, and TM Murali. Benc h- marking algorithms for gene regulatory netw ork inference from single-cell transcriptomic data. Nature metho ds, 17(2):147–154, 2020. W en wen Qiang, Jiangmeng Li, Changw en Zheng, Bing Su, and Hui Xiong. Interv en tional con trastive learning with meta seman tic regularizer. In International conference on ma- c hine learning, pp. 18018–18030. PMLR, 2022. Suhas SP Rao, Miriam H Huntley , Nev a C Durand, Elena K Stameno v a, Iv an D Bo chk ov, James T Robinson, Adrian L San b orn, Ido Machol, Arina D Omer, Eric S Lander, et al. A 3d map of the h uman genome at kilobase resolution reveals principles of c hromatin lo oping. Cell, 159(7):1665–1680, 2014. Melissa Sanabria, Jonas Hirsch, Pierre M Joub ert, and Anna R P o etsch. Dna language mo del grov er learns sequence con text in the human genome. Nature Machine In telligence, 6(8):911–923, 2024. Y air Schi, Chia Hsiang Kao, Aaron Gokaslan, T ri Dao, Albert Gu, and V olo dymyr Kulesho v. Caduceus: Bi-directional equiv ariant long-range dna sequence modeling. In In ternational Conference on Machine Learning, pp. 43632–43648. PMLR, 2024. Stefan Sc ho enfelder and Peter F raser. Long-range enhancer–promoter contacts in gene ex- pression control. Nature Reviews Genetics, 20(8):437–455, 2019. Eran Segal, Y oseph Barash, Itamar Simon, Nir F riedman, and Daphne Koller. F rom pro- moter sequence to expression: a probabilistic framew ork. In Pro ceedings of the sixth ann ual international conference on Computational biology , pp. 263–272, 2002. Shai S Shen-Orr, Rob ert Tibshirani, Purvesh Khatri, Dale L Bodian, F rank Staedtler, Nic holas M P erry , T revor Hastie, Minnie M Sarw al, Mark M Da vis, and Atul J Butte. Cell type–sp ecic gene expression dierences in complex tissues. Nature metho ds, 7(4): 287–289, 2010. Xingyu Su, Haiyang Y u, Degui Zhi, and Shuiw ang Ji. Learning to disco ver regulatory elemen ts for gene expression prediction. In The Thirteenth International Conference on Learning Representations, 2025. Rob ert E Th urman, Eric R ynes, Richard Hum bert, Je Vierstra, Matthew T Maurano, Eric Haugen, Nathan C Sheeld, Andrew B Stergachis, Hao W ang, Benjamin V ernot, et al. The accessible chromatin landscape of the human genome. Nature, 489(7414):75–82, 2012. T oni A. V olp e, Catherine Kidner, Ian M. Hall, Gang T eng, Songtao I. Grew al, and Robert A. Martienssen. Regulation of hetero chromatic silencing and histone h3 lysine-9 meth ylation b y rnai. Science, 297(5588):1833–1837, Sep 2002. doi: 10.1126/science.1074973. Epub 2002 Aug 22. 13 Published as a conference pap er at ICLR 2026 P eihao W ang, Ruisi Cai, Y uehao W ang, Jia jun Zh u, Pragya Sriv astav a, Zhangyang W ang, and Pan Li. Understanding and mitigating b ottlenec ks of state space mo dels through the lens of recency and o v er-smo othing. In The Thirteenth In ternational Conference on Learning Representations, 2025. T ongzhou W ang and Phillip Isola. Understanding contrastiv e representation learning through alignmen t and uniformity on the hypersphere. In International conference on mac hine learning, pp. 9929–9939. PMLR, 2020. Zhao Y ang, Bing Su, Chuan Cao, and Ji-Rong W en. Regulatory DNA sequence design with reinforcement learning. In The Thirteen th International Conference on Learning Represen tations, 2025a. Zhao Y ang, Jiw ei Zh u, and Bing Su. Space: Y our genomic prole predictor is a pow erful dna foundation mo del. In International Conference on Machine Learning, pp. 71648–71667. PMLR, 2025b. Zhongqi Y ue, Hanw ang Zhang, Qianru Sun, and Xian-Sheng Hua. Interv en tional few-shot learning. A dv ances in neural information pro cessing systems, 33:2734–2746, 2020. Y ong Zhang, T ao Liu, Cliord A Mey er, Jérôme Eeckhoute, David S Johnson, Bradley E Bernstein, Chad Nusbaum, Richard M My ers, Myles Bro wn, W ei Li, et al. Model-based analysis of chip-seq (macs). Genome biology , 9:1–9, 2008. Bolei Zhou, Adit ya Khosla, Agata Lap edriza, Aude Oliv a, and Antonio T orralba. Learning deep features for discriminative lo calization. In Pro ceedings of the IEEE conference on computer vision and pattern recognition, pp. 2921–2929, 2016. Jian Zhou and Olga G T ro yanska y a. Predicting eects of nonco ding v ariants with deep learning–based sequence mo del. Nature metho ds, 12(10):931–934, 2015. Jian Zhou, Chandra L Theesfeld, Kevin Y ao, Kathleen M Chen, Aaron K W ong, and Olga G T ro yanska y a. Deep learning sequence-based ab initio prediction of v ariant eects on expression and disease risk. Nature genetics, 50(8):1171–1179, 2018. Zhihan Zhou, Y anrong Ji, W eijian Li, Pratik Dutta, Ramana V Davuluri, and Han Liu. Dnab ert-2: Ecient foundation mo del and b enchmark for multi-species genomes. In The T w elfth International Conference on Learning Representations, 2024. A The Use of Large Language Mo dels (LLMs) W e used large language mo dels (LLMs) only to aid or p olish the writing of this manuscript. They were not inv olved in idea generation, metho dological design, exp eriments, or analysis. All scientic conten t was created and veried b y the authors, who take full resp onsibility for the nal text. B Shortening Input Sequence Length at T est Time In Figure 1 (d) of Section 1 , we ha ve conrmed that training with longer sequences from scratc h does not pro vide additional benets. F urther, w e aim to in vestigate whether short- ening the input length at test time would decrease the performance of a mo del trained on longer sequences. Sp ecically , w e tested the Seq2Exp-soft model (Su et al., 2025) 1 trained on 200k sequences to ev aluate if reducing con text during inference aects p erformance. As sho wn in T able 4 , w e found that Seq2Exp, despite being trained on 200k inputs, shows minimal p erformance degradation when the input length is reduced from 200K to 2.5K dur- ing testing. This suggests that Seq2Exp fails to eectiv ely utilize long-con text information ev en during training, indicating that the mo del do es not genuinely leverage the extended sequence information it w as provided. 1 Mo del a v ailable at: https://huggingface.co/xingyusu/GeneExp_Seq2Exp/tree/main 14 Published as a conference pap er at ICLR 2026 In terestingly , how ev er, there is a signicant p erformance drop when inputs are shortened to 2,500 tok ens, with a particularly sharp decline observ ed below 2,100 tokens. W e attribute this b eha vior to an implementation detail in Seq2Exp: the mo del forcibly preven ts the cen tral 2,000-bp region from undergoing masking (this constraint was not mentioned in the Seq2Exp pap er but can b e found in their GitHub rep ository), eectiv ely forcing the mo del to fo cus predominan tly on the central 2,000 bp and proximal regulatory information. Based on these observ ations and comparing with Figure 1 , we can conclude that input con text length has a muc h smaller impact on model p erformance than epigenomic signals. Remo ving epigenomic signals during testing substan tially hurts p erformance, while short- ening sequence length has minimal eect. This nding motiv ates our fo cus on mo deling epigenomic information eectiv ely . T able 4: P erformance of Seq2Exp (Su et al., 2025) when testing with shortened input sequences on the K562 cell line. Input Length MSE ↓ MAE ↓ P earson ↑ 200000 0.1856 0.3054 0.8723 10000 0.1855 0.3074 0.8751 8000 0.1864 0.3082 0.8747 3000 0.1943 0.3134 0.8698 2500 0.1996 0.3174 0.8674 2100 0.2301 0.3471 0.8603 2070 0.3639 0.2464 0.8576 2050 0.3848 0.2686 0.8540 2040 0.4017 0.2855 0.8521 2030 0.4248 0.3093 0.8496 2020 0.4634 0.3543 0.8429 2010 0.5371 0.4506 0.8291 2000 0.6485 0.6183 0.8084 C Exp erimen tal Data of T able 1 W e provide comprehensive numerical results corresp onding to Figure 1 in the main text, including complete p erformance metrics and ablation studies. C.1 Sequence Length Sensitivit y T able 5 compares the p erformance stability of Seq2Exp and Caduceus across dierent input lengths. T able 5: P erformance comparison with v arying input lengths (left: Seq2Exp (Su et al., 2025), righ t: Caduceus (Schi et al., 2024)) Length MAE MSE Pearson 100 0.3394 0.2233 0.8441 500 0.3096 0.1879 0.8744 2000 0.3150 0.1971 0.8678 5000 0.3098 0.1949 0.8703 10000 0.3088 0.1897 0.8719 Length MAE MSE Pearson 100 0.3385 0.2200 0.8449 500 0.3096 0.1889 0.8716 2000 0.3036 0.1831 0.8747 5000 0.3170 0.1941 0.8692 10000 0.3235 0.2029 0.8550 C.2 Epigenomic Signal Con tributions T able 6 demonstrates that combining all epigenomic signals yields optimal p erformance, with H3K27ac sho wing the strongest individual impact. 15 Published as a conference pap er at ICLR 2026 T able 6: Caduceus p erformance with dierent epigenomic signal congurations Conguration MSE MAE Pearson r No signals 0.2163 0.3325 0.8485 +H3K27ac 0.1873 0.3080 0.8628 +DNase 0.2089 0.3227 0.8497 +Hi-C 0.2135 0.3264 0.8530 All signals 0.1886 0.3079 0.8652 C.3 Remo ve Signals at T est Time T able 7 rev eals critical signal dependencies. Remo ving H3K27ac during testing from a mo del trained on all signals degrades p erformance most severely (22.3% MAE increase), while Hi-C remo v al has minimal eect (4.7% MAE increase). T able 7: P erformance degradation from signal remov al (trained with all signals) Condition MAE MSE Pearson Drop H3K27ac 0.5653 0.6115 0.6964 Drop DNase 0.3890 0.2962 0.8189 Drop Hi-C 0.3548 0.2280 0.8467 Baseline (all signals) 0.3078 0.1886 0.8652 D Case Study and Quantitativ e Evidence of Widespread Background Confounders D.1 Quan titative Prev alence of Long-Range In teractions T o statistically v alidate the ubiquity of long-distance chromatin in teractions in the K562 and GM12878 cell lines – a core premise of our work – we conducted a tw o-fold analysis. This quan titative evidence establishes that the case study in Section D.2 is representativ e of a genome-wide signal-to-noise c hallenge. First, we analyzed promoter-cen tric Hi-C con tact data. F or eac h gene’s TSS, we examined its vector of Hi-C contact frequencies, dening a signicant interaction as any contact with a signal strength greater than 0.01. W e classied an interaction as “long-range” if the ge- nomic distance from the TSS exceeded 50kb. Second, to sp ecically quantify connections to putativ e regulatory elemen ts, w e analyzed pre-computed Promoter-Enhancer (P-E) linkages from the Activit y-b y-Contact (ABC) model, identifying all genes connected to at least one distal enhancer ( > 50kb a wa y). The results, presen ted in T able 8 , demonstrate that long-distance interactions are a ubiq- uitous feature of both genomes. Nearly all genes ( ∼ 99%) exhibit n umerous long-range con tacts, with a median of nearly 200,000 potential interaction partners p er gene. The ABC mo del data further conrms that virtually all genes are linked to at least one distal enhancer. This creates a signicant signal-to-noise problem, as the v ast n umber of in terac- tions indicated by Hi-C data cannot all b e causally determinative of gene expression, thus acting as bac kground confounders. D.2 Qualitativ e Case Study The statistical prev alence of in teractions motiv ates our h yp othesis that man y of these signals act as confounders rather than direct regulators. T o qualitativ ely supp ort this, we present a represen tative case (Figure 6 ) at a genomic lo cus (Entrez ID: ENSG00000080561). In this region, both DNase (c hromatin accessibilit y) and Hi-C (3D spatial proximit y) signals exhibit broad, high activ ation. Despite this p ermissive chromatin environmen t, the marker 16 Published as a conference pap er at ICLR 2026 T able 8: Statistical Summary of Hi-C Long-Range Interactions in K562 and GM12878 Cell Lines Statistic K562 GM12878 % of genes with promoter-interacting 1 98.9% 99.3% % of genes with long-range ( > 50kb) promoter 1 98.9% 99.3% % of genes linked to a distal enhancer via ABC mo del 2 100.0% 100.0% Median num b er of long-range partners p er gene 1 199,899 199,899 Median distance of long-range interactions (kb) 1 49,707.0 49,939.0 1 Statistics derived from promoter-centric Hi-C contact vectors. 2 Statistics derived from pre-computed ABC mo del P-E links. of active regulatory elemen ts, H3K27ac, shows no enrichmen t. Consequently , the gene expression lev el remains low (0.6021). This case demonstrates that high background signal activity alone is insucient to driv e gene expression. The absence of H3K27ac indicates that k ey regulatory elemen ts are inactive, resulting in minimal transcriptional output despite strong accessibilit y and spatial contacts. Figure 6: A representativ e genomic lo cus (Entrez ID: ENSG00000080561) where DNase and Hi-C signals are broadly active, but H3K27ac shows no enric hment. Despite strong c hromatin accessibility and spatial con tacts, gene expression remains low (0.6021). This supp orts the hypothesis that suc h p erv asiv e background signals (quan tied in T able 8 ) act as confounders rather than causal regulators. D.3 Conclusion and Motiv ation for Our Metho d T ogether, the quantitativ e data and the qualitativ e case reinforce the necessity of disam- biguating causal foreground signals (like H3K27ac) from p erv asiv e background confounders (lik e broad DNase and Hi-C signals) when mo deling gene expression. This p erv asive signal- to-noise problem directly motiv ates our approach of explicitly mo deling background signals through a Structural Causal Mo del and applying backdoor adjustmen t to correct for their confounding eects, thereb y improving b oth interpretabilit y and prediction accuracy . E Algorithm W orko w Here we provide the complete algorithm worko w for our Prism framework in Algorithm 1 . The algorithm initializes three neural net works: the signal enco der g θ , the predictor net- w ork h ϕ , and the confounder enco der g ω . During training, w e compute b oth standard and in terven tional predictions, then optimize the mo del using three ob jectiv es: prediction loss L 1 , interv ention loss L 2 , and uniform div ersity loss L 3 . 17 Published as a conference pap er at ICLR 2026 Algorithm 1 In terven tional F ramew ork for Gene Expression Prediction (Prism) Require: Gene sequence X , epigenomic signals S , gene expression Y , h yp erparameters α, β , t, n . Ensure: T rained mo del parameters θ , ϕ, ω . 1: Initialize parameters θ , ϕ, ω randomly . 2: while not conv erged do 3: //— F orward Pass — 4: H ← g θ ( S ) {Enco de epigenomic signals into features} 5: ˆ Y ← h ϕ ( X, H ) {Make standard prediction} 6: { a 1 , . . . , a n } ← g ω ( S ) {Learn confounder w eights representing C } 7: //— Interv entional Prediction via Backdoor Adjustmen t — 8: ˆ Y do ← 1 n n i =1 h ϕ ( X, H ⊙ a i ) {Apply bac kdo or adjustment} 9: //— Loss Computation — 10: L 1 ← ℓ H ( ˆ Y , Y ) {Standard prediction loss (Hub er loss)} 11: L 2 ← ℓ H ( ˆ Y do , Y ) {Interv ention loss (Hub er loss)} 12: ˜ a i ← a i / ∥ a i ∥ 2 for all i {L2-normalize w eight vectors} 13: L 3 ← log i,j exp(2 t · ˜ a T i ˜ a j − 2 t ) {Uniform diversit y loss} 14: L ← L 1 + α L 2 + β L 3 {T otal ob jective} 15: //— Backw ard Pass — 16: Update θ , ϕ, ω using gradient descent on L . 17: end while 18: return θ , ϕ, ω . F More Implementation Details F.1 T raining Settings Our training framew ork is implemented using PyT orch Lightning. All training-related hy- p erparameters w ere adopted directly from Seq2Exp (Su et al., 2025), whic h means w e did not perform extensiv e parameter tuning for our specic approac h. Consequently , there is p o- ten tial for further p erformance impro vemen ts through careful hyperparameter optimization. The complete set of h yp erparameters used in our exp eriments is presented in T able 9 . T able 9: Hyperparameter v alues following Seq2Exp (Su et al., 2025). Hyp erparameters V alues La yers of backbone 4 Hidden dimensions 128 Max training steps 50000 Batc h size 8 Learning rate 5e-4 Sc heduler strategy CosineLR with Linear W arm up Initial w armup learning rate 1e-5 Min learning rate 1e-4 W arm up steps 5,000 V alidation mo del selection criterion v alidation MSE F.2 Implemen tation Details of Confounder Enco der Our confounder enco der g ω is implemented as a light weigh t 1D-CNN that maps ra w epige- nomic signals S ∈ R L × d to weigh t vectors A ∈ R n × d ′ . The arc hitecture consists of a three-la yer CNN follow ed b y a pro jection lay er: 18 Published as a conference pap er at ICLR 2026 • La y er 1: Con v1D (in_c hannels= d , out_c hannels=8, k ernel_size=7) follow ed by Batc hNorm, ReLU, and MaxPool (kernel_size=4) • La y er 2: Conv1D (in_channels=8, out_c hannels=16, k ernel_size=5) follow ed by Batc hNorm, ReLU, and MaxPool (kernel_size=4) • La y er 3: Conv1D (in_channels=16, out_channels=32, kernel_size=3) follo wed by Batc hNorm, ReLU, and MaxPool (kernel_size=4) • Global Pooling: Adaptiv eA vgPool1D(1) follow ed by Flatten • Projection: Linear lay er mapping the attened features (32 dimensions) to n × d ′ dimensions The progressive reduction in sequence length through max p o oling operations (b y a factor of 64 in total) eciently captures patterns at dierent genomic scales while signican tly reducing the computational ov erhead. After obtaining the raw weigh ts, we apply a sigmoid activ ation function to constrain the v alues b etw een 0 and 1, making them suitable for w eight- ing the epigenomic signals via the Hadamard pro duct op eration. This light weigh t design adds minimal parameters to the ov erall mo del while eectiv ely mo deling the bac kground epigenomic regulatory patterns. The entire enco der requires only 11K parameters, which is negligible compared to the bac kb one mo del’s parameter count. F.3 Implemen tation Details of the Predictor In practice, b oth the DNA sequence X and the weigh ted epigenomic signal H ⊙ a i are rst indep enden tly projected to the mo del’s hidden dimension d ′ via separate linear lay ers (the signal encoder g θ and the sequence input pro jection, resp ectively), and then com bined via elemen t-wise addition b efore b eing fed into the Caduceus backbone. F urthermore, when computing the in terven tional prediction ˆ Y do (Equation 3 ), rather than a veraging n separate end-to-end predictions, w e av erage the in termediate backbone rep- resen tations across the n con texts before applying the shared prediction head. F ormally , ˆ Y do = h head ϕ 1 n n i =1 h bo dy ϕ ( X, H ⊙ a i ) , where h bo dy ϕ denotes the Caduceus backbone and h head ϕ denotes the prediction head. This representation av eraging is a standard and com- putationally ecient approximation, and closely approximates the form ulation in the main text, with the t wo b eing exactly equiv alen t when the prediction head is linear. G The eect of pre-training Our main exp eriments follow Seq2Exp Su et al. (2025), where all models are trained from scratc h without pre-training. T o further inv estigate whether DNA mo del pre-training b ene- ts gene expression prediction, we conducted exp erimen ts using pre-trained Enformer (pre- trained on 200k sequences) and Caduceus (pre-trained on 131k sequences) with signals, as sho wn in T able 10, to examine the eectiveness of long-context pre-training. Ov erall, w e nd that pre-training provides consistent impro vemen ts. F or Enformer, the impro vemen t is marginal. F or Caduceus, whic h was pre-trained on 131k sequences, load- ing pre-trained weigh ts b efore ne-tuning on 200k gene expression prediction tasks yields substan tial improv ements, with Pearson correlation notably improving by 0.0113. How ev er, the eect of pre-training mirrors that of Seq2Exp—it can only mitigate the performance degradation caused by extended sequence length, rather than making long-context mo dels sup erior to short-con text ones. When w e use only 2k input length, pre-training also pro vides some impro vemen t, but this impro vemen t is relativ ely modest. The absolute MSE impro vemen t is particularly negligible. W e also exp erimented with loading pre-trained Caduceus w eights for Prism training and found that it achiev es stable impro vemen ts while Prism con tinues to main tain state-of-the- art p erformance. Notably , pre-training signicantly impro ves Pearson correlation, while MSE sho ws minimal change. 19 Published as a conference pap er at ICLR 2026 T able 10: The eect of pre-training Mo del Metric F rom Scratch Pre-trained Enformer MSE ↓ 0.2920 ± 0.0050 0.2913 ( ↓ 0.0007) ± 0.0209 P earson ↑ 0.7961 ± 0.0019 0.7983 ( ↑ 0.0022) ± 0.0229 Caduceus w/signals (2k input) MSE ↓ 0.1863 ± 0.0035 0.1858 ( ↓ 0.0005) ± 0.0082 P earson ↑ 0.8713 ± 0.0023 0.8759 ( ↑ 0.0046) ± 0.0042 Caduceus w/signals (200k input) MSE ↓ 0.1959 ± 0.0036 0.1897 ( ↓ 0.0062) ± 0.0026 P earson ↑ 0.8630 ± 0.0008 0.8743 ( ↑ 0.0113) ± 0.0030 Prism MSE ↓ 0.1789 ± 0.0041 0.1795 ( ↑ 0.0006) ± 0.0061 P earson ↑ 0.8751 ± 0.0036 0.8774 ( ↑ 0.0023) ± 0.0018 Therefore, our conclusion is that long-con text pre-training can substan tially improv e long- con text capabilities, but this improv ement only mitigates the p erformance degradation inher- en t to long-con text models, while providing only marginal impro v ements for short-context mo dels. H Extended Analysis with Additional Epigenomic Signals T o comprehensively ev aluate the eectiveness of dieren t epigenomic signals in gene expres- sion prediction, we conducted additional exp eriments on the K562 cell line using signals b ey ond the three primary ones (H3K27ac, DNase-seq, and Hi-C) emplo yed in our main analysis follo wing Lin et al. (2024); Su et al. (2025). H.1 A dditional Signal Descriptions W e incorp orated three additional epigenomic signals with distinct biological functions: H3K4me3 (ENCODE ID: ENCFF405ZDL): A histone modication signal that sp ecically marks activ e promoter regions with high precision, complementing H3K27ac which marks b oth promoters and enhancers with broader co verage. DNase fo otprint (ENCODE ID: ENCSR000EOT): High-resolution protein-DNA binding fo otprin ts derived from DNase-seq data, identifying exact transcription factor binding sites within accessible c hromatin regions through computational algorithms. ChIA-PET (ENCODE ID: ENCFF278RFG): Protein-mediated chromatin in teraction data that captures functionally relev ant long-range con tacts, pro viding more targeted information compared to genome-wide Hi-C in teractions. Signal pro cessing follow ed standard protocols: H3K4me3 and ChIA-PET used direct bigwig signal v alues, while DNase fo otprint regions from bigbed annotations w ere encoded as binary signals (1 for annotated regions, 0 elsewhere). H.2 Individual Signal Analysis T able 11 presents the p erformance of Caduceus with individual signals. Most signals demonstrate improv ements ov er the no-signal baseline, with H3K4me3 showing the most substan tial enhancement (MSE: 0.1801, Pearson: 0.8781). ChIA-PET show ed degraded p erformance, lik ely due to high noise lev els in the raw data. DNase footprint p erformed comparably to DNase-seq, suggesting limited additional information conten t despite higher theoretical resolution. The sup erior p erformance of H3K4me3 and H3K27ac aligns with their roles as direct indicators of active regulatory elements, supp orting our categorization as foreground signals with stronger causal relationships to gene expression. 20 Published as a conference pap er at ICLR 2026 H.3 Comp ositional Signal Eects T able 12 examines the eects of combining multiple signals. Adding DNase fo otprint to the initial three signals provides minimal improv ement, consistent with its deriv ation from DNase-seq data. How ev er, incorp orating H3K4me3 yields substan tial p erformance gains across all metrics. Most notably , Prism with H3K4me3 integration achiev es the b est p erformance (MSE: 0.1719, represen ting a 0.0137 improv emen t ov er Seq2Exp baseline). This demonstrates that Prism’s causal interv en tion framework maintains robust impro vemen ts even when strong individ- ual signals lik e H3K4me3 are presen t, suggesting that the metho d eectively disentangles gen uine regulatory signals from confounding background eects. H.4 Key Findings Our extended analysis reveals sev eral important insigh ts: First, signals with direct regula- tory roles (H3K4me3, H3K27ac) provide greater predictiv e v alue than bac kground accessi- bilit y signals. Second, computationally deriv ed signals like DNase fo otprint oer limited additional information b ey ond their source data. Third, Prism consisten tly outp erforms baseline approaches across dierent signal com binations, v alidating the robustness of our causal interv ention framework. These ndings support the importance of careful signal se- lection and highlight the p otential for further improv ements through strategic integration of complemen tary epigenomic data types. T able 11: Single Signal Input (Caduceus w/signals (2k input)) Signal MSE ↓ MAE ↓ P earson ↑ No Signal 0.2215 ± 0.0086 0.3342 ± 0.0081 0.8502 ± 0.0026 H3K27ac 0.1986 ± 0.0059 0.3179 ± 0.0054 0.8645 ± 0.0037 DNase-seq 0.2207 ± 0.0060 0.3342 ± 0.0085 0.8530 ± 0.0037 Hi-C 0.2202 ± 0.0045 0.3330 ± 0.0064 0.8489 ± 0.0039 H3K4me3 0.1801 ± 0.0079 0.3084 ± 0.0099 0.8781 ± 0.0018 ChIA-PET 0.2262 ± 0.0062 0.3387 ± 0.0060 0.8422 ± 0.0059 DNase fo otprin t 0.2186 ± 0.0073 0.3300 ± 0.0045 0.8523 ± 0.0044 T able 12: Eect of Comp ositional Signal Input (Mo dels with 2k input) Model Conguration MSE ↓ MAE ↓ Pearson ↑ Caduceus w/signals (initial 3 signals) 0.1863 ± 0.0035 0.3092 ± 0.0050 0.8713 ± 0.0023 Caduceus w/signals (initial 3 signals + DNase fo otprint) 0.1870 ± 0.0059 0.3092 ± 0.0058 0.8703 ± 0.0026 Caduceus w/signals (initial 3 signals + H3K4me3) 0.1789 ± 0.0122 0.3067 ± 0.0117 0.8804 ± 0.0101 Caduceus w/signals (initial 3 signals + DNase fo otprint + H3K4me3) 0.1762 ± 0.0054 0.3072 ± 0.0031 0.8837 ± 0.0024 Prism (initial 3 signals) 0.1789 ± 0.0041 0.3000 ± 0.0058 0.8751 ± 0.0036 Prism (initial 3 signals + DNase fo otprint) 0.1794 ± 0.0064 0.2996 ± 0.0055 0.8752 ± 0.0042 Prism (initial 3 signals + H3K4me3) 0.1719 ± 0.0070 0.2969 ± 0.0049 0.8839 ± 0.0035 Prism (initial 3 signals + DNase fo otprint + H3K4me3) 0.1730 ± 0.0055 0.3005 ± 0.0051 0.8850 ± 0.0020 21 Published as a conference pap er at ICLR 2026 I Cross-cell Generalization Our main exp eriments follow EPInformer (Lin et al., 2024) and Seq2Exp (Su et al., 2025) in training separate mo dels for each cell type. T o ev aluate whether a single mo del can generalize across cell t yp es, we conducted a mixed-training experiment com bining K562 and GM12878. Specically , during training, for eac h gene w e randomly sample either its K562 or GM12878 epigenomic signals and corresp onding expression v alue. The T able 13 b elow sho ws that this mixed mo del achiev es comparable p erformance to cell-type-sp ecic mo dels. T able 13: P erformance of mixed-training Dataset Mo del MSE ↓ MAE ↓ P earson ↑ K562 Seq2Exp (cell-sp ecic) 0.1856 ± 0.0032 0.3054 ± 0.0024 0.8723 ± 0.0012 K562 Prism (cell-sp ecic) 0.1789 ± 0.0041 0.3000 ± 0.0058 0.8751 ± 0.0036 K562 Prism (mixed-training) 0.1875 ± 0.0085 0.3084 ± 0.0077 0.8662 ± 0.0049 GM12878 Seq2Exp (cell-sp ecic) 0.1873 ± 0.0044 0.3137 ± 0.0028 0.8951 ± 0.0038 GM12878 Prism (cell-sp ecic) 0.1759 ± 0.0054 0.3054 ± 0.0048 0.9016 ± 0.0024 GM12878 Prism (mixed-training) 0.1759 ± 0.0038 0.3027 ± 0.0041 0.9012 ± 0.0032 J P erformance across Dierent Input Lengths W e ha ve explored ho w p erformance c hanges with v arying sequence lengths. In T able 14 b elo w, we presen t the Pearson correlation results for Caduceus w/signal (Schi et al., 2024), Seq2Exp (Su et al., 2025), and Prism on K562 across dierent input lengths ranging from 100 to 10,000 bp. T able 14: P earson across dierent input lengths on K562 Input Length Caduceus w/signal Seq2Exp-soft Prism ( α = 1) Prism ( α = 2) 100 0.8488 ± 0.0042 0.8492 ± 0.0064 0.8493 ± 0.0056 - 500 0.8719 ± 0.0043 0.8694 ± 0.0051 0.8726 ± 0.0045 - 2000 0.8713 ± 0.0023 0.8643 ± 0.0088 0.8751 ± 0.0036 - 5000 0.8662 ± 0.0035 0.8675 ± 0.0035 0.8690 ± 0.0037 - 10000 0.8614 ± 0.0059 0.8699 ± 0.0032 0.8661 ± 0.0027 0.8699 ± 0.0023 As shown in T able 14, Prism exhibits a similar trend to Caduceus, with p erformance b egin- ning to decline when input length increases b eyond 2000-5000 bp. While Seq2Exp main tains relativ ely robust p erformance across lengths, their rep orted results at 200k only matc h the p erformance of Caduceus at 500-2000 bp, v alidating our claim that Seq2Exp merely miti- gates the performance degradation caused b y extending sequence length in Caduceus. Prism ac hieves the b est performance among all three models across lengths from 100 to 5000 bp. W e h yp othesize that as input length increases, the confounding eects of background signals b ecome stronger. T o test this, we experimented with increasing the interv en tion loss weigh t to α = 2 when the input length reaches 10,000 bp, and observed p erformance impro vemen t. K P erformance on H1 Cell Line W e conducted additional experiments on the H1 cell line (whic h only app eared in Seq2Exp’s rebuttal stage but was not included in their nal camera-ready version). The results are sho wn in T able 15 b elow. 22 Published as a conference pap er at ICLR 2026 T able 15: P erformance on H1 cell line Metho d MSE ↓ MAE ↓ P earson ↑ Caduceus w/signal (2k input) 0.2751 ± 0.0104 0.3929 ± 0.0103 0.6681 ± 0.0137 Seq2Exp-soft (our repro duction) 0.2784 ± 0.0064 0.3957 ± 0.0045 0.6595 ± 0.0089 Prism 0.2642 ± 0.0060 0.3817 ± 0.0044 0.6844 ± 0.0078 On H1, Seq2Exp performs w orse than the Caduceus baseline, while Prism consistently ac hieves SOT A results across all metrics. These results on a third cell line further demon- strate the consisten t improv ements of our approac h. L Learning Confounder W eigh ts without Sup ervision Unsup ervised learning of chromatin states is a well-established approach in genomics, such as ChromHMM (Ernst & Kellis, 2017). ChromHMM denes states based on combinatorial patterns of epigenomic marks without explicit lab els, which are subsequently mapp ed to biological chromatin states through expert annotation. Similarly , although our confounder w eights are learned without supervision, Figure 5 in our man uscript shows that the mo del captures structured, gene-sp ecic patterns rather than random noise. This suggests the mo del may learn meaningful latent states driven by the prediction task, which could p oten- tially be v alidated with the assistance of biological experts like ChromHMM (Ernst & Kellis, 2017). W e distinguish our approach from naive data augmentation. The fundamental dierence is that our weigh ts are learnable and gene-dep endent, whereas naive augmen tation relies on random p erturbations. While random augmentation is eectiv e in domains like computer vision, apply ing it to biological signals carries the risk of destroying critical information. T o v alidate this distinction, w e rst conducted a dropout experiment on the Caduceus baseline, where input signals are randomly discarded during training. Here, w e dene the reten tion rate as the prop ortion of signals preserved (i.e., 1 - dropout probabilit y). W e observ ed that p erformance degrades signicantly as the retention rate decreases. As shown in T able 16 b elow, keeping only 70% of signals results in a notable p erformance drop, and k eeping 50% degrades the MSE further to 0.2248. In con trast, we further ev aluated our approac h by using the learned weigh ts to elemen t-wise multiply the ra w high-dimensional signals for prediction. W e found that the a verage weigh t v alues on the K562 test set is appro ximately 0.35, whic h corresp onds to an av erage retention rate of approximately 35%. Ho wev er, unlike the random drop out baseline, our mo del maintains robust p erformance despite this high sparsit y . This demonstrates that the learnable w eights are meaningful, selectiv ely preserving essential biological information. T able 16: Comparison of drop out and learned weigh t metho ds Mo del MSE ↓ MAE ↓ P earson ↑ Caduceus w/ Drop out (rate = 0.9) 0.1874 ± 0.0074 0.3062 ± 0.0064 0.8702 ± 0.0026 Caduceus w/ Drop out (rate = 0.7) 0.2059 ± 0.0075 0.3199 ± 0.0010 0.8625 ± 0.0041 Caduceus w/ Drop out (rate = 0.5) 0.2248 ± 0.0115 0.3428 ± 0.0119 0.8446 ± 0.0109 Prism w/ Learned W eights (rate ≈ 0.35) 0.1834 ± 0.0092 0.3032 ± 0.0083 0.8745 ± 0.0061 23
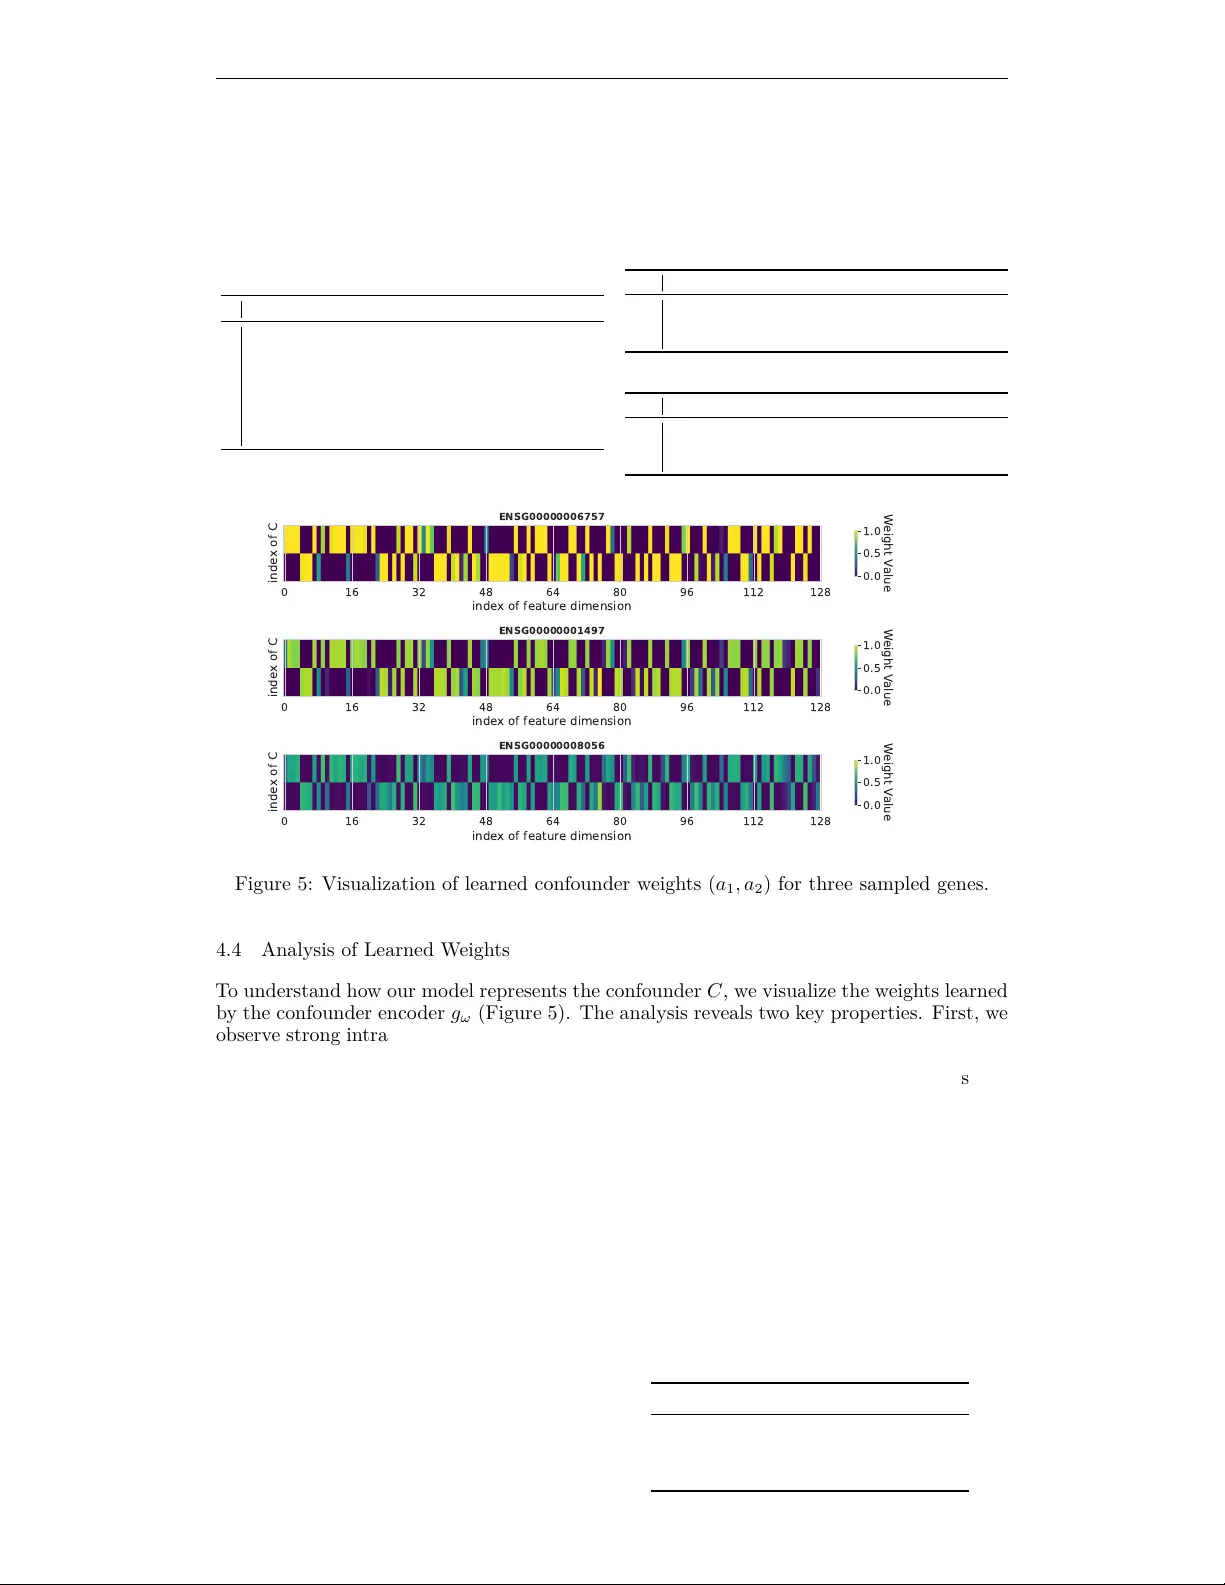
Original Paper
Loading high-quality paper...
Comments & Academic Discussion
Loading comments...
Leave a Comment