Comparative Analysis of Deep Learning Architectures for Multi-Disease Classification of Single-Label Chest X-rays
Chest X-ray imaging remains the primary diagnostic tool for pulmonary and cardiac disorders worldwide, yet its accuracy is hampered by radiologist shortages and inter-observer variability. This study presents a systematic comparative evaluation of se…
Authors: Ali M. Bahram, Saman Muhammad Omer, Hardi M. Mohammed
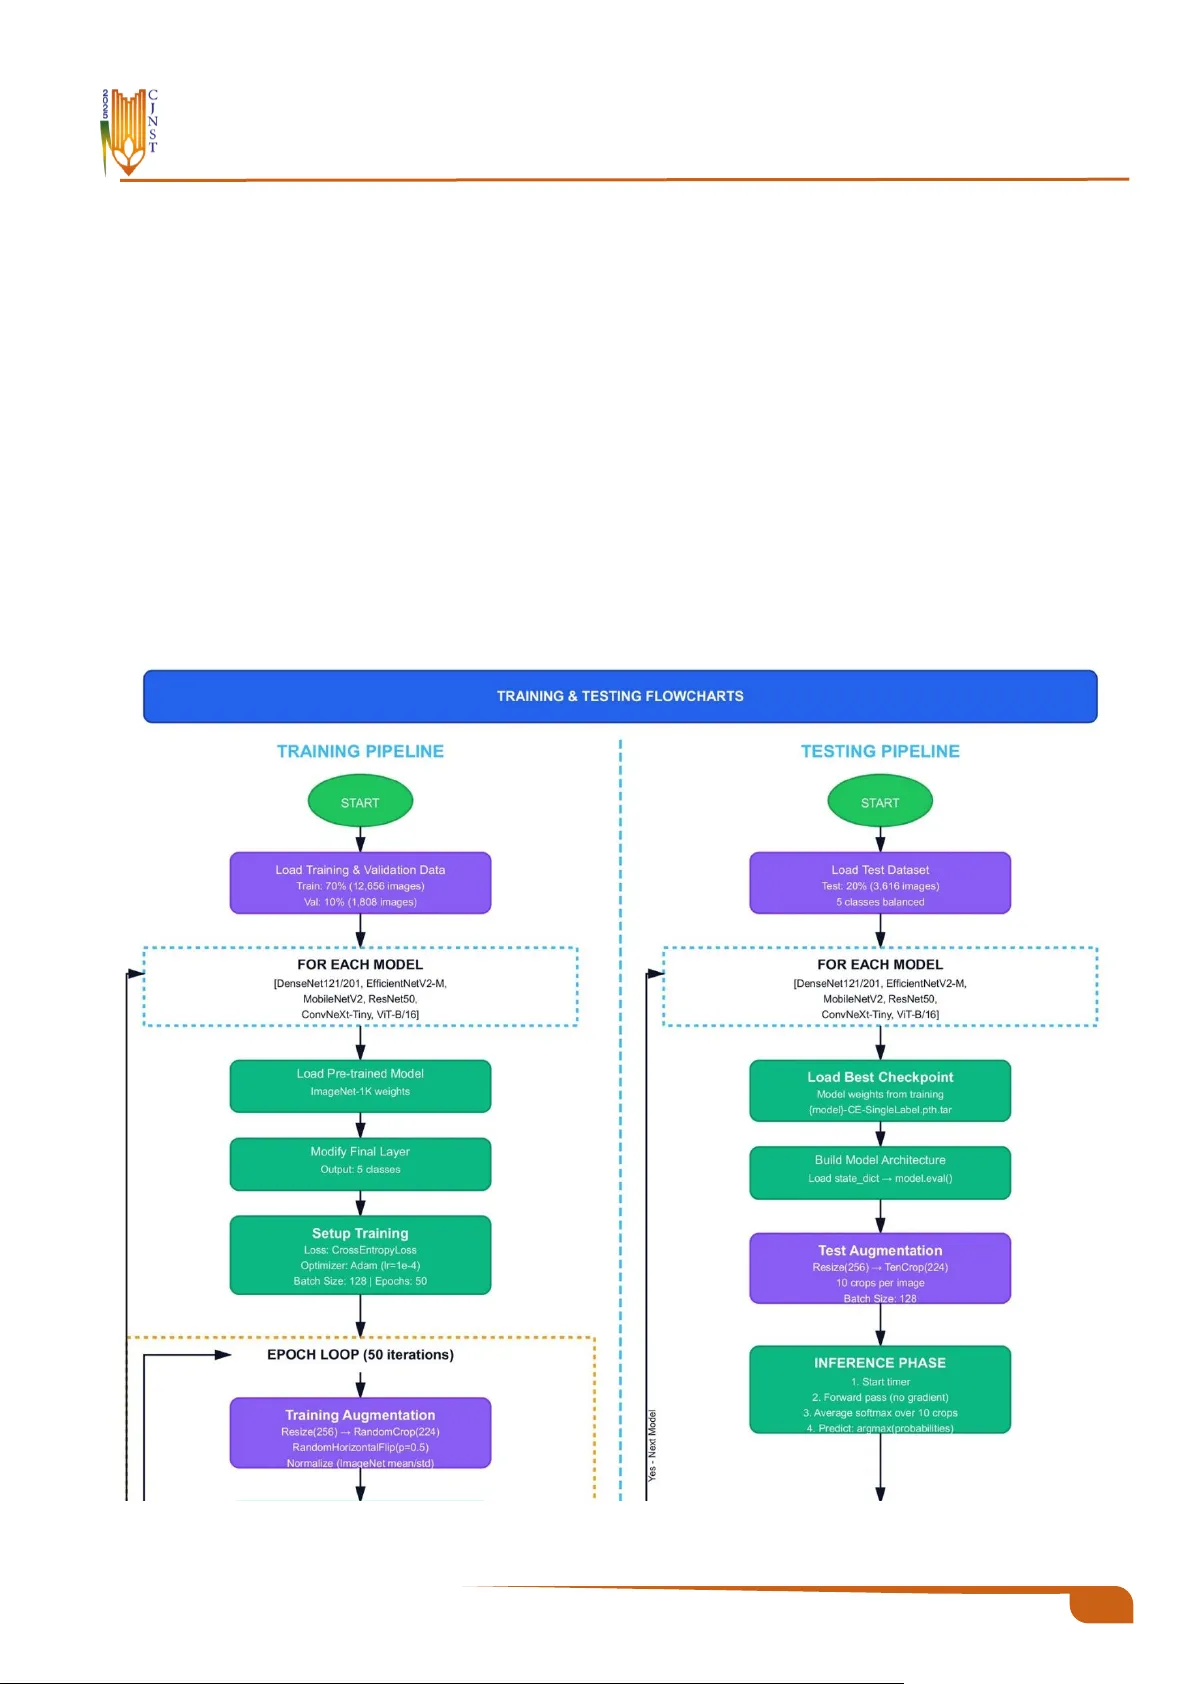
Charmo Journal of Natural Sciences and Technologies (CJNST) 10 CJNST 2025, Vol . 2 , I ssue 1, pp. 1 0 – 28 https://cjnst.chu.edu.iq/ Research Article : Comparative Analysis of Deep Learning Architect ures for Multi -Disease Classifica- tion of Single-Label C hest X-rays Ali M . Bahram 1 , Saman Muhammad Omer 2 , Hardi M. Mohammed 1 1 Department of Computer Science, College of Science, Charmo University, 46 023 Chamchamal, Kurdistan Region, Iraq 2 Department of Software Engineering, Un iv ersity of Rap arin, Ranya, Kurdistan Region, Iraq https://doi.org/10.31530/cjnst.2026.2.1.2 Abstract Background : Chest X-ray imaging has been the most widely used diagnostic technique for pulmonar y and cardiac disorders in healthcare systems around the world, owing to its low cost and ease of use. H owever, the accuracy of the diagnosis is seve rely hampered by a lack of radiologists and inter -obse rver va r- iability, which is exacerbated by resource-constrained circumstances. Even though deep learning methods for disease classification have shown great promise, there has been a lack of rigorous comparative evaluations of contem- porary a rchitectures f or prediction using balanced multi -class chest disease data. Aims : This work examines s even popular deep learning models for multi -class Chest X-ray classification, with an emphasis on trade -offs between perfor- mance indicators and computational efficiency. The findings would in form de- ployment decisions in healthcare settings with diverse resource availability. Methodology : The architectures studied were ConvNeXt-Tiny, DenseNet121, DenseNe t201, ResNet50, Vision Transformer (Vi T-B/16), EfficientNetV2-M, and Mobile NetV2. A comprehensive datase t was generated from existing re- positories, consisting of 13, 108 training photos, 1,455 validation images, and 3,517 test im ages for five conditions: C ardiomegaly, COVID-19, Normal , Pneumonia, and Tuberculosis. All models were initialize d with ImageNe t-pre- trained weights and trained under consistent se ttings, including standardized preprocessing, data augmentation, a nd optimization hyperparameters. To e val- uate model performance, we used metrics such as AUROC, overall accuracy, precision, recall, F1-score, and computational efficiency. Results : All seven studied designs achieved te st accuracies that exceeded 90%. ConvNeXt Tiny performed well, with a validation AUROC of 98.64% and a test accuracy of 92.31%. Re sNet50 foll owed closely with 92% test accuracy, while ViT -B/16 earned 91.87%. Notably , Mobile NetV2 emerged a s the most parameter-efficient Net alternative, with only 3.50 million parameters. Des pite its s mall size, it achieve d a test AUROC of 94 .10% a nd obtaine d the highest efficiency rating in our study. This lightweight architecture achieved around 98.3% of the accuracy of the best-performing mod el while using 87.5% fewer parameters, which has important implications for deployment in resource-con- strained contexts. Conclusion : The current findings show that excellent accuracy in multi -dis- ease categorization of Ches t X-ray p ictures is possible without requiring sig- nificant computational resources. This finding has important implications for the practical integration of deep lea rning as a diagnostic aid in a variety of healthcare settings, both resource-rich and res ource-constrained. Furthermor e, choosing a suitable architecture should consider th e available infrastructure as well as the unique characteristics of each deployment scenario. Keyword s : Deep Lea rnin g, Chest X- ray, M edica l Im agin g, Tra nsf er Lea rn- ing , Diseas e Clas sifi cati on. Received: 18 November 2025 Revised: 15 December 2025 Accepted: 21 January 2026 * Corresponding author info : Ali M. Bahr am (ali.m.bahram@sp u.edu.iq) Copyright © 202 6 Ali M . Ba hram, Saman Muha mmad Omer, Hardi M . Moh ammed, Charmo Journal of Natural Sciences (CJNS). This is an open access article p ublished under the terms of the Creativ e Co mmons Attribution License (CC BY 4.0), which permits use, distribution, and reprodu ction in any medium, provided the original work is properly cite d. 12 CJNST 2025, Vol. 2, Iss ue 1, pp. 10 – 28 1. Introduction One of the health problems, which ranks highest in the world, is chest disease, where hundreds of millions of peo- ple are diagnosed every year, and they carry significant so- cial and economic implications. The dis eases are high-mor- bidity and high- mortality illnesses , including res piratory and heart inf ections. Some of the most important ones are Pneumonia , Tuberculosis (TB), COVID- 19, and Cardio- megaly due to the number of deaths they cause. The WHO estimates a world death toll of about 2.5 million an nually as a result of Pneumonia, with nearly 700,000 of these being children below the age o f five years [1]. TB is among the most serious global crises, where 10.6 million infected in- dividuals are diagnosed, and 1 .3 million deaths are reported in 2022, in South-East Asia and Afr ica [2] . Despite being relatively new, COVID-19 has already claimed the lives of millions of people and is plac ing a burden on the h ealthcare systems of the wor ld [3]. As a little-known fact among the population, Cardiomegaly us ually presupposes cardiac fail- ure and early death [ 4]. All of these statistics suggest the need to introduce high -quality, affordable, and comprehen- sive diagnostic methods for chest diseases . Radiography is not the only diagnostic pathway that can be used to diagnose Pneumonia ; other non‑radiographic di- agnostic methods include cross- sectional imaging, which can be Computed T omography (CT) and Magnetic Reso- nance Imaging (MR I), infectious causes , which may in- volve sputum culture and blood analysis, and cardiac as- sessment, which may include echocardiography [5]. T he first-line diagnos tic method is Ches t X-ray (CXR), which is readily available and cost-e ffective, particularly in facilities with limited r esources [6]. However, the manual subjective interpretation can be erroneous. Radiographic appearances often over lap with disease appearances , e.g. , patchy opaci- ties in TB and Pneumonia; other factors, s uch as th e radiog- rapher's experience, workload, and fatigue, also contribute to inter-observer variation [ 7], [8]. The consequence s of such restrictions include delayed or m issed diagnos es, espe- cially in high-volume clinical settings. The importance of this study is that it addresses critical issues in diagnos is by leveraging advanced Artif icial Intelligence (AI ) techniques that deliver cons istent, rapid, and precise disease classifica- tion, especially in healthcare settings with scarce resources and limited diagnostic knowledge. Over the last decade, medical im age recognition has seen a revolution as AI, and more p recisely, Deep Learning (DL), has replaced manual interpretation by r adiologis ts. Convolutional Neural Networks (CNNs) and hybrid net- works can also detect f iner image details that the naked eye cannot and evaluate a radiologist's perfor mance in special- ized diagnos tics [9], [10] [11]. CheXNet (Dens eNet-121) is notable f or achieving high ac curacy on the detection of Pneumonia in the NIH C hestX-ray14 datas et, leading to the subseque nt research on AI-assisted interpretation of CXRs [12]. Later models, such as E fficientNet and CNN-Trans- former hybrids, were used to improve feature representa- tions and generalization [13 ], [14 ]. Their existence notwit h- standing, the multi -clas s classification of chest diseases often results in reduce d performance due to feature overlap, class similarity, and class imbalance, undersc oring the ne ed for balanced datasets to ensure f air and accurate diagnoses , which is crucial f or healthcare professionals and AI devel- opers [ 15]. Only a few studies directly compared modern CNN and Transformer architectures under the same training conditions on a balanced multi -clas s CXR dataset. A principal cha llenge is c onstructing robust datasets f or categorizing chest images. Some publicly ava ilable datasets include NIH ChestX-ray14 [16] COVID-19 Radiography Database [ 17], and Mendeley Tuberculosis Databas e [18] They differ in ter ms of image qua lity, label consistenc y, and classification. Typical cases ar e frequently ove rrepres ented, whereas Cardiomegaly and T uberculosis are under repre- sented, resulting in a datase t imbalance that can enable mod- els to overfit on m ajority class es while underperforming on minority classes , raising concerns about clinical dependa- bility [19], [20]. Such skewed data can bias models to pr o- duce deceptively high accuracy but low recall f or minority classes. T o address this, our study uses measurements such as F1- score and recall, which more acc urately refle ct model performance across all classes, parti cularly underrepre- sented disorder s, assuring therapeutic relevance [ 21] , [22] . Variations in imaging device s, expos ure c onditions, and an- notation standa rds between datasets li mit cross-domain generalization and incr ease complexity in the actual world for practical applications. We use cross-dataset v alidation and domain adaptation strategies to impr ove model robust- ness and clinical applicability [23]. As a result, prepro- cess ing, balancing, data gr owth, and robust optimization are critical for creating dependable AI systems for CXR analy- sis [24] , [25]. This study makes the following key contributions: • We construct a balanced and unified five-class Ch est X- ray datase t by int egrating multiple public repositories, ef- fectively addr essing class im balance while pre serving the diversity representative of real clinical practice . • The study systema tically evaluates state -of-the-art CNN and transformer-based models to identify the most clini- cally viable approach for multi-diseas e C hest X- ray clas- sification. • The CheXNet protocol is reformulated f rom a multi-la- bel to a single-label disease classification framework, improving interpretability and clinical applicability. The rest of this paper is organized a s follows . Section 2 reviews the related literature on AI-bas ed Ches t X- ray clas- sification. Section 3 describes the dataset, preprocessing steps, and the pr oposed framework. Section 4 presents and discusses the experimental r esults. Finally, Section 5 con- cludes the paper and outlines future perspectives. 2. Related Work Deep learning in the analysis of chest radiogr aphs has advanced significantly in the last f ew years. T he studies in this field ha ve take n s everal di rections simultaneously, such as architectural advancement, improved c omputational effi- ciency, and the development of multi-diseas e classification features. The in itial s tudies determined that CNNs would be 13 CJNST 2025, Vol. 2, Iss ue 1, pp. 10 – 28 as e ffective as radiologists practicing on e ach specific diag- nostic task with suitably large da tasets [26]. T his initial suc- cess trigger ed extensive f urther research, but mos t of the work done has focused on testing a single architecture or comparing just a few models under dif ferent experimental conditions. As a result, the systematic evaluation of archi- tectural trade-offs and their clinical impleme ntation has not yet been thoroughly carried out. More recent attempts have sought to replicate and r e- fine these basic methods [27]. Much valuable information about the consistency and generalizability of the previous results has been obtained f rom these reproduction studies. However, they have also demonstrated the difficulties of achieving consistent performance across datasets and pre- processing protocols. 2.1. Mode rn CNN Architectu re and EfficientNet Networks The architecture of CNNs has undergone several changes to impr ove accuracy and efficiency. E ffic ientNet proposed a principled way to scale up a model: it optimizes the model architecture by balancing network depth, width, and resolution using compound coefficient optimization [28]. This compound -sc aling approach showed tha t coordi- nated scaling a cross 3 dimensions yields higher perfor- mance than arbitrary scaling of each aspect. E ffi cientNet applications in medical im aging, especially Che st X-ray classification, have demons trated strong competitiveness while requiring significantly lower computational resources than previous architectures [29], so they a re instrumental in resource-constrained clinical settings. ConvNeXt is a modern architecture aiming to update the standard convolutional a rchitectures with desig n princi- ples of Vision T ransformers without sacrificing the effi- ciency and simplicity of CNNs [30]. Through sys tematic study and adaptation of des irable features of transformer ar- chitectures, such as adapted training regimes, macro design motifs, and inverted bottleneck architectures, C onvNeXt has shown that pure convolutional networ ks can compete with transformer-based architectures on seve ral computer vision tasks. This architecture br idges the gap between clas- sical CNNs and contemporary tr ansformers, offering an in- teresting alternative f or medic al image analysis, whe re both precision and computational efficiency matter. 2.2. Vis ion Transformers in Medical Imagin g With the introduction of Vis ion Transformers (ViT), at- tention-base d processes have emerged as a viable alterna- tive to the standa rd convolutional paradigm for im age anal- ysis [31]. Unlike CNNs, which extract local features in a hierarchical sequence, tr ansformers utilize self-attention to construct long-range depe ndencies throughout the e ntire image domain, potentially exposing subtle diagno stic pat- terns across several anatomical locations. Rec ent investiga- tions have thoroughly investigated the usage of trans form- ers in medical imaging [32], demonstrating their perfor- mance in a variety of diagnostic tasks , including segmenta- tion, class ification, and detection. However, these studies highlight substantial trade-offs: transformer s fr eque ntly re- quire larger training corpora than CNNs to achieve comparable performance, as well as gr eater process ing r e- sources for both training and inference. Comparisons of CNNs a nd trans former s in medical im- age classification have r evealed subtle performance differ- ences [33]. Transformers are also excellent encoders of global context and long-range spatial relationships , which help detect diffuse pathological patterns in chest radio- graphs. Still, they can fail on small medical image datas ets, where CNNs' inductive biases are more useful. The r esults highlight that architectural choices must not rely solely on accuracy measures but also on data acces sibility, co mputing capabilities, and diagnostic needs. 2.3. Multi-Class Class ification of Chest Diseases Multi-class classification of chest diseases is not as straightforward as in binary d isease detection or m ulti-label classification. Another lightweight six-layer conv olutional neural network specifically trained to classify six thoracic conditions was presented in [33], achieving 80% accuracy on multi-clas s tasks and 97.9% on binary Pneumon ia detec- tion. This paper has shown that task-reconfigurable light- weight architectures can be clinically acceptable and con- sume significantly less computational r esources than more complex networks. In a parallel study, a variety o f architec- tures, including VGG16, InceptionResNetV2, and a home- built CNN, were tested to identify differences between COVID-19, Pneumonia, and Normal cases [ 34]. T he cus- tom network achieved 97% accuracy and 98. 21% reported sensitivity to the evaluation set. In [35], the study achieved a validation accuracy of 98.72 %. Although the per formance figures in these studies were impres sive in their respective tasks, they tested only one or two architectures each, which provides little insight into the performance of different de- sign philosophies and architectural approaches under simi- lar experimental conditions. 2.4. Hybrid and Ensemble Approaches Hybrid and ensemble strategies have been studied to combine mul tiple learning mechanisms or model types to leverage complementary strengths. Nair and Singh were the first to use CNN-LSTM to combine spatial and temporal features [36] , achieving 99% recall and 94% F1-score on six thoracic disea ses. Likew i se, Sharma and Kamble i ntegrated CNN with LSTM models [ 37], obtaining an accuracy of 98.5% with mu lti-class Chest X-ray classification and demonstrating the ability of hybrid structures to both learn spatial and temporal information of medical images. A dif- ferent approach and combined tr ansfer learning were used with generative adversarial networks to address data scar- city in C OVID-19 detection [38], [39 ], with the accuracy of 98% and successful data augmentation. Ensemble learning is used to combine handcrafted features with deep learning classifiers [40], which achieved 98% accuracy at a lower computational cost than deep learning alone. Kn owledge distillation is used to build small student networks [41], with an accuracy of 96.08% and a significantly smaller model size and lower computation. The fusion architectures exa m - ined were CheXNet, which wa s combined with feature pyr- amid networ ks to classify multi -label Chest X -rays [42] , and explained the benefits of combining several 14 CJNST 2025, Vol. 2, Iss ue 1, pp. 10 – 28 architectural structures and designs. These hybrid designs illustrate how to trade off diagnostic performance for com- putational efficiency, but the complexity may be impracti- cal for clinical practice. 2.5. Interpretability and Uncertainty Quantifica- tion The concepts of interpretability and uncertainty qua nti- fication have increas ingly gained importance in recent scholarship as predictive models are increasingly used in clinical settings. A graph-based framework f or modeling spatial-semantic relationships between anatomical regions in the MIMIC- CXR da ta set was illustrated, achieving a mean ar ea under the receiver operating characteristic curve (AUC) of 86. 09% and providing specific uncertainty esti- mates [43]. This is a significant change from accuracy-only optimization; however, such models usually have higher computational costs and requir e mor e detailed implementa- tion. 2.6. Disease-Specific Systems Specific disease diagnostic systems have shown high performance in well-defined pathological areas. A Mo- bileNet-based T uberculosis detection pipeline was created and had a range of AUC values between 95.1% and 97.5% [44]. A systematic review of 54 studies on deep learning in Tuberculosis screening was conducted, finding that current CNN models can achieve cumulative AUC scores of up to 99% on self-contained benchmark datasets . Though these specialized systems are good at diagnosing specific target pathologies, they are not as general as needed for multi-dis- ease scree ning [ 45]. 2.7. Research Gaps and Study Cont ri bution s These are key methodological gaps highl ighted by the current literature r eview. First, most studies evaluate a sin- gle or two architectures, which prevents them from making meaningful comparisons betwe en divergent design philosophies, e.g., clas sical convolutional networks and modern transformers, under the same experimental condi- tions. Second, training progr ams, preprocessing pipelines, and data-augmentation techniques differ significantly across r esearch, making it challenging to directly compare performance. Third, most studies use vastly imbalanced da- tasets where Normal sa mple s far outnumber pathological ones; this bias can overstate reported accuracy rate s as well as obscure poor performance on minority disease catego- ries. Fourth, the systema tic study of the trade-offs among model complexity, computational requirements, and diag- nostic fidelity remains limited. Moreover, it is con ceptually relevant to the deployment choices f or heterogeneous healthcare infr astructures. All these shortcomings under- score the need for regulated, comparative experiments with standardized procedures. To overcome these drawbacks, we have conducted a systematic comparison of se ven modern neural arc hitecture designs that represent different design philosophies. The se- lected architectures are dense connectivity patterns of DenseNe t121 and DenseNet201, residual learning of Res- Net50, computational learning of MobileNetV2, optimized scaling of EfficientNet V2M, moder n convolutional learn- ing of ConvNeXt Tiny, and attention-based learning of Vi- sion T ransformer ViT-B /16. Each of the seven models was trained under strictly standardized conditions, using the same preprocessing algorithms, augmentation policies, and optimization hyperparameters on a highly balanced dataset comprising five disease subtypes: Cardiomegaly, COVID - 19, Normal, Pneumonia, and Tuberculosis. This experi- mental design enables a straightforward assessment of the architectural virtues a nd shortcomings, as well as t he meas- urement of perfo rmance-efficiency trade- off s relevant to clinical implementation across a wide var iety of resource conditions. Table 1 presents the main features of rece nt re- search in the field and shows how our multi-architectural comparison, implemented using the same pr otoc ols, di- rectly addresses the gaps identified in the study. Table 1: Co mpar ison o f Recent Deep L earning Approac hes for Chest X-ray C lassi fication Ref Year Appro ach Main Gap Addre ssed Disease Cl asse s Best Rep orted Metric V alue (%) [26] 2018 DenseNet- 121, m ulti-label c lassifica- tion Baseli ne architect ural evaluatio n 14 th oracic disea ses AUC 84- 88 [45] 2022 Systemati c review of TB s ystems Single disease f ocus TB onl y Up to 99 [41] 2023 Lightwe ight 6-layer CNN Single arc hitecture only 6 classes Acc 80 [35] 2023 Unified multi-disea se CN N Single arc hitecture only 4 classes Acc 98. 72 [37] 2023 CNN-L STM hybri d architect ure Limited ar chitectural di- versity Multiple cla sses Acc 98. 5 [43] 2023 Gr aph co nvolutional networ k High com plexity , lim- ited sca lability 14 classe s AUC 86 .09 [34] 2024 VGG 16, Incepti on, cust om CNN Limited c omparis on (3 models only) 3 classes Acc 97 [40] 2024 Ensemble with ha ndcrafte d features Not e nd - to -e nd deep learnin g 3 classes Acc 98 [38] 2024 Knowled ge distil lation Single arc hitecture type only 4 classes Acc 96. 08 [42] 2024 CheXNet with a feat ure pyram id net- work Single fu sion arc hitec- ture onl y Multila bel AUC 84.6, Acc uracy 91. 4 15 CJNST 2025, Vol. 2, Iss ue 1, pp. 10 – 28 [44] 2024 MobileNe t for T uberculosi s Single disease f ocus TB vs N ormal AUC 95 .1-97.5 3. Materials and Methods 3.1. Dataset Description A five-class Chest X-ray dataset was constructed using three publi cly available repositories, including Normal cases and f our thoracic pathologies: Pneumonia, Tubercu- losis, COVID-19, and Cardiomegaly. Fr om the NIH Clini- cal Center Chest X-ray dataset, which provides multi-label annotations, only frontal-view images annotated with a sin- gle target label (Nor mal, Pneumonia, or Cardiomegaly) were selected. Images containing multiple f indings were ex- cluded to ensure label consistenc y for single -label multi- class classification. COVID-19 images were obtained from the C OVID-19 R adiography Database, and Tuberculosis images were sourced from the Tuberculosis Ches t X-ray Database to complete the r emaining classes. Owing to dif - ferences in dataset size and class pr evalence among the re- positories, the resulting merged dataset exhibited class im- balance, as detailed in Table 2. • NIH Clinical Center Chest X-ray Dataset [16]T his large dataset of frontal-view Ches t X-ray images of 30,805 unique patients (112,120 photos) included images classi- fied as Cardiomegaly, Normal, and Pneumonia. • COVID-19 Radiography Database [ 17]The curated col- lection of Covid-19 Chest X-rays used to obtain th e im- ages was Covid-19 radiographs, which were a nnotated to identify Covid-19. • Tuberculosis Chest X-ray Database [18]This specific da- tabase was used to access cases of Tuberculosis through a routine and T B-positive chest radiograph from various institutions. This combination of heterogeneous sources created an initial dataset that had high class imbalanc e, as discussed in Table 2. Table 2: Original dataset class distribution before balancing Class Name Number of Images Resources Normal 60,361 [16] Pneumonia 1,390 [16] Cardiomegaly 2,735 [16] COVID- 19 3,616 [17] Tuberculosis 2,494 [18] 3.2. Data P reproces sing Steps The dataset underwent several preparatory steps to im- prove its quality, balance, and support machine learning. These steps are described in the following sections: 3.2.1. Random Undersampling of the Majority Class: To mitigate the severe class imbalance pr esent in the original dataset (60,361 Normal images versus 1,390 Pneu- monia images), r andom undersampling was applied to the Normal class. P rior studies on CNN tr aining have shown that extreme class imbalance can bias the learned decision boundaries toward majority class es, resulting in inflated overall accuracy but poor sensitivity to minority categories [21], [46]. To explicitly counter thi s effect, random undersampling without r eplacement was applied to the Nor mal class, re- ducing it to 3,616 im ages to match the size of the largest minority class ( COVID-19). This choice was made to en- sure a balanced optimization landscape across all classes , rather than allowing the model to overfit redundant Normal samples. Notably, the reduced sub -se t size r emains statisti- cally adequate for transfer learning, where pretrained f ea- ture extractors substantially reduce the dependence on large class-s pe cific sample sizes. This balancing strategy promotes a more equitable learning process, reduces r edundancy in the majority-class samples, and improves perf ormance metrics such as recall and F 1-sc ore across all disease categorie s, thereby enhanc- ing the clinical reliability of the model. 3.2.2. Oversampling via Controlled Data Augmentation To a ddress class im balance among the minor ity catego- ries (Pneumonia, Tuberculosis, COVID-19, and Cardio- megaly), a controlled oversampling strategy using data a ug- mentation was employed. All original images in each mi- nority class (n ≤ 3,616) were preserved to ensure genuine pathological characteristics were retained and not distorted by synthetic data. An augmentation pipeline was implemented using Torchvision T ransforms, incorporating random horizontal flipping (probability = 0.5), random rotations within ±15°, and brightness and contrast adjustment s limited to ±10% [44]. These transformations were constrained to ref lect var- iations commonly observed in real-world clinical settings. Augmentation was applied ite ratively until each m inor- ity class reached 3,616 images, aligning the class distribu- tions with the undersampled Normal class. This low-inten- sity augmentation strategy was selected to enhance minor - ity -class r epresentation while mini mizing the r isk of over- fitting to artificially generated patterns. By maintaining a high proportion of or iginal images and limiting transfor- mation magnitude, the augmented samples preserved clini- cal plausibility and diagnos tic relevance, as illustrated in Figure 1. 16 CJNST 2025, Vol. 2, Iss ue 1, pp. 10 – 28 Figure 1: Oversampling strategy using controlled data augmen- tation applied to minority classes. Table 3 illustrates the distribution of our Chest X-ray dataset before and after balancing. First, the class balance was extreme, with the Normal class having a much larger sample size than the other groups. To obtain a balanced da- taset suitable for machine learn ing, we used random under- sampling to equalize the Normal class with the largest mi- nority class, and systematic controll ed augmentati on to in- crease repr esentation of underrepresented class e s. Conse- quently, all disease classes now have an equal n umber of samples, providing a fairer and mor e valid basis for futur e model development and testing. Table 3: Chest X-ray dataset class dist ributio n b efore an d after balancing. Class Name Before Balancing After Balancing Normal 60361 3616 Pneumonia 1390 3616 Covid- 19 3616 3616 Tuberculosis 2494 3616 Cardiomegaly 2735 3616 3.2.3. Dataset P artitioning and Patient Isolation To prevent data leakage and ensure unbiased eva lua- tion, a strict patient-level data splitting strategy was adopted. Unique pa tient identifiers we re extracted from im- age filenames, yielding 18,080 images from 6, 978 patients (≈2.6 images per p atient ). The dataset was par titioned a t the patient level into 70% for Training, 10% for Validation, and 20% for Testing, ensuring complete patient isolation across splits (train ∩ test = , validation ∩ test = ). This resulted in 5,582 patients for training and validat ion and 1,396 pa- tients for testing, corresponding to 14, 563 and 3,517 im- ages, respectively. Following class balancing (3,616 images per class ), the same pa tient-level split was pre served. The trainin g set was used to learn model parameters, the validation set for hy- perparameter tuning and overfitting asses sment, and the test set — fully isolated from model development — fo r final per- formance evaluation. This protocol reflects real clinical de- ployment, where models are applied to previously unseen patients, and pr ovides a reliable estimate of generalization performance (Table 4 , Figure 2). Rather than k-fold cross-validation, we adopted a strict patient-level dataset partitioning strategy. The dataset was divided into 70% Training, 10% Validation, and 20% T est- ing at the patient level, with complete patient isolation in the test set (train ∩ test = ). T his design prevents patient- level data leakage and reflects real clinical deployment, where models encounter pr eviously unseen patients . The dataset size ( 18,080 images from 6,978 patients) provides sufficient data for stable performance estima tion under this split. Table 4: Data set Split Sta tistics with Patient-Level Isolation Split Images % of Total Unique Patients % of Patients Training Valida- tion 14,563 80 5582 80 Testing 3,517 20 1,396 20 Total 18,080 100 6,978 100 Having completed the class-balancing pr ocess, in which each disease ca tegory had a total o f 3,616 images, the dataset was further split into three subs ets: Training (≈ 70%), Validation (≈ 10%), and Testing (≈ 20%), as shown in T able 4. This separation adheres to existing deep-learning standards for medical imaging, ensuring that suffic ient data has be en collected to optimize the model while maintaining a separate set for independent evaluation [47], [48]. Learning the network parameters and capturing dis- ease-specific visual patterns was done us ing the training set, which includes most of the data. T he validation set was used during model development to optimize hyperparameters, assess convergence, and evaluate overfitting by applying the model to unseen data. T he test s et wa s not used for train- ing and wa s only eva luated a t the end of the model, yielding a reasonable estimate of generalization performance [49]. Figure 2: Dat aset split distribution using a 70% Training , 10% Validation, and 20% Testing partition at the patient leve l. Charmo Journal of Natural Sciences and Technologies (CJNST) 10 CJNST 2025, Vol . 2 , I ssue 1, pp. 1 0 – 28 https://cjnst.chu.edu.iq/ Figure 2 shows that the 70:10:20 split is a viable bal- ance between learning efficiency and evaluation r eliability. The larger the tr aining part, the more robust the optimiza- tion; the more time is allocated to validation a nd tes ting, the lower the c omputational cos t, and the less information lea k- age betwe en the subsets. Als o, stratified sampling wa s used to maintain equal representation of each class across sub- sets, a necess ary measure to avoid bias in multi-class medi- cal data [50]. 3.3. Comparative Framework Overview This paper presents a controlled comparative stu dy of seven deep learning networ ks for classifying Chest X -rays into multiple diseases . We modified the original CheXNet system to a single-label classification paradigm rather than a multi-labe l one, ena bling us to make specific diag noses of five diseases: Cardiomegaly, COVID-19, No rmal, Pneumo- nia, a nd Tuberculosis. All models were tr ained and assess e d under the same conditions to provide a f air comparison using a single preprocessing pipeline, a standardized train- ing regime, and standard evaluation measures. Sev en state- of-the-art architectures were compared, which are of vari- ous methods of extracting image features: 3.3.1. Model P ipeline The algorithm will be divided into collecting Chest X - ray data from the public, equalizing across five disease groups, and splitting the data into tr aining and test subse ts. Several deep learning models are then fine-tuned and tested using the same steps, and each model's pe rfor mance is eva l- uated against key metrics to compare its ability to detect chest diseases. Fur thermore, the total workflow (shown in Figure 3) c onsists of a training pipeline that depicts the ite r- ative optimization process and a testing pipeline that evalu- ates the models' performance using multi-crop inference , enabling complete, consistent evaluation. Charmo Journal of Natural Sciences and Technologies (CJNST) 10 CJNST 2025, Vol . 2 , I ssue 1, pp. 1 0 – 28 https://cjnst.chu.edu.iq/ Figure 3: Complete training and testing pipeline for mul ti -disease ch est X -ray classification 3.3.2. Modified CheXNet-Based Backbone Architecture The proposed architecture is derived f rom the or iginal CheXNet f ramework and adapted to support single-label, five-class Chest X -ray classification, as illustrated in Figure 4. While CheXNet was ini tially designed as a m ulti -label classification model, we modified its architecture to operate in a unified single-label setting suitable f or comparative evaluation across different backbones. A standardized pr eprocessing pipeline is applied t o all input images, after which f eatures are extr acted using one of seven backbone networks: DenseNe t121, DenseNet201, EfficientNetV2-M, Mobile NetV2, Res Net50, ConvNeXt- Tiny, or ViT-B/16. In each case, the original CheXN et c las- sification head is replaced with a task-specific fully con- nected layer producing five logits corresponding to the tar- get disease categories . During inference, TenCrop evaluation is employed, and the predicted pr obabilities across crops ar e averag ed to en- hance prediction stability and r obustness . This modified CheXNet- b ased framework allows all backbone architec- tures to be evaluated under identi cal tr aining and inf erence conditions, ensuring a fair and clinically relevant compari- son. Charmo Journal of Natural Sciences and Technologies (CJNST) 10 CJNST 2025, Vol . 2 , I ssue 1, pp. 1 0 – 28 https://cjnst.chu.edu.iq/ Figure 4: Proposed CheXNet-b ased backbone rep lacement framework for five -class chest X -ray classification. 3.3.3. DenseNet Convolutional Networks • DenseNet121 : The original CheXN et backbone [12] , which has 121 layers with dense connectivity patterns in which each layer takes in feature maps of all the previous layers [51] . Th is architec ture is the one we compare against. • DenseNet201 : DenseNet201 is a more int ensive version of DenseNet featuring 201 layers, which yet again has more effective feature extraction ability due to the addi- tion of mor e dense blocks, and retains the same connec- tivity pattern as DenseNet121 [52]. 3.3.4. EfficientNet and MobileNet Architectures • EfficientNetV2-M: A medium-scale Ef ficientNet family model that uses compound scaling to trade off network depth, width, and resolution [28]. The new system, Eff i- cientNetV2, proposes training -awa re neural architecture search and progressive learning, which impr ove training efficiency and accuracy over prior methods [ 53]. • MobileNetV2: A lean Mobile and resource -constrained architecture. It employs inverted r esidual blocks , which are linear bottlenec ks, and depthwis e separable convolu- tions to reduce c omputational time while achieving com- petitive accuracy [54]. 3.3.5. Residual Networks • ResNet50: A 50-laye r residual network that em ploys skip connections to address the vanishing gr adient prob- lem in deep networks. ResNe t-50 is a well-performing architecture widely used as a baseline in a wide r a nge of computer vision tasks [10]. 3.3.6. Modern CNN and Transformer Architectures • ConvNeXt- Tiny: A f ully convolutional network that is modernized and uses the design ideas of Vision T rans- formers, with the efficiency of CNNs [ 30]. Conv NeXt employs larger kernel sizes, inverted bottleneck struc- tures, and fewer activation functions, achieving T rans- former-competitive performance with standard convolu- tional operations. • ViT-B/16: Vision tr ansformer with base configuration, which splits input images into 16x16 patches an d pro- cess e s them with self-attention mechanisms [31] . ViT is a paradigm s hift in the approach to pu re convolutio n, us- ing attention-based f eature extraction to model global context at the first layer. 3.4. Model Adapt ation and Configuration All architectures were fine-tuned for our five -clas s Chest X-ray classification task, us ing models pre-trained on ImageNet-1K. Tr ansfer learning from ImageNet has been shown to substantially improve performance on medical im- aging tasks, even with limited l abeled data. Each model was customized by modifying its classifier to output predictions for the five disease categories: • DenseNe t121/201: The original single fully connected layer was replaced with nn.Linear(in_features, 5). • EfficientNetV2-M: The classifier head was recon- structed as nn. Sequential(nn.Dropout(p=0. 0), nn.Lin- ear(in_features, 5)). • MobileNetV2: The class ifier retained its dropout regu- larization: nn .Sequential(nn.Dropout(p=0.2), n n.Lin- ear(in_features, 5)). • ResNe t50: The f inal fully connected layer (fc) was re- placed with nn.Linear(2048, 5). • ConvNeXt-Tiny: The thr ee-layer classifier head was adapted with the final li near layer modified to output f ive classes. • ViT-B/16: T he tr ansformer head was modified to nn.Lin- ear(768, 5), converting patch-level r epresentation s into disease predictions. All models were implemented using PyTorch's torch- vision.models libr ary with official pr e-trained weights (IMAGENET1K_V1) to leverage transfer learning. M odels were parallelized across mult iple GPUs us ing torch.nn.DataParallel to accelerate training and infer ence. Each architecture wa s trained separately following the same dataset and training procedure. 3.4.1. Hyperparameters and Training Configu ration The model was tr ained using the Adam optimizer with the configuration summarized in Table 5. Table 5 : Summary of M od el Training Parame ters Component Description Loss Function CrossEntropyLoss for single-label classification Optimizer Adam optimizer Adam Parameters β₁ = 0.9, β₂ = 0.999, ε = 1e -8 Learning Rate 1e -4 (fixed throughout training) 20 CJNST 2025, Vol. 2, Iss ue 1, pp. 10 – 28 Weight Decay 1e -5 (L2 regularization) Batch Size 128 ( training ), 128 ( testing) Epochs 50 Early Stopping Criterion Best model selected based on the highest vali- dation AUROC; ties resolved using macro -av- eraged F1 -score, then acc uracy . Adam optimizer was selected f or its adaptive learning rate and its e ffectiveness in classifying medical images . The fixed learning rate is 1e-4, chose n according to standard practice in transfer learning scenarios when pre-trained weights must be fine-tuned [47], [55]. 3.4.2. Data Loading and Preproce ssing Configuration Table 6 Data loader and preprocess ing pipeline hy- perparameters. Table 6: Data loader and preprocessing pipeline hyperp arame- ters. Component Description Number of Workers 8 parallel processes for data loading Pin Memory Enabled for faster GPU transfer [56] Persistent Workers Enabled to maintain worker processes across epochs Training Shuf- fle Enabled to prevent ordering bias [57 ] Valida- tion/Test Shuffle Disabled to ensure reproducible evaluation [50] 3.4.3. Evaluation Metrics and Analysis Model perfor mance was evaluated using comprehe n- sive metrics computed in a one-vs- rest ( OvR) fr amework for each disease class [58]: Per-class metrics: • Accuracy measures the proportion of correctly pre dicted images out of all predictions [59], and calculated as: (1) Where: TP = True Positives TN = True Negatives FP = False Positives FN = False Negatives • Precision is used to determine how accurately a medical image classification model predicts the actual positive image in a ll the photos that the model predicts to be pos - itive. I t indicates the pr oportion of correct predicti ons of the model [60]. (2) • Recall (Sensitivity) in medical image classification is used to determine the percentage of real positive cases (diseased images) that the model can detect prope rly. I t demonstrates the extent to which the model explains all the actual cases of the condition[ 61]. (3) • The harmonic mean of precision and r ecall is the F1 - Score in medical image classification, which gives one metric that balances the other two metrics. It can partic- ularly be handy in case of imbalanced class es, since it punishes extreme values of either pr ecision or recall [59]. (4) Aggregate metrics: • Macro-averaged accuracy, precis ion, recall, and F1 - score: Unweighted mean across all five classes, treating each diseas e equally r egardless of sample size [62] . 3.5. Implementat ion Details Models were trained and tested on the setup in Table 7 using Google Colab GPUs and PyTor ch, with consistent splits, pr eprocess ing, and hyperparameters. Performance metrics and best model checkpoints w ere logged to ensure reproducibility and enable fair comparison in multi-disease Chest X-ray classification. Table 7: Co mputa tional setup, data handling, and model man- agement details. Category Details Software Environment Framework: PyTorch 2.x with torchvision li- brary Development platform: Google Colab with GPU acceleration CUDA e nabled , cudnn.be nch mark=True Hardware Specifica- tions Google Colab GPU instances (NVIDIA Tesla T4/V100) Batch processing parallelized via DataParallel. Reproduci- bility Measures Data split: 70% train, 10% validation, 20% test. Identical splits across all models Standardized preprocessing & augmentation Fixed hyperp arameters Performance Tracking Per -epoch training time recorded (seconds) Cumulative training time tracked Inference time measured for the complete test set All ti ming da ta are sav ed in CSV format. Model Checkpoint- ing Naming: {backbone}-AccPrecRecF1- ConfMat- CE -SingleLabel_2026.pth.tar Contains: weights, best validation accu- racy/F1, epoch, timing, class details This methodologi cal approach has ensured that the seven architectures are tested using pure independent tests, 21 CJNST 2025, Vol. 2, Iss ue 1, pp. 10 – 28 enabling fair and reasonable perfor mance comparisons for multi-disease Ches t X -ray classification. 4. Results and Discuss io ns 4.1. Results This section presents an in -depth comparison of seven state- of -the-art deep learning architectures for the classifi- cation of various diseases in Chest X -rays. It was assessed on a multi-source, equal-weight datas et, and all models were subjected to standardized experimental proc edures to ensure fair comparisons. The training and validation datasets contained 14,563 s amples, and the test dat aset con- tained 3,517 samples across five disease types: Car diomeg- aly, COVID-19, Nor mal, Pneumonia, and T ube rculosis. Th ese architectures were tr ained under equal preproces sing pipelines, a common opt imization strategy, that is, the Adam optimizer with a learning rate of 0.0001, and equal evaluation metrics, and therefore, c onfounding var iables were reduced to a minim um, a nd a di rect architectu ral com- parison was possible. 4.1.1. Overall P erformance Analysis Table 8 s ummarizes the pe rfor mance of all s even archi- tectures on the validation datas et. All models achieved high accuracies above 94.9%, demons trating the ef fectiveness of the balanced multi-source dataset and the consistent training pipeline. The experimental framework's robustnes s is further supported by s trong per formance ac ross mu ltiple ar- chitectures, including traditional CNNs (ResNet50, Dense- Net), EfficientNet models ( MobileNetV2, Ef ficientNetV2- M), moder n CNNs (ConvNeXt-Tiny), and vision trans- formers ( ViT-B /16 ). Table 8 : Overa ll Performance Metrics on Va lidation Dataset Model Parameters (Million) Valida tion. Accuracy (%) Valida tion. Precision (%) Valida tion. Recall (%) Valida tion. F1 -Sco re (%) Valida tion. AUROC (%) Epochs Traini ng Time ConvNeXt-Tiny 27.82 96.25 90.28 89.95 90.54 98.64 50 1h 43m DenseNet121 6.96 95.92 90.07 89.84 89.78 98.43 50 1h 36m DenseNet201 18.32 95.89 89.94 89.78 89.61 98.49 50 2h 48m ResNet50 23.52 95.57 89.20 89.23 88.88 98.33 50 1h 11m EfficientNetV2-M 52.86 95.13 88.26 88.20 88.04 97.98 50 2h 52m ViT-B/16 85.80 94.95 88.70 87.25 87.58 98.06 50 2h 49m MobileNetV2 3.50 94.91 86.90 87.20 86.81 96.96 50 48m ConvNeXt- Tiny achieved the highest validation perfor- mance, with 96.25% accuracy, 90.54% F1-score, and 98.64% AUROC , thanks to a mode rnized convolutional de- sign that included depthwise convolutions, LayerNorm, GELU activations, and inverted bottlenecks while preserv- ing CNN efficiency. DenseNet121 and DenseNet201 also performed well (95. 92% and 95.89% accurac y, respec - tively), demonstrating the need for dense connections for feature r euse in medical imaging. MobileNetV2, with the fewest parameters (3.5 million) and the shortest training time (48 minutes), achieved 94. 91% accuracy, making it suitable for resource-constrained deployment. Despite hav- ing the most parameters ( 85.8M) and the longest training time, ViT-B/16's 94. 95% accuracy did not outperform top CNN models, consistent with the literature, which shows that tr ansformers r equire larger datasets or extensive do- main-spe cific pretraining to match CNN perf ormance in medical imaging. Additionally, as demonstrated in Table 9 . The tes t s et e valuation revea ls that all architec- tures generalize well, with accuracies exceeding 90%. Con- vNeXt-Tiny remains the top performer with 92.31% accu- racy, 81.34% F 1-score, and 95.70% AUROC. The valida- tion- to -test gap is moderate (~3.94%), indicating su bstantial generalization. Res-Net50, ViT-B/16, and DenseNet ver - sions all scored we ll (91.47 -92.00% accuracy), whereas Ef - ficientNetV2-M and MobileNetV2 perfor med somewhat lower ( 90.42-90.53%) but with shorter inference times, in- dicating their potential for resource-constrained settings. Overall, the slight 3-5% decline in accuracy across models indicates the usefulness of regularization by dropout, data augmentation, and early halting, which prevents overfitting and ensures reliable multi -disease Che st X-ray cat egoriza- tion. Table 9: Test Set Performance Evaluation Model Test Accuracy (%) Test Precision (%) Test Recall (%) Test F1 -Sco re (%) Test AUROC (%) Inference Time ConvNeXt-Tiny 92.31 81.97 81.19 81.34 95.70 2m 3s ResNet50 92.00 80.88 80.75 80.41 95.32 1m 37s ViT-B/16 91.87 80.53 79.38 79.57 95.28 2m 57s DenseNet121 91.71 80.34 80.17 79.74 95.06 1m 58s DenseNet201 91.47 79.33 79.05 78.76 95.19 2m 54s 22 CJNST 2025, Vol. 2, Iss ue 1, pp. 10 – 28 EfficientNetV2-M 90.53 78.64 77.89 76.83 94.58 3m 1s MobileNetV2 90.42 76.73 75.85 75.50 94.10 1m 20s 4.1.2. Comput ational Efficiency Analysis Table 10 Computational e fficiency comparison o f all evaluated architectures, including the number of parame- ters, training and inference ti mes, and an efficienc y indica- tor, AUROC per parameter. This metr ic (AUROC per million pa rameters, ×10⁶) provides a normalized meas ure of performance relative to model size, enabling a more in- formative comparis on of a rchitectural ef ficiency across net- work architectures. Table 10 : Computational efficiency comparison of all e valuated architectures. Model Parameters (Million) Traini ng Time Inference Time AUROC/Param (×10 -6 %) MobileNetV2 3.50 48m 18s 1m 20s 27.70 DenseNet121 6.96 1h 35m 39s 1m 58s 14.14 ResNet50 23.52 1h 10m 51s 1m 37s 4.18 DenseNet201 18.32 2h 47m 30s 2m 54s 5.38 ConvNeXt-Tiny 27.82 1h 43m 44s 2m 3s 3.55 EfficientNetV2-M 52.86 2h 51m 57s 3m 1s 1.85 ViT-B/16 85.80 2h 49m 19s 2m 57s 1.14 The most c omputationally efficient model wa s M o- bileNetV2, with an AUROC- to -pa rameter ratio of 27.70% × 10⁻⁶, nearly twice that of the s econd -most efficient model, DenseNe t121 (14.14% × 10⁻⁶). MobileNetV2 has the lowest inference time (1 min 20s on the comp lete set of tes ts) and a short training time ( 48 min), making it the best architec- ture to r un in a resource-constrained system, e.g. , in a mo- bile diagnostic application, a point -of-care device in a rural health facility, or where inference speed is needed. It is worth mentioning that an increased number of pa- rameters does not always correspond to higher perf or- mance. Ef ficientNetV2- M (52. 86 M parameters) and ViT - B/16 (85. 80 M) were outperformed by much smalle r models like ConvNeXt -Tiny ( 27.82 M) and DenseNet121 ( 6.96 M). This observation shows that inductive bias and architectural design decisions tailored to medical i mag- ing are more crucial than raw model capacity. 4.1.3. Disease-Specific Classification P erformance Table 11 gives the per-class perfor mance metrics for each disea se category, showing significant variabili ty across pathological conditions. This discussion highlights the challenges of categorizing certain thoracic dis orders and identifies diseas e categories that may require targeted im- provements in models. Table 11 : Per -class performance analysis across disease categories . Disease cate- gory Average AUROC (%) Accuracy Range (%) Best Performing Model Classification Difficulty Tuberculosis ≈100 99.78 – 100 ConvNeXt-Tiny Very Low COVID- 19 ≈99.97 98.90 – 99.78 DenseNet121/201 Low Pneumonia ≈96.50 93.01 – 95.08 DenseNet201 Moderate Cardiomegaly ≈96.20 92.35 – 93.48 DenseNet201 Moderate Normal ≈95.20 90.61 – 92.21 ConvNeXt-Tiny Moderate-High Tuberculosis and COVID-19 showed excellent classifi- cation perf ormance across all architectures (AUROC ≥ 99.97%), with most models reaching accuracies ab ove 99%. This near-perfect performance can be attributed to the dis- tinct radiographic manifestations of these diseases: Tuber- culosis typically presents with upper lobe cavitary lesions, fibronodular inf iltrates, and pleural thickening , whereas COVID-19 exhibits characteristic peripheral and b asal pre- dominant ground-glass opacities with crazy-paving patterns and consolidation. These pathognomonic f eatures produce strong dis criminative signals , which deep learni ng algo- rithms can reliably discern. In contrast, the Normal class posed the greatest classi- fication challenge, with accuracies r anging from 90.61% to 92.21% across architectures. This pr oblem is main ly due to misclass ification between the Normal class and the Cardio- megaly or Pneumonia classes , as evidenced by confusion matrix analysis. The subjective nature of cardiac silhouette assessment, combined with the wide r ange of cardiothoracic ratios, makes it cha llenging to dis criminate be tween normal 23 CJNST 2025, Vol. 2, Iss ue 1, pp. 10 – 28 chest radiographs and bor derline C ardiomegaly patients. Similarly, separating Normal characteristics fr om early- stage or mild Pneumonia requires detecting subtle infiltra- tive changes that may overlap with normal structural fea- tures, such as vascular markings or minor atelectasis. Figure 5 shows constant high perf ormance for Tuber- culosis and COVID-19 across all models , but significant in- ter-model heterogene ity for the Normal, Cardiome galy, and Pneumonia classes . Figure 5: Per -class cl assificati on accuracy acr oss all eva luated architectures. 4.1.4. Training Dynam ics and Convergence Analysis Analysis of training convergence characteristics pro- vides insights into model stability and learning efficiency. Table 12 shows convergence parameters, such as the epoch at which optimal validation performanc e was achieved and the convergence rate (measured as the best epoch divided by the total number of training epochs). Table 12 : Training convergence characteristics of all ev aluated archit ectures. Model Best Epoch Total Ep ochs Convergence Rate (%) Stability Assessment DenseNet121 39 50 78 Stable, early convergence MobileNetV2 42 50 84 Stable, efficient learning ConvNeXt-Tiny 43 50 86 Highly stable EfficientNetV2-M 44 50 88 Stable, consistent improvement DenseNet201 45 50 90 Stable, gradual convergence ResNet50 46 50 92 Highly stable, late peak ViT-B/16 50 50 100 Slow c onverg ence, may be nefit from extended training CNN-based models, especially DenseNet121, Mo- bileNetV2, and ConvNeXt-Tiny, converged efficiently, achieving optimal perfor mance in 39 -43 epochs (78-86% of the total training time). This early convergence pro perty im- plies eff icient learning dynamics and the effective utili za- tion o f convolutional architectures' inductive biase s for spa- tial pattern recognition in medical images. As shown in Figure 6, ViT-B/16, on the other hand, needed the whole 50-epoc h training period to reach optimal performance, indicating slower convergence. This finding is consistent with the known fact that transformer architec- tures generally require significantly larger datas ets or train- ing regimes to compensate for their lack of intrinsic spatial inductive biase s. Further training, as indicated by e poch 50, suggests that ViT- B/16 could benefit from additional time or more aggressive data a ugmentation, but it is unclear whether this would enable it to outperform CNN. Charmo Journal of Natural Sciences and Technologies (CJNST) 10 CJNST 2025, Vol . 2 , I ssue 1, pp. 1 0 – 28 https://cjnst.chu.edu.iq/ Figure 6: Training and validation accuracy curves illustrating convergence behavior acro ss all architectures. 4.1.5. Confusion Matrix Analysis Detailed error analysis using confusion matrices pr o- vides critical insights into specific mis classification pat- terns. Figure 7 depicts the confusion matrix for ConvNeXt- Tiny, the top-performing architecture based on the test da- taset. Figure 7: Confusion matrix for ConvNeXt -Tiny on the test dataset. The confusion matrix shows significant diagonal dom- inance, indicating great classification accuracy a cross all disease categories. The most common mistake is between Normal and Cardiomegaly (≈5 -7%), which is predicted, 25 CJNST 2025, Vol. 2, Iss ue 1, pp. 10 – 28 given the subjective and ongoing nature of cardiothoracic ratio measurement. A secondary misclassification occurs between Normal and Pneumonia (≈3 -5%), most likely due to the modes t or early-stage infiltrative patterns. COV ID -19 and Tuber culosis have low confusion rates (<1%), indicat- ing distinct radiographic features and the model's r eliable identification. 4.1.6. ROC Curve Anal ysis Receiver Operating Characteristic ( ROC) curves and their related Areas Under the Curve (AUC) values pr ovide a threshold-independent a ssessment of model discrimina- tive performance over all possible classification thresholds . Figure 8: ROC curves for all architectures across disease catego- ries. As shown in Figur e 8 ROC an alysis has remarkable dis- criminative performance across all models and disease clas- ses, with AUC values consistently greater than 94%. Con- vNeXt-Tiny had the gr eatest overall AUC (98.64%) , closely followed by DenseNet201 ( 98.49%) and Dens eNet121 (98.43%). The near-perfect ROC curves for Tuberculosis (AUC = 100%) and COVID- 19 (AUC ≈ 99.97%) across all architectures demonstrate almost total separability between these diseas e classes and all others, proving the models' de- pendability for detecting these major public health priori- ties. In the more difficult Normal, Cardiomegaly, and Pneu- monia class es, AUC values ranged from 95% to 97%, sug- gesting good discriminative capacity despite the increased difficulty, as evidenced by the accuracy metrics and confu- sion matrix analysis. The consistency of high AUC values across diverse architectures confirms that the observed per- formance levels r epresent the practical upper bound achiev- able with the current dataset, a nd that further i mprovements would most likely nec essitate e ither expande d training data, particularly for challenging class pairs, or the incorporation of additional clinical context beyond the chest radiograph. 4.1.7. Model Interpretabilit y via Grad- CAM Gradient-weighted Class Activation Mapping (Grad- CAM) was applied to the best-performing ConvNeXt- Tiny architecture to provide qualitative insights into model deci- sion-making processes and improve clinical interpretability. Grad-CAM creates visual explan ations by highlight ing the regions of the input image that most s trongly influe nced the model's forecast for each class. Figure 9. Figure 9: Grad-CAM visualization for ConvNeXt-Tiny across disease classes. Grad-CAM analysis demonstrated clinically consistent attention patterns in all illness groups. For P neumonia pa- tients, the model pr imarily f ocused on inf iltrative patterns in the lung parenchyma, particularly in the lower and pe- ripheral lung fields, where bacterial Pneumonia is mos t commonly seen. Cardiomegaly predictions showed sub- stantial activation along the cardiac silhouette bord ers, indi- cating that the model learned to evaluate heart size relative to thoracic dimens ions — the primary criterion used in clini- cal diagnostics. COVID-19 patients e xhibited attention patterns c en- tered in the peripheral and basal lung areas, which corre- lated with the nor mal distribution of ground-glass opacities and cons olidations found in COV ID-19 Pneumonia. Tuber- culosis predictions demonstrated pr eferential activation of the apical and upper lobes , which co rresponds to th e normal upper-lobe predominance of post-primary Tuberculosis. In Normal situations, attention was more uniformly dis tributed across the lung fields, with no focal areas, indicating the ab- sence of illness symptoms. These attention patterns close ly match established radi- ological diagnostic criteria, boosting tr ust in the mo del's de- cision-making process. However, there are many essential precautions to take. First, the interpretability analys is was restricted to a qualitative examination of a single architec- ture (ConvNeXt-Tiny) ac ross a subset of s ample cases. Sec- ond, no systematic validation by experienced radiologists was conducted to guarantee that the visible atten tion pat- terns corr espond to clinically significant features rather than spurious correlations or dataset artifacts. Third, Grad-CAM provides only approximate localization, potentially 26 CJNST 2025, Vol. 2, Iss ue 1, pp. 10 – 28 omitting f eatures that influence the model's decision, such as fine texture patterns or global image characteristics . While encouraging, these inter pretability findings should be viewed as preliminary insights that r equire additio nal clini- cal validation before deployment. 4.2. Discuss ion This study compares seven cutting-edg e deep lear ning models f or multi -dise ase Chest X -ray image classification utilizing a unified experimental framework. T he excellent validation and test rates of all models show that the sug- gested training process is effective, as are deep learning frameworks for automated thor acic disease diagnosis. Ar- chitectural alterations were identified as the princi pal cause of the performance discrepancy, even after accounting for identical preprocessing, opti mization, and asse ssme nt set- tings, enabling a credible and impartial comparative analy- sis. ConvNeXt- Tiny off ers an optimal balance of accuracy and ef ficiency, suggesting that a modernized convolutional architecture driven by transformer-inspired design princi- ples provides considerable benefits to medical image pro- cess ing. The ability to recognize not just local dis eased pat- terns but also mor e general anatomy is useful for radio- graphic interpretation, as illness pr esentations vary in size and spatial distribution. DenseNe t models also performed well with f ewer parameters, demonstrating that dens e fea- ture reuse, along with robust g radient propagation, is a n op- timal design for learning discriminative medical pic ture rep- resentations. In contrast, the vision transformer' s perfor- mance falls short of it s potential, suggesting that, across specialized medical image tasks, domain-specifically pre- trained models incur considerably larger inductive biases and thus require larger datasets. Diseas e -specific performance demonstrates that all ar- chitectures reliably detect conditions with a chara cteristic radiographic appearance (e.g., Tuberculosis or C OVID-19), but Normal exams, Cardiomegaly, and Pneumonia are more challenging. Such challenges stem from inherent di agnostic ambiguity rather than a lgorithm failure, as borderline cardi- othoracic ratios and inaccurate initial infiltrative alterations are difficult to interpret even in well -es tablished clinical practice. The concentration of errors across clinically r e- lated class pairings demonstrates that performance can be enhanced further by incorporating loose clinical data or lon- gitudinal imaging rather than relying on single static radio- graphs. The efficiency study found that model s ize did not nec- essa rily yield better diagnostic perfor mance. Compact ar- chitectural solutions with competitive accuracy and signifi- cantly lower computing cost were identified, highlighting the importance of designing a rchitectures customized to medical imaging requirements rather than merely scaling parameters. This s tudy's practical implications include inte- grating r esource-e fficient models into clinical workflows, mobile diagnostics, and low-resource healthcare settings. The int erpretability asses sment demon strated that ana- tomically and clinically significant picture regions inf lu- enced model predictions, indicating the method's transpar- ency and, potentially, clinical reliability. Howe ver, interpretation validation is still in its early stages and re- quires extensive confirmation by professional radiologists before clinical translation. Finally, thi s study has limitations due to the use of sin- gle-label classification, a limi ted sample size, and data ob- tained from public sources with identical collection charac- teristics. Future studies should emphasize multi-label learn- ing, external validation across institutions, incorporation of clinical inf ormation, a nd ongoing examination to ensure generalizability and clinical usefulness. 5. Conclusions This study evaluated seven state-of-the- art deep lea rn- ing architectures for multi -dise ase classification of single - label Chest X-rays under consistent experimental condi- tions. A balanc ed dataset of 18,080 images s panning Cardi- omegaly, COVID-19, Normal, Pneumonia, and Tuberculo- sis, partitioned at the patient level, enabled fair comparison. ConvNeXt-Tiny achieved the highes t overall perfor- mance (92.31% test a ccuracy, AUROC 95.7%), de mon- strating the eff ectiveness of modernized convolutional ar- chitectures with t ransformer -inspired des ign elements. DenseNe t121 and DenseNet201 achieved competitive test accuracies ( 91.71% and 91.47%), reaffirming the utility of dense connectivity patterns. MobileNetV2 emerg ed as the most resource- efficient option (90.42% test accura cy, 3.5M parameters, 48-minute training time), suitable for mobile or point-of-care deployment. T uberculosis and C OVID-19 classifications were near - perfect ( AUROC ≥ 99. 97%), while Normal, Cardiomegaly, and P neumonia were mor e challenging due to overlapping r adiographic f eatures . These results suggest that modified CheXNet and re- lated architectures can provide clinically effective multi- disease X -ray classification across diverse computing envi- ronments. ConvNeXt-Tiny is recommended f or high-accu- racy settings, DenseNet121 for balanced perfor mance, and MobileNetV2 for resource-limited scenarios. Limitations include reliance on publicly available da- tasets, single-view radiographs, and qualitative interpreta- bility analyses. F uture work should focus on multi -center validation, integration of clinical metadata and temporal im- aging data, and uncertainty quantification to support safe clinical deployment of AI diagnostic systems. 6. References [1] World H ealth Org anization (or WHO), “Pn eumonia,” www.who.int. Accessed: Oct. 08, 2025. [Online]. Availa- ble: https://www.who.int/news-room/ fact-sheets/de- tail/Pneumonia [2] WHO, Glo bal Tuberculosis Repor t 2023. World Health Organization, 2023. [3] H. N akrani, E. Q. Shahra, S. Basurra, R. Mohammad, E. Vakaj, and W. A . Jab bar, “Ad vanced Diagnosis o f Cardi ac and Respiratory D iseases from Chest X -ray Imag ery Us- ing Deep Learn ing Ensembles,” Journal of Se nsor an d Ac- tuator Networks, vol . 14, no. 2, Apr. 20 25 , doi: 10.3390/jsan14020044. [4] M. H. A l-Shei kh, O. Al Dandan, A. S. Al -Shamayleh, H. A. J alab, and R. W. Ibrah im, “Multi -class deep learning architecture fo r classifying l ung diseases from Ch est X - 27 CJNST 2025, Vol. 2, Iss ue 1, pp. 10 – 28 ray an d CT i mages,” Sci. Rep., vol. 13, no. 1 , Dec. 2023, doi: 10.1038/s41598-023-46147- 3. [5] C. J. Kel ly, A. Karthikesalingam, M. Su leyman, G. Cor- rado, and D. King, “Key challenges for delivering clini cal impact w ith artificial int elligence,” BMC Med., v ol. 17, no. 1, p . 1 95, O ct. 2019, d oi: 10 .1186/s12916 -019-1426- 2. [6] Q. An , W. Chen, and W. Shao, “A Deep Co nvolutional Neural N etwork for Pn eumonia Det ection in X -ray Images with Attention Ensemble,” Diagnost ics , vol. 14, no. 4, Feb. 2024, doi: 10.3390/diagnostics14040390. [7] Z. Zhang , X. Zhan g, K. Ichiji, I. Bukovský , and N . Homma, “H ow intra -sou rce imbalanced datasets i mpact the performance of deep learning fo r C OV ID-19 d iagnosis using C hest X - ray images,” Sci. Rep., vo l. 13, no. 1, Dec. 2023, doi: 10.1038/s41598 -023- 45368- w. [8] E. J . Hwang et a l., “Development a nd Validation of a Deep Learning – Based A utomat ed Detection Algori thm for Maj or Thoracic D iseases on Chest Radiographs ,” JAMA N etw. Open, vol. 2 , no. 3 , p. e191095, Mar. 2 019, doi: 10.1001/jamanetworkopen.2019.1095. [9] G. D. D eepak and S. K . Bhat, “A mul ti -stage deep learning approach for comprehensive lung disease cl assificatio n from x - ray i mages,” Expert Syst. Appl., vol. 27 7, Jun. 2025, doi: 10.1016/j.eswa.2025.127220. [10] A . Est eva et al ., “Deep learning -enabled med ical com- puter vision ,” NPJ Digit. Med., vol. 4, n o. 1, p. 5 , Jan. 2021, doi: 10.1038/s41746 -020- 00376- 2. [11] S. A. A ula and T. A. Rashid, “Foxtsage vs. Adam: Revo- lution o r evolution in optimization?,” Cogn. Syst. Res., vol . 92, Sep. 2025 , doi: 1 0.1016/j .c ogsys.2025 .101373. [12] P. Raj purkar et al ., “Ch eXNet: Radiologist -Level Pneu- monia D etection on Chest X - rays with Deep Learning,” Dec. 2 017. [On line]. A vailable: [13] H . Iq bal, A. Kh an, N. Nep al, F. Khan , an d Y. K. Moon, “Deep Learning Appro aches for Chest Radiograph Inter- pretation: A Systematic Review,” Dec. 01, 2024, Multi- disciplinary D igital Publishing Institute (MDPI). d oi: 10.3390/electronics13234688. [14] C. Rand ieri, A. Perrotta, A. Puglisi, M. G razia Bocci , and C. Nap oli, “CNN -Based Framework for Classifyin g COVID-19, Pneumoni a, an d Normal Ch est X - rays,” Big Data and Cognitiv e Co mputi ng , vol. 9, no. 7, Ju l. 2 025, doi: 10.3390/bdcc9070186. [15] M. Salmi , D. Atif, D. Oliva, A. Abraham, a nd S. Ventura, “Handling imbalanced medical datasets: review o f a d ec- ade of res earch,” Artif. Intell. Rev ., v ol. 57 , no. 10 , O ct. 2024, doi: 10.1007/s10462 -024- 10884- 2. [16] X . W ang, Y . Peng, L. Lu, Z. Lu, M. Bag heri, and R. M. Summers, “Ch estX -Ray8: Hospital-Scale C hest X-ra y Database and Benchmarks on W eakly-Supervised Classi- fication and Local ization of Common T horax Diseases,” in 2017 IEEE Conferen ce on C omput er Vision a nd Pa tt er n Recognition (C VPR), 2 017, pp. 3462 – 3471. doi: 10.1109/CVPR.2017.369. [17] M. E. H. Chowdhury et al., “COVID -19 Radiography Da- tabase,” Kag gle. Accessed: O ct. 09, 2 025. [Online]. A vail- able: https://www.kaggle.com/datasets/taws ifu rrah- man/covid19-radiography-database [18] S. Jaeg er, S. Candemi r, S. Antani, Y .-X . J. Wang, P.-X. Lu, and G. Tho ma, “Tu berculosis ( TB) Chest X -ray Dat a- base – Shenzhen & Mon tgomery,” Mendeley Dat a. Ac- cessed: Oct. 0 9, 2 025. [Online]. A vailable: https://data.mendeley.com/datasets/8j2g3csprk/2 [19] L. Oakd en- Rayner, “E xploring Large -s cale Public Medi- cal Imag e D atasets,” Acad. Radiol ., vol. 2 7, no. 1 , pp. 106 – 112, 2020, doi: https://doi.org/10.1016/j.acra.2019.10.006. [20] S. Jaeger, S. Cand emir, S. Antani, Y. X. W áng, P. X . Lu, and G. Thoma, “T wo public C hest X -ray d atasets f or com- puter- aided screening of pulmonary diseases,” Qu ant. Im- aging Med. Surg ., vol. 4, no. 6 , pp. 475 – 477, 2014, doi: 10.3978/j.issn.2223 -4292.2014.1 1. 20. [21] M. Buda, A. Maki, and M. A. Mazurowski, “A systematic study of the cl ass imbalance problem i n convolutional neural networks,” Neural Netwo rks, vol. 106, pp. 2 49– 259 , 2018, doi: https://doi.org/10.1016/j.neunet.2018.07.011. [22] D . A. Abdull ah et al., “A nov el facial recognition tech - nique w ith focusing on masked faces ,” Ain Shams Engi- neering Journal, vol. 16, no. 5, p. 103350, Apr. 2025, doi: 10.1016/J.ASEJ.2025.103350. [23] J . R. Zech, M. A. Badgeley, M. Liu, A. B. Costa, J. J. Ti- tano, and E. K. Oermann, “Var iable generalization perfor- mance of a deep learning mod el to detect Pn eumonia in chest radi ographs: A cro ss- s ectional study,” PLoS Med., vol . 15, no. 11, p. e1002683, 201 8, doi: 10.1371/jour- nal.pmed.1002683. [24] N . Chaw la, K. Bowyer, L. Hall, and W. Kegelmeyer, “SMOTE: Synthetic Mi nority Over -sampling Tech- nique,” J. Artif. Intell. Res. (JAIR), vol. 16, pp. 321– 357, Jun . 2002, doi: 10 .1613/ja ir.9 53. [25] S. A. Aul a and T. A. Rashid, “FOX -TSA: N avigating Complex Search Sp aces and Su perior Performance in Benchmark and Real- World O ptimization Pro blems,” Ain Shams Engineering Journal, 2 024, doi: 10.1016/j.asej.2024.103185. [26] P. Rajpu rkar et al ., “Deep learning for ch est radi ograp h diagnosis: A retrosp ective comp arison of the CheXNeXt algorithm to practicing radiologists,” PL oS Med., vol. 15, no. 11, p. e1002 686, Nov. 2018, doi: 10.1371/jou r- nal.pmed.1002686. [27] I. M. Balt ruschat, H. Nickisch, M. Grass , T . K nopp, and A. Saal bach, “Comparison o f Deep Learning Approache s for Multi-Label Chest X - ray C lassi fication,” Sci. Rep. , vol . 9, no. 1, p. 6381 , Apr. 2019, d oi: 10.1038/s41598 - 019 -4 2294 - 8. [28] M. T an and Q . V. Le, “EfficientNe t: Rethinking Model Scaling fo r Convolutional Neural Networks,” Sep. 2020, [29] J . Rui z, C. Arb oleda, an d D . Grisales, “E fficientNet for COVID-19 de tection in Chest X- ray ima ges,” Applie d Sciences, vol. 1 1, no. 1 4, p. 6327, Jul. 2021, doi: 10.3390/app11146327. [30] Z. Liu , H . Mao, C. Y . W u, C. Feichtenhofer, T. D arrel l, and S. Xie, “ A ConvNet for the 2020s,” in Proceedings of the IEEE Co mputer Soc iety Con ference o n Comput er Vi- sion and Pattern Recognition , IEEE Co mputer Society, 2022, pp. 11966 – 11976. doi: 10.1109/CVPR52688.2022.01167. [31] A . Do sovitskiy et al., “A n Image is Wo rth 16x16 Words: Transformers for Image Rec ognition at Scale,” Jun. 2021. [32] F. Shamsh ad et al., “Transfo rmers in med ical imaging: A survey,” Med . Image A nal., vol . 88, p . 102802, Aug. 2023, doi: 10.1016/j.media.2023.102802. [33] C. Mats oukas, J. F. Has lum, M. Söderberg, an d K . Smi th, “Is it time to replace CNNs with transformers for medical images?,” arXiv preprint arXiv:2108.09038, Aug. 2021. 28 CJNST 2025, Vol. 2, Iss ue 1, pp. 10 – 28 [34] G. Mohan , M. M. Sub ashini, S. Balan , and S. Sin gh, “A multiclass deep l earning algorithm for healthy lung, Covid-19 a nd P neumonia d isease detection from Chest X - ray ima ges ,” D iscover Ar tificial Intel ligen ce, vol. 4, n o. 1, Dec. 2024, doi: 10.1007/s44163- 02 4-00110- x. [35] [3 5] M. S. Ahmed et al., “Join t Diagnosis of Pneu- monia, COVID-19, and Tuberculosis from Chest X -ra y Images: A D eep Learni ng Approach,” Diagnostics, vol. 13, no. 15 , A ug. 2023, doi: 10.3390/diagnostics13152562. [36] R. R. Nai r and T. Sin gh, “Exploring E nsemble Architec- tures for Lung X -Ray Multi-Class Image Classificatio n using CNN- LSTM,” in Procedia Computer Science, Els e- vier B.V ., 2025, pp. 852 – 861. doi: 10.1016/j.procs.2025.04.317. [37] R. Sh arma and M. K amble, “H ybrid Deep Learning Model for Multi-Class Chest X -ray Classification U sing CNN- LSTM,” J . Ambient I nt ell. Humaniz. Comput., vol . 14, no. 7, pp . 8 911 – 8925, Jul. 2 023, doi: 10.1007/s12652 -021- 03682- 7. [38] Md . M. Kabir, Md. F. Mridha, A. Rahman, M. A. Hamid, and Md. M. Monowar, “Detection o f COVID -19, Pn eu- monia, and Tuberculosis from radiographs u sing AI- driven knowledge disti ll ation,” H eliyon, v ol. 10, no. 5 , Mar. 2024, doi: 10.1016/j.heliyon.2024.e26801. [39] J . A. Qadir, S. K . Jameel, and J. Majidpour, “Covid -19 Detection and Overcome t he Scarcity of Chest X -ray Da- tasets Based on Transfer Learni ng an d GAN Model,” in Proceedings of th e International Conferen ce on Infor- mation and Communication Technology (ICICT) , 2021, pp. 104 – 109. doi: 10.1109/ICICT54344.2021.9952034. [40] S. U . Ami n, S. Taj, A . Hus sain, and S. Seo, “An au tomated Chest X -ray an alysis for COVID-19, Tuberculosis, and Pneumonia employing ensemble lear ning approach,” Bio- med. Sig nal Process. Co nt rol, vol. 8 7, Jan. 2024, doi: 10.1016/j.bspc.2023.105408. [41] C. -T . Yen and C.- Y . Ts ao, “Lightw eight convolutional neural network for Chest X- ray images classification, ” Sci. Rep ., v ol. 14, n o. 1 , p . 29759, Nov. 2024, d oi: 10.1038/s41598 -024-80826- z. [42] U . Hasanah e t al., “CheXNet a nd feature p yramid net- work: a fu sion deep learn ing arch itecture for mu ltilabel Chest X- ray c lini cal d iagnoses classification,” Intern a- tional Jou rnal of Cardiov ascular Imaging , v ol. 4 0, n o. 4, pp. 709 – 722, Apr. 2024 , d oi: 10.1007/s10554-023 -03039- x. [43] M. Zhang , X. Chen, Y. Yu, and P. Z hang, “Expert Uncer- tainty and Sev erity Aw are Chest X -ray Classification by Multi- Relationship Graph L earni ng,” arX iv preprint [44] C. F. Chen et al ., “A deep learning -based al gorithm fo r pul monary Tuberculosis d etection in chest radiography,” Sci. Rep., vol. 14, no. 1, Dec. 2024, doi: 10.1038/s41598 - 024 -6 5703 - z. [45] K . Sant osh, S. A llu, S. Rajaraman, and S. An tani, “Ad- vances in Deep Learning for Tub erculosis Scree ning using Chest X - rays: Th e Last 5 Years Review,” J . Med. Syst., vol . 46, no. 11, Nov. 2 022, doi: 10.1007/s10916 -022- 01870- 8. [46] S. A. Aul a an d T. A. Ras hid , “FOX -TSA hybrid al go- rithm: Advan cing for superior pr edictive accuracy i n tour- ism -dri ven multi- l ayer perceptron mo dels,” Systems and Soft Co mputing, v ol. 6, Dec. 20 24, doi: 10.1016/j.sasc.2024.200178. [47] A . Kri zhevsky, I. Sutskever, and G. E. H inton, “ImageNet classification w ith deep convolutional neural networks,” Commun . ACM, vol. 60, no. 6, pp. 84 – 90 , Jun. 2017, doi: 10.1145/3065386. [48] O . Ronneb erger, P. Fischer, an d T. Brox, “U -net: Convo- lutional networks for biomedical image segmentation,” in Lecture Notes i n Computer Sci ence (including subseries Lecture Notes in Artificial In telligence and Lecture Note s in Bioinformatics), Sp ringer Ve rlag, 2015 , pp . 234 – 241. doi: 10.1007/978-3-319-24574 -4_28. [49] Y . Xu and R. Goodacre, “On Splitting Trai ning and Vali- dation Set: A Comparative St udy of Cross -Validatio n, Bootst rap and Systematic Sam pling for E stimating the Generalization Performance of Supervised Learning,” J. Anal. Test., vol . 2, no. 3, p p. 249 – 262, Jul. 2018, doi: 10.1007/s41664 -018-0068- 2. [50] V . Singh , M. Pencina, A. J. Einst ein, J. X. Liang, D . S. Berman, an d P. Slomka, “Impact of t rain/test sample reg- imen on p erformance estimat e stability o f machin e learn- ing in cardiovascular imaging,” Sci. Rep., vol. 11 , no. 1 , Dec. 2021, doi: 10.1038/s41598-021 -9365 1- 5. [51] G. Huan g, Z. Liu, L. Van Der Maaten , an d K. Q. W ein- berger, “Densely connected convolutional n etworks,” in Proceedings - 30 th IEEE Conference on Computer Visio n and Pattern Recognition, CVPR 201 7, Institute of Electri- cal an d Electronics E ngineers Inc., No v. 2 017, pp . 2261 – 2269. doi: 10.1109/CVPR.2017.243. [52] O . Taher and K. Özacar, “MedCapsNet: A modified Densenet201 model integrated with capsule network fo r heel disease detection and classification,” Heliyon , vol. 10, no. 14, Jul. 2024, d oi: 10.1016/j.heliyon.2024.e3 4420. [53] M. Tan and Q. V Le, “Effici entNetV2: Smaller Models and Faster Training,” 2021. [Online]. Av aila ble: https://github.com/google/ [54] M. Sand ler, A. Howard, M. Zhu , A . Zhmoginov, and L. C. Chen, “MobileNetV2: Inverted Residuals and Linear Bot- tlenecks,” in Pro ceedings of t he IEEE Co mputer Society Conference on Com puter Vision an d Pattern Recognition, IEEE Computer So ciety, Dec. 2018, pp. 4510 – 4520 . doi: 10.1109/CVPR.2018.00474. [55] S. J. Pan and Q. Yan g, “A s urvey on transfer learning,” 2010. doi: 10.1109/TKDE.2009.191. [56] A . Paszke et al., “Advances in Neural Information Pro- cessing Sy stems 32 (N eurIPS 2019),” Dec. 20 19, pp. 8024 – 8035 . [Online]. Available: [57] J . Heat on, “Ian Good fellow, Yo shua Bengio, an d Aaron Courville: Deep learning,” Genet. Program. E volvable Mach., vol. 19, no. 1 – 2, pp. 305 – 307, Jun . 2018, doi: 10.1007/s10710 -017-9314- z. [58] J . Davis and M. Goadri ch, “The Rel ationship Between Precision- Recall and R OC Curv es,” 2006. [59] S. A. H icks et al ., “On evaluation met rics for medical ap- plications of artificial intel ligen ce,” Sc i. Rep., vol. 12, no. 1, Dec. 2022, doi: 10.1038/s41598-022 -0995 4- 8. [60] I. Salehin et al., “Real -Time Medical Image Classif ication with ML Framework and Dedicated CNN -LSTM Archi- tecture,” J. Sens., vol. 2023 , 2023, doi: 10.1155/2023/3717035. [61] S. K. Zhou, D. Rueckert , and G. Fichtinger, Han dbook of Medical Image Computing and Computer Assisted Inter- vention. Academic Press, 2019. [62] M. Grandini, E. Bagli, and G. Visani, “Metrics for Multi - Class Classification: an Overview,” Aug. 2020, [Online].
Original Paper
Loading high-quality paper...
Comments & Academic Discussion
Loading comments...
Leave a Comment